 ,, 汪侠,, 闫艺涵, 张颖南京大学地理与海洋科学学院,南京 210023
Spatio-temporal pattern and its influencing factors of children multidimensional poverty in China
CAI Peiru,, WANG Xia,, YAN Yihan, ZHANG YingSchool of Geography and Ocean Science, Nanjing University, Nanjing 210023, China通讯作者:
收稿日期:2020-08-18修回日期:2021-06-6
| 基金资助: |
Received:2020-08-18Revised:2021-06-6
| Fund supported: |
作者简介 About authors
蔡佩汝(1996-), 女, 浙江温州人, 硕士生, 研究方向为儿童贫困时空差异。E-mail:

摘要
关键词:
Abstract
Keywords:
PDF (4951KB)元数据多维度评价相关文章导出EndNote|Ris|Bibtex收藏本文
本文引用格式
蔡佩汝, 汪侠, 闫艺涵, 张颖. 中国儿童多维贫困时空格局变化及其影响因素. 地理学报, 2021, 76(10): 2551-2567 doi:10.11821/dlxb202110015
CAI Peiru, WANG Xia, YAN Yihan, ZHANG Ying.
1 引言
20世纪80年代,诺贝尔经济学奖获得者Sen提出权利贫困理论和能力贫困理论,认为贫困是一种能力的剥夺,成为多维贫困的重要理论基础[1]。随着多维贫困研究的不断深入,对儿童群体多维贫困的研究逐渐增多,有****认为儿童遭受的贫困与成人并不相同[2],儿童时期的贫困影响会随着时间推移持续存在[3]。此外,联合国开发署发布的2019年度《全球多维贫困指数(MPI)报告》(Global Multidimensional Poverty Index, 2019)指出,现阶段全球共有13亿人处于多维贫困状态,其中6.63亿为儿童,儿童相较成人处于更为严重的多维贫困状态,因此对儿童多维贫困进行研究,解决儿童贫困问题具有一定的重要性和必要性。目前国外对于儿童多维贫困的探讨,研究内容主要集中于儿童多维贫困维度、权重确定及测度[4,5,6]、特定背景下儿童群体的贫困状况[7,8,9,10,11]、儿童多维贫困对扶贫政策的影响[12]、收入贫困与儿童贫困的关系[13,14]等方面。在研究方法上,儿童多维贫困研究以定量分析为主,使用的方法有A-F(Alkire-Foster)法、MODA(Multiple Overlapping Deprivation Analysis)[15]、模糊集[16]、随机占优[17]等。其中A-F法自2007年Alkire和Foster提出以来逐渐成为测量多维贫困的重要方法[1],也是目前儿童多维贫困测度中被广泛应用的方法之一。Roelen等[18]较早利用A-F法对越南儿童2006年的多维贫困状况进行研究,随后Roche[19]基于1997—2007年的人口健康数据使用A-F法研究孟加拉儿童多维贫困的时间变化。
在国内,对儿童多维贫困的研究主要集中于儿童多维贫困测度、致贫因素分析及多维贫困影响分析。李晓明等[20]基于中国家庭追踪调查数据库(China Family Panel Studies, CFPS)测度了2012年这一单一年份的中国儿童多维贫困,并对致贫机理进行探讨;冯贺霞等[21]运用A-F方法,从生存、发展、健康、教育、参与5个维度,研究内蒙古、新疆、甘肃、广西、四川5个贫困情况较为突出省域的儿童多维贫困现状;吕文慧等[22]使用二元选择模型进行回归,分析父母缺位对农村留守儿童多维贫困的影响;宋扬等[23]运用中国健康与养老追踪调查(China Health and Retirement Longitudinal Study, CHARLS)的生命历程数据,分析了儿童时期多维贫困对后续人力资本积累、健康水平和劳动收入状况等方面的长期影响。
综上,国内外****对于儿童多维贫困的研究主要着眼于社会学视角,研究内容多集中于儿童多维贫困指数的测度,从地理学视角对儿童多维贫困的时空动态变化及其影响因素的探讨较少,对儿童多维贫困未来演变趋势进行预测的研究也需要加强。在研究方法方面,目前儿童多维贫困影响因素研究主要使用贫困指数分解、回归分析等方法[20, 24-25],不能充分揭示各影响因素对儿童多维贫困空间分异产生的作用。基于以上分析,本文从地理学视角出发,采用空间自相关、马尔科夫链等方法分析中国儿童多维贫困的时空变化及其演变趋势,并利用地理探测器探究儿童多维贫困空间分异的驱动因子及其交互作用。首先,本文从住房、照料、教育、健康、营养等维度构建中国儿童多维贫困评价指标体系,对2010—2016年中国儿童多维贫困进行测度,探究世界上最大的发展中国家——中国的儿童多维贫困时空变化及其城乡空间差异特征;其次,使用马尔科夫链对中国儿童多维贫困演变趋势进行预测;第三,采用地理探测器对儿童多维贫困的影响因素及其交互作用进行定量分析。研究结果可以为国家和地方政府制定儿童扶贫政策,解决区域间儿童发展不平衡的问题提供参考。
2 研究方法与数据来源
2.1 数据来源
研究数据主要来源于北京大学中国社会科学调查中心(Institute of Social Science Survey)的中国家庭追踪调查数据库(China Family Panel Studies, CFPS),调查对象包含被调查家庭中的全部成员,调查内容涉及社会、经济、人口、教育、健康等多个方面,调查范围覆盖中国25个省、市、自治区(不含香港、澳门、台湾以及新疆维吾尔自治区、西藏自治区、青海省、内蒙古自治区、宁夏回族自治区、海南省),在考虑地区差异的基础上以内隐分层的、多阶段、多层次、与人口规模成比例的概率抽样方式抽取162个县635个村共14960户家庭,CFPS的样本可视为一个全国代表性样本[26]。本文使用2010—2016年4轮调查中全国25个省、市、自治区儿童及其所在家庭的相关数据(表1)。Tab. 1
表1
表12010—2016年中国家庭追踪调查数据库(CFPS)儿童样本分布
Tab. 1
| 年份 | 总计(人) | 性别(人) | 地区(人) | 年龄(岁) | |||||
|---|---|---|---|---|---|---|---|---|---|
| 男 | 女 | 城镇 | 乡村 | 3~5 | 6~16 | ||||
| 2010 | 7386 | 3876 | 3510 | 2751 | 4635 | 1752 | 5634 | ||
| 2012 | 6733 | 3540 | 3193 | 2505 | 4228 | 2505 | 4228 | ||
| 2014 | 6775 | 3573 | 3202 | 2553 | 4222 | 1791 | 4985 | ||
| 2016 | 6618 | 3527 | 3091 | 2731 | 3887 | 1920 | 4698 | ||
新窗口打开|下载CSV
《联合国儿童权力公约》将“儿童”定义为年龄不大于18岁的人,由于CFPS数据库中的儿童问卷主要针对0~16岁(含0岁,不含16岁)儿童,其中0~2岁儿童由于生长阶段不同在部分指标设置上与其他年龄段存在出入,故本文涉及的儿童年龄为3~16岁(含3岁,不含16岁)。
2.2 评价指标选取与测度
对于儿童多维贫困维度和指标的选取,学术界至今尚无定论,对文献进行梳理可发现,住房、照料、教育、健康、营养、社会参与等是儿童多维贫困测度中最常使用的维度。遵循科学性、目的性、测度的可操作性等指标选取原则,依据相关文献及CFPS数据库数据情况,选取住房、照料、教育、健康、营养5个维度及相应指标测度中国儿童多维贫困状况(表2),社会参与维度由于缺少相关数据,因此本研究中未对这一维度指标进行测度。Tab. 2
表2
表2中国儿童多维贫困指数指标体系
Tab. 2
| 维度 | 指标 | 指标描述 | 剥夺情况 |
|---|---|---|---|
| 住房 | 水源[27] | 儿童所在家庭使用的饮用水源 | 1为没有安全饮用水,否则为0 |
| 燃料[28] | 儿童所在家庭使用的生活燃料 | 1为生活燃料为柴草或煤,否则为0 | |
| 照料 | 父母照顾[29] | 母亲或父亲对儿童的照顾情况 | 1为儿童一个月内未见到母亲或父亲,否则为0 |
| 家人关怀[29] | 家人对儿童生活关怀频率 | 1为家人比较不或从不关怀儿童生活,否则为0 | |
| 教育 | 入学情况[27] | 学龄儿童入学情况 | 1为儿童无法入学接受教育,否则为0 |
| 教育关注度[28] | 父母对儿童教育情况的关注程度 | 1为父母不关心或较不关心孩子的教育,否则为0 | |
| 营养 | 身高[26] | 儿童身高数据 | 1为儿童身高低于标准值,否则为0 |
| 体重[26] | 儿童体重数据 | 1为儿童体重低于标准值,否则为0 | |
| 健康 | 医疗保险[16] | 儿童医疗保险情况 | 1为家人未为儿童购买医疗商业保险或社会保险,否则为0 |
| 就医情况[19] | 儿童生病就医情况 | 1为儿童生病时不能获得药物治疗或前往医院治疗,否则为0 |
新窗口打开|下载CSV
本文使用A-F法对儿童多维贫困进行测度。A-F法在多维贫困测度中被广泛使用,它建立在“多重剥夺”的概念之上,只有在遭受多重福利剥夺时才被定义为贫困,对各维度剥夺的联合分布有敏感性,能够更好地识别多维贫困个体。在儿童多维贫困研究中,A-F法同样被广泛使用[30,31,32]。以剥夺临界值Z及贫困临界值K对儿童进行多维贫困识别,即当儿童某个指标超过剥夺临界值Z时,表明儿童该指标被剥夺,被剥夺的指标数量大于等于K时,该儿童属性识别为多维贫困。基于此思路,本文先计算多维贫困人口发生率H,再计算多维贫困平均剥夺份额A,儿童多维贫困指数MPI[33]为:
式中:p表示多维贫困人口;P表示研究总人口。
式中:
2.3 研究方法
(1)全局空间自相关分析。利用全局自相关分析中国儿童多维贫困指数的整体分布状况,以判断在空间上是否存在集聚性。计算公式为[34]:式中:n为空间单位数;Xi代表空间单元
(2)马尔科夫链。马尔科夫链分析是将数据离散化为L种类型后,构造状态转移概率矩阵,测算不同类型的概率分布及其随时间变化的情况,以此刻画研究对象动态演进的全过程[35],预测其在未来某一特定时间可能出现的状态。根据2010—2016年中国儿童多维贫困指数将各省域划分为高值区、中高值区、中等值区、中低值区、低值区,在此基础上计算区域内不同类型之间的转移概率。状态转移概率hij是由状态i转移到状态j的概率,研究单元的历年状态可用
式中:rij为研究时段内t时期属于i类型转变到下一时期j类型的空间单元数量;ri为研究时段内所有年份i类型的空间单元数量。
(3)地理探测器。利用地理探测器可以探测空间分异性及背后的驱动力,能够用小于30的样本量达到其他模型需更大样本量才能达到的统计精度,对多自变量共线性免疫、不要求必须空间连续[36]。基于地理探测器的以上特点,运用因子探测测度中国儿童多维贫困影响因素的解释程度,运用交互探测判断两个因子交互作用与单因子影响相比是更强化还是更弱化。
式中:q为影响因子对区域差异的探测力值,
3 结果分析
3.1 中国儿童多维贫困时间变化
从时间变化上看,2010—2016年间中国儿童多维贫困整体情况得到有效改善,儿童多维贫困指数呈下降趋势,由0.138降至0.063,年均降幅为9.06%(表3)。其中,2010—2016年间东中西部儿童多维贫困情况均得到有效改善,东部地区儿童多维贫困指数由0.081下降至0.035,中部地区由0.121下降至0.049,西部地区由0.211下降至0.103(表4),年均降幅分别为9.47%、9.92%、8.53%,中部地区降幅最大,西部地区降幅最小。东中西部地区儿童多维贫困指数标准差分别由0.044、0.055、0.067减小至0.023、0.021、0.032,说明各省域间绝对差异随时间变化明显减小。东中西部地区儿童多维贫困指数变异系数呈现波动变化,说明各省域间相对差异随着时间变化出现一定波动,2012年东中西部地区省域间相对差异达到最大。2010以来,国家先后发布《2011—2020年中国儿童发展纲要》、《国家贫困地区儿童发展规划(2014—2020年)》等,对儿童发展更为重视,随着经济、文化、教育、卫生等各项事业的不断进步及儿童扶贫工作的有效落实,2010—2016年儿童多维贫困情况得到一定程度的缓解,地区间绝对差异缩小。2012年后随着连片特困地区扶贫攻坚全面启动,重点贫困地区扶贫工作有所突破,进一步缓解了儿童多维贫困,区域间相对差异缩小。Tab. 3
表3
表32010—2016年中国儿童多维贫困指数测度结果
Tab. 3
| 年份 | 2010 | 2012 | 2014 | 2016 |
|---|---|---|---|---|
| 住房维度 | 0.183 | 0.138 | 0.111 | 0.075 |
| 照料维度 | 0.101 | 0.080 | 0.066 | 0.052 |
| 教育维度 | 0.110 | 0.073 | 0.062 | 0.061 |
| 健康维度 | 0.096 | 0.104 | 0.065 | 0.024 |
| 营养维度 | 0.201 | 0.168 | 0.103 | 0.096 |
| 儿童多维贫困指数 | 0.138 | 0.112 | 0.087 | 0.063 |
新窗口打开|下载CSV
Tab. 4
表4
表42010—2016年中国东中西部儿童多维贫困指数测度结果、标准差与变异系数
Tab. 4
| 年份 | 东部地区 | 中部地区 | 西部地区 | ||||||||
|---|---|---|---|---|---|---|---|---|---|---|---|
| 指数 | 标准差 | 变异系数 | 指数 | 标准差 | 变异系数 | 指数 | 标准差 | 变异系数 | |||
| 2010 | 0.081 | 0.044 | 0.756 | 0.121 | 0.055 | 0.490 | 0.211 | 0.067 | 0.369 | ||
| 2012 | 0.070 | 0.043 | 0.872 | 0.096 | 0.047 | 0.516 | 0.173 | 0.062 | 0.434 | ||
| 2014 | 0.054 | 0.036 | 0.716 | 0.063 | 0.029 | 0.458 | 0.145 | 0.036 | 0.287 | ||
| 2016 | 0.035 | 0.023 | 0.802 | 0.049 | 0.021 | 0.443 | 0.103 | 0.032 | 0.367 | ||
新窗口打开|下载CSV
从中国儿童多维贫困各个维度来看,2010—2016年间中国儿童住房、照料、教育、营养4个维度的贫困指数呈逐年下降趋势,年平均降幅分别为9.84%、8.09%、7.42%、8.71%,健康维度小幅上升后出现明显下降,年平均降幅为12.50%。各个维度贫困情况在2010—2016年间均得到有效改善,维度间差距逐渐缩小,发展水平日益接近(表3)。5个维度中健康维度下降幅度最大,这与中国近年来医疗条件不断提升、医疗保障逐步完善有关。特别针对儿童群体,2010年起国家逐步建立儿童大病救助机制,2012年儿童重大疾病保障范围全面扩大,覆盖重大疾病达20种,儿童医疗救助体系建设快速推进,因此,2012年后儿童医疗条件逐步改善,健康维度贫困指数逐渐下降。此外,住房维度的贫困相较降幅同样较大,说明随着城乡饮用水安全提升,家庭清洁能源推广[38],安居工程、棚户区改造等民生工程的推进,住房维度的贫困逐步得到解决。
3.2 中国儿童多维贫困空间分布变化
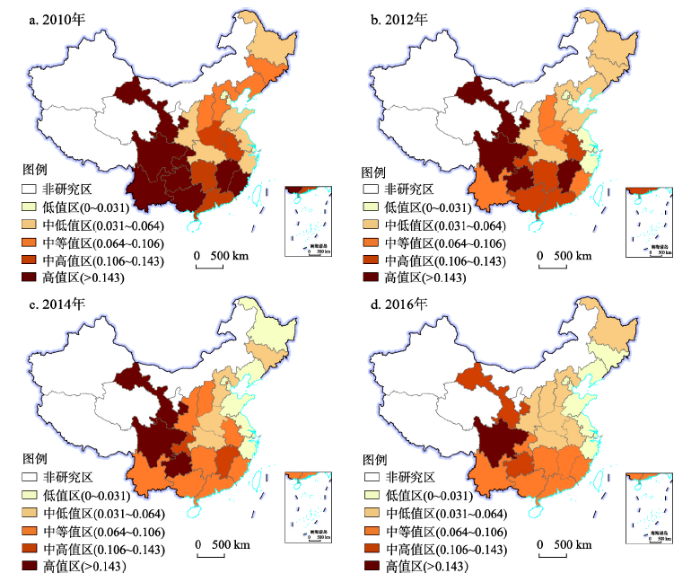
通过计算中国儿童多维贫困指数全局Moran's I,判断中国儿童多维贫困指数在空间上是否存在集聚性。结果显示,2010—2016年中国儿童多维贫困指数全局Moran's I分别为0.429、0.434、0.596、0.619,p值均小于0.01,通过显著性检验。Moran's I逐渐上升,始终为正值,表明中国儿童多维贫困在空间上始终存在明显的正向集聚效应,2010—2016年儿童多维贫困空间差异不断缩小,集聚程度上升[39]。为了更直观地反映中国儿童多维贫困指数的空间分布特征,采用自然断点法将2016年各省、市、自治区划分为儿童多维贫困指数高值区、中高值区、中等值区、中低值区、低值区,并保证各时间断面划分阈值一致[40],空间格局演变特征如图1所示。图1
 新窗口打开|下载原图ZIP|生成PPT
图12010—2016年中国儿童多维贫困指数空间分布
注:基于自然资源部标准地图服务网站GS(2019)1825号的标准地图制作,底图边界无修改。
Fig. 1Spatial distribution of children multidimensional poverty index in China from 2010 to 2016
首先,从中国儿童多维贫困指数的省域空间分布来看,2010—2016年高值区、中高值区、中等值区、中低值区、低值区在省域间的空间分布变化均较大。儿童多维贫困高值区主要位于西部地区,范围逐渐收缩,由甘—川—渝—贵—云—桂连片区、赣—闽连片区收缩为四川一省;中高值区趋于分散,由湘—粤、皖—豫连片区转变为甘、贵两省;中等值区发生明显由北向南的转移,形成赣—闽—粤—湘—桂—渝—云连片区,呈侧倒的“U”型插入中低值区;中低值区范围大幅增加,主要在中部地区形成连片发展;低值区不断扩张,自京、津、沪向鲁、苏、浙、辽等沿海地区延伸。整体来看,中国儿童多维贫困指数空间分布始终呈现“东—中—西”部阶梯式递增的空间特征,北京、天津、上海在研究期始终属于低值区,基本不受多维贫困困扰,四川始终属于高值区,多维贫困情况最为严重。
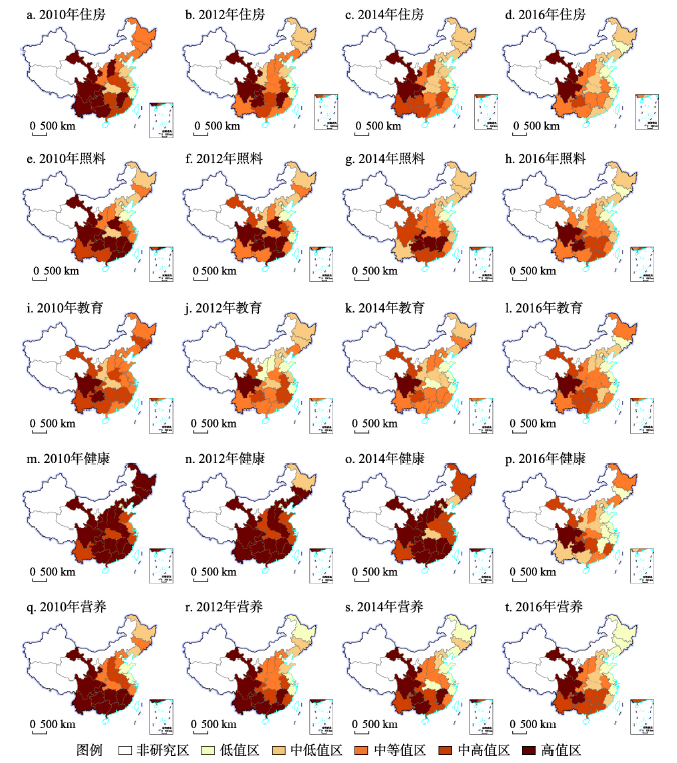
从2010—2016年中国儿童多维贫困不同维度的空间分布来看,住房、照料、教育、健康、营养5个维度在空间分布上同样存在差异(图2)。① 住房维度由以高值区、中高值区为主转变为以中等值区、中低值区为主,高值区逐渐收缩为川—甘连片区;中高值区逐渐向西转移,分布于贵州一省;中等值区先分散后集中,形成晋—陕—渝—湘—赣—皖—桂—云连片区;中低值区与低值区逐渐连片,主要位于沿海东部省份。② 照料维度以高值区、中高值区为主转变为中等值区、中低值区、低值区并存,高值区面积明显减少,由豫、甘—川—渝—贵—湘—赣—闽—粤连片区减少为川—贵连片区;中高值区主要由高值区转变而来;中等值区面积明显扩大,分散分布于甘、闽、晋—豫—鄂—皖连片区、云—桂连片区;中低值区与低值区变动较小。③ 教育维度由以中高值区、中等值区为主转变为以中等值区、中低值区为主,高值区由川—贵连片区减少至仅余四川;中高值区由分散开始向高值区集中;中等值区位于高值区与中高值区外围地区;中低值区与低值区逐渐连片,面积明显增加。④ 健康维度由高值区为主转变为中等值区、中低值区为主,高值区明显收缩,仅余川—贵连片区;中高值区先增加后减少,最终分散分布;中等值区面积明显增加,同样呈现分散分布;中低值区与低值区大幅扩张,形成连片。⑤ 营养维度由高值区为主转变为中高值区、中等值区为主,高值区甘—川—云—贵—渝—桂—湘—粤—赣—闽连片区收缩至甘—川—贵连片区;中高值区由北向南发生转移;中等值区明显收缩,分布于陕—晋—渝连片区与皖;中低值区与低值区连片,面积明显增加。总体而言,住房、照料、教育、健康、营养5个维度在空间分布的变化上具有一定的不同,但整体格局始终呈现“东—中—西”阶梯式递增的空间分布特征。
图2
 新窗口打开|下载原图ZIP|生成PPT
图22010—2016年中国儿童多维贫困各维度指数空间分布
注:基于自然资源部标准地图服务网站审图号为GS(2019)1825号的标准地图制作,底图边界无修改。
Fig. 2Spatial distribution of various dimensions of children multidimensional poverty index in China from 2010 to 2016
为进一步探究省域分维度贫困的特征,以2016年各维度指数作为分类变量,对25个省、市、自治区进行K-means聚类,划分为多维贫困型、住房—营养—教育维度贫困型、照料—营养—住房维度贫困型、照料—健康维度向好型、多维贫困向好型5种类型。其中,川、贵为多维贫困型,这一类型贫困程度最深,在各个维度上均受到贫困困扰。甘肃为住房—营养—教育贫困型,主要位于最贫困地区的外围,这一类型贫困程度较深,相对其他类型而言住房维度贫困比较突出。这可能由于甘肃地区生活用水短缺,家庭用能结构落后,家庭住房条件相对较差,导致当地儿童在住房维度较贫困。皖、赣、湘、渝、粤、桂、云为照料—营养—住房贫困型,相对其他类型而言在照料维度贫困比较突出,主要由于这些地区多为外出打工大省,使得大量儿童留守家中,父母对于儿童的关心照料不足。黑、辽、冀、晋、豫、鄂、陕、闽为照料—健康维度向好型,这一类型贫困程度较轻,照料、健康维度贫困较轻,而住房、教育、营养维度贫困程度相对严重。京、津、吉、鲁、江、浙、沪为多维贫困向好型,主要位于东部沿海,这一类型地区基本不受到贫困困扰,住房、照料、教育、健康、营养维度均表现良好。
3.3 中国儿童多维贫困城乡空间差异
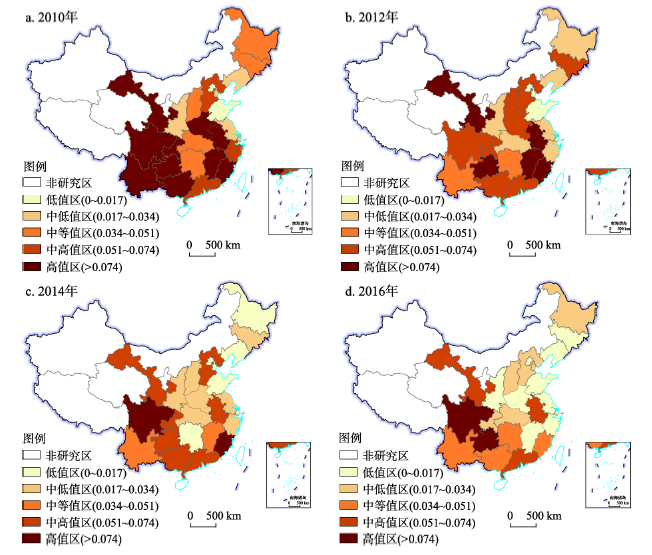
相关研究表明,农村儿童往往在生存发展中面临更多风险,更容易陷入多维贫困的困境[20]。因此,为研究中国儿童多维贫困内部差异情况,同样采用自然断点法将2016年城市儿童多维贫困指数从低至高划分为5级并保证各时间断面划分阈值一致,同时用手动分类法对农村儿童多维贫困指数进行分级,使得二者分类等级和区间范围保持一致。2010—2016年中国城市儿童多维贫困指数分别为0.065、0.051、0.037、0.029,逐年递减(图3)。其中高值区面积逐渐减少,由甘—川—渝—云—贵—桂、豫—皖—赣—闽连片区最终转变为川、贵两地;中高值区分布较分散,最终形成甘、皖、粤点状分布;中等值区由分散变为集中,在南部形成闽、云—桂—湘连片区;中低值区集中后扩散,分布于津—冀—晋连片区、鄂—渝连片区、黑三处;低值区面积扩张,主要在沿海地区逐渐形成连片分布。总体而言,中国城市儿童多维贫困的空间分布向着“东—中—西”贫困指数阶梯式递增的格局转变,经济发达的地区周边更易陷入严重的儿童多维贫困,如京、津周边的冀与江、浙、沪周边的皖、闽的城市儿童多维贫困指数均较高,可能是发达省市集聚了大量医疗、教育、文化等儿童发展所需的要素,虹吸效应导致周边地区城市教育资源、医疗条件等条件受限,当地儿童更易陷入多维贫困。
图3
 新窗口打开|下载原图ZIP|生成PPT
图32010—2016年中国城市儿童多维贫困指数空间分布
注:基于自然资源部标准地图服务网站审图号为GS(2019)1825号的标准地图制作,底图边界无修改。
Fig. 3Spatial distribution of urban children multidimensional poverty index in China from 2010 to 2016
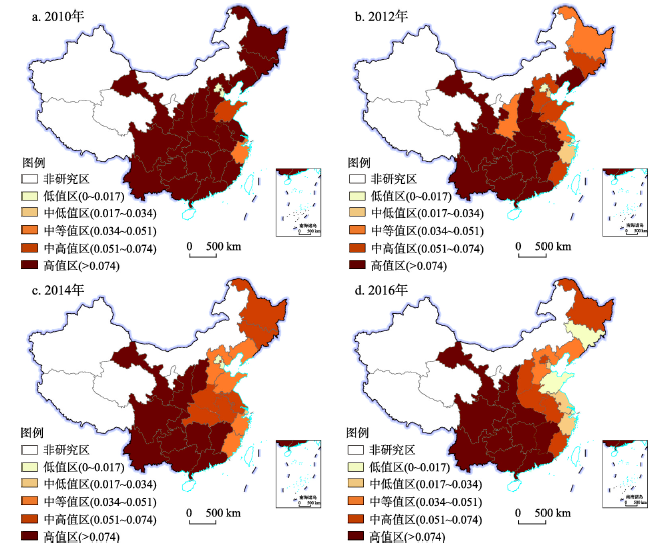
2010—2016年中国农村儿童多维贫困指数分别为0.181、0.148、0.118、0.087,同样呈逐年下降趋势。高值区逐渐收缩,占比逐渐下滑,但始终分布较广;中高值区先增加再减少,主要由高值区转化而来,分布于高值区外围;中等值区逐渐集中,形成辽—冀连片区;中低值区、低值区仅于东部缓慢扩张,尚未形成连片发展(图4)。农村地区高值区分布较广,区域集中,存在明显的连片情况,儿童多维贫困指数始终远高于城市儿童。对比2010—2016年城市、农村儿童多维贫困指数,川、贵两省差距最为明显,表明儿童多维贫困严重的省域之间存在更为明显的城乡差距。
图4
 新窗口打开|下载原图ZIP|生成PPT
图42010—2016年中国农村儿童多维贫困指数空间分布
注:基于自然资源部标准地图服务网站审图号为GS(2019)1825号的地图制作,底图无修改。
Fig. 4Spatial distribution of rural children multidimensional poverty index in China from 2010 to 2016
总体而言,中国儿童多维贫困指数城乡差距显著,农村儿童的贫困情况受到经济基础、人口流失、教育水平等多方面的累积效应影响,相较于城市儿童更容易受到多维贫困困扰,这与葛岩等的研究结果[41]趋于一致。此外,在空间分布上,城市、农村儿童多维贫困均存在高值区明显收缩,低值区明显扩张的现象,向着“东—中—西”贫困指数阶梯式递增的格局转变,但农村儿童多维贫困以高值区、中高值区为主,贫困程度较深的地区存在明显连片现象,贫困程度远高于城市儿童。
3.4 中国儿童多维贫困演变趋势预测
根据2010—2016年中国儿童多维贫困指数高值区、中高值区、中等值区、中低值区、低值区的分布,采用马尔科夫链测算儿童多维贫困状态转移的概率矩阵,以状态转移概率矩阵的主对角线数值表示儿童多维贫困状态未发生变化的概率,以非对角线数值表示儿童多维贫困状态发生变化的概率,测算结果如表5所示。Tab. 5
表5
表5中国儿童多维贫困马尔科夫转移矩阵(%)
Tab. 5
| t/t+1 | 低值区 | 中低值区 | 中等值区 | 中高值区 | 高值区 |
|---|---|---|---|---|---|
| 低值区 | 94.12 | 5.88 | 0.00 | 0.00 | 0.00 |
| 中低值区 | 37.50 | 56.25 | 6.25 | 0.00 | 0.00 |
| 中等值区 | 0.00 | 50.00 | 50.00 | 0.00 | 0.00 |
| 中高值区 | 0.00 | 0.00 | 63.64 | 36.36 | 0.00 |
| 高值区 | 0.00 | 0.00 | 13.33 | 33.33 | 53.33 |
新窗口打开|下载CSV
从2010—2016年中国儿童多维贫困马尔科夫转移矩阵来看,中国儿童多维贫困未来发展趋势基本向好。① 贫困程度低或得到改善的地区返贫可能性较小,低值区、中低值区等级保持不变的概率分别为94.12%、56.25%,具有一定稳定性。② 贫困程度中等或中高的地区逐步向低等级转变,中等值区和中高值区发生转移的概率为50.00%、63.64%,较易发生转移,主要转移类型为高等级向低等级进行邻级转移。③ 贫困程度高的地区扶贫难度较大,高值区等级保持不变的概率为53.33%,不易发生变动。
4 影响因素地理探测
4.1 地理探测结果
为分析中国儿童多维贫困的空间分异影响因素,综合考虑家庭、社会、经济、政治等方面,结合相关文献及可得数据,选取人均GDP(x1)表征经济水平[42],人口城镇化率(x2)表征城镇化水平[41],居民人均可支配收入(x3)、居民每百户年末电脑拥有量(x4)表征家庭情况[43],人均公共预算支出(x5)表征政府行为[44],每千人医疗卫生机构床位(x6)表征医疗资源[45],每千人地区课本和儿童读物出版数(x7)、地区文盲率(x8)表征教育环境[46],儿童抚养比(x9)表征抚养能力[47],共计9个因子,进行地理探测。首先进行因子探测,探究各影响因子对中国儿童多维贫困空间分异的决定力q值。探测结果如表6所示。筛除p值小于0.1的x5、x6、x8,其余因子按照q值大小进行排序,x4 > x2 > x3 > x9 > x1 > x7。其次进行交互探测,探究因子间交互作用对中国儿童多维贫困空间分异的影响。结果显示,不同因子交互作用的影响力均大于单因子的影响力(表7),其中x8∩x9、x2∩x6、x4∩x9影响力最大,分别为0.853、0.851、0.843,x5∩x6影响力最小,仅0.362。x2∩x6产生非线性增强,其余因子交互均产生双因子增强作用。
Tab. 6
表6
表6地理探测器的因子探测
Tab. 6
| x | x1 | x2 | x3 | x4 | x5 | x6 | x7 | x8 | x9 |
|---|---|---|---|---|---|---|---|---|---|
| q值 | 0.417 | 0.568 | 0.492 | 0.627 | 0.189 | 0.203 | 0.405 | 0.588 | 0.447 |
| p值 | 0.039 | 0.009 | 0.065 | 0.006 | 0.131 | 0.153 | 0.046 | 0.124 | 0.062 |
新窗口打开|下载CSV
Tab. 7
表7
表7地理探测器的交互探测
Tab. 7
| 交互因子 | q值 | 类型 | 交互因子 | q值 | 类型 | 交互因子 | q值 | 类型 |
|---|---|---|---|---|---|---|---|---|
| x1∩x2 | 0.668 | BE | x2∩x7 | 0.752 | BE | x4∩x8 | 0.717 | BE |
| x1∩x3 | 0.533 | BE | x2∩x8 | 0.778 | BE | x4∩x9 | 0.843 | BE |
| x1∩x4 | 0.749 | BE | x2∩x9 | 0.773 | BE | x5∩x6 | 0.362 | BE |
| x1∩x5 | 0.516 | BE | x3∩x4 | 0.801 | BE | x5∩x7 | 0.473 | BE |
| x1∩x6 | 0.639 | BE | x3∩x5 | 0.675 | BE | x5∩x8 | 0.721 | BE |
| x1∩x7 | 0.578 | BE | x3∩x6 | 0.660 | BE | x5∩x9 | 0.585 | BE |
| x1∩x8 | 0.829 | BE | x3∩x7 | 0.644 | BE | x6∩x7 | 0.583 | BE |
| x1∩x9 | 0.793 | BE | x3∩x8 | 0.839 | BE | x6∩x8 | 0.813 | BE |
| x2∩x3 | 0.638 | BE | x3∩x9 | 0.710 | BE | x6∩x9 | 0.652 | BE |
| x2∩x4 | 0.685 | BE | x4∩x5 | 0.662 | BE | x7∩x8 | 0.809 | BE |
| x2∩x5 | 0.702 | BE | x4∩x6 | 0.791 | BE | x7∩x9 | 0.679 | BE |
| x2∩x6 | 0.851 | NE | x4∩x7 | 0.768 | BE | x8∩x9 | 0.853 | BE |
新窗口打开|下载CSV
4.2 分异机制
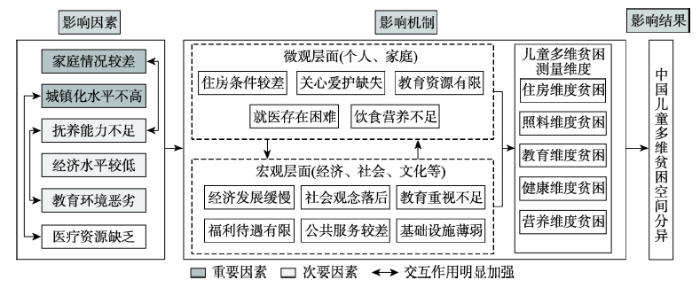
结合因子探测及交互探测结果,进一步探讨中国儿童多维贫困空间分异机理。综合因子探测和交互探测可以发现,家庭情况、城镇化水平是影响儿童多维贫困空间分异的重要因素,抚养能力、经济水平、教育环境是次要因素,医疗资源、政府行为的影响不明显。总体来看,中国儿童多维贫困的各影响因素之间存在明显的互相强化作用,主导交互因素为教育环境与抚养能力、城镇化水平与医疗资源、家庭情况与抚养能力(图5)。图5
 新窗口打开|下载原图ZIP|生成PPT
图5中国儿童多维贫困空间分异机制
Fig. 5Differentiation mechanism of children multidimensional poverty in China
(1)家庭情况是影响儿童多维贫困空间分异的重要因素,家庭情况与抚养能力交互为主导交互因素。家庭与儿童生活息息相关,儿童贫困状态受到家庭的深刻影响,贫困家庭的儿童可能会因为家庭债务中断学业参加劳动。非贫困家庭拥有更为充足的资源,用以提升儿童住房、教育、健康、营养等方面条件[41],给予儿童充分的关心和爱护[48]。抚养能力则反映了地区劳动力对儿童抚养压力,儿童抚养比越高,表示地区劳动力所需负担的儿童人数越多,对儿童抚养压力越大,儿童所能分配到的发展资源越少,遭遇多维贫困的风险随之增加。家庭情况与抚养能力交互意味着儿童发展资源将在社会与家庭层面受到双重剥夺,使得儿童更易陷入多维贫困的困境。总体来看,中国东部地区家庭的整体收入与消费水平优于中西部,东部发达地区密集的劳动力也降低了当地儿童的抚养压力,使得儿童能够享有更多的发展资源和更高的福利水平,因此儿童多维贫困低值区主要集中于东部沿海地区。
(2)城镇化水平是影响儿童多维贫困空间分异的重要因素,城镇化水平与医疗资源交互为主导交互因素。城镇化水平提升能够有效阻断贫困代际传递[41],城市集中了更为优质的公共服务、基础设施等,相较农村儿童,城市儿童能够得到更充分的生活保障,2010—2016年中国城镇化率由49.95%提升至57.35%,更多儿童进入了城市环境,因此儿童多维贫困情况在空间上表现为高值区收缩,低值区扩张。此外,生命健康是儿童发展的重要基础,儿童获取医疗卫生服务的便利性提升,能够改善儿童在健康维度的贫困。2016年东、中、西部地区城镇人口比重分别为65.9%、52.8%、50.2%,城镇化水平存在明显地区差异,优质医疗资源也呈现“东—中—西”阶梯式递减的格局[49]。一方面城镇化水平越高的地区对优质医疗资源的吸引力越强,另一方面城市优质的医疗资源也成为了人们进入城市环境的动力,在城镇化水平与医疗资源交互作用下,中国儿童多维贫困指数同样呈现出“东—中—西”部阶梯式递增的空间特征。
(3)抚养能力、经济水平、教育环境是影响儿童多维贫困空间分异的次要因素,但教育环境与抚养能力交互为主导交互因素。① 优良的教育环境意味着儿童可能获得更多教育机会,教育是促进脱贫与发展的重要手段,教育缺失会导致儿童长期处于多维贫困。儿童时期遭遇的多维贫困会对其未来社会发展、健康状况等产生长期负面影响[23],导致地区劳动力质量降低,加剧劳动力对儿童的抚养压力;而随着抚养压力增大,儿童个体所能拥有的社会资源将会减少,影响儿童教育资源获取,不利于儿童教育环境改善,在两者交互作用下形成恶性循环。中国优质教育资源分布具有明显的东西部差异,京、津、江、浙、沪等地区属于优质基础教育资源的优势区域[50],此外这些地区儿童抚养能力更高,因此儿童多维贫困指数长期处在较低水平。同样位于东部地区的福建等地由于教育资源相对东部其他地区略显不足,且受到传统观念的影响多子现象普遍,导致抚养压力较大,因此,虽然福建等省的儿童家庭情况较好、城镇化水平较高,但受教育环境与抚养能力双重制约,相较于东部地区其他省份而言,儿童贫困问题仍比较突出。② 经济水平则作为次要因素对儿童多维贫困空间分异产生作用。一方面,经济发达地区往往拥有更多财政收入用以改善民生,儿童福利政策较好,中国人均GDP一直呈“东—中—西”阶梯式递减,东部良好的经济水平为儿童多维贫困的改善奠定了基础;另一方面,省际间的人口流动受到市场要素作用,经济水平较差的中西部地区由于非农就业机会较少、工资收入水平较低等原因,劳动力外流现象更为明显[51],缺少父母关心使不少儿童成为留守儿童,加重了儿童多维贫困情况。
(4)各影响因子之间均存在明显的互相强化作用,多重因素在儿童多维贫困高值区出现叠加效应,这在四川地区特别突出。2010—2016年四川地区儿童多维贫困一直比较严重,主要成因如下:① 四川地处西南,西南地区是我国最为贫困的地区之一[52],长期以来工业基础较弱,经济增长缺乏支撑,整体经济水平较低;② 四川城镇化模式为异地工业化带动本地城镇化[53],城镇化缺乏有效驱动力,加之地形限制、连片贫困区众多导致振兴环境较差,当地城镇化始终处于较低水平[54],难以有效改善儿童住房、教育、医疗等方面条件;③ 地区教育资源相对不足,教育观念相对落后,地形环境一定程度影响教育设施布局,教育环境相对较差;④ 贫困面积广,贫困程度深,甘孜、阿坝、凉山等地区贫困家庭众多,当地对儿童家庭情况改善压力大。此外,当地家庭出于对未来收入的担忧、养儿防老观念影响等原因普遍多子,导致抚养压力增加。劳动力的流失,也导致当地儿童抚养比升高,加剧地区抚养压力。影响儿童多维贫困的多重因素相互作用,导致四川地区儿童多维贫困尤为严重,是未来儿童多维贫困改善的重点地区。
5 结论与讨论
5.1 结论
本文基于CFPS调查数据,选取住房、照料、教育、健康、营养5个维度指标对2010—2016年中国儿童多维贫困情况时空变化进行分析,并用地理探测器对儿童多维贫困空间分异的影响因素进行探讨,主要结论为:(1)从时间变化来看,2010年以来,中国儿童多维贫困状况不断改善,东中西部地区的儿童多维贫困情况均不断好转。各省域间儿童多维贫困的绝对差异随时间变化而减小,省域相对差异随着时间变化出现一定波动。从不同维度来看,中国儿童多维贫困在住房、照料、教育、营养维度的指数呈下降趋势,健康维度小幅上升后出现明显下降,各维度间差距逐渐缩小,其中健康维度的改善最为明显。
(2)从空间分布来看,2010—2016年中国儿童多维贫困的空间分布始终呈现“东—中—西”部指数阶梯式递增的总体特征,空间上存在明显的正向集聚效应,其中京、津、沪在研究期内始终为儿童多维贫困指数低值区,四川地区始终为高值区。住房、照料、教育、健康、营养各个维度贫困指数在空间上具有一定差异性,但整体空间格局均呈现“东—中—西”部贫困指数阶梯式递增的特征。分析中国儿童多维贫困情况的演变趋势可知,中国儿童多维贫困情况未来发展基本向好,表现在贫困程度较轻或贫困已得到改善的地区返贫可能性较小,发生的转移主要为高等级贫困地区向低等级进行邻级转移,但高值区稳定性仍较高,扶贫难度较大,是未来重点改善的对象。
(3)从城乡差异看,2010—2016年城市、农村儿童多维贫困均有所改善,高值区明显收缩,低值区明显扩张,空间分布向着“东—中—西”贫困指数阶梯式递增的格局转变。农村儿童多维贫困主要为高值区、中高值区,贫困程度远高于城市儿童,川、贵两省城市与农村的儿童多维贫困指数差距最为明显。此外,对于城市儿童而言,位于经济发达省份周边的儿童更易陷入严重的多维贫困。
(4)从影响因素看,家庭情况、城镇化水平是影响儿童多维贫困的重要因素,抚养能力、经济水平、教育环境是影响儿童多维贫困的次要因素。各因子间的交互作用对儿童多维贫困的影响远超过单因子作用,主导交互因素为教育环境与抚养能力、城镇化水平与医疗资源、家庭情况与抚养能力,交互作用类型主要为双因子增强,反映了儿童多维贫困空间分异与影响因素之间的复杂特征。
5.2 讨论
本文立足于中国儿童多维贫困的时空格局变化及空间分异影响因素,可为儿童扶贫政策的制定提供一定借鉴。① 在空间差异方面,儿童多维贫困扶贫工作的未来重心应集中于高值区、中高值区,特别是长期处于儿童多维贫困高值区的四川。政策的制定应充分考虑住房、照料、教育、健康、营养各个维度,不断缩小城乡区域差异。通过加大对贫困家庭的帮扶,提升家庭生活水平,保障家庭资源充足以改善儿童贫困;通过加快城镇化建设,优化公共服务与基础设施,惠及儿童发展所需条件;通过降低抚养压力、提升经济水平、改善教育环境、优化医疗资源等手段,解决留守儿童、饮用水健康、能源贫困、教育资源匮乏等问题,促进儿童发展权利公平。② 在不同维度方面,儿童多维贫困扶贫工作的未来重心在于营养、住房维度的改善。对于儿童营养维度,应积极实施儿童营养改善计划,在保障食物供给充足的基础上,优化营养结构,引导儿童形成健康饮食习惯。对于儿童住房维度,住房维度扶贫工作虽已取得一定进展,但相对其他维度仍处于较为严重的状态,应继续重视儿童家庭用水、用能、住房质量等问题,对贫困家庭住房情况展开针对性援助,特别是居住环境相对较差的农村地区,保证援助资金用以改善儿童居住条件。本文仍存在的不足为:① 儿童多维贫困涉及儿童生活、成长的多方面,鉴于研究数据的可得性,本文仅选取住房、照料、教育、健康、营养5个维度,未包括社会参与以及住房安全等维度和指标,儿童多维贫困指标评价体系有待进一步完善;② 本文主要针对2010—2016年省域层面的儿童多维贫困情况,由于样本数据和时间节点相对较少,未能将香港、澳门、台湾以及新疆维吾尔自治区等省域列为研究地,未来还需深入开展覆盖全国层面的分析;③ 本研究仅关注家庭情况、城镇化水平、经济水平、抚养能力、政府行为、医疗保障、教育环境等社会经济因素对中国儿童多维贫困的影响,有待进一步探讨其他诸如自然因素等的影响,剖析儿童多维贫困空间分异的机制。
致谢
本文研究数据部分来自北京大学“985”项目资助、北京大学中国社会科学调查中心执行的中国家庭追踪调查,特此致谢。参考文献 原文顺序
文献年度倒序
文中引用次数倒序
被引期刊影响因子
DOI:10.1016/j.jpubeco.2010.11.006URL [本文引用: 2]
DOI:10.1007/s11205-017-1620-6URL [本文引用: 1]
DOI:10.1007/s11205-015-1119-yURL [本文引用: 1]
DOI:10.1007/s12187-014-9274-2URL [本文引用: 1]
DOI:10.1007/s12187-013-9203-9URL [本文引用: 1]
DOI:10.1007/s12187-020-09744-6URL [本文引用: 1]
DOI:10.1016/j.worlddev.2013.03.005URL [本文引用: 1]
DOI:10.1007/s12187-018-9526-7URL [本文引用: 1]
DOI:10.1007/s11205-018-02060-1 [本文引用: 1]

A large literature has documented the impact of parental separation on children's financial poverty. However, income has been increasingly criticized as an indicator of childhood living conditions and deprivation. In this paper, we propose a conceptual framework and adapt existing measures of adult multi-domain deprivation to produce childhood deprivation indicators that are age-specific and child-centred. These new indicators allow within-individual, longitudinal analyses to measure the impact of a shock on childrens living conditions. We apply this method to explore the long term effects of parental separation on childhood deprivation, considering four dimensions of children's lives: leisure; material conditions; parenting behaviours and routines; and basic material goods. We track children over the first decade of life by using a nationally representative UK cohort of over 18,000 children. Using a fixed-effects framework, we find that, while the increase in income poverty after parental separation is large, the impact on childhood deprivation was more mixed. Our results suggest that, while facing strong financial constraints, separated parents cut back on normative but costly activities such as holidays and outings, but attempt to maintain children's basic material circumstances and their day-to-day parenting and routines, at least around separation. However, heterogeneous effects exist, suggesting that parents' pre-separation social and economic capital may play an important role. This approach therefore adds more precision and nuance to our understanding of the processes around parental separation and its impacts on children.
DOI:10.1007/s12187-018-9539-2URL [本文引用: 1]
DOI:10.1007/s12187-017-9471-xURL [本文引用: 1]
DOI:10.1007/s12187-017-9485-4URL [本文引用: 1]
DOI:10.1007/s12187-014-9246-6URL [本文引用: 1]
DOI:10.1111/dech.2017.48.issue-3URL [本文引用: 1]
DOI:10.1007/s11205-016-1291-8URL [本文引用: 1]
DOI:10.1016/j.childyouth.2016.04.018URL [本文引用: 2]
DOI:10.1007/s11205-016-1541-9URL [本文引用: 1]
DOI:10.1007/s11205-009-9522-xURL [本文引用: 1]
DOI:10.1007/s11205-013-0252-8URL [本文引用: 2]
[本文引用: 3]
[本文引用: 3]
[本文引用: 1]
[本文引用: 1]
[本文引用: 1]
[本文引用: 1]
[本文引用: 2]
[本文引用: 2]
DOI:10.1016/j.childyouth.2016.02.015URL [本文引用: 1]
[本文引用: 1]
[本文引用: 1]
DOI:10.1007/s12187-018-9544-5URL [本文引用: 3]
DOI:10.1007/s11205-013-0253-7URL [本文引用: 2]
DOI:10.1111/aswp.2015.9.issue-2URL [本文引用: 2]
DOI:10.1080/14649880500501179URL [本文引用: 2]
[本文引用: 1]
[本文引用: 1]
DOI:10.1007/s12187-018-9575-yURL [本文引用: 1]
DOI:10.1007/s12187-019-09696-6URL [本文引用: 1]
[本文引用: 1]
[本文引用: 1]
DOI:10.11821/dlxb201812010 [本文引用: 1]
The reduction of regional disparities and the national co-ordination of basic endowment insurance funds will help to improve well-being, promote social equity and enhance happiness. This study engages with panel data obtained from 31 provinces (municipalities and autonomous regions) that was extracted during the period 2007-2016. Regional disparities and the influence mechanisms of China's urban employees' basic endowment insurance funds will be studied by using the Theil index, exploratory spatial data analysis and geographic detectors. The research shows that: (1) the total expenditure of urban employees' basic endowment insurance funds and the between-region Theil index steadily decrease while the within-region Terre index increases on a yearly basis; (2) the accumulated balances of urban employees' basic endowment insurance funds follow significantly different spatial distributions. High-value and sub-high-value areas are mainly located in the eastern region, while second-low-value and low-value areas are mainly located in the western and northeastern regions; (3) seven factors are also identified, including Gross Domestic Product (GDP), the number of subscriptions and institutional support rate that can greatly affect regional disparities in basic endowment insurance funds. In addition, the imposition of various factors are reflected as nonlinear increase or double factor enhancement. We should therefore adhere to coordinated regional socio-economic development, reinforce the contribution base, provide guarantees to those who have qualified and promote the incremental emergence of a national co-ordination of basic endowment insurance funds.
[本文引用: 1]
[本文引用: 2]
[本文引用: 2]
DOI:10.11821/dlxb201701010 [本文引用: 1]
Spatial stratified heterogeneity is the spatial expression of natural and socio-economic process, which is an important approach for human to recognize nature since Aristotle. Geodetector is a new statistical method to detect spatial stratified heterogeneity and reveal the driving factors behind it. This method with no linear hypothesis has elegant form and definite physical meaning. Here is the basic idea behind Geodetector: assuming that the study area is divided into several subareas. The study area is characterized by spatial stratified heterogeneity if the sum of the variance of subareas is less than the regional total variance; and if the spatial distribution of the two variables tends to be consistent, there is statistical correlation between them. Q-statistic in Geodetector has already been applied in many fields of natural and social sciences which can be used to measure spatial stratified heterogeneity, detect explanatory factors and analyze the interactive relationship between variables. In this paper, the authors will illustrate the principle of Geodetector and summarize the characteristics and applications in order to facilitate the using of Geodetector and help readers to recognize, mine and utilize spatial stratified heterogeneity.
[本文引用: 1]
DOI:10.11821/dlxb201906008 [本文引用: 1]
In present-day China, the unequal distribution of public healthcare resources across different levels and regions is problematic. Hierarchical diagnosis and treatment (HDT) reform is of great significance for optimising the distribution of healthcare resources and promoting fairness across health services. In this study, exploratory spatial data analysis (ESDA) was applied to evaluate spatial patterns at the lower and upper levels of healthcare resources. The Geodetector model was used to analyse the influences of the healthcare system at the municipal and county levels during 2015. The results show that there is significant spatial clustering in the distribution of the two-level healthcare resources. Influences on upper-level healthcare resources are more significant than those on lower levels. The dominant influencing factors of the two-level healthcare resources differ across spatial scales and regions. In terms of upper-level healthcare resources, urbanisation, population density and the level of economic development are the dominant global factors, in addition to the regional factors of population aging, topography and the morbidity of epidemic and endemic diseases. In the case of lower-level healthcare resources, urbanisation is an important influencing factor, while economic development, population aging and morbidity have local effects. Ultimately, population density was the dominant factor. Finally, this paper suggests that, aiming for HDT reform, decision makers should allocate healthcare resources among different regions and levels in consideration of relevant global and local factors, united and targeted policies, and top-down and bottom-up decision-making mechanisms. This could promote the overall function of the healthcare system and enhance the equity and coordination of multi-level healthcare resources.
[本文引用: 1]
DOI:10.1016/j.apenergy.2016.07.136URL [本文引用: 1]
DOI:10.13249/j.cnki.sgs.2018.12.006 [本文引用: 1]
Market segmentation is an inevitable phenomenon with regional economy imbalance, the influences of which are two-sided. In the short term, market segmentation can promote regional economic development to some extent, but in the long run, it goes against to efficient allocation of resources which is a barrier to economic transform, and also a challenge to enhance the national comprehensive strength. Based on China's provincial panel data from 2001 to 2015, the comprehensive index of provincial market segmentation is calculated through entropy method from the four aspects of commodity market segmentation, the level of internet development, the degree of marketization of economy and the economy of urban agglomerations. With the visualization of the degree of market segmentation by ArcGIS, the spatial and temporal pattern and evolution law of regional market segmentation are revealed. Then, this article analyses the influence factors of the degree of market segmentation by constructing the spatial econometric model. The results showed that: The degree of market segmentation fluctuation is reduced on the whole, while in the process of integration. At the region level, the degree of market segmentation is decreasing from the west to the east, and the provinces with higher levels mainly distributed in the south and north of the Yangtze River, the provinces with moderate degree distributed in the central region and the provinces with lower degree are mainly distributed in the eastern coastal areas. The segmentation degree of regional market has obvious spatial autocorrelation, and the phenomenon of spatial agglomeration is becoming more and more remarkable. To sum up, higher level of proportion of state-owned economy, higher the market segmentation index will be, on the contrary, higher urbanization, fiscal expenditure, foreign trade, technology gap and infrastructure construction will be conductive eliminate market segmentation regionally.
[本文引用: 1]
[本文引用: 1]
[本文引用: 1]
[本文引用: 4]
[本文引用: 4]
DOI:10.11821/dlxb202004007 [本文引用: 1]
Poverty includes regional poverty and individual poverty, both of which are featured by multidimensional concept. Regional multidimensional poverty (RMP) is a major theme and content in poverty geography. Because of harsh natural environment, vulnerable economy and inadequate public services, severely impoverished areas (SIAs) are typical and highlighted areas of RMP, which have been the biggest obstacle to poverty alleviation in China. Based on the theory of spatial poverty, this paper defines the notion of impoverished areal system (IAS) and regional multidimensional poverty (RMP), explores their internal connections and proposes the evaluation indictors and measurement method for RMP. Taking 334 severely impoverished counties as research samples, we analyze the multidimensional poverty patterns of SIAs in 2016 by BP neural network model and exploratory spatial data analysis (ESDA). Results show that: (1) RMP is an external manifestation of the coupling imbalance of "human", "environment" and "industry" in the evolution of IAS. It reveals regional disadvantages in natural environment, economic development and social welfare, corresponding to natural poverty, economic poverty and welfare poverty, respectively. (2) The most severely impoverished county, with the poorest services and infrastructure, is found in the Qinghai-Tibet Plateau. From a single dimension of regional poverty, the Welfare Poverty Index (WPI) > Economic Poverty Index (EPI) > Natural Poverty Index (NPI) in the SIAs, whose average is 2.77, 2.66 and 1.89, respectively, indicating that the lack of social welfare and public services for the poor has become the prominent problem in the SIAs. From the perspective of multidimensional poverty, the Qinghai-Tibet Plateau is a high agglomeration region or "hot spot" of RMP, which is significantly higher than other areas in terms of natural poverty, economic poverty and welfare poverty. (3) Both RMP and individual multidimensional poverty are effective measures of poverty targeting. Their matching coefficient (M) can help us to judge the poverty status of some specific areas, e.g., RMP is superior to individual multidimensional poverty in the remote areas, extremely fragile ecological environment and obvious regional disadvantage, where the matching coefficient (M) is higher. RMP can more objectively reflect the true level of geographical capitals, effectively target poor areas and identify determinant impoverishing factors.
[本文引用: 1]
[本文引用: 1]
[本文引用: 1]
DOI:10.18306/dlkxjz.2018.08.014 [本文引用: 1]
The problem of regional unbalanced development emerges while human well-being is improving. Using the Gini coefficient, Theil index, and regression analysis method, this study analyzed the regional difference in change and determinants of human well-being in China from 1995 to 2013. It revealed that: (1) The inter-provincial difference of human well-being shows a converging trend and is getting smaller in China from 1995 to 2013. In the 9th Five Year Plan period it kept narrowing and in the 10th Five Year Plan period it showed some fluctuations. In the 11th Five Year Plan period it decreased rapidly and in the 12th Five Year Plan period it had a development trend of convergence; (2) From 1995 to 2013, the difference between the four regions is the main difference of human well-being in China, but its contribution rate shows a decreasing trend as a whole. The contribution rate of inter-provincial difference of human well-being is increasing in the four regions. The west region had the biggest inter-provincial difference of human well-being but has decreased significantly. The inter-provincial difference of human well-being enlarged at first and then narrowed in the east region. The central and the Northeast region showed smaller inter-provincial differences of human well-being and had a narrowing trend; (3) Increasing economic development and educational expenditure can improve the provincial human well-being but also will expand the difference of human well-being. The growth of the ratio of health care expenditure in finance will decrease the human well-being, but can narrow the difference of human well-being. Social security expenditure and transfers per capita are effective ways to improve provincial human well-being, but also narrow the difference of human well-being.
[本文引用: 1]
PMID:17958708 [本文引用: 1]
A massive literature documents the inverse association between poverty or low socioeconomic status and health, but little is known about the mechanisms underlying this robust relation. We examined longitudinal relations between duration of poverty exposure since birth, cumulative risk exposure, and physiological stress in two hundred seven 13-year-olds. Chronic stress was assessed by basal blood pressure and overnight cortisol levels; stress regulation was assessed by cardiovascular reactivity to a standard acute stressor and recovery after exposure to this stressor. Cumulative risk exposure was measured by multiple physical (e.g., substandard housing) and social (e.g., family turmoil) risk factors. The greater the number of years spent living in poverty, the more elevated was overnight cortisol and the more dysregulated was the cardiovascular response (i.e., muted reactivity). Cardiovascular recovery was not affected by duration of poverty exposure. Unlike the duration of poverty exposure, concurrent poverty (i.e., during adolescence) did not affect these physiological stress outcomes. The effects of childhood poverty on stress dysregulation are largely explained by cumulative risk exposure accompanying childhood poverty.
DOI:10.1080/1350293X.2014.912894URL [本文引用: 1]
[本文引用: 1]
[本文引用: 1]
PMID:10836573 [本文引用: 1]
Our review of research suggests that family poverty has selective effects on child development. Most important for policy are indications that deep or persistent poverty early in childhood affects adversely the ability and achievement of children. Although the 1996 welfare reforms have spurred many welfare-to-work transitions, their time limits and, especially, sanctions are likely to deepen poverty among some families. We suggest ways policies might be aimed at preventing either economic deprivation itself or its effects.
[本文引用: 1]
[本文引用: 1]
DOI:10.11821/dlxb202002008 [本文引用: 1]
Education is not only important for strengthening a country's population quality and comprehensive power but key in reshaping the "man-land" relations in a country. This article reviews studies on the distribution of educational resources in both Chinese and Anglophone literature and summarizes the research gaps in the Chinese literature, which include but are not limited to the downplay of the analysis of mechanism and comprehensive effects of the spatial structure of educational resources. Employing different map-making technologies and mechanism-analysis methods, this article dives into three findings. First, though spatial features are slightly different between primary school level and middle school level, eastern regions generally have higher quality educational resources than western regions. In addition, urban agglomeration, including Beijing-Tianjin-Hebei, Shanghai-Ningbo-Hangzhou, and the Pearl River Delta, have an advantage in attracting and cultivating high-quality educational resources. Second, the quantity of high-quality primary school resources is positively correlated with annual per capita disposable income of urban households and number of full-time primary school teachers. The quantity of high-quality middle school resources is positively correlated with the comprehensive economic and social performance of the city. Third, when affected by multiple mechanisms, the spatial structure of China's high-quality educational resources is dynamic and deeply intertwines with the interrelations between cities as well as between the societies within each city. This article contributes both to the understanding of the unequal spatial structure of high-quality educational resources in China and to the analysis of complex socio-political effects on this transforming structure. Its findings encourage further research on the connection between the spatial structure of a region's educational resources and its cooperation and geopolitics as well as on the resulting social mobility among different social strata. Study limitations include: place-related elements, such as local political resources, were not sufficiently considered when selecting factors; there is a lack of longitudinal analysis; and not enough attention is paid to the combination of number-based data and geo-information-based data in analyses.
[本文引用: 1]
DOI:10.13249/j.cnki.sgs.2019.12.004 [本文引用: 1]
Based on the data of the 2000 and 2010 China Census counties, this paper compares and analyzes the spatial pattern, formation mechanism and urbanization of the inter-provincial and intra-provincial floating population. The results are as follows: 1) The polarization pattern of the Inter- and Intra-provincial floating population is weakening, and the proportion of the floating population absorbed by the top 10 cities has declined. In the trend of agglomeration, the inter-provincial floating population showed ‘High concentration while showing signs of decentralization’, that is, the degree of agglomeration was higher, and the signs of decentralization became more obvious. The proportion of inter-provincial floating population absorbed by the former 1% city decreased significantly. The floating population in the province is characterized by “Dispersion of distribution while developing toward agglomeration”. It is more scattered and distributed in large and medium-sized cities such as provincial capitals and prefecture-level cities, and is still gathering in 1% of cities. 2) The inter-provincial and intra-provincial floating population is affected by the dual role of the government and market forces. The inter-provincial floating population is more inclined to the provincial capitals and municipalities with more employment opportunities and higher wages in the process of selecting inflows. The floating population in the province pays more attention to employment opportunities, and prefers to flow to prefecture-level cities. In contrast to the inter-provincial population, urban public services have a greater impact on the inflow of floating population in the Intra-provincial Floating population. 3) The “molecular effect” of the inter-provincial and intra-provincial floating population has increased the level of urbanization through the “molecular effect” of urban population changes. The contribution of the inter-provincial and intra-provincial floating population to urbanization reached 4.24% and 2.74% respectively in 2010. In addition, the inter-provincial and intra-provincial floating population has also greatly affected the hierarchical system and spatial distribution of China's urban system.
[本文引用: 1]
DOI:10.13249/j.cnki.sgs.2014.012.1418 [本文引用: 1]
It is very important that to know the poverty degrees of the 11 Contiguous Destitute Areas in China for implementing the Contiguous Destitute Areas′ development and poverty alleviation strategy effectively. As development and poverty are the two sides of a coin, moreover, the development connotation has broadened from economic growth to comprehensive development and the poverty domain enlarged from single dimension to multi-dimensions, this article adopts a new way to assess poverty from the perspective of comprehensive development. Firstly, the author constructed a comprehensive development index system which covered 24 indicators of economic development, social service and ecological environment. Then, assessed and compared the poverty degrees of the 11 Contiguous Destitute Areas. The results showed that: 1) Among of the three dimensions of economic development, social service and ecological environment, economic development performance was the worst and became the poorest dimension of the 11 Contiguous Destitute Areas in China at present, the performance of social service had improved but still very poor, the ecological endowment was rich and ecological pressure was low so far, but the ecology was rather fragile and needed to pay more attention to it ; 2)The spatial distribution characteristics of poverty degree were that the poverty degree of Contiguous Destitute Area was more and more serious from eastern part to northern part and to southwestern part gradually, and southwestern hinterland was the poorest area of China, where covered 5 Contiguous Destitute Areas such as Wuling Mountain Area, Qinba Mountain Area, Wumeng Mountain Area, Border Area of Western Yunan and Rocky Desertification Area of Yunan, Guizhou and Guangxi, in these areas, there were lots of poor families and the poor degree was the most serious one; 3) Besides some common characteristics of the indicators which revealed the economic development level and regional self-development ability such as per capita GDP, per capita revenue, rural per capita net income, average years of education and scientific and technical personnel number in ten thousand people, there were obvious differences of indicators such as cement road ratio of administrative village, population density, nine-year compulsory education achievement ratio, village clinic coverage ratio and illiteracy rate of young adults among the 11 Contiguous Destitute Areas.
[本文引用: 1]
[本文引用: 1]
[本文引用: 1]
DOI:10.11821/dlyj020190196 [本文引用: 1]
Based on the scale-structure-benefit index system, using multiple analysis methods, the spatial pattern characteristics and influencing factors of industrialization-urbanization comprehensive level at town level in China were analyzed. The results were shown as follows. Firstly, although the high and medium value score units were not obvious from the overall spatial pattern, these were still visible with point-like shape in the core areas of urban agglomerations in Eastern and Central China. In addition, the high and medium score units of scale level were prominent, mainly distributed in the triangle area. On the whole, the spatial differentiation characteristics of scale and benefit at town level were similar to the results of previous studies. It was worth mentioning that the southeast-northwest difference with the Hu Huanyong line was clearly visible. Secondly, the internal difference degree from low to high was Eastern China, Central China, Western China and Northeast China. From the provincial and urban cluster levels, although the gap between actual variation and ideal expectations of some provinces and urban agglomerations was quite different, the overall difference in Central and Eastern China was small. Thirdly, from the spatial autocorrelation, the significant High-High and Low-Low units of scale and benefit score were obvious, and formed a new “S”-type separation, which was different from the Hu Huanyong Line. Fourthly, from the comparison perspective, the high, and medium value units of the comprehensive and structural score at county and city levels were similar to those at town level, which were mainly distributed in the core areas of urban agglomeration regions in Eastern and Central China, and some areas were surrounded by the main economic belt and Beijing-Guangzhou axis. The difference was that the centralized agglomeration units of scale strength at county and city level extended to the region in the south of the Middle and Lower Yangtze River and formed a quadrilateral shape. Seen from both sides of the Hu Huanyong Line, the distribution pattern of scale strength at town level was similar to that at county and city levels, but not obvious in comprehensive, structural and benefit pattern. It was worth mentioning that the significant High-High units greatly changed and significant Low-Low areas markedly reduced, and their overall agglomeration pattern became a little scattered. Finally, we found that economic strength, non-agricultural process, towns' modernization level, topographical conditions, rooting and path dependence were the main influencing factors, which respectively played roles of foundation, process, orientation, strength support and chain conduction.
[本文引用: 1]
