 ,, 丁银平, 角媛梅,云南师范大学地理学部,昆明 650500
Spatiotemporal patterns of precipitation changes and their impacts on food supply in Southwest China from 1988 to 2018: A case study in Yunnan Province
LIU Zhilin,, DING Yinping, JIAO Yuanmei,Faculty of Geography, Yunnan Normal University, Kunming 650500, China通讯作者:
收稿日期:2020-08-11修回日期:2021-04-20
| 基金资助: |
Received:2020-08-11Revised:2021-04-20
| Fund supported: |
作者简介 About authors
刘志林(1990-), 男, 宁夏吴忠人, 博士生, 主要从事自然环境要素、耕地、聚落景观演变及效应研究。E-mail:

摘要
关键词:
Abstract
Keywords:
PDF (4790KB)元数据多维度评价相关文章导出EndNote|Ris|Bibtex收藏本文
本文引用格式
刘志林, 丁银平, 角媛梅. 中国西南—东南季风交汇区降水时空格局变化及其对食物产量的影响. 地理学报, 2021, 76(9): 2297-2311 doi:10.11821/dlxb202109018
LIU Zhilin, DING Yinping, JIAO Yuanmei.
1 引言
食物供给、水资源短缺、气候变化是人类未来所面临的最大挑战[1]。这些挑战又表现为食物供给与气候变化、气候变化与水资源短缺、水资源短缺与食物供给之间的关系[2,3,4]。降水格局变化是全球气候变化的主要内容与研究热点[5],深刻影响着区域干旱[6,7]、地表径流[8,9,10]、河流水量[10,11]等问题、同时也间接作用于生态系统和食物供给系统的弹性与安全[2, 12-13]。气候变化带来全球、局地降水格局变化,降水格局变化又导致区域水资源问题,进而影响食物供给,因而上述3组关系的核心问题是降水格局变化与食物供给的关系,但很少有研究揭示其动态关系[9]。降水格局变化是气候变化研究的主要内容,以往成果主要集中于对降水趋势的阐述,包括了年均[14,15]和季节变化[16,17]、极端降水分布[18,19]等内容。研究发现,降水格局在气候变化背景下具有明显的区域响应特征。过去30年中国北方降水量呈下降趋势,南方呈显著增加[20,21],但在西北地区具有干湿转型的特征[22],在百年尺度上,全球气候变暖造成中国干旱与半干旱区降水格局发生了明显变化[23]。云南省位于中国西南地区,降水受东南季风与西南季风共同作用,近年来相继发生了2011年雨季干旱、2012年旱季干旱、2013年冬春干旱、2016年曲靖、丘北等地暴雨洪灾、2018年昆明、曲靖等地洪涝灾害[24]。一系列极端降水事件表明云南省降水格局发生了明显变化。但在全球变化背景下,东南季风与西南季风双重影响下的云南,其降水变化趋势、时空格局仍不十分清楚。
食物产量是由自然、社会经济、科技、文化、政策、人口结构等因子共同作用的巨系统,但学界普遍认为降水对食物产量具有决定性作用[25,26,27],相对其他因子降水格局也最易变化,因此降水是一个关键且易改变的要素。虽然目前一些研究揭示了不同水分胁迫下小麦、玉米、水稻等农作物发育、产量的问题[28,29,30,31],阐明了水分胁迫对农作物生长的影响机理[32]。但多为大田与控制试验,其目的是揭示微观尺度下作物生长与水分的关系。在大范围、长时间、多变化降水格局下,对作物产量与水分时空变化关系的研究还不足[9],尤其是栅格尺度上的研究。
截至2018年,云南省90%耕地为雨养农业[33]。降水格局变化将会对全省食物供给与粮食安全产生重要影响,进而关系到全省25个民族4800余万人的吃饭问题,也是长期保障西南边境稳定、扎实贯彻民族团结,民族繁荣政策、全面建成小康社会的关键问题。因此在东南与西南季风共同作用的云南省,对降水变化时空格局及其与食物供给关系进行研究,具有十分重要的科学与现实意义。基于此,本文主要解决以下3个问题:① 厘清云南省1988—2018年降水变化的时空格局;② 揭示全省多年降水与食物供给的动态关系;③ 识别关键降水阈值对食物供给的影响,阐释其影响机制,讨论全省食物供给对降水响应的特征及区划。
2 研究区与方法
2.1 研究区概况
云南省位于中国西南部(21°08′32″N~29°15′08″N, 97°31′39″E~106°11′47″E),南北跨8个纬度,东西跨9个经度。面积39.4万km2,为中国陆地面积的4.1%。全省16个地级行政单位,129个县级行政单位。境内最高海拔为6630 m,最低为-219 m,地形以山地、高原为主,二者占全省总面积的94%。云南省位于亚欧大陆东南部内陆,中南半岛北缘,受东南季风与西南季风双重影响,及地势从南到北依次升高和降水水汽来源的作用,降水量空间分布特征呈:从南到北依次减少。在时间上,云南省降水具有年际变化小,年内变化大的特点。2019年云南省播种面积为18.61万km²,灌溉面积为1.90万km²,灌溉比为10.2%,农业总产值4935.75亿元,全年粮食产量1870.03万t,猪牛羊肉总产量404.43万t,牛奶59.87万t。2.2 数据来源及预处理
降水数据来源于中国科学院青藏高原研究所(表1)。该数据集是以国际上现有的Princeton再分析资料、GLDAS资料、GEWEX-SRB辐射资料,以及TRMM降水资料为背景场,融合了中国气象局常规气象观测数据制作而成。其时间分辨率为3 h,水平空间分辨率0.1° [34,35]。使用Geodata软件提取1988—2018年,年、月尺度降水量栅格数据;NDVI数据来自SPOT与Landsat影像,下载各年份的月影像,在ENVI中进行辐射定标、大气校正等处理后,计算NDVI值,再将逐月数据融合为年数据,最后重采样为1000 m分辨率;食物供给数据来自云南省统计局,包括各年粮食产量、肉类、奶类产量;土地利用数据来自中国科学院资源环境数据中心,使用AcrGIS提取云南省耕地与草地栅格后转为矢量。Tab. 1
表1
表1数据来源
Tab. 1
| 数据 | 类型 | 精度 | 来源 |
|---|---|---|---|
| 降水 | NetCDF | 0.1° | 中国科学院青藏高原研究所 |
| NDVI | Raster | 1000 m | SPOT和Landsat |
| 土地利用数据 | Raster | 1000 m | 中国科学院资源环境数据中心 |
| 食物产量 | Excel | 省域 | 云南省统计局 |
| 云南省行政边界 | Polygon | 1:10000 | 云南省地理国情普查数据库 |
新窗口打开|下载CSV
2.3 主要研究方法
2.3.1 突变点检测 Mann-Kendall突变检验法是世界气象组织推荐用于提取序列变化趋势的有效工具,目前已经被广泛用于众多学科研究中,其优点是不需要样本遵从一定的分布,也不受少数异常值的干扰,更适用于类型变量和顺序变量,计算也较为方便。计算公式如下:对于具有n个样本量的时间序列x,构造秩序列:
其中:
秩序列Sk是i时刻数值大于j时刻数值个数的和,可知k = 1时,S1 = 0。
在时间序列随机独立的假定下,定义统计变量:
式中:UFk为定义的统计量,UF1 = 0;E(Sk)、Var(Sk)是累计数Sk的均值和方差,在x1, x2, …, xn相互独立且有相同连续分布时,可通过以下公式进行计算:
UF通过时间序列x1, x2, …, xn的顺序计算其统计量,UB通过时间序列x的逆序计算。给定显著水平α = 0.05,其临界值为1.96。|UF|>1.96表明序列存在显著的变化趋势;UF>0表明序列呈现上升趋势,UF<0表明呈下降趋势,若UF>1.96则序列有显著上升趋势;UF<-1.96,则序列有显著下降趋势。若UF与UB在临界值之间出现交点则交点对应的时刻为突变开始时间。
2.3.2 食物供给与产量估算
研究表明农作物、畜产品产量与NDVI之间具有显著的线性关系[36]。因而,食物供给在栅格尺度上反演,可以遵循以下思路:基于土地利用分类,将粮食按照农田面积,肉类和奶类按照草地面积分别计算其单位面积上的食物产量[37,38]。计算公式如下:
式中:Yi为第i个栅格所分配的粮食产量、肉类与奶类产量;Ysum为食物总产量、肉类与奶类总产量;NDVIi表示第i个栅格的NDVI;NDVIsum为研究区耕地或草地的NDVI之和。
3 结果与分析
3.1 1988—2018年云南省降水变化的时空格局
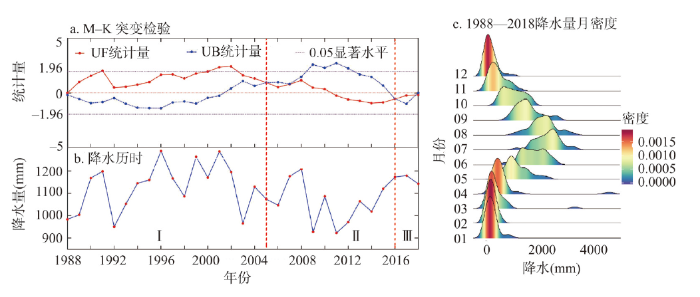
通过绘制云南省1988—2018 年降水量的Mann-Kendall 突变检验曲线、降水历时曲线及降水月密度图,定量刻画降水时间变化格局,结果如图1所示。由M-K突变检验曲线可知,1988—2018年云南省降水具有2个突变点,分别为2005年和2016年,由此可将云南省过去30 a降水划分为3个阶段,第Ⅰ阶段为1988—2004年、第Ⅱ阶段为2005—2015年、第Ⅲ阶段为2016—2018年。第Ⅰ阶段年平均降水量为1129.88 mm,各年UF值均大于0,表明此阶段内降水量为上升趋势,其中1990年、2001年、2002年,3个年份UF值大于1.96,表明其上升趋势具有显著性。第Ⅱ阶段,其年平均降水量为1055.51 mm,整个区间内UF呈下降趋势,说明在2005—2015年内云南降水为减少趋势,其中2011—2015年间UF值小于0,表明此时间段内,降水下降趋势最明显,与云南“三年连旱”时间吻合。第Ⅲ阶段,其年平均降水量为1164.57 mm,从M-K曲线趋势来看,其UF值由小于0,开始趋近0,表明第Ⅲ阶段为降水回升阶段,降水量较多且平稳。总体而言,第Ⅰ阶段,云南省降水较多,呈稳步增加的趋势。第Ⅱ阶段,云南省降水减少,且连年下降。第Ⅲ阶段,云南省降水开始稳步回升,趋于正常年份降水,为大旱后(“三年连旱”)恢复期。图1
 新窗口打开|下载原图ZIP|生成PPT
图11988—2018年云南省降水突变检验及降水月密度统计
Fig. 1The precipitation mutation test and monthly precipitation statistics in Yunnan Province from 1988 to 2018
云南降水干湿季区分明显,5—10月为湿季,降水量大且分散,11月至次年4月为干季,降水量小且集中。从云南省过去30年的降水来看,3—4月易出现降水极值,即突发极端降水。干季,降水高密度值集中,降水较为稳定,年际变化较小;湿季,高密度值较为分散,表明其降水具有很大的不确定性,年际差异大。
在空间上,取云南省1988—2004年的降水平均值,作为第Ⅰ时段的降水空间值,依次获得第Ⅱ与第Ⅲ时段的降水空间值。对3个时段两两进行差值与变化率计算,结果如图2。
图2
 新窗口打开|下载原图ZIP|生成PPT
图21988—2018年云南省降水变化的时空格局
Fig. 2Spatial and temporal patterns of precipitation changes in Yunnan Province from 1988 to 2018
第Ⅰ~Ⅱ时段内,云南省降水发生显著变化区域面积为57938.69 km2,占全省的15.07%,从空间来看,滇西北(保山市、怒江和德宏州)降水呈显著下降,滇西南(普洱市和西双版纳州)、滇东北(昭通市)的降水呈显著增加。以Ⅱ时段降水为y,Ⅰ时段降水为x,拟合两时段数量关系为y = 0.95x-35,由x ≥ 0、y ≥ 0,可知Ⅱ时段降水远高于Ⅰ时段降水,从变化率来看,95%置信椭圆内主要以负变化率为主,即以降水减少为显著变化特征;第Ⅱ~Ⅲ时段内,云南省降水发生显著变化区域面积为53190.84 km2,占全省的13.87%,在空间上,降水显著减少区较Ⅰ~Ⅱ时段内大幅下降,主要出现在滇西北的大理州及迪庆州的小部,降水显著增加区较Ⅰ~Ⅱ时段内有所上升,除滇西南(普洱市和西双版纳州)、滇东北(昭通市)等地外,在滇中滇池、抚仙湖流域出现大面积增长区域,以Ⅲ时段降水为y,Ⅱ时段为x,拟合两时段数量关系为y = 1.1x+36,由x ≥ 0、y ≥ 0可知Ⅱ时段降水量远低于Ⅲ时段内的降水,在变化率上,95%置信椭圆内主要以正变化率为主,即以降水显著增加为变化特征;第Ⅰ~Ⅲ时段内,云南省降水显著变化区域为63401.72 km2,占比为16.53%,从空间来看,显著增加区主要集中在滇西北(怒江州、保山市和德宏州)、滇西南(临沧市、普洱市和西双版纳州)、滇中(昆明与玉溪市)等地,显著下降区域出现在滇西北的迪庆州与滇东的曲靖市。以Ⅲ时段为y,Ⅰ时段为x,拟合二者数量关系为y = 1.0x-8.6,由x ≥ 0、y ≥ 0可知Ⅲ时段内的降水量略低于Ⅰ时段,在变化率上,95%置信椭圆内正负变化率均衡分布。3个时段两两拟合关系均呈线性,由线性函数图像特征可知,a愈接近1,b愈接近0,x与y的一致性越高,即降水量差异越小,3组函数中a距1的绝对值呈现Ⅱ~Ⅲ>Ⅰ~Ⅱ>Ⅰ~Ⅲ,b距0的绝对值呈现Ⅱ~Ⅲ>Ⅰ~Ⅱ>Ⅰ~Ⅲ,因此Ⅰ和Ⅲ时段的降水量一致性最高,即降水量差异最小,Ⅱ和Ⅲ时段的差异最大。当x ≥ 0、y ≥ 0时,截距b>0,与y轴相交于正半轴,b<0,与y轴相交于负半轴,即b>0时,y时段降水大于x时段降水,b<0时,y时段降水小于x时段降水。3组函数中Ⅰ~Ⅱ和Ⅰ~Ⅲ的b<0,即Ⅰ时段的降水量高于Ⅱ、Ⅲ时段,Ⅱ~Ⅲ的b>0,即Ⅲ时段降水大于Ⅱ时段。
3.2 降水格局变化对食物产量的影响及空间响应特征
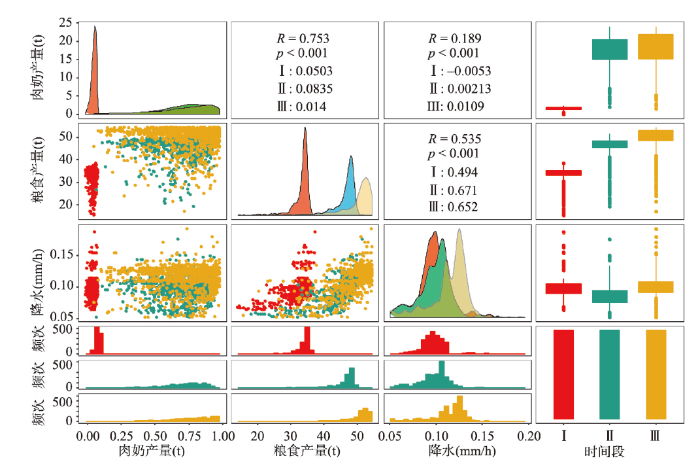
通过食物供给与产量估算公式,计算得到云南省Ⅰ、Ⅱ、Ⅲ时段内的平均粮食与肉奶产量,并提取对应时间段内的降水量。计算二者相关关系,结果如图3。图3
 新窗口打开|下载原图ZIP|生成PPT
图3降水量与食物供给的相关关系
Fig. 3Correlation between precipitation and food supply
降水与肉奶产量的相关系数为0.189,p<0.01为显著正相关,与粮食产量的相关系数为0.535,p<0.01为显著正相关。表明,降水对食物供给具有显著的影响,即总体上,呈降水增加食物产量增加,降水减少食物产量下降的趋势。但粮食产量的相关系数高于肉奶产量,表明粮食产量更易受降水影响。主要原因是,中国20世纪90年代推行“退耕还林还草”“封山育木”政策,云南作为一个山地大省,是中国退耕还林还草、封山育木的关键区域,多年退耕量居全国前列,2019年云南省人工造林面积达到 2637.08 km²,新封山育林531.92 km²,畜牧业由散养向圈养转变,同时随着云南省各地区“创文”“创卫”工作的推进,城市绿地等人造景观快速增加,逐渐使肉奶产量与草地脱钩。从相关性来看,肉奶产量总体与降水为显著正相关关系,但各时段上与降水相关性均较低,且均不显著,表明肉奶产量在各时间段内受降水的影响较小,主要为其他因子主导。粮食产量在各时段内均与降水具有良好的正相关关系,在第Ⅰ时段内相关系数为0.494、第Ⅱ时段为0.671、第Ⅲ时段为0.652,表明云南省粮食产量在各时段内均显著受降水影响,即降水是制约粮食生产的主要因子。
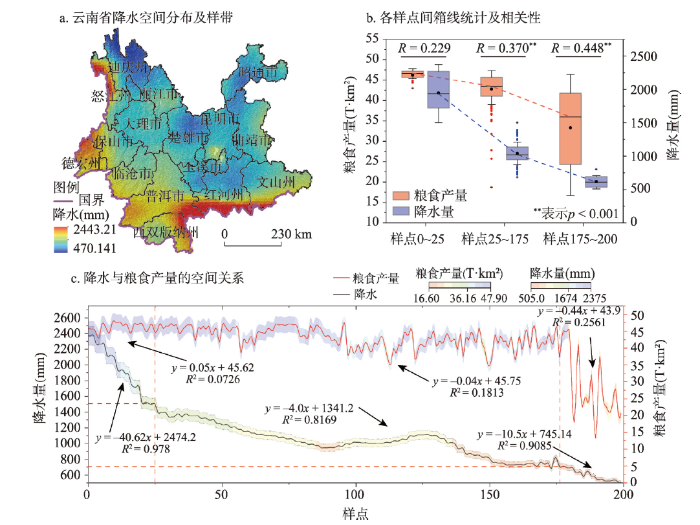
由降水极大值到极小值取一条南北向样带,由南向北涵盖全省主要降水量及梯度变化(图4a)。等间距采集样带内耕地斑块的降水与粮食产量两组数据(肉奶产量与降水相关性较弱),绘制趋势图,如图4c所示。从降水的趋势来看,在样点0~25处降水量迅速下降、25~175处缓慢下降、175后迅速下降。根据上述降水趋势将整个过程划分为样点0~25、样点25~175、样点175~200这3个阶段,对每个阶段内降水与粮食产量分别进行箱线统计和相关性分析,结果如图4b。
图4
 新窗口打开|下载原图ZIP|生成PPT
图4降水量与粮食产量的空间变化关系
Fig. 4The spatial relationship between precipitation and grain production
样点0~25,降水量拟合方程为y = -40.62x+2474.2,b小于0,为线性递减函数,粮食产量拟合方程为y = 0.05x+45.62、b>0,为线性递增函数;样点25~175,降水量拟合方程为y = -4.0x-1341.2、b<0,为线性递减函数,粮食产量为y = -0.04x+45.75、b<0,为线性递减函数;样点175~200,降水量拟合方程为y = -10x+745.14、b<0,呈线性递减,粮食产量为y = -0.44x+43.9、b<0,呈线性递减。在降水量上,斜率b呈样点25~175 >样点175~200 >样点0~25,表明降水量在0~25下降速度最快,其次为样点175~200。在粮食产量上,样点175~200下降速度最快。在相关性上,样点25~175的粮食产量与降水量为负相关关系(R = -0.229),即随降水量的迅速减少,其粮食产量增加,样点175~200的降水量与粮食产量为显著的正相关关系(R = 0.370),表明随降水量减少,其对应的粮食产量也呈下降趋势,样点175~200的粮食产量与降水量为显著正相关关系(R = 0.448),即随降水量下降,粮食产量减少。从相关系数的大小来看,样点175~200的相关系数最大,即在此阶段内,降水量与粮食产量的对应关系最好。从样点的波动来看,在降水量上样点175~200波动最小,样点0~25波动最大,在粮食产量上样点0~25最稳定,样点175~200波动最大。
从粮食产量对降水的响应特征来说:当降水量≥ 1500 mm时,降水与粮食产量相关关系变弱,降水量快速下降,粮食产量保持平稳,水分为非限制因子,说明降水量高于作物生长需水量,降水量在一定范围内减少,对粮食产量影响较小,为降水盈余带;当降水量为700~1500 mm时,降水量与粮食产量为显著正相关关系,二者变化趋势一致,水分为限制因子,说明降水量基本满足或略高于作物需水量,为降水持平带;当降水量<700 mm时,降水量与粮食产量为显著正相关关系,二者变化趋势高度一致,水分为决定性因子,说明降水量无法稳定保障作物生长的基本需水量,为降水亏缺带;从粮食产量对降水量的响应来看,盈余带粮食产量对降水响应最弱,降水量快速下降,其粮食产量保持相对平稳的增长;降水持平带内,粮食产量对降水的响应程度开始增加,二者变化趋势保持一致,降水量下降,粮食产量也呈下降趋势,但其波动幅度大于降水量;降水亏缺带内,粮食产量对降水量高度响应,降水减少,粮食产量快速下降,降水量的小幅波动,引起粮食产量的大幅响应振动。
4 讨论
4.1 降水与粮食产量的关系及作用机制
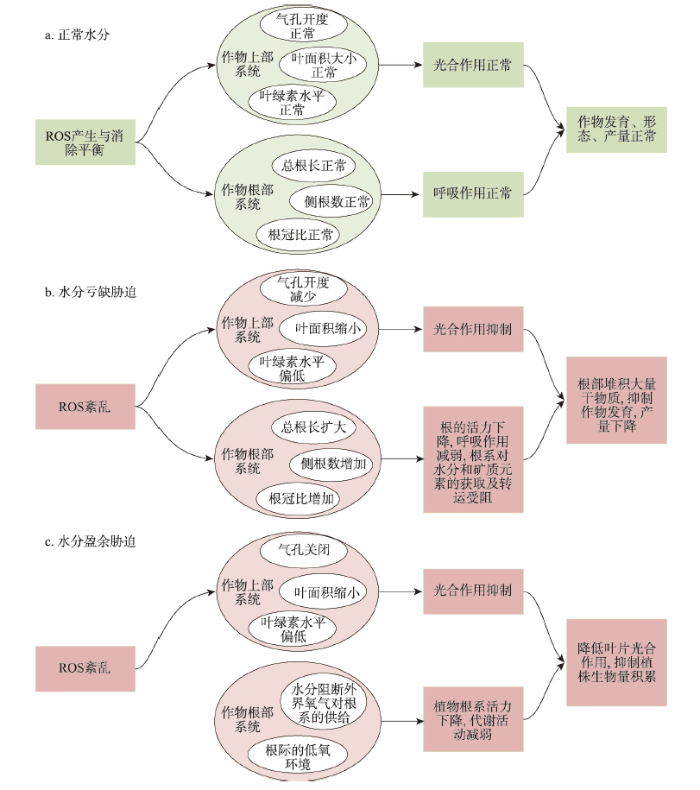
云南省的粮食作物主要以水稻、小麦与玉米为主。一般认为,正常降水条件下,适度的降水增加有助于食物产量提升。茹晓雅的研究表明在平水年小麦产量达到最优,降水需要增加45.26%[39];在水分亏缺的条件下,作物气孔等呼吸器官闭合,光合作用效率减弱,使作物减产。晁漫宁的研究表明干旱会降低小麦光合能力,增强抗氧化能力,抑制籽粒淀粉合成和积累,影响植株结实、籽粒发育和品质形成,导致产量显著下降[29],李红伟30]、杨喆等[31]分别在玉米与水稻中揭示了干旱胁迫对其产量的影响;在水分盈余条件下,作物根系与叶片被水分侵泡,水中二氧化碳浓度降低、水体透光性变差,从而使作物光合速率下降,进而使作物减产。韩芳玉的研究揭示了降水量与水稻产量呈倒“U”型关系,随着降水量的增加,水稻产量先增加,达到一定值后开始下降[40],姬静华等[41]、李彩霞[42]等在玉米和小麦中证明了降水盈余会造成减产。相关研究[32]揭示了ROS(活性氧)对作物产量具有显著影响,通过相关成果,总结了水分对作物产量的作用机制,如图5所示。图5
 新窗口打开|下载原图ZIP|生成PPT
图5水分对作物产量的作用机制
Fig. 5The mechanism of precipitation on crop yield
本文研究结论显示,在云南省降水与粮食产量分为3个响应阶段:降水在1500 mm以上,降水与粮食产量为不显著相关关系,降水过多导致粮食轻微减产,与朱海霞等[43]、王吉等[44]在试验田中的结论相似;在700~1500 mm降水段,降水与粮食产量为显著正相关关系,与茹晓雅等[39]、张金艳等[45]的研究结论一致;在700 mm降水以下,粮食产量大幅波动,且快速下降,降水过少导致粮食减产,与齐伟[46]、李红伟的研究结果相似[30]。目前的研究,主要通过大田实验和控制实验,揭示了单一作物在单一水分条件下产量的变化特征。对大尺度、大范围内粮食作物与多梯度降水之间关系,研究还不足。本文揭示了云南省省域尺度上降水变化与粮食产量之间的关系,阐述了降水盈余、降水持平、降水亏缺多个降水梯度下粮食产量的变化,既是目前研究的补充也是其拓展。
降水是决定粮食产量的基础性因子,同时在全球气候变化背景下,也是众多影响粮食产量因子中最不稳定的因子之一。本文阐述了降水盈余、降水持平、降水亏缺多个降水梯度下粮食产量的变化,但在3个梯度下,其他影响粮食产量的因子是如何变化的?如土壤肥力、劳动力、耕作技术、地形地貌、气温、农业政策等,是本文有待解决的问题之一。
全球气候变化背景下,降水愈发的不稳定,如何科学有效地预测、模拟未来降水趋势,是一个亟待学界解决的关键科学问题。本文目前只对1988—2018年云南省的降水特征进行了表征,通过降水历时曲线与变化特征划分了Ⅰ(1988—2004年)降水丰沛期、Ⅱ(2005—2015年)降水偏少期、Ⅲ(2016—2018年)降水恢复期,Ⅰ、Ⅱ阶段时间在10 a以上,而Ⅲ阶段为3 a。第Ⅱ阶段年平均降水量1055.51 mm,第Ⅲ阶段为1164.57 mm,显著高于第Ⅱ阶段,因此将其划分为降水恢复期,从降水量上来看,第Ⅲ阶段表征出了此阶段的降水特征,但3年的时间是否足够表征降水的特征与规律还待讨论。进一步而言,识别降水特征与规律的最小时间尺度、空间尺度是多少?科学依据与机理问题还需学界深入探讨。
4.2 云南省粮食产量对降水的响应特征及空间区划
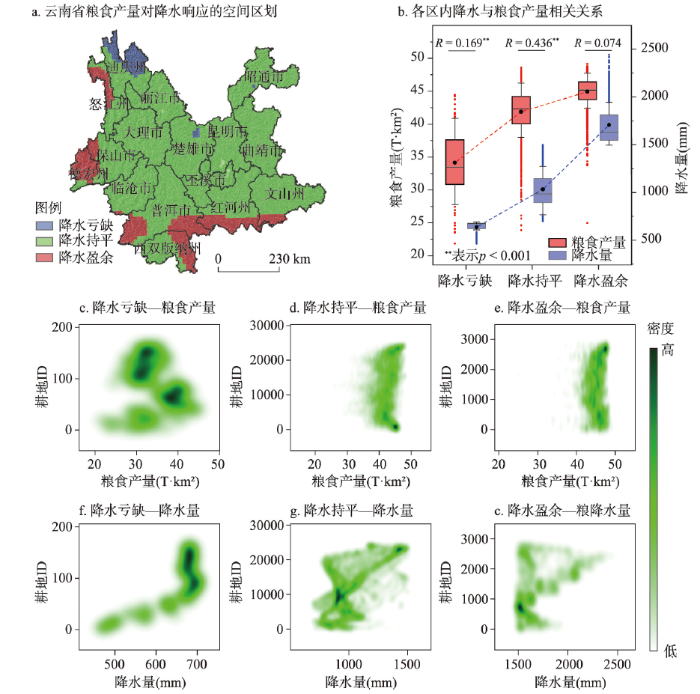
地理区划是地理学研究的传统和核心内容[47],自1929年竺可桢先生发表《中国气候区域论》之始、后黄秉维与李旭旦两位先生于1940年和1947年开展了中国植被区划与中国地理区域划分等工作[48],使中国地理区划进入正轨。目前全国性区划方案、部门区划方案、区域区划方案已较完备,成果显著,在促进地理学科发展,服务国家社会经济建设做出了重要贡献[49]。全球气候变化背景下,降水格局发生了剧烈变化。识别粮食产量对降水响应的区域特征,是保障区域粮食安全的关键科学问题,但关于降水与粮食产量相关区划的报道,目前还较为少见[47,48,49]。故本文在样带研究的基础上,尺度上推,进行云南省粮食产量对降水响应的空间区划,以便为今后粮食供给安全、农业发展、粮食主产、稳产区划定、以及抗旱救灾等工作提供支持。根据样带上粮食产量对降水量的响应特征,将全省区划为降水亏缺(< 700 mm)、降水持平(700~1500 mm)、降水盈余(≥ 1500 mm),结果如图6a。为了论证尺度上推的可靠性,提取各分区内耕地斑块的粮食产量及其对应的降水量(图6c),绘制箱线图及对每个区间内的降水与粮食产量进行相关分析,结果如图6b。由图6b可知从降水亏缺—降水持平—降水盈余,粮食产量和降水量均为增加趋势,从亏缺到持平,降水量增加趋势弱于粮食产量,表明粮食产量响应强度高于降水增加幅度;从持平到亏缺,降水增加幅度达到最大,但粮食产量增幅较为平缓,表明粮食对降水量的响应较弱;在相关关系上,降水亏缺与降水持平阶段内粮食产量与降水量均为显著正相关关系(相关系数分别为0.169、0.436,p<0.001),在降水盈余内为非显著弱相关,表明在降水亏缺与盈余区内,降水是制约粮食产量的限制因子,而在降水盈余区为非制约因子;从数据的形态来看,在降水亏缺区,降水波动最小,而粮食产量波动达到最大,表明降水微小波动便会引起粮食产量的大幅波动,在降水盈余区则相反,降水量大幅波动,但粮食产量较为平稳,表明降水量剧烈变化不会引起粮食产量的显著变化。综上,各区划内粮食产量与降水量的响应关系及数据形态,与样带内相似,表明从样带尺度上推至全省尺度,符合样带内得出的相关结论。
图6
 新窗口打开|下载原图ZIP|生成PPT
图6云南省食物产量对降水响应的空间区划
Fig. 6Spatial division of grain output in Yunnan Province in response to precipitation
降水亏缺区面积为10834.83 km²,占比为2.8%,区内水分是作物生产的绝对限制因子,水分下降导致作物产量快速、大幅波动下降,对干旱最为敏感,是干旱灾害爆发的主要区域。故本区降水格局变化将对粮食产量产生显著影响,建议在区内修建蓄水与灌溉设施,削弱降水敏感性,保障粮食生产,同时加强降水监测,预警干旱,提前调配粮食,保证区内食物供给;降水持平区为323191.68 km²,占比为84.3%,区内水分是作物生产的限制因子,水分与作物产量变化速度基本一致,且幅度较小,其作物产量与降水量相对稳定,在降水偏多年份产量增加,偏少年份产量下降,但其变化幅度较小。本区是云南省的粮食主产区,建议一方面培育耐旱粮食品种,减少降水对粮食产量的限制,另一方面修建水利设施保证干旱年作物灌溉;降水盈余区为49469.57 km²,占比为12.9%,区内水分是作物产量的非限制因子,水分与粮食产量不具有相关关系,降水量大幅波动,粮食产量变化较小,但本区降水量≥ 1500 mm,易爆发洪涝灾害,故应警惕洪涝灾害对粮食产量的影响。从面积来看,降水持平区占全省面积的绝大部,其降水量与粮食产量为正相关关系,但粮食产量对降水的响应强度低于降水亏缺区,即降水量的波动不会引起粮食产量的剧烈波动,因此降水持平区是保障云南省粮食产量稳定的主要区域。
作物生长具有明显的时间段,但本文并未使用作物生长季对应的降水来进行区划。主要原因是在山地立体气候下识别作物生长季是十分困难的,如哈尼梯田河谷区作物为一年两季,而在水平距离60 km的半山地区为一年一季,河谷区作物生长季是半山区的2倍。再如西双版纳、德宏、红河、临沧、文山及昆明、玉溪、曲靖等部分区域,作物可达一年2~3季。换言之,在云南部分区域,水热条件可以满足作物全年生长,也是云南被称为“植物王国”的原因之一。因此在云南使用年平均降水较生长季降水更合适,但由于生长季难以识别,使本文难以讨论二者的差异。
5 结论
(1)在时间格局上,过去30年云南省降水在2005年和2016年2个时间点上发生了突变,划分为3个降水时段,分别为Ⅰ(1988—2004年)降水丰沛期、Ⅱ(2005—2015年)降水偏少期、Ⅲ(2016—2018年)降水恢复期。(2)在空间格局上,第Ⅰ~Ⅱ时段内,云南省降水发生显著变化区域面积为57938.69 km2,占全省的15.07%,滇西北降水呈显著下降,滇西南、滇东北显著增加;第Ⅱ~Ⅲ时段内,云南省降水发生显著变化区域面积为53190.84 km2,占全省的13.87%,滇西北的大理及迪庆州的小部显著下降,滇西南、东北和滇中抚仙湖流域显著增加;第Ⅰ~Ⅲ时段内,云南省降水显著变化区域为63401.72 km2,占比为16.53%,显著增加区主要集中在滇西北、滇西南、滇中等地,显著下降区域出现在滇西北的迪庆州与滇东的曲靖市。
(3)在降水与食物产量关系上,降水与肉奶产量的相关系数为0.189,且p<0.01,降水与粮食产量的相关系数为0.535,且p<0.01。表明降水对食物产量具有显著的影响。
(4)在食物产量对降水格局变化的空间响应特征上,分为3个响应带:当降水量 ≥1500 mm,降水量与粮食产量为不显著弱相关关系,降水量快速下降,粮食产量保持稳定,为降水盈余带;当降水量700~1500 mm,降水量与粮食产量为显著正相关关系,降水量与粮食产量为缓慢、小幅下降趋势,为降水持平带;当降水< 700 mm,降水量与粮食产量为显著正相关关系,降水量小幅下降,粮食产量大幅波动下降,为降水亏缺带。
(5)云南省粮食产量对降水响应的空间区划:降水亏缺区面积为10834.83 km²,占比为2.8%,区内水分是作物生产的绝对限制因子;降水持平区为323191.68 km²,占比为84.3%,区内水分是作物生产的限制因子;降水盈余区为49469.57 km²,占比为12.9%,区内水分是作物产量的非限制因子。
参考文献 原文顺序
文献年度倒序
文中引用次数倒序
被引期刊影响因子
[本文引用: 1]
DOI:10.1029/2018EF000995URL [本文引用: 2]
DOI:10.1111/nyas.13912PMID:29943456 [本文引用: 1]

Droughts and heatwaves cause agricultural loss, forest mortality, and drinking water scarcity, especially when they occur simultaneously as combined events. Their predicted increase in recurrence and intensity poses serious threats to future food security. Still today, the knowledge of how droughts and heatwaves start and evolve remains limited, and so does our understanding of how climate change may affect them. Droughts and heatwaves have been suggested to intensify and propagate via land-atmosphere feedbacks. However, a global capacity to observe these processes is still lacking, and climate and forecast models are immature when it comes to representing the influences of land on temperature and rainfall. Key open questions remain in our goal to uncover the real importance of these feedbacks: What is the impact of the extreme meteorological conditions on ecosystem evaporation? How do these anomalies regulate the atmospheric boundary layer state (event self-intensification) and contribute to the inflow of heat and moisture to other regions (event self-propagation)? Can this knowledge on the role of land feedbacks, when available, be exploited to develop geo-engineering mitigation strategies that prevent these events from aggravating during their early stages? The goal of our perspective is not to present a convincing answer to these questions, but to assess the scientific progress to date, while highlighting new and innovative avenues to keep advancing our understanding in the future.© 2018 The Authors. Annals of the New York Academy of Sciences published by Wiley Periodicals, Inc. on behalf of The New York Academy of Sciences.
DOI:10.1073/pnas.1804387115PMID:30584094 [本文引用: 1]
Food security relies on the resilience of staple food crops to climatic variability and extremes, but the climate resilience of European wheat is unknown. A diversity of responses to disturbance is considered a key determinant of resilience. The capacity of a sole crop genotype to perform well under climatic variability is limited; therefore, a set of cultivars with diverse responses to weather conditions critical to crop yield is required. Here, we show a decline in the response diversity of wheat in farmers' fields in most European countries after 2002-2009 based on 101,000 cultivar yield observations. Similar responses to weather were identified in cultivar trials among central European countries and southern European countries. A response diversity hotspot appeared in the trials in Slovakia, while response diversity "deserts" were identified in Czechia and Germany and for durum wheat in southern Europe. Positive responses to abundant precipitation were lacking. This assessment suggests that current breeding programs and cultivar selection practices do not sufficiently prepare for climatic uncertainty and variability. Consequently, the demand for climate resilience of staple food crops such as wheat must be better articulated. Assessments and communication of response diversity enable collective learning across supply chains. Increased awareness could foster governance of resilience through research and breeding programs, incentives, and regulation.Copyright © 2019 the Author(s). Published by PNAS.
DOI:10.1126/science.aat1871PMID:29880673 [本文引用: 1]
DOI:10.1126/science.aaz5492URL [本文引用: 1]
URL [本文引用: 1]
DOI:10.1038/s41586-019-1558-8URL [本文引用: 1]
PMID:32576822 [本文引用: 3]
Both seasonal and annual mean precipitation and evaporation influence patterns of water availability impacting society and ecosystems. Existing global climate studies rarely consider such patterns from non-parametric statistical standpoint. Here, we employ a non-parametric analysis framework to analyze seasonal hydroclimatic regimes by classifying global land regions into nine regimes using late 20th century precipitation means and seasonality. These regimes are used to assess implications for water availability due to concomitant changes in mean and seasonal precipitation and evaporation changes using CMIP5 model future climate projections. Out of 9 regimes, 4 show increased precipitation variation, while 5 show decreased evaporation variation coupled with increasing mean precipitation and evaporation. Increases in projected seasonal precipitation variation in already highly variable precipitation regimes gives rise to a pattern of "seasonally variable regimes becoming more variable". Regimes with low seasonality in precipitation, instead, experience increased wet season precipitation.
URL [本文引用: 2]
DOI:10.1038/s41586-019-1495-6URL [本文引用: 1]
DOI:10.1038/s41586-019-1712-3URL [本文引用: 1]
URL [本文引用: 1]
DOI:10.1038/nclimate1716URL [本文引用: 1]
DOI:10.1175/JCLI-D-12-00543.1URL [本文引用: 1]
URL [本文引用: 1]
DOI:10.1002/2013EF000159URL [本文引用: 1]
DOI:10.1002/jgrd.v118.6URL [本文引用: 1]
DOI:10.1007/s10584-013-0705-8URL [本文引用: 1]
[本文引用: 1]
[本文引用: 1]
[本文引用: 1]
[本文引用: 1]
[本文引用: 1]
[本文引用: 1]
DOI:10.1029/95GL03586URL [本文引用: 1]
[本文引用: 1]
[本文引用: 1]
DOI:10.1098/rstb.2010.0158URL [本文引用: 1]
DOI:10.1038/nclimate2153URL [本文引用: 1]
PMID:12481139 [本文引用: 1]
Ecosystem responses to increased variability in rainfall, a prediction of general circulation models, were assessed in native grassland by reducing storm frequency and increasing rainfall quantity per storm during a 4-year experiment. More extreme rainfall patterns, without concurrent changes in total rainfall quantity, increased temporal variability in soil moisture and plant species diversity. However, carbon cycling processes such as soil CO2 flux, CO2 uptake by the dominant grasses, and aboveground net primary productivity (ANPP) were reduced, and ANPP was more responsive to soil moisture variability than to mean soil water content. Our results show that projected increases in rainfall variability can rapidly alter key carbon cycling processes and plant community composition, independent of changes in total precipitation.
[本文引用: 1]
[本文引用: 1]
[本文引用: 2]
[本文引用: 2]
[本文引用: 3]
[本文引用: 3]
[本文引用: 2]
[本文引用: 2]
[本文引用: 2]
[本文引用: 2]
[本文引用: 1]
[本文引用: 1]
[本文引用: 1]
[本文引用: 1]
[本文引用: 1]
[本文引用: 1]
[本文引用: 1]
[本文引用: 1]
DOI:10.18306/dlkxjz.2017.12.012 [本文引用: 1]
The city of Ordos is in the central part of the ecotone between agriculture and animal husbandry in northern China, and the rapid economic development brings great pressure to the ecological environment. Ecosystem services and their inter-related changes in Ordos have great significance for the sustainable development of ecosystems in this semi-arid area. This study calculated the four key ecosystem services of food supply, carbon storage, water production, and soil conservation in Ordos in 2000 and 2010, and used the relevant analysis to explore the tradeoffs and synergies between the four services at the 30 m × 30 m grid scale and introduced the rose map. The relationship between the ecosystem services of different land-use types was analyzed. The results show that there is a synergistic relationship between water production and soil conservation, a synergistic relationship between food supply and soil conservation, a tradeoff relationship between soil conservation and food supply, and a tradeoff relationship between food supply and carbon storage. The eastern agricultural area of Ordos contains most of the hotspots of multiple ecosystem services. The production of water reduced as soil conservation and carbon storage improved in cultivated land and woodland, while in the grassland the four ecosystem services increased simultaneously.
[本文引用: 1]
[本文引用: 2]
[本文引用: 2]
[本文引用: 1]
[本文引用: 1]
[本文引用: 1]
[本文引用: 1]
[本文引用: 1]
[本文引用: 1]
[本文引用: 1]
[本文引用: 1]
[本文引用: 1]
[本文引用: 1]
[本文引用: 1]
[本文引用: 1]
PMID:20387422 [本文引用: 1]
A pot experiment was conducted to study the effects of simulated moderate drought in whole growth period on the grain yield and root physiological traits of drought-tolerant maize variety JK-628 and drought-sensitive maize variety ND-95. Compared with the control, the grain yield of JK-628 and ND-95 under the stress of moderate drought was decreased by 33.7% and 62.3%, respectively. Under drought stress, the root biomass of the two varieties decreased, with the maximum value appeared ahead. The root/shoot ratio of JK-628 increased at early growth stage but decreased at late growth stage, while that of ND-95 increased all along. ND-95 had a larger decrement of root activity than JK-628. The root SOD activity in drought-stress plants was higher in prophase but lower in anaphase, compared with that in the control, and the time of SOD activity begun to lower was later for JK-628 than for ND-95. The root MDA content in drought-stress plants was increased, and the increment was much higher for ND-95 than for JK-628. In addition, the root soluble protein content in drought-stress plants was decreased, and ND-95 had a larger decrement than JK-628. In a word, under drought stress, the root activity, SOD activity, and soluble protein content of JK-628 were higher than those of ND-95, which could slow down the root aging process and prolong the root functional period, possibly being one of the important factors of getting high yield of drought-tolerant maize under drought stress.
PMID:20387422 [本文引用: 1]
DOI:10.11821/dlxb201702001 [本文引用: 2]
The comprehensive regionalization of Chinese human geography is based on the rules governing regional differentiation of Chinese physical geography factors. Based on regional differences and similarities in human factors, this study divides the whole country into two levels of relatively independent, complete and organically linked human geographic units. As a fundamental, comprehensive, cutting-edge, practical and important task, the comprehensive regionalization of human geography highlights the characteristics, regional and sub-regional features, complexity and variety of spatial differences between factors of Chinese human geography. It is capable of promoting the development of human geography based on local conditions, providing basic scientific support to national and local development strategies, such as the Belt and Road Strategy, new urbanization and environmental awareness, and creating a sound geopolitical environment in key areas. Using results from existing physical and human geography zoning studies, and in accordance with the principles of synthesis, dominant factors, the relative consistency of the natural environment, the relative consistency of economic and social development, the consistency of the regional cultural landscape, the continuity of spatial distribution and the integrity of county-level administrative divisions, and taking as its basis the division of human geography into 10 major factors (natural condition, the economy, population, culture, ethnicity, agriculture, transportation, urbanization, the settlement landscape and administrative divisions), this paper constructs an index system for the comprehensive regionalization of Chinese human geography through a combination of top-down and bottom-up zoning and spatial clustering analysis. In this study, Chinese human geography is divided into eight regions (first level) and 66 sub-regions (second level). The eight human geography regions are (I) Northeast China, (II) North China, (III) East China, (IV) Central China, (V) South China, (VI) Northwest China, (VII) Southwest China, and (VIII) Qinghai and Tibet. This zoning proposal fills gaps in studies involving the non-comprehensive regionalization of Chinese human geography. Each human geography region and sub-region has different topographical, climatic, ecological, population, urbanization, economic development, settlement landscape, regional cultural and ethno-religious attributes. This proposal on the comprehensive regionalization of Chinese human geography dovetails closely with previous studies on comprehensive regionalization in Chinese physical geography, Chinese economic zoning, and Chinese agriculture zoning. It shows that, under the dual roles of nature and humans, there are certain rules of regional differentiation that govern the comprehensive regionalization of Chinese human geography.
[本文引用: 2]
DOI:10.18306/dlkxjz.2016.01.007 [本文引用: 2]
Stony deserts are widely distributed in the arid and extremely arid regions in China. However, an integrated physical regionalization of these stony deserts has not been carried out. Based on a comprehensive analysis of the relationship between the characteristics and formation mechanism of stony deserts, the main features of stony deserts can be summarized as follows: land surface is covered with gravels; surface layer has porous thin desert crust, below which red brown compact and gypsum layers are found. Vegetation mainly includes arid and extremely arid shrubs and semi-shrubs with low coverage. Stony deserts only exist in arid and extremely arid regions with aridity index greater than 4. Based on the regional differentiation of characteristics and formation conditions of stony deserts, this study selected indicators reflecting aridity and temperature, regional geology and geomorphology, and formation conditions and types of surface materials to classify the stony deserts into three first-level regions (temperate arid and extremely arid region, warm temperate arid and extremely arid region, and arid and extremely arid region in northern Tibetan Plateau); nine second-level regions (according to regional geological and topographical features), and 19 third-level regions (based on regional formation conditions and types of surface materials). Further division can be made based on regional differentiation of soils and vegetation.
[本文引用: 2]
[本文引用: 2]
[本文引用: 2]
