 ,, 曾坚天津大学建筑学院,天津 300072
Spatial relationship of urban development to land surface temperature in three cities of southern Fujian
SHEN Zhongjian,, ZENG JianSchool of Architecture, Tianjin University, Tianjin 300072, China收稿日期:2020-03-3修回日期:2020-10-18网络出版日期:2021-03-25
| 基金资助: |
Received:2020-03-3Revised:2020-10-18Online:2021-03-25
| Fund supported: |
作者简介 About authors
沈中健(1991-), 男, 山东济南人, 博士生, 研究方向为城市热环境。E-mail:

摘要
关键词:
Abstract
Keywords:
PDF (7747KB)元数据多维度评价相关文章导出EndNote|Ris|Bibtex收藏本文
本文引用格式
沈中健, 曾坚. 闽南三市城镇发展与地表温度的空间关系. 地理学报[J], 2021, 76(3): 566-583 doi:10.11821/dlxb202103006
SHEN Zhongjian, ZENG Jian.
1 引言
中国正经历快速城镇化阶段,预计至2030年,中国城镇化率将达到70%[1]。城镇发展及其引发的城镇下垫面物理属性变化与人为热排放的集中,是城镇热环境恶化及热岛效应产生的重要原因[2,3]。目前,热岛效应已成为影响生态环境、居民健康及可持续发展的重大环境问题[4]。深入分析城镇发展对热环境空间特征及动态变化的影响,对探索缓解热岛效应的策略、优化城镇热环境质量具有重要意义。当前,相关****开展了大量关于城镇发展与热环境关系的研究,主要依托气象观测与遥感技术,多以地表温度(Land Surface Temperature, LST)作为热环境的量化指标[5]。研究内容多聚焦于以下2个方面:① 以不透水地表表征城镇土地覆盖,分析城镇发展引发的土地变化对LST的影响。众多****建立了不透水地表盖度[6,7]、归一化建筑指数[8,9]及不透水地表景观格局指数[10,11]与LST的数学模型,或探讨LST空间分布对不透水地表演变的响应规律[12,13,14,15];② 探讨人类活动等城镇发展的社会经济要素与LST的关系。相关研究分析了人口密度[16]、经济发展状况[8, 17]、人类活动的强度[18]及类型[19,20]对LST的影响机制。
然而,不透水地表、人口、经济等单一地理要素难以综合反映城镇发展的空间信息,量化城镇发展的指标应包含经济、人口、土地3个方面的内容[21]。星载传感器观测到的夜间灯光(Nighttime Light, NTL)是从网格单元的尺度上准确、综合反映城镇发展的良好数据源[21,22]。众多分析表明,NTL的像元值与经济密度[21, 23]、人口密度[24,25]、城镇化水平[26]、能源消耗[26,27]等评估城镇发展的各类指标显著相关,经济活动强度越高、人口密度越大、建设用地越多的区域,NTL越大。有些****运用夜间灯光数据,从全国范围[28,29]、区域尺度[30,31]及城市尺度[8, 32-33],探讨了城镇发展与LST分布的关系。这些研究表明,伴随城镇发展,城镇的热岛效应对周边区域的升温作用加强,城镇边缘地区地表升温最显著。
尽管当前研究取得了众多成果,但仍存在以下问题:① 研究方法多以相关性分析、普通线性回归分析为主,忽视了城镇发展与LST的空间异质性,难以深入探讨城镇发展的空间变异性对LST的影响;② 研究区域多局限于单个地区,缺乏对不同地区的比较分析。不同地区城镇的空间格局及发展状况并不一致,对单个地区的分析结果难以为不同地区的宏观决策提供支撑[32]。
厦门、漳州、泉州三市位于闽南地区,山地与丘陵面积占比超过80%,热环境特征较为典型。三市地理区位及环境相似,但城镇发展差异明显。本文运用1996—2017年的Landsat遥感数据及夜间灯光数据,以NTL表征城镇发展状况,旨在比较分析厦门、漳州、泉州三市城镇发展与LST的空间关系,运用总体耦合态势模型、协调性模型揭示城镇发展与LST的时空耦合规律,利用标准差椭圆、双变量空间自相关及景观指数探讨城镇发展对LST的驱动机制,以期为闽南地区城镇的热环境优化提供科学依据。
2 研究区概况与研究方法
2.1 研究区概况
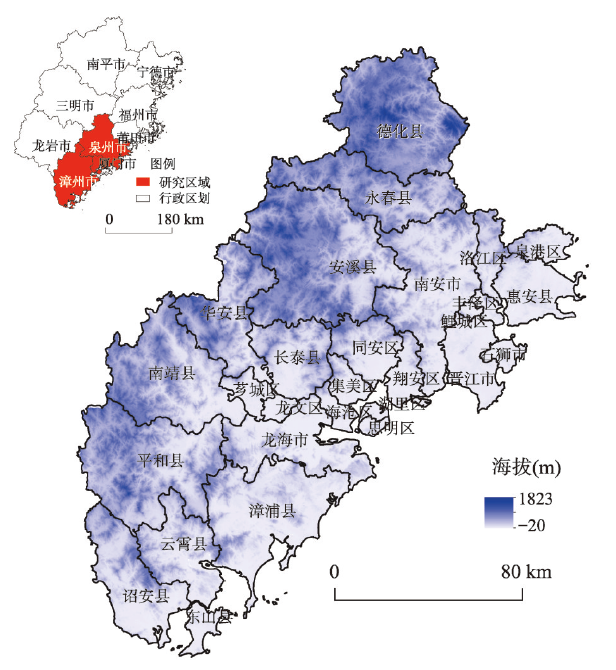
闽南三市(未包含泉州市金门县)面积总计25314.39 km2(图1),冬季温暖湿润,夏季炎热潮湿。该地区是海峡西岸经济区及海上丝绸之路的重要节点。至2017年底,三市的常住人口与地区生产总值分别占福建全省的45.0%和47.5%。区域城镇化水平已由2002年的35%增长至2017年的69%[34]。在快速发展的同时,该地区热岛效应也日益凸显。据统计,1996年该地区城镇年平均气温仅比乡村高1.41°C,至2017年城镇年平均气温已比乡村高6.08°C,热岛效应成为该地区亟待解决的环境问题。三市虽然地理环境相似,但城镇发展差异明显。至2017年底,厦门、漳州、泉州的城镇化水平分别为89.01%、56.20%、64.50%[34],这种巨大差异,必然导致城镇发展对LST的影响机制有所不同。图1
 新窗口打开|下载原图ZIP|生成PPT
图1研究区示意图
Fig. 1Schematic map of Xiamen, Zhangzhou and Quanzhou of southern Fujian, China
2.2 数据处理
2.2.1 数据来源及预处理 本文选取覆盖闽南三市1996年、2002年、2007年、2012年、2017年的清晰少云、成像于9月、10月的Landsat遥感影像,数据来自美国USGS数据中心(https://glovis.usgs.gov/)。1996年、2002年、2007年的遥感影像为Landsat 5 TM数据,2012年的遥感影像为Landsat 7 ETM+数据,2017年的遥感影像为Landsat 8 OLI与TIRS数据。运用ENVI 5.3软件进行几何校正、大气校正、图像镶嵌、研究区裁剪等预处理,并通过ENVI 5.3软件中的支持向量机(Support Vector Machine),采用目视解译与监督分类将研究区域分为耕地、林地、草地、水域、建设用地、裸地。本文采用1996年、2002年、2007年、2012年的DMSP/OLS夜间灯光数据,及2017年的NPP/VIIRS夜间灯光数据,两种夜间灯光数据均来自美国国家地球物理数据中心网站(http://www.ngdc.noaa.gov/),参考相关研究的方法[30, 35]对数据进行融合去噪、切割、辐射校正等处理。
由于DMSP/OLS夜间灯光数据的像元值具有饱和效应,为使DMSP/OLS与NPP/VIIRS数据能有效衔接,本文参考已有成果[31]对1996—2012年的DMSP/OLS夜间灯光数据进行去饱和处理,方法如下:
式中:NDVI为归一化植被指数,NIR、RED分别为Landsat影像中的近红外波段、红波段;NTLNor为归一化的DMSP/OLS夜间灯光像元值,VANUI为去饱和处理后的夜间灯光像元值。对1996—2012年的VANUI与2017年的NTL数值进行相关性检验,结果显示,5个时段的数据均符合正态分布,相邻两时段的相关系数普遍大于0.885,相关系数均通过了0.01水平的显著性检验。时间序列的VANUI与NTL数据经一阶差分分析,属于一阶单整序列,且在0.01水平上显著。这表明去饱和处理后的DMSP/OLS数据与NPP/VIIRS数据在时间上有连续性,可以结合使用。
2.2.2 地表温度反演 通过Landsat影像中的热红外波段,运用辐射传输方程(Radiative Transfer Equation, RTE)[20, 36]反演地表温度(LST)。
首先,通过NDVI计算地表比辐射率,计算方法[18]如下:
式中:PV为混合像元中植被的比例,NDVI为归一化植被指数,NDVImin与NDVImax分别为裸露土壤与植被的归一化植被指数值,取值分别为0.05与0.70[18];εv、εb、εw分别为自然表面、建设用地、水体的比辐射率,其中自然表面即植被与裸露土壤组成的混合像元,建设用地表面即不透水地表与植被、裸露土壤的混合像元[8, 10]。
其次,根据Landsat数据中的热红外波段的像元值计算相应的辐射亮度(Lλ),进而计算亮度温度(Ts),最后将亮度温度转化成地表温度,计算过程如下:
式中:DN为热红外波段的像元值,ML与AL分别对热红外波段进行辐射定标的斜率与增益;B(Ts)为黑体辐射亮度;Latm↑与Latm↓分别为大气向上与向下的辐射亮度;τ为大气透过率;Ts为地表温度;K1、K2为定标常数。其中Latm↑、Latm↓、τ是在NASA提供的网站(http://atmcorr.gsfc.nasa.gov/)中,通过输入成像时间、中心经纬度等相关参数后计算得出,ML、AL、K1、K2均从遥感影像的头文件(MTL)中查得。
通过研究区域内厦门站、同安站、晋江站等12个气象站实测的对应日期的LST,验证反演结果的精确性,数据来自于中国地面气候资料日值数据库(http://data.cma.cn/)。检验发现反演的LST与实测的LST的绝对误差均小于4.65 oC,相对误差均小于15%。此外,反演的LST与实测的LST的pearson相关系数均大于0.792,所有相关性分析结果均通过了0.01水平的显著性检验。因此,反演结果符合后续研究的精度要求。
通过均值/标准差法[37],根据LST将研究区域分为高温区、次高温区、中温区、次低温区、低温区5个热力等级,高温、次高温区定义为热岛区[38]。
2.2.3 数据网格化 综合考虑夜间灯光数据的空间分辨率及相关研究成果[8, 30-33],本文借助ArcGIS 10.2软件,将研究区分为1 km×1 km的网格单元,NTL图像中所有像元的中心点即网格单元的中心,提取每个网格单元中的NTL,并计算网格单元中LST的平均值,作为该网格单元的LST,以实现两种数据的统一,并采用极差标准化方法[12, 37]对LST、NTL进行归一化处理。
2.3 研究方法
2.3.1 总体耦合态势模型 总体耦合态势模型通过比较不同空间变量加权中心的距离及移动方向的相似性,以衡量空间变量演化的耦合态势[14, 39]。空间变量的加权中心距离越近,两者加权中心的移动轨迹夹角越小,则两者的总体耦合性越高。总体耦合态势模型的计算方法[14]如下:式中:Ct为NTL或LST的加权中心;Xt、Yt分别为t时期加权中心的坐标;mti是t时期像元i中LST或NTL的数值;Xti、Yti分别为t时期像元i的中心坐标;L为t时期NTL与LST加权中心的空间距离;XLST,t、YLST,t与XNTL,t、YNTL,t分别为t时期LST与NTL加权中心的坐标;α为某一时段内LST与NTL加权中心的移动轨迹的夹角;?XLST、?YLST与?XNTL、?YNTL分别表示与上一时期相比,LST与NTL加权中心坐标的变化值。
2.3.2 协调性模型 协调性模型能反映两个变量发展演化的协调程度[40,41]。本文引入协调性模型,以定量反映城镇发展与LST变化的协调水平。计算方法[39]如下:
式中:O为NTL、LST变化的协调系数;UR、TR分别为NTL、LST的年平均增长率。由公式(11)可以看出,0 ≤ O ≤ 1,O越接近1,表示UR、TR两者变化协调性越高,O越接近0,表示UR、TR两者变化的协调性越低[42]。若0.8 < O ≤ 1.0,则UR、TR协调度较强,属于协调类型;若0.5 < O ≤ 0.8,则两者协调度一般,属于磨合类型;若0 ≤ O ≤ 0.5,则两者协调度较弱,属于拮抗类型[42]。
2.3.3 标准差椭圆 标准差椭圆(Standard Deviation Ellipse)是揭示空间要素分布及变化的空间统计方法[7]。以NTL为x轴变量、LST为y轴变量,构建两者的二维散点图。利用标准差椭圆识别相对集聚的散点区域,综合描述NTL与LST的相关关系[7, 36]:
式中:P为标准差椭圆的中心坐标;
2.3.4 双变量空间自相关 空间自相关分析可揭示空间变量的分布是否与邻近的变量有关,分为全局空间自相关与局部空间自相关。Anselin提出的双变量空间自相关分析(Bivariate Moran's I)[43],可以有效反映两类变量空间分布的关联与依赖特征[44]。
本文采用OpenGeoDa软件进行双变量空间自相关分析。首先,运用双变量全局空间自相关(Bivariate Global Moran's I)分析LST对NTL的空间响应规律,计算方法[44]为:
式中:I为双变量全局空间自相关指数,即总体上空间变量x与y空间分布的相关性;n为空间单元的总数;Wij为通过K邻接关系法建立的空间权重矩阵;xi、yj分别为自变量、因变量在空间单元i、j的观测值;S2为所有样本的方差。
双变量局部空间自相关(Bivariate Local Moran's I)的计算方法[44]为:
式中:Ii即空间单元i的自变量与因变量的局部空间关系;zi、zj是空间单元i、j观测值的方差标准化值。基于Ii可形成4种聚类模式,并由此组成的LISA(Local Indications of Spatial Association)分布图能直观地呈现局部区域中自变量与因变量的集聚性及分异特征。聚类模式可分为HH(High-High)聚集,即空间单元i的自变量与邻近单元j的因变量值均较大;LL(Low-Low)聚集,即空间单元i的自变量与邻近单元j的因变量值均较小;LH(Low-High)聚集,即空间单元i的自变量值较小而邻近单元j的因变量值较大;HL(High-Low)聚集,即空间单元i的自变量值较大而邻近单元j的因变量值较小。
2.3.5 景观指数 景观指数能定量反映景观的结构组成与空间配置,是浓缩景观格局信息的指标。本文运用Fragstats软件计算景观指数,以定量探讨NTL与LST双变量局部空间自相关的HH、LL、LH、HL4种聚类模式的空间格局特征。
综合考虑数据的空间分辨率,并参考相关文献[7, 38, 45],选取4类景观指数,具体包括景观类型比例(Percentage of Landscape, PLAND),反映某类景观斑块的比例丰度;最大斑块指数(Largest Patch Index, LPI),反映景观斑块的优势度与破碎度;聚集度指数(Aggregation Index, AI),反映景观斑块的聚集程度;平均形状指数(Mean Shape Index, MSI),反映景观斑块形状的复杂程度。
3 结果分析
3.1 城镇发展与地表温度的时空耦合关系
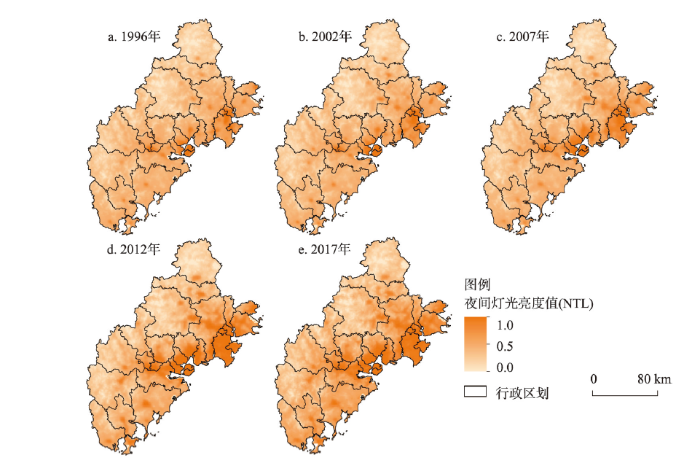
3.1.1 城镇发展与热环境空间分布格局 研究获取了闽南三市NTL图像(图2),以反映城镇发展的状况。1996—2017年三市NTL的高值区持续蔓延,城镇扩张明显;此外,相邻的NTL高值区不断打破行政边界,逐渐合并为更大的NTL高值区。表明三市内部及之间的城镇联系不断加强,厦、漳、泉一体化的发展趋势凸显。图2
 新窗口打开|下载原图ZIP|生成PPT
图21996—2017年闽南三市夜间灯光图像
Fig. 2The NTL map of three cities of southern Fujian during 1996-2017
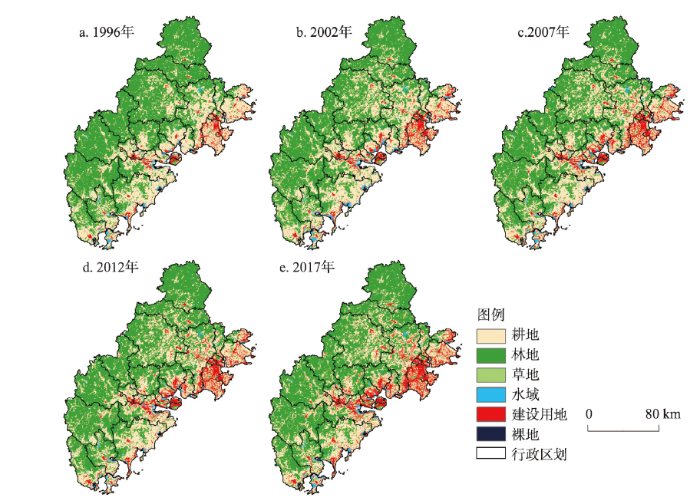
闽南三市热环境时空分布如图3所示,结合目视解译与监督分类生成的土地利用分布图(图4)可知,1996—2017年三市热岛区均由裸露的地表向城镇地区转移。1996—2002年由于城镇发展有限,城镇的热岛效应不突出。高温区多分布在耕地或沙滩地带,由于地表裸露,受太阳辐射升温迅速,LST较高;2007—2017年,随着城镇的扩张,LST的城乡差异凸显,热岛区在城镇蔓延;而大片集中的耕地、裸地,随着城镇LST的上升,其热力等级反而降为中温区、次高温区。这一现象在漳州东南部尤为明显。2012年和2017年,NTL高值区在该地区扩张明显,城镇热岛效应显著加强,相比之下,城镇以外大片耕地的热岛效应减弱,高温区、次高温区向城镇地区转移。但由于城镇范围仍然较小,因此,该地区的高温区及次高温区呈现减少的态势。
图3
 新窗口打开|下载原图ZIP|生成PPT
图31996—2017年闽南三市热力等级分布图
Fig. 3Thermal distribution of three cities of southern Fujian during 1996-2017
图4
 新窗口打开|下载原图ZIP|生成PPT
图41996—2017年闽南三市土地利用分类
Fig. 4Land use classification map of three cities of southern Fujian during 1996-2017
总之,LST的分布与城镇发展格局及地形制约有关。闽南三市山地丘陵众多,西部内陆高山起伏,交通不畅,城镇发展受限。城镇发展用地局限于东部群山环抱的沿海平原,这些地区交通便利,区位优势明显,易于开发建设,人为活动集中,热量排放较大。而周边的群山阻滞了热量向外扩散,地形限制下的高强度的人为活动,推动了城镇及周边区域LST上升。
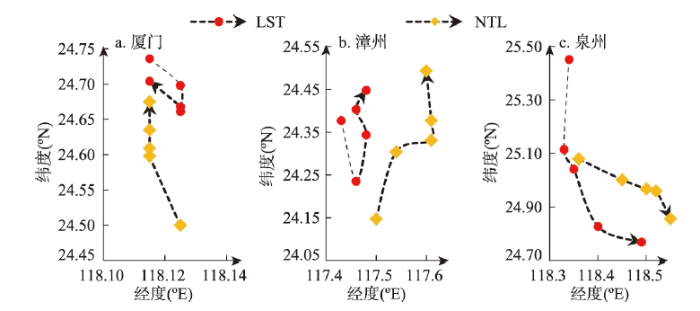
3.1.2 城镇发展与地表温度的时空耦合态势 本文通过总体耦合态势模型衡量闽南三市城镇发展与LST变化的耦合程度(图5、表1)。总体来看,1996—2017年间,三市的NTL与LST加权中心距离、移动方向的夹角总体呈减少趋势,总体耦合态势不断加强。
图5
 新窗口打开|下载原图ZIP|生成PPT
图51996—2017年闽南三市厦门、漳州、泉州地表温度与夜间灯光加权中心移动轨迹
Fig. 5The moving trajectories of weight centers for LST and NTL in Xiamen, Zhangzhou, Quanzhou of southern Fujian during 1996-2017
Tab. 1
表1
表11996—2017年闽南三市地表温度与夜间灯光总体耦合分析
Tab. 1
| 年份 | 加权中心距离(km) | 时段 | 加权中心移动方向夹角(o) | ||||
|---|---|---|---|---|---|---|---|
| 厦门 | 漳州 | 泉州 | 厦门 | 漳州 | 泉州 | ||
| 1996 | 26.160 | 26.371 | 41.259 | 1996—2002 | 178.393 | 153.699 | 47.076 |
| 2002 | 11.136 | 11.193 | 17.521 | 2002—2007 | 148.105 | 55.592 | 40.772 |
| 2007 | 5.792 | 12.913 | 17.843 | 2007—2012 | 11.625 | 18.155 | 49.796 |
| 2012 | 3.666 | 15.213 | 19.256 | 2012—2017 | 21.862 | 24.213 | 40.802 |
| 2017 | 3.223 | 12.879 | 11.441 | 1996—2017 | 178.337 | 17.430 | 25.995 |
新窗口打开|下载CSV
然而三市NTL与LST的移动轨迹并不一致。厦门NTL与LST加权中心呈“相向而行”态势,1996—2017年厦门城区由本岛向西北方向的岛外扩展,带动NTL的加权中心向西北移动。1996—2012年热岛区由岛外的大片裸地向本岛及岛外沿海的城区转移,因此,LST的加权中心总体向南移动。2012—2017年随着岛外地区城镇发展,热岛效应也相应凸显,LST的加权中心也向西北方向的岛外移动;漳州NTL与LST加权中心“前期逆向而行,后期同向而行”。漳州城镇主要沿九龙江流域自西南向东北的入海口延伸,带动了NTL加权中心向东北移动。1996—2002年城镇发展对LST加权中心的变化影响有限。随着东南部的耕地增加,使LST上升,LST的加权中心向东南移动。2002—2017年,随着城镇热岛效应的凸显,城镇不断向东北延伸,这驱使着LST加权中心向东北移动;泉州由于东南部的晋江市、石狮市等地城镇的迅速扩张,带动NTL的加权中心始终向东南移动,东南地区城镇的迅速发展导致LST加权中心向东南转移,NTL与LST加权中心始终“同向而行”。
3.1.3 城镇发展与地表温度的空间协调特征 本文运用协调性模型,分别计算1990—2002年、2002—2007年、2007—2012年、2012—2017年4个时段,NTL与LST年平均增长率的协调度,并根据表2将研究区分为6种协调类型(图6)。
Tab. 2
表2
表2夜间灯光与地表温度协调变化类型划分
Tab. 2
| 类型 | 形成条件 | 意义 |
|---|---|---|
| 协调增进型 | 0.8 < O ≤ 1.0, UR ≈ TR >0 | NTL、LST协调增长, 城镇发展与LST呈协同增进状态 |
| 拮抗升温超前型 | 0 ≤ O < 0.5, TR > UR | NTL与LST变化协调度较弱, LST上升超前于城镇发展 |
| 磨合升温超前型 | 0.5 ≤ O < 0.8, TR > UR | NTL与LST变化处于勉强协调, LST上升超前于城镇发展 |
| 磨合升温滞后型 | 0.5 ≤ O < 0.8, TR < UR | NTL与LST变化处于勉强协调, LST上升滞后于城镇发展 |
| 拮抗升温滞后型 | 0 ≤ O < 0.5, TR < UR | NTL与LST变化协调度较弱, LST上升滞后于城镇发展 |
| 协调减退型 | 0.8 <O ≤ 1.0, UR ≈ TR < 0 | NTL、LST协调下降, 城镇发展与LST呈协同减退状态 |
新窗口打开|下载CSV
图6
 新窗口打开|下载原图ZIP|生成PPT
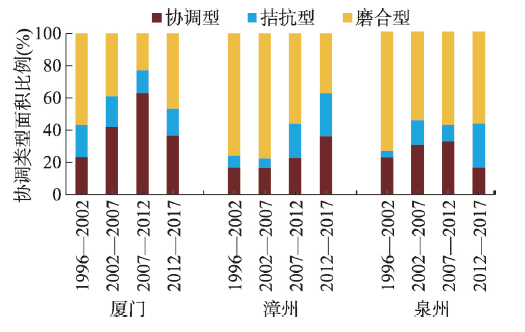
图61996—2017年闽南三市夜间灯光与地表温度变化的协调类型比例
Fig. 6Proportions of coordination categories for change of NTL and LST in the three cities of southern Fujian during 1996-2017
结合图3、图4、图6可知,在研究期间内,协调增进型多为城镇发展迅速的新增城镇用地,NTL、LST升幅均较大。在城镇中心区,城镇扩张与地表升温幅度均较为有限,因而NTL、LST的增长速率基本协同;协调减退型主要是地形复杂、远离城镇的林地、水域,这些地区地表热环境属性稳定,不易升温,且城镇开发建设难度大,人为活动较少。相较于其他地区,NTL、LST呈现协同下降现象。
随着原有的城镇向外围扩张,新增城镇区域经历了“升温滞后—协调型—升温超前—协调型”的转化过程,这一现象在厦门岛外等中心城区外围最为明显。城镇发展早期,NTL对LST的影响存在滞后性。新增城镇地区NTL增速较大,但城镇热岛效应并不显著,LST上升缓慢,呈拮抗升温滞后型或磨合升温滞后型;随着城镇热岛效应凸显,LST升速增加,NTL与LST呈现升幅较大的协调增进型;城镇发展后期,NTL对LST的影响呈超前性。NTL已接近“饱和状态”,上升缓慢,而连续集中的城镇形成了更强的热岛效应,LST上升速率高于NTL,因而呈现升温超前的现象;至城镇发展末期,NTL与LST增速有限,两者呈现升幅较小的协调增进型。
此外,西部内陆的部分林地受周边城镇的热岛效应或气候变化的影响,LST上升稍强,也呈现升温超前的现象;部分林地、水体及零散的城镇用地,尽管NTL有所上升,但本身或周边自然地表密集,有效遏制了LST上升,因而呈现升温滞后的现象。
本文计算了三市各时段协调类型的比例(图7)。从时间序列上来看,三市NTL与LST变化的协调型比例均呈增长趋势。比较来看,厦门三种协调类型的比例相对均衡,协调型较多;漳州、泉州磨合型普遍占优势地位,协调型较少。这表明厦门城镇发展与LST变化的协调度较高,而泉州、漳州略弱。这是由于厦门以城区及耕地为主,空间结构简单,且城镇发展迅速,因而LST变化更易受城镇发展影响;漳州、泉州空间结构复杂,LST变化易受大片连续的林地等自然地表影响,城镇发展对LST变化的干预有限。
图7
 新窗口打开|下载原图ZIP|生成PPT
图71996—2017年闽南三市夜间灯光与地表温度变化的协调类型分布图
Fig. 7The coordination categories distribution for change of NTL and LST in three cities of southern Fujian during 1996-2017
3.2 城镇发展对地表温度的影响机制
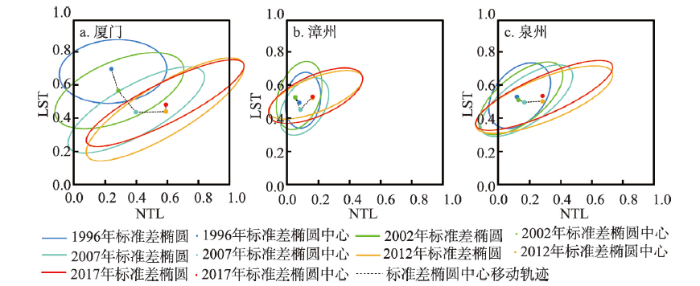
3.2.1 城镇发展与地表温度的相关关系 本文运用SPSS软件计算NTL与LST相关系数,并通过标准差椭圆分析NTL与LST二维散点的空间特征变化(图8、表3)。结果显示,1996—2017年,三市的NTL与LST均呈显著正相关性。这表明NTL增加会导致LST上升。这是由于城镇发展导致城镇下垫面的物理属性改变,大量不透水地表代替了原有的绿地、水域等自然地表,城区建筑物阻滞了通风散热,生产、生活的集聚导致了人为热排放的集中,在多种因素的综合作用下,LST上升。图8
 新窗口打开|下载原图ZIP|生成PPT
图81996—2017年闽南三市厦门、漳州、泉州NTL与LST标准差椭圆空间特征
Fig. 8Spatial characteristic of standard deviation ellipse for NTL and LST in Xiamen, Zhangzhou, and Quanzhou of southern Fujian during 1996-2017
Tab. 3
表3
表31996—2017年闽南三市夜间灯光与地表温度的相关参数
Tab. 3
| 地区 | 年份 | 相关系数 | 标准差椭圆参数 | |||
|---|---|---|---|---|---|---|
| 中心坐标(NTL, LST) | 方向性 | 离散性 | 方位角(o) | |||
| 厦门 | 1996 | 0.093*** | (0.239, 0.695) | 1.705 | 0.587 | 85.187 |
| 2002 | 0.545*** | (0.283, 0.565) | 2.285 | 0.438 | 67.655 | |
| 2007 | 0.762*** | (0.396, 0.435) | 3.090 | 0.324 | 60.893 | |
| 2012 | 0.824*** | (0.590, 0.439) | 3.572 | 0.280 | 59.003 | |
| 2017 | 0.859*** | (0.590, 0.481) | 4.388 | 0.228 | 63.135 | |
| 漳州 | 1996 | 0.149*** | (0.083, 0.501) | 1.526 | 0.615 | 8.685 |
| 2002 | 0.321*** | (0.058, 0.533) | 1.694 | 0.590 | 18.936 | |
| 2007 | 0.423*** | (0.091, 0.459) | 1.620 | 0.617 | 34.274 | |
| 2012 | 0.661*** | (0.168, 0.537) | 2.925 | 0.342 | 68.511 | |
| 2017 | 0.665*** | (0.168, 0.531) | 2.493 | 0.401 | 66.010 | |
| 泉州 | 1996 | 0.386*** | (0.120, 0.531) | 1.511 | 0.662 | 40.253 |
| 2002 | 0.643*** | (0.128, 0.513) | 2.179 | 0.459 | 51.330 | |
| 2007 | 0.696*** | (0.168, 0.498) | 2.464 | 0.406 | 54.827 | |
| 2012 | 0.736*** | (0.285, 0.504) | 3.430 | 0.292 | 68.086 | |
| 2017 | 0.806*** | (0.285, 0.534) | 3.913 | 0.256 | 65.969 | |
新窗口打开|下载CSV
随年份增长,三市NTL与LST的相关系数逐渐增加。标准差椭圆的中心均沿x轴(NTL)向高值移动,沿y轴(LST)移动趋势不一致;标准差椭圆的方向性逐渐增大,离散性逐渐减小。三市标准差椭圆方位角变化趋势不一,但均逐渐增加或减少至60o~65o左右。上述现象表明,三市NTL对LST的正向影响逐渐明确,三市LST对NTL变化的灵敏度趋于统一。这与城镇发展对LST影响作用的变化有关。研究初期城镇规模有限,空间分布零散、破碎,LST更易受其他因素的影响,NTL对LST变化的影响较弱,因此,标准差椭圆方向性较小。由于城镇的热岛效应不明显,而裸露地表等NTL较低而LST较高的区域较多,因此,标准差椭圆中心坐标的NTL较小而LST较大。研究后期,随着城镇发展,城镇逐渐蔓延、合并,生产、生活持续集中,这导致城镇发展对LST的影响加强,且正向影响逐渐明确,标准差椭圆方向性随之增加,伴随城镇的热岛效应加强,标准差椭圆的中心坐标向x轴(NTL)的高值移动。
1996—2017年厦门标准差椭圆的方向性较大,离散性较小,标准差椭圆中心明显沿y轴(LST)向低值移动,这表明NTL对LST的正向影响显著,两者二维散点的线性关系明显加强。漳州、泉州标准差椭圆的方向性较小,离散性较大,标准差椭圆中心在y轴(LST)的变动不明显,这说明漳州、泉州NTL对LST的正向影响较弱,两者二维散点线性关系增强的趋势不明显。这与三市的城镇发展状况及城镇空间格局有关,厦门城镇发展迅速,城镇分布范围较大,人口与产业相对密集,LST变化更易受NTL的影响,且城镇发展对LST变化的影响作用明显加强。因此,NTL与LST二维散点分布的方向性较大,逐渐趋向线性分布。而漳州、泉州城镇分布较少,城镇发展相对缓慢,城镇范围有限,人口、产业分布相对松散,LST变化仍易受耕地、林地等其他因素的影响,城镇发展对LST的正向影响有限,且加强的趋势不明显。
3.2.2 城镇发展与地表温度的全局空间关联 运用OpenGeoDa软件计算三市NTL与LST的双变量Moran's I(表4)。结果显示,三市的NTL与LST均呈显著的空间正相关性,即局部地区NTL增加会导致周边地区LST上升。这是由于一方面,不同地区因LST的差异而产生热量交换[12],局部地区NTL的增加带动该地区LST的上升,该地区的热量进而向周边地区传递,最终导致周边地区LST上升。1996—2017年三市NTL与LST的双变量Moran's I值逐渐增加,即NTL对邻近地区LST的正向影响加强。这是由于城镇规模有所扩大,空间分布逐渐连续集中,城镇本身的热岛效应加强,对周围环境的升温作用显著。此外,由于城镇分布更为广阔、密集,局部地区城镇发展对LST的影响加强,这导致城镇本身对周边热环境的“溢出效应”明显[46],进而对周边地区LST的影响日益显著。
Tab. 4
表4
表41996—2017年闽南三市地表温度与夜间灯光的双变量Moran's I统计值
Tab. 4
| 年份 | 厦门 | 漳州 | 泉州 |
|---|---|---|---|
| 1996 | 0.084(7.573)*** | 0.141(35.654)*** | 0.373(82.939)*** |
| 2002 | 0.541(45.293)*** | 0.310(80.156)*** | 0.636(128.881)*** |
| 2007 | 0.746(55.677)*** | 0.409(103.164)*** | 0.687(131.404)*** |
| 2012 | 0.809(58.262)*** | 0.641(135.030)*** | 0.721(135.594)*** |
| 2017 | 0.844(61.455)*** | 0.594(145.593)*** | 0.759(154.359)*** |
新窗口打开|下载CSV
比较来看,三市的双变量Moran's I及变化差异明显。厦门双变量Moran's I升幅最明显,1996年其Moran's I最小,仅0.084,泉州最大,漳州次之。2002年,厦门的Moran's I已大于漳州。2007—2017年Moran's I呈现“厦门>泉州>漳州”的格局。究其原因,NTL对LST分布的作用与城镇发展格局有关。1996—2017年间,三市的城镇发展差异较大。结合图2、图4可以看出,1996年三市的城镇规模均较为有限。根据对土地利用比例的统计,1996年,厦门、漳州、泉州建设用地比例分别为8.32%、2.58%、4.95%。因此,LST的分布受NTL的影响较小。特别是厦门,城区主要集中在本岛,但热岛效应不突出,而热岛区主要在岛外的耕地,因此,NTL与LST的空间关联性较弱。随着城镇的扩张,城镇发展对LST空间分布的影响加强。至2017年,厦门、漳州、泉州建设用地比例分别为31.51%、8.09%、13.52%。厦门城区扩张更明显,城镇化进程较快,城镇分布连续集中,对周边地区LST的影响显著加强,因而Moran's I升幅最大。泉州、漳州升幅相似,但泉州城镇发展更快,城镇化水平及城镇分布范围大于漳州,城镇发展对地表温度的影响较强,因此Moran's I略高于漳州。
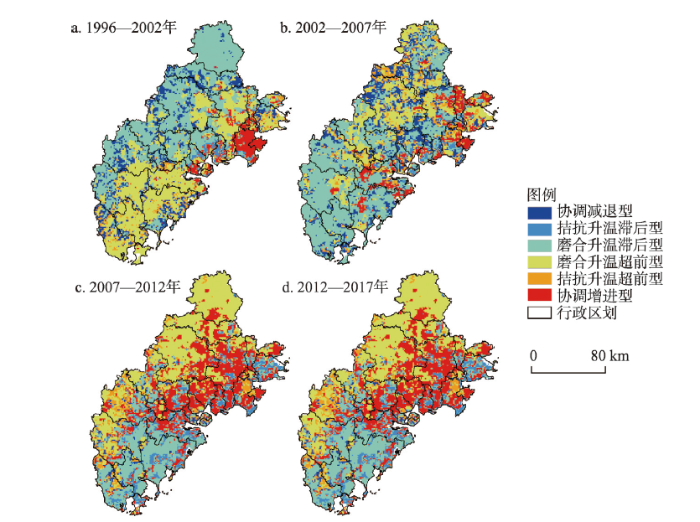
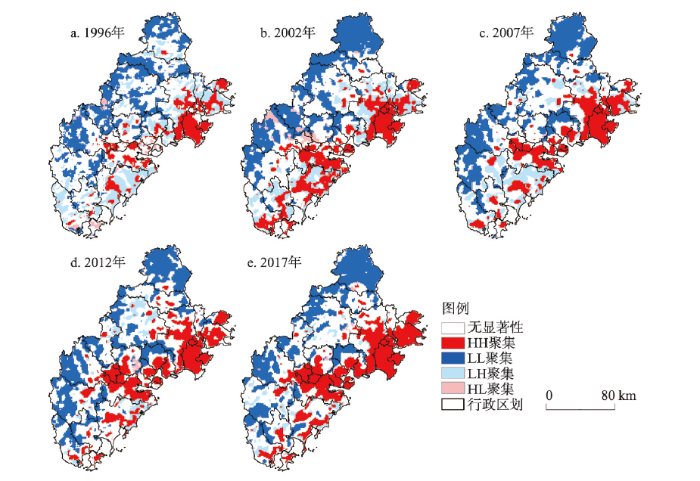
3.2.3 城镇发展与地表温度的局部空间关联 本文运用OpenGeoDa软件进行双变量局部空间自相关分析,生成LISA分布图(图9)。HH聚集多集中在东部近海的城区及内陆的主要乡镇,其扩张与集中的趋势明显;LL聚集多出现在内陆的山林地带及大型湖泊等,分布相对稳定;LH聚集多分布在HH聚集区周边,多为大片集中的裸地、耕地,及工业区。尽管NTL较低,但由于太阳辐射或人为热排放的影响,LST也较高;HL聚集较少,多为城镇边缘区及破碎的城镇地区,尽管NTL较大,但由于周边自然地表的“冷岛效应”,本身LST较低。
图9
 新窗口打开|下载原图ZIP|生成PPT
图91996—2017年闽南三市夜间灯光与地表温度的双变量LISA分布图
Fig. 9Bivariate LISA distribution of NTL and LST for the three cities of southern Fujian during 1996-2017
本文计算了闽南三市NTL与LST的HH、LL、LH、HL聚集的景观指数(图10),结果表明:三市HH、LL聚集的PLAND不断增加,而LH、HL聚集的PLAND、LPI、AI则持续下降。这是由于城镇发展导致NTL对LST空间溢出效应加强,两者的高值区、低值区逐渐重叠。城镇扩张引发城镇LST上升,进而使HH聚集增加,相对而言,城镇外围地区的LST下降,特别是部分耕地、裸地转化为LL聚集。因此,HH、LL聚集增多;与此同时,原本呈LH聚集的大片连续耕地、裸地被城镇侵占、分割,相比于城镇,其热岛效应逐渐减弱。原本呈HL聚集的城镇地区,因本身扩张或邻近城镇的热岛效应,LST也相应上升。这导致HL、LH聚集的斑块逐渐收缩、趋于破碎。
图10
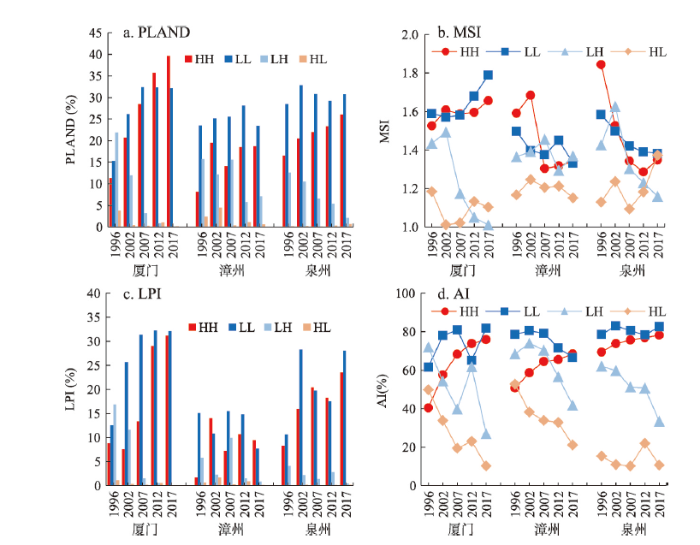 新窗口打开|下载原图ZIP|生成PPT
图101996—2017年闽南三市夜间灯光与地表温度聚集模式的景观指数PLAND、MSI、LPI及AI
Fig. 10Landscape indices such as PLAND, MSI, LPI and AI of NTL and LST aggregation in the three cities of southern Fujian during 1996-2017
值得注意的是,三市的HH聚集的LPI、AI持续增加,这与城镇蔓延的同时也逐渐集聚有关。不同城镇沿交通干线扩展的同时也逐渐连接、合并,LST较高的区域随之也逐渐集中,这导致HH聚集斑块不断连接,形成更大的斑块。这一现象在厦门、漳州市辖区、石狮、晋江等地尤为明显。上述地区地势平坦,交通便利,易于开发建设。该地区作为衔接三市的关键区域,在厦门、漳州、泉州同城化发展趋势的带动下,城镇合并的趋势凸显,进而带动本地及周边地区LST上升,HH聚集逐渐融为一体,连片发展及向外“溢出”的趋势明显。
1996—2017年,厦门HH、LL聚集的PLAND、LPI普遍较高,且4类景观指数均有明显的增幅,而HL、LH聚集的PLAND、AI降幅最明显。这表明HH、LL聚集的景观优势度较大,形状日益复杂,聚集的趋势显著,而HL、LH聚集斑块收缩与破碎的趋势明显;漳州、泉州4种聚类模式的景观格局相似,HH、LL聚集的MSI均不断下降,斑块形状趋于规整。漳州HH、LL聚集的PLAND、LPI最小,LH、HL聚集的PLAND相对较大。泉州HH、LL聚集AI较高,斑块更加集中,这归因于三市城镇发展格局的差异。厦门城区主要由本岛向岛外扩展,城区空间结构单一、规整,主要分布于本岛及岛外沿海地区,且耕地、裸地较少,因此,NTL与LST均呈现“东南高、西北低”的态势,两者的聚类模式逐渐以HH、LL为主。漳州城镇发展缓慢,城镇面积有限且分布破碎,城镇与林地等自然地表的空间格局复杂多变,NTL对LST的影响较弱。因此,HH、LL聚集斑块比例较小,分布破碎。相比于漳州,泉州城镇地区主要集中在东南沿海地区,而内陆地区以林地为主,城镇较少且LST较低,因此,HH、LL聚集斑块相对集中。
4 结论与讨论
4.1 结论
本文基于Landsat遥感数据及夜间灯光数据,探讨了闽南三市城镇发展与地表温度的空间关系,得出以下结论:(1)闽南三市夜间灯光与地表温度的空间分布呈现出与地形、区位等因素的空间耦合性。西部内陆的高海拔地区,林地分布密集,地表温度较低,而在东部沿海的平原上城镇集中,地表温度较高。
(2)1996—2017年闽南三市热岛区均由裸露的地表向城镇地区转移。夜间灯光与地表温度的总体耦合态势不断加强。厦门夜间灯光与地表温度加权中心“相向而行”,漳州两者呈“前期逆向而行,后期同向而行”的态势,泉州两者始终“同向而行”。
(3)研究期内,新增城镇区域普遍呈现“升温滞后—协调型—升温超前—协调型”的转化过程。城镇发展早期,夜间灯光对地表温度的影响存在滞后性。城镇发展后期,夜间灯光对地表温度的影响呈超前性。三市的协调型比例逐渐增加。厦门协调型较多,漳州、泉州协调型较少。
(4)闽南三市的夜间灯光与地表温度的相关系数、双变量Moran's I均为正且显著,并逐渐增加。这表明两者呈显著正相关性及空间正相关性,即本地区城镇的发展,会导致本地区及周边地区地表温度升高,且夜间灯光对地表温度的正向影响逐渐加强。夜间灯光与地表温度的HH、LL聚集逐渐增加。HH集聚不断集中,连片趋势明显。
(5)厦门夜间灯光与地表温度的相关系数、双变量Moran's I较大,协调型较多,城镇发展对地表温度的影响最显著。漳州、泉州相关系数、双变量Moran's I较小,协调型较少,城镇发展对地表温度影响有限。
4.2 讨论
本文分析了夜间灯光与地表温度的空间关系,在一定程度上揭示了闽南三市城镇发展对地表温度的影响机制。研究发现,城镇发展对地表温度的影响作用有明显的地域差异,这反映出城镇发展对地表温度的影响作用,受其本身经济、人口、土地等因素的综合影响。厦门城镇发展迅速,城区分布广,空间结构简单,城乡差异较少,城镇发展对地表温度的影响显著;漳州、泉州空间结构复杂,城镇发展缓慢,地表温度变化易受其他因素的影响,城镇发展对地表温度的影响相对有限;泉州城镇发展对地表温度的影响高于漳州,漳州城镇发展水平较低,城镇发展对LST影响最弱。然而,本文仍存在不足之处。分析城镇发展与地表温度关系的最佳时间尺度值得探讨[14,15]。由于地表温度变化复杂、基础研究数据的可获取性有限等现实问题,本文采用的截面数据的时间分辨率未必是最适宜的,后续研究应在多个时间尺度的比较分析中,寻求最适宜的时间尺度。此外,本文仅以夜间灯光表征城镇发展,探讨地表温度对其的空间响应,这不够全面。城镇发展不仅是二维平面上的扩张与强化,也包括城镇建设用地功能的转换及三维空间形态的演变[13, 16],未来的研究可以将上述因素纳入到分析中,以形成更全面、合理的研究结果。
参考文献 原文顺序
文献年度倒序
文中引用次数倒序
被引期刊影响因子
[本文引用: 1]
[本文引用: 1]
[本文引用: 1]
[本文引用: 1]
[本文引用: 1]
DOI:10.1038/s41586-018-0411-9URLPMID:30089903 [本文引用: 1]

Land change is a cause and consequence of global environmental change(1,2). Changes in land use and land cover considerably alter the Earth's energy balance and biogeochemical cycles, which contributes to climate change and-in turn-affects land surface properties and the provision of ecosystem services(1-4). However, quantification of global land change is lacking. Here we analyse 35 years' worth of satellite data and provide a comprehensive record of global land-change dynamics during the period 1982-2016. We show that-contrary to the prevailing view that forest area has declined globally(5)-tree cover has increased by 2.24 million km(2) (+7.1% relative to the 1982 level). This overall net gain is the result of a net loss in the tropics being outweighed by a net gain in the extratropics. Global bare ground cover has decreased by 1.16 million km(2) (-3.1%), most notably in agricultural regions in Asia. Of all land changes, 60% are associated with direct human activities and 40% with indirect drivers such as climate change. Land-use change exhibits regional dominance, including tropical deforestation and agricultural expansion, temperate reforestation or afforestation, cropland intensification and urbanization. Consistently across all climate domains, montane systems have gained tree cover and many arid and semi-arid ecosystems have lost vegetation cover. The mapped land changes and the driver attributions reflect a human-dominated Earth system. The dataset we developed may be used to improve the modelling of land-use changes, biogeochemical cycles and vegetation-climate interactions to advance our understanding of global environmental change(1-4,6).
[本文引用: 1]
[本文引用: 1]
[本文引用: 1]
[本文引用: 3]
[本文引用: 3]
[本文引用: 5]
[本文引用: 1]
[本文引用: 2]
DOI:10.1007/s10661-018-6787-zURLPMID:29934727 [本文引用: 1]
A city is a mixed ecosystem of nature, economy, and society and is simultaneously transforming natural areas and adapting to nature. Urbanization causes the population to expand rapidly, leading to rapid expansions of scale. Consequently, the proportions of impermeable surfaces (ISs) and greenspaces (GSs) change drastically, which has a considerable influence on the urban thermal environment. The aim of this study was to research the effects of spatio-temporal landscape patterns on land surface temperature (LST) and between GS and IS in the city of Xi'an using the urban-rural gradient, the moving split-window algorithm (MSA), multiple grid resolutions, and landscape metrics based on three-phase Landsat data. The results showed that there was a significantly positively correlated with IS density and significantly negatively correlated with the GS density from the urban center to rural areas. Over the past 25 years, the main urban area of Xi'an has expanded by nearly 6.2 times its initial size. The correlation between IS density and LST increased with increasing grid size, and the correlation between GS density and LST increased with decreasing grid size. Thus, LST is highly sensitive to the ISs and GSs at particular grid sizes. The correlation coefficients of the ISs and GSs with LST increased with decreasing grid size during 1992-2016. Hence, the LST was less sensitive to IS and the GS densities in conjunction with larger grid sizes. The class area (CA) and the landscape shape index (LSI) of the ISs were significantly positively correlated with the LST, whereas the CA and largest patch index (LPI) of the GSs were negatively correlated with the LST. The LST of the ISs in 1992, 2006, and 2016 were 1.6, 1.8, and 3.9 degrees C higher, respectively, than those of the GSs, indicating that GSs are important to lowering urban LSTs. Therefore, the government and urban planning departments should consider optimizing the spatial patterns of ISs and GSs to fully exploit the cooling effect of optimally configured GSs, which would be conducive to the sustainable development of the urban ecological environment.
[本文引用: 3]
[本文引用: 3]
[本文引用: 2]
[本文引用: 2]
[本文引用: 4]
[本文引用: 2]
[本文引用: 2]
[本文引用: 2]
[本文引用: 1]
[本文引用: 1]
[本文引用: 3]
[本文引用: 1]
[本文引用: 1]
[本文引用: 2]
[本文引用: 3]
[本文引用: 3]
[本文引用: 1]
[本文引用: 1]
[本文引用: 1]
[本文引用: 1]
[本文引用: 1]
[本文引用: 1]
[本文引用: 1]
[本文引用: 2]
[本文引用: 2]
[本文引用: 1]
[本文引用: 1]
[本文引用: 1]
[本文引用: 1]
[本文引用: 3]
[本文引用: 3]
DOI:10.1016/j.envpol.2019.03.113URLPMID:30965544 [本文引用: 2]
Rapid urbanization, which is closely related to economic growth, human health, and micro-climate, has resulted in a considerable amount of anthropogenic heat emissions. The lack of estimation data on long-term anthropogenic heat emissions is a great concern in climate and urban flux research. This study estimated the annual average anthropogenic heat fluxes (AHFs) in Beijing-Tianjin-Hebei region in China between 1995 and 2015 on the basis of multisource remote sensing images and ancillary data. Anthropogenic heat emissions from different sources (e.g., industries, buildings, transportation, and human metabolism) were also estimated to analyze the composition of AHFs. The spatiotemporal dynamics of long-term AHFs with high spatial resolution (500m) were estimated by using a refined AHF model and then analyzed using trend and standard deviation ellipse analyses. Results showed that values in the region increased significantly from 0.15W.m(-2) in 1995 to 1.46W.m(-2) in 2015. Heat emissions from industries, transportation, buildings, and human metabolism accounted for 64.1%, 17.0%, 15.5%, and 3.4% of the total anthropogenic heat emissions, respectively. Industrial energy consumption was the dominant contributor to the anthropogenic heat emissions in the region. During this period, industrial heat emissions presented an unstable variation but showed a growing trend overall. Heat emissions from buildings increased steadily. Spatial distribution was extended with an increasing tendency of the difference between the maximum and the minimum and was generally dominated by the northeast-southwest directional pattern. The spatiotemporal distribution patterns and trends of AHFs could provide vital support on management decision in city planning and environmental monitoring.
[本文引用: 2]
[本文引用: 2]
http://tjj.fujian.gov.cn/, 2017-09-04.
URL [本文引用: 2]
http://tjj.fujian.gov.cn/, 2017-09-04.]
URL [本文引用: 2]
[本文引用: 1]
[本文引用: 2]
DOI:10.1007/s12665-016-6202-4URL [本文引用: 2]
[本文引用: 1]
[本文引用: 1]
DOI:10.1080/01431161.2019.1590877URL [本文引用: 2]
[本文引用: 1]
[本文引用: 1]
DOI:10.1016/j.ecolind.2018.06.013URL [本文引用: 1]
DOI:10.1080/10941665.2019.1610002URL [本文引用: 2]
DOI:10.1111/gean.1995.27.issue-2URL [本文引用: 1]
DOI:10.11821/dlxb201904014URL [本文引用: 3]
2.5) and tourism flows, as well as analyzes the impact of haze on tourism flows and the spatial spillover effects from 1998 to 2016 by using bivariate LISA (Local Indications of Spatial Association) Model and Spatial Panel Dubin Model. The results show that the spatial distribution patterns of haze (PM2.5) pollution and tourism growth in China are both high in the eastern region and low in the western region, showing some regularity related to the factors, such as terrain and urban development on both sides of Hu Huanyong population line. Haze and tourism flows (including domestic tourism flows and inbound tourism flows) show both significant spatial agglomeration and spatial dependence during the study period, indicating that haze pollution has great spatial effect on tourism flows. The area where haze curbs tourism flows is expanding. The increase in the number of HL (High-Low) -type cities, the expansion of LH (Low-High) -type agglomeration area and the hollow phenomenon of LH-type agglomeration that appear in north and central China all show that tourists tend to travel to the cities with low haze pollution. The inverted U-shape curve relationship between haze pollution and tourism flows illustrates that the classical Environmental Kuznets Curve (EKC) hypothesis is suitable for tourism growth in the cities of China. The negative impact of haze on inbound tourism flows is significant. Both haze pollution and tourism flows have positive spatial spillover effects. Combining haze management with other measures, such as economic development, tourism development, ecological protection, traffic construction, we can create a beautiful environment for tourism development and achieve a healthy, coordinated and sustainable high-quality development of international and domestic tourism.]]>
[本文引用: 3]
DOI:10.1016/j.buildenv.2018.09.020URL [本文引用: 1]
