 ,, ���Ӣ,, ������, �ν���, ���, �Թ�Ӱ������ʦ����ѧ�����������������ռ���Ϣ���������ʡ�ص�ʵ����,������ 150025
Greenhouse gas fluxes from forest soil in permafrost regions of Greater Hinggan Mountains, Northeast China
WU Xiangwen,, ZANG Shuying,, MA Dalong, REN Jianhua, LI Hao, ZHAO GuangyingHeilongjiang Province Key Laboratory of Geographical Environment Monitoring and Spatial Information Service in Cold Regions, Harbin Normal University, Harbin 150025, ChinaͨѶ����:
�ո�����:2019-01-16������:2020-09-4�����������:2020-11-25
| ��������: |
Received:2019-01-16Revised:2020-09-4Online:2020-11-25
| Fund supported: |
����� About authors
������(1991-), ��, �������Ƹ���, ��ʿ��, ��Ҫ���º�������������仯�о���E-mail:

ժҪ
�ؼ��ʣ�
Abstract
Keywords��
PDF (2131KB)Ԫ������ά�����������������EndNote|Ris|Bibtex�ղر���
�������ø�ʽ
������, ���Ӣ, ������, �ν���, ���, �Թ�Ӱ. ���˰�����궳����ɭ��������������ͨ��. ����ѧ��[J], 2020, 75(11): 2319-2331 doi:10.11821/dlxb202011004
WU Xiangwen, ZANG Shuying, MA Dalong, REN Jianhua, LI Hao, ZHAO Guangying.
1 ����
IPCC�ر𱨸�ָ��,�ܹ�ȥ�Լ���ǰ���������ŷ�Ӱ��,ȫ���ů�ѵ��µ���ƽ�����½Ϲ�ҵ��֮ǰ��ˮƽ�߳�1 ��[1]��������CO2��CH4��N2OŨ�Ȳ�����������������ů�Ĺؼ�����[2]����������Ũ������̬ϵͳ̼����ѭ���������,�䡰Դ���㡱��ϵֱ��Ӱ����̬ϵͳ������仯����Ӧ�뷴��[3]�����,3����������ͨ���Ķ�̬�仯�����ѳ�Ϊȫ������仯�о�����Ҫ���ݡ�ȫ������仯ֱ��Ӱ����궳�����ݻ��ͷ�չ,�����ů����궳���˻�������ù�ϵ,�ѳ�Ϊ����ȫ��仯�о����ȵ����⡣���˰���������й���γ�ȶ��궳����Ҫ�ֲ���֮һ,�������˰������Ӷ��Ͷ��궳�������Լ3.8��105 km2��[4,5]�����궳������Ҫ������̼��[6],�䴢��Զ���ڴ���Ȧ̼�⡣��γ�ȶ��궳��������������,������仯��Ӧ����,�����ů����ɶ������������[7],�ͷŷ��Ĺ�̼��ˮ,Ϊ�����ṩ���������ռ�ͻ���,��������CO2��CH4��N2O������������ͷ�,����Ӱ��ȫ��̼��ѭ��[8,9]�����,�˽��γ�ȶ��궳������������ͨ���仯����,����ʶ���궳����̬ϵͳ����̼��ѭ�������ȫ������仯����Ӧ������Ҫ��ѧ���塣
ɭ����̬ϵͳ��ȫ��̼ѭ�����̵���Ҫ������,��ά���ŵ���86%��ֲ��̼���73%������̼��[10,11]����ȫ�������ů������,��ͬ�������ֵ��������ᷢ���仯,Ӱ��ɭ����̬ϵͳ������,�ı�ɭ���������������������Ľ���,����Ӱ����������Livesley��[12]��Jang��[13]�о�����,��ͬ���ֵĹڲ㡢��ϵ�����������в��,�Ӷ���������������ʡ�����Ⱥ����ɺͶ����ԵIJ���,Ӱ�����������ŷ�ͨ�����ջ���[14]�о�����,��Ҷ��������̬ϵͳ��л��ʢ,CO2ͨ������������Ҷ�֡�Leckie��[15]����Ϊ��Ҷ�ֵ������и�������Ի�����,�ֽ��,��������̼��������,�����Ҷ������CO2ͨ����С��Wang��[16]�о�������Ҷ���½Ϻ�ĵ�����������ˮ,������ˮ���ϵ�,����Ҷ������ӵ�и�ǿ��CH4��������;Castro��[17]����Ϊ2����������CH4ͨ�����첻������������Ҷ�ֺ���Ҷ������N2Oͨ���о��Ľ���Ҳ������ͬ,Butterbach-Bahl��[18]�о�������Ҷ���¸����γ���������,��������ŷŸ���N2O;Ҳ��****��Ϊ2����������N2O�ŷ�ͨ�����ƻ���Ҷ���Ը�[19,20]�����ϱ���,��ͬ���Ͷ�����CO2��CH4��N2Oͨ�����ɵ�Ӱ���в�����,�����һ��̽����
���˰���������й���Ҫ��ҵ����,ͬʱҲ��ŷ�Ǵ�½��γ�ȶ��궳����������ͻ���IJ���,�������������ůӰ���Ϊ������Ŀǰ�����й������������������о���Ҫ����Ұ��ԭλ�۲������ģ������ʵ��,�༯���ڼ��ڶ�����[21,22]����̿����ʪ��[23,24],���йش��˰�����궳����ɭ��������������ͨ���о���Խ����Ҷ�ͣ���ڶ���������,ȱ���������������о������۲⣨2016��2017�꣩���˰�����궳������������ͬ����������������ͨ���Ķ�̬�仯,Ϊ�����������˰�����궳���˻����ͷŵ����������������ů�����еĹ����Լ����˰���ɭ����̬ϵͳ̼��ƽ���ṩ��ѧ���ݡ�
2 �о����ſ����о�����
2.1 �о����ſ�
�о�����λ�ں�����Į��ɭ����̬ϵͳ���Ҷ�λ�۲��о�վʵ�����ڣ�53��17��N~53��30��N, 122��06��E~122��27��E����ʵ�����ش����˰���ı���,���ɽ����,ƽ������Ϊ300~500 m;�ܺ��´���½�Լ����������,�۲��������-3.3 ��,������ϲ�49.3 ��,��10 �������1436~2062 ��,��˪��Ϊ86 d���۲��ڵ��꽵ˮ��442.9 mm�����̫����������96~107 kcal��cm-2,����ʱ��2377~2625 h���ش�������Ϊ����ɫɭ��������Ҫֲ����ɣ���ľ�����˰���Ҷ�ɣ�Larix gmelinii����ɽ�Populus davidiana���������ɣ�Pinus sylvestris var. mongolica�������루Betula platyphylla����;��ľ�Ͳݱ�����˹Խ�٣�Vaccinium uliginosum�����˰��ž飨Rhododendron dauricum�������㣨Ledum palustre�����컨¹��ݣ�Pyrola incarnata���ȡ���������ѡȡ�Ĵ����ԺͿ�����ԭ��,ȫ��̤���ѡȡ�����������Ƶĵ�����������100 m��100 m�̶�ʵ������3��,�������˰�����궳��������Ҫ��3�ֵ������ͣ��˰���Ҷ���֣�LF�����������֣�PF���Ͱ����֣�BF����2.2 ��Ʒ�ɼ��봦��
2.2.1 ʵ��������ʵʩ ���þ�̬���䡪����ɫ��Ұ��ԭλ�۲���˰�����궳����3�ֵ���ɭ������CO2��CH4��N2O����ͨ������3�����͵Ĺ̶��������ضԽ����������3��5 m��5 m����,�������������20 m,��������������Ʒ�ɼ�,�ܹ�����9����������̬����Ҫ�����壨40 cm��40 cm��40 cm���Ͳ���ֻ�����40 cm��40 cm��8 cm�����������,ȡ��ǰ�����а��۵IJ���ֻ�����ǰ1������������,�����̶ֹ������Խ��Ͷ���Χ�����ĸ��š�ÿ�β���ǰ��ǰ1 d�����������������ֲ�������������ⲿճ�������ڹ����,������绷��Ӱ��,���������¶��Ŷ����䶥Ԥ��3����,�ֱ����ڽ�ͨ���ڷ��ȵ�Դ�ߡ��¶ȼ�̽ͷ�Ͳ���,3�����������ܷ⡣���ڰ�װ12 V���ع������,ȡ��ʱ����,ʹ��������Ũ�Ȼ�Ͼ��ȡ�2.2.2 ������Ʒ�IJɼ��봦�� ��Ʒ�ɼ�ʱ��Ϊ2016��2017����������5��9�£�,Ƶ��Ϊÿ����1��,ѡ���������ʵ�����9:00��11:00����������Ʒ�ɼ�������ʱ����̬����������ڲ���ֻ����İ�����,Ȼ���ڰ�����עˮ�ܷ�,��60 mL������ϩҽ��ע����������ˮ���������������ɼ�,����ÿ���10 min�ɼ�1��������Ʒ,0.5 h�ڹ��ɼ�4��������Ʒ���ɼ�����������ת�Ƶ������б����˻�ʵ����,ʹ������Agilent��˾������7890B������ɫ���Dzⶨ���ɼ�������Ʒʱͬ��������ѹ,ʹ������DeltaTrak��˾�����ı�Яʽ�¶ȼƲⶨ���¡������¶��Լ�5 cm��10 cm��15 cm�����¶ȡ�
2.2.3 ������Ʒ�IJɼ��봦�� �ڲɼ�������Ʒ��ͬʱ,ͬ���ɼ�������Ʒ��ÿ�����������ѡȡ5��ȡ���㣨�ܿ�������Ʒ�ɼ�����,�������������,��������ֱ�ɼ�0~15 cm������Ʒ���Ȼ�ϳ�һ������,ÿ�βɼ�9�����������Ʒ���ɼ�������������Է�����˻�ʵ����,��������ָ��IJⶨ����1����������ˮ�����ú�ɳ��ط��ⶨ;���ز��û������ⶨ;pHֵʹ��PHSJ-3F����ȼƲⶨ;�̬����NH4+-N������̬����NO3--N����ȫ����TN��ʹ�ú���Skalar��˾������SKALAR San++���������������Dzⶨ;���л�̼��TOC��ʹ�õ¹�Jena��˾������Multi C/N 3100��̼�������Dzⶨ��
Tab. 1
��1
��1��ͬ���ͱ�������������������
Tab. 1
| ���� | ��� | pH | ���� (g��cm-3) | ��̬�� (mg��kg-1) | �̬�� (mg��kg-1) | �л�̼ (g��kg-1) | ȫ�� (g��kg-1) |
|---|---|---|---|---|---|---|---|
| �˰���Ҷ���� | 2016 | 5.50��0.11Aa | 1.01��0.08Aa | 2.65��1.01Aa | 5.31��0.75Ba | 47.47��1.77Aa | 3.78��0.63Aa |
| 2017 | 5.79��0.12Aa | 1.00��0.09Aa | 1.09��0.31Ab | 3.23��0.50Bb | 51.38��1.54Aa | 2.66��0.49Aa | |
| �������� | 2016 | 5.58��0.13Aa | 1.04��0.05Aa | 2.10��0.34Aa | 6.10��1.07Ba | 42.77��1.83Aa | 3.60��0.03Aa |
| 2017 | 5.52��0.16Aa | 1.05��0.07Aa | 1.10��0.46Aa | 4.27��0.63Bb | 46.69��1.65Aa | 2.27��0.18Aa | |
| ������ | 2016 | 4.70��0.09Ba | 0.72��0.04Ba | 2.94��0.89Aa | 9.07��1.64Aa | 44.28��2.05Aa | 4.49��0.67Aa |
| 2017 | 4.58��0.10Ba | 0.69��0.05Ba | 1.60��0.49Ab | 6.80��1.34Ab | 46.26��1.46Aa | 2.47��0.22Ab |
�´��ڴ�|����CSV
2.3 ���㷽��
��������ͨ�����㹫ʽ��ʽ�У�FΪ��������ͨ����mg��m-2��h-1��;
ȫ������DZ���������۲�ͬ�������������仯Ӱ����������,���㹫ʽ��
ʽ�У�GWPΪȫ������DZ�ƣ�t��hm-2��;
3 �������
3.1 ��ͬ����������������ͨ���仯����
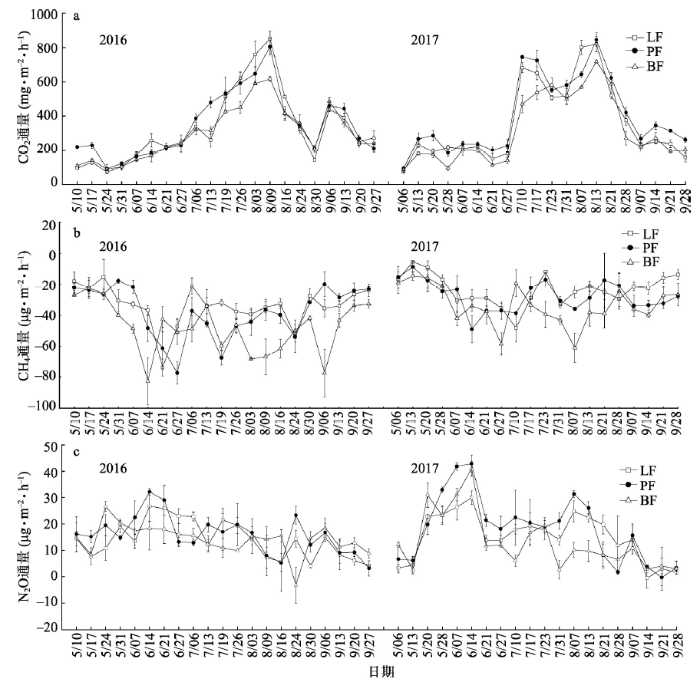
3.1.1 CO2ͨ�����ڱ仯���� ���˰�����궳����3����������CO2ͨ�����ڱ仯���ɻ���һ�£�ͼ1a��,����������������Ϊ�ŷ�ͨ��,���ڱ仯������2016��2017���,5����Ѯ,CO2ͨ��������С���ŷŷ�ֵ,����ά������Խϵ�ˮƽ,�ļ�7��8�´ﵽ���ŷ���,�^�����½�����ֵ��CO2ͨ����Χ65.88~883.59 mg��m-2��h-1,2016�����Ϊ�����ͱ仯����,2017�������˫���͡�������������CO2ͨ����7����Ѯ��8����Ѯ�����ŷŸ߷���,���ֵ��873.14 mg��m-2��h-1��������2016��8��9�ա��˰���Ҷ���֡�����������CO2ͨ���ŷŸ߷��ڼ�����7����Ѯ��8����Ѯ,�ֱ���2017��8��7�պ�8��13�մﵽ�ŷ����ֵ��883.59 mg��m-2��h-1��728.37 mg��m-2��h-1�����˰���Ҷ���֡��������ֺͰ���������2��������CO2���ŷ������ֱ�Ϊ24.86 t��hm-2��27.04 t��hm-2��21.99 t��hm-2,������������CO2�ŷ�ͨ���������ڰ����֣���2����ͼ1
 �´��ڴ�|����ԭͼZIP|����PPT
ͼ1���˰�����궳����3����������CO2(a)��CH4(b)��N2O(c)ͨ�����ڱ仯
Fig. 1Seasonal variations of CO2 (a), CH4 (b), and N2O (c) fluxes in different forest types
Tab. 2
��2
��2���˰�����궳����3����������CO2��CH4��N2Oͨ�����رȽ�
Tab. 2
| ���� | ��� | CO2ͨ�� (mg��m-2��h-1) | CH4ͨ�� (��g��m-2��h-1) | N2Oͨ�� (��g��m-2��h-1) |
|---|---|---|---|---|
| �˰���Ҷ���� | 2016 | 329.96��25.46Aa | -33.84��5.43Ba | 14.23��2.92Aa |
| 2017 | 361.53��24.78Aa | -23.38��3.66Bb | 15.19��2.24Aa | |
| �������� | 2016 | 345.09��27.35Ab | -37.99��4.78Ba | 15.98��3.08Aa |
| 2017 | 402.75��23.93Aa | -27.63��5.87Ab | 18.11��3.36Aa | |
| ������ | 2016 | 299.19��21.47Aa | -47.84��5.44Aa | 13.54��2.75Aa |
| 2017 | 315.59��22.19Ba | -33.55��5.85Ab | 13.80��2.79Aa |
�´��ڴ�|����CSV
3.1.2 CH4ͨ�����ڱ仯���� 2016��2017���˰���Ҷ���֡��������ֺͰ�����3����������������CH4ͨ������Ϊ���ջ㣨ͼ1b��,�������Եļ��ڲ������ɡ���������3����������������ΪCH4��������,����ǿ����ʱ�����ƶ�����ǿ;����ĩ�ڵ��ļ������Ϊǿ����,�^���������ա�CH4ͨ����ΧΪ-93.29~-2.82 ��g��m-2��h-1,2016���˰���Ҷ���ֺ�����������������Ϊ˫���շ���,��������������Ϊ3���շ���;2017�������Ϊ˫���շ��͡��˰���Ҷ���֡��������ֺͰ����������ֱ���2016���6��21�ա�6��27�պ�6��14�մﵽ���CH4����ֵ��-77.84 ��g��m-2��h-1��-82.40 ��g��m-2��h-1��-93.29 ��g��m-2��h-1����������2������������CH4����������-2.95 kg��hm-2���ֱ����˰���Ҷ����������-2.10 kg��hm-2������������������-2.39 kg��hm-2����1.40��1.23��,��ͬ���ͼ������������2����
3.1.3 N2Oͨ�����ڱ仯���� �����۲���3����������N2O��Ϊ�ŷ�ͨ��,���ֳ����Ƶļ��ڱ仯��֣�ͼ1c��������3����������N2Oͨ�������¶����߳��ֲ�����������,��6����Ѯ�ﵽ����ŷŷ�ֵ,֮�����½���ά���ڽϵ�ˮƽ��N2Oͨ����Χ-5.31~45.22 ��g��m-2��h-1,2016��3����������N2O�ŷ�ͨ����Ϊ������,���ڱ仯��С;2017���˰���Ҷ���ֺ��������ֱ���Ϊ˫����,��������Ϊ������,���ڱ仯������3����������N2Oͨ������2017��6��14�մﵽ����ŷŷ�ֵ,�������ֺͰ���������ֵ��Ϊ�ӽ���45.22 ��g��m-2��h-1��44.29 ��g��m-2��h-1��,�����˰���Ҷ���֣�31.75 ��g��m-2��h-1����P < 0.05����3����������������2��N2O�ŷ���������Ϊ�������֣�1.26 kg��hm-2��>�˰���Ҷ���֣�1.09 kg��hm-2��>�����֣�1.02 kg��hm-2�����ŷŹ��ɡ�
3.2 ���º������¡�ʪ�ȼ��ڱ仯����������������ͨ���Ĺ�ϵ
��3�������ݼ����ʾ,�о���2017��������ƽ���¶ȣ�13.8 �棩����2016�꣨13.3 �棩,7�·��¶Ƚϸ�;������ƽ����ˮ��Ҳ���ֳ�2017�꣨76.9 mm������2016�꣨73.4 mm��,ȫ�꽵ˮ����Ҫ������������,����ͬ�ڡ�Tab. 3
��3
��32016��2017����˰����������������ºͽ�ˮ��
Tab. 3
| �·� | ƽ������(��C) | ��ˮ��(mm) | �ս�ˮ��> 0.1 mm����(d) | ռ�꽵ˮ������(%) | ||||
|---|---|---|---|---|---|---|---|---|
| 2016�� | 2017�� | 2016�� | 2017�� | 2016�� | 2017�� | 2016�� | 2017�� | |
| 5 | 9.7 | 9.0 | 39.8 | 56.5 | 7 | 17 | 78.82 | 91.95 |
| 6 | 14.0 | 16.8 | 113.4 | 18.8 | 15 | 8 | ||
| 7 | 18.1 | 18.7 | 119.5 | 94.2 | 17 | 17 | ||
| 8 | 14.4 | 16.2 | 58.2 | 182.6 | 16 | 24 | ||
| 9 | 10.4 | 8.3 | 37.5 | 32.6 | 15 | 10 | ||
�´��ڴ�|����CSV
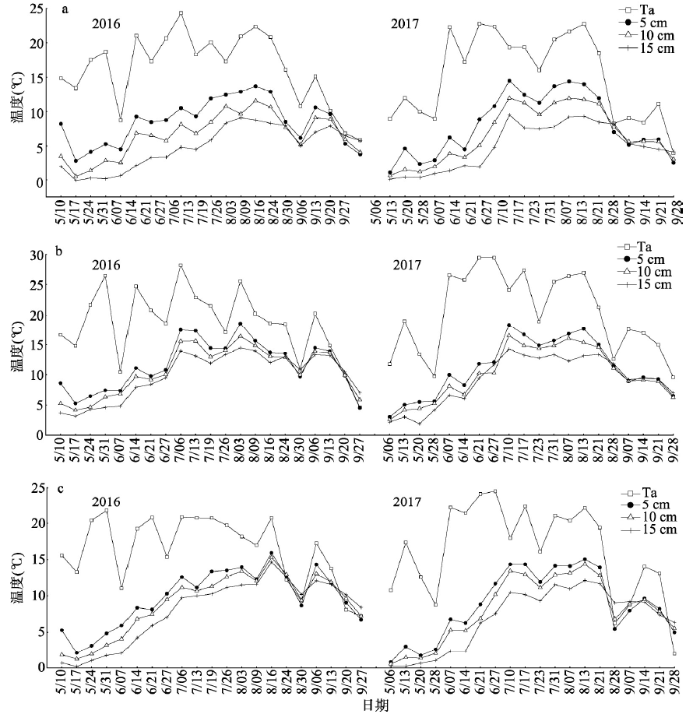
��ͼ2��֪,�˰���Ҷ���֡��������ֺͰ����������������¶Ⱥ����µı仯�������ơ���2016���������������¶ȳ�3���ͱ仯������,�������������¶Ⱦ�����Ϊ˫���͡�3������5 cm��10 cm��15 cm�����¶ȱ仯��ΧΪ0.15~18.55 ��,�����ļ��ﵽ���ֵ,��2017���ļ�����ƽ���¶ȣ�12.33 �棩����2016���ļ���11.61 �棩��������������Ʋ㡢����Ȼ����Ŷ�Ӱ��,�����ϴ�,�������¶Ƚ�Ϊ�ȶ�,���ֵ����ʱ������±��ֳ��ͺ��ԡ�
ͼ2
 �´��ڴ�|����ԭͼZIP|����PPT
ͼ2�˰���Ҷ����(a)����������(b)�Ͱ�����(c)����(Ta)�������¶ȼ��ڱ仯
Fig. 2Seasonal variations of air temperature (Ta) and soil temperature in LF (a), PF (b), and BF (c)
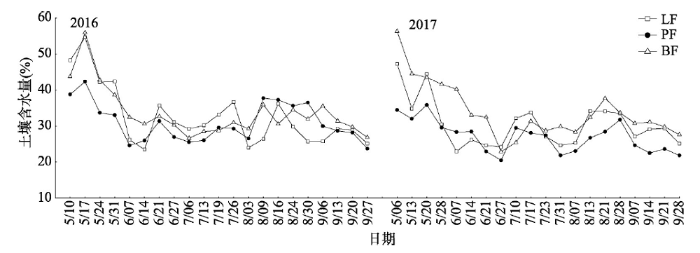
3������������ˮ���仯���ƻ���һ��,������������������ˮ����Խϸ���,�������ھ�ά����40%����,���ڱ仯��Ϊ���ԣ�ͼ3�������ֵ�����ڴ�������,����½�;�ļ��ܽ�ˮ��������˫��Ӱ��,��21.86%~37.73%֮�䲨��,�^���͡�
ͼ3
 �´��ڴ�|����ԭͼZIP|����PPT
ͼ3���˰�����궳����3������������ˮ�����ڱ仯
Fig. 3Seasonal variations of soil moisture in different forest types
����4��֪,2016��2017���˰���Ҷ���֡��������ֺͰ���������CO2ͨ����5 cm��10 cm��15 cm�����¶ȼ���������أ�P < 0.01��,2017���˰���Ҷ��������CO2ͨ��������Ӱ��������P < 0.05��,�¶���Ӱ��3����������CO2ͨ����̬�Ĺؼ��������ӡ�����������CH4ͨ����10 cm�����¶ȳʼ���������أ�P < 0.01��,�������������¶ȳ���������أ�P < 0.05����2017���������ֺͰ���������CH4ͨ����������ˮ����������أ�P < 0.05��������CH4ͨ���ܵ������¶Ⱥͺ�ˮ����ͬӰ�졣2��۲���ʾ,����N2Oͨ����������ˮ��Ӱ�첻����,�˰���Ҷ���ֺ�������������N2Oͨ��������Ӱ��������P < 0.05��,����������N2Oͨ����15 cm�����¶���������أ�P < 0.05����
Tab. 4
��4
��4���˰�����궳����3������������������ͨ���뻷��������ط���
Tab. 4
| ���� | ��� | �������� | ������ˮ�� | ���� | �����¶� | ||
|---|---|---|---|---|---|---|---|
| 5 cm | 10 cm | 15 cm | |||||
| �˰���Ҷ���� | 2016 | CO2 | -0.409 | 0.425 | 0.849** | 0.874** | 0.815** |
| CH4 | 0.254 | -0.199 | -0.311 | -0.358 | -0.243 | ||
| N2O | -0.015 | 0.551** | 0.275 | 0.116 | -0.230 | ||
| 2017 | CO2 | -0.057 | 0.527* | 0.862** | 0.877** | 0.855** | |
| CH4 | 0.364 | -0.577** | -0.581* | -0.569** | -0.470* | ||
| N2O | -0.142 | 0.570** | 0.332 | 0.267 | 0.139 | ||
| �������� | 2016 | CO2 | -0.017 | 0.251 | 0.813** | 0.827** | 0.800** |
| CH4 | 0.194 | -0.324 | -0.402 | -0.398 | -0.385 | ||
| N2O | -0.131 | 0.403 | 0.021 | -0.066 | -0.175 | ||
| 2017 | CO2 | -0.099 | 0.418 | 0.891** | 0.890** | 0.787** | |
| CH4 | 0.599* | -0.446* | -0.287 | -0.261 | -0.317 | ||
| N2O | 0.020 | 0.531* | 0.223 | 0.148 | -0.009 | ||
| ������ | 2016 | CO2 | -0.413 | 0.163 | 0.856** | 0.855** | 0.827** |
| CH4 | 0.425 | -0.297 | -0.658* | -0.592** | -0.477* | ||
| N2O | 0.068 | 0.423 | -0.281 | -0.352 | -0.411 | ||
| 2017 | CO2 | -0.382 | 0.365 | 0.828** | 0.839** | 0.780** | |
| CH4 | 0.556* | -0.550* | -0.644** | -0.617** | -0.540* | ||
| N2O | 0.259 | 0.207 | -0.294 | -0.348 | -0.511* | ||
�´��ڴ�|����CSV
3.3 ��ͬ����������������ȫ������DZ��
ȫ������DZ�ƣ�GWP����CO2��Ϊ��������,��100 aʱ��߶������۸����������ȫ������仯�����Ӱ��,CH4��N2O�ķ���Ӱ��ֱ���CO2��25����298��[25]������5��֪,���˰�����궳����ɭ��������������GWP����Ϊ����������>�˰���Ҷ����>�����֡������۲�����,���궳����3�ֵ���ɭ���˰���Ҷ���֡��������ֺͰ�����������100 aʱ��߶��Ͼ�����Ϊ��������ġ�Դ��,2017��3��������GWP��39.413 t��hm-2��Ҫ����2016����GWP��35.293 t��hm-2��,�������˰�����궳����ɭ���������������ͷŶ�ȫ�������ů�������������á�Tab. 5
��5
��52016��2017����˰�����궳����3��������������������DZ�� (t��hm-2)
Tab. 5
| ���� | CO2 | CH4 | N2O | �ۺ�����DZ�� | ||||
|---|---|---|---|---|---|---|---|---|
| 2016�� | 2017�� | 2016�� | 2017�� | 2016�� | 2017�� | 2016�� | 2017�� | |
| �˰���Ҷ���� | 11.767 | 13.089 | -0.030 | -0.022 | 0.157 | 0.168 | 11.894 | 13.235 |
| �������� | 12.464 | 14.577 | -0.034 | -0.025 | 0.175 | 0.201 | 12.605 | 14.753 |
| ������ | 10.687 | 11.303 | -0.043 | -0.031 | 0.150 | 0.153 | 10.794 | 11.425 |
�´��ڴ�|����CSV
4 ����
4.1 ����CO2ͨ��������Ӱ������
2016��2017���������۲ⷢ��,���˰�����궳�����˰���Ҷ���֡��������ֺͰ�����������ΪCO2�ŷ�Դ,�����ļ��ﵽ�ŷŸ߷���,����Song��[26]��Li��[27]���о������һ�¡�����������,3���������������ֶ��ݵĸ��ŷ�����,��ԭ����������ڶ�����������,ֲ������Լ���������������CO2�������������;�������»���,�����������¶��������ڻ�,�ݶ��궳�����ϵͳ�����ʾ,4��26��5 cm�����ڻ�,5��3��10 cm�����ڻ�,5��13��20 cm�����ڻ�,�����ڻ��������е�CO2�����ͷ�,�γ�С���ŷŸ߷���,���ʵ�[28]Ҳ�ó����ƽ������ĩ���³�������,�����ڻ���ֲ�︴��,������������ҪΪֲ����ϵ��������������������ҪΪ���������������������ǿ,����CO2ͨ����֮�������ӡ��о���ֲ������dz��ϵ,������Ҳ���������㼯��,�ļ����õ�ˮ�����,�ٽ���ϵ�������ú���������ֽ�,ʹCO2�ﵽ�ŷŸ߷���[29]���^�����½�,ֲ�������ή,������Խ���,����CO2ͨ��Ҳ��֮����,��������γ�ȵĶ���˹�������ǡ��¹��в�����ɭ���µ�����[30,31,32]�����о������һ�¡�2�����ݶԱȷ���,2016������������CO2ͨ������Ϊ������,2017�������������˫����,��ͬ�����������¶ȱ仯��������,CO2ͨ����5 cm��10 cm��15 cm�����¶ȼ���������أ���4��,���빢Ԫ����[33]�о����һ�¡��о�����,������������CO2ͨ�����������˰���Ҷ���ֺͰ�����,���������������¶ȸߣ�ͼ2��,�����л�ǿ��,���¸�ֳ�ʲ�ֽ�Ͽ�,������������CO2�ͷŵ������С�8��ĩ���ɹŸ�ѹӰ��,�������Ϯ,�о��������轵,3����������CO2ͨ��Ҳ��֮�½�������¶Ȼ�����ͬ������ˮƽ,����CO2�ŷ�ͨ��ֵҲ���¶Ȼ������������Ա���2����6����,���¶Ⱥ��л��ʵ����ص��ۺ�Ӱ��,���о�������CO2ͨ�������DZ��������Լ���ظ�ԭ�ߺ�������,ͬʱҲ���ڲ����и�γ���ڶ���������ͨ��,��������̿�������,�ڶ��궳���������е�ˮƽ��Tab. 6
��6
��6��ͬ�������͵�����������ͨ���Ƚ�
Tab. 6
| �������� | ����γ�� | ֲ������ | CO2ͨ��(mg��m-2��h-1) | CH4ͨ��(��g��m-2��h-1) | N2Oͨ�� (��g��m-2��h-1) | ������Դ���� |
|---|---|---|---|---|---|---|
| ���궳�� | �DZ���67��03��N | ̦ԭ | 152.01 | 5.00 | 19.17 | [39] |
| ����˹��65��10��N | ����ɼ | 90.00��42.00 | -52.00��15.00 | 0.20��0.30 | [40] | |
| ����������62��09��N | ̩���� | 367.02 | 1.33 | [41] | ||
| ���˰���52��94��N | ��̿�� | 2.27 | [24] | |||
| ������³��42��53��N | �ߺ��ݵ� | 76.70��23.10 | -54.20��6.90 | 20.40��4.20 | [42] | |
| ������37��37��N | �ߺ��ݵ� | 4.80 | [43] | |||
| ���ڶ��� | �¹�48��17��N | Ų����ɼ | -14.20��1.30 | [44] | ||
| ����48��11��N | ��Ҷ������ | 537.40 | 15.33 | [29] | ||
| �µ���47��42��N | ɽë��� | 128.00��13.00 | -40.00��2.30 | 5.72��1.38 | [32] | |
| ����ɽ42��24��N | �����콻�� | 172.40��43.88 | -15.00��30.00 | 70.00��10.00 | [45] | |
| ��������ɽ40��01��N | ���� | 182.00 | -79.00 | 50.00 | [19] | |
| ��ũ��31��36��N | ��β�� | 107.03��12.11 | -14.10��3.38 | [14] |
�´��ڴ�|����CSV
4.2 ����CH4ͨ��������Ӱ������
�����о��������,CH4ͨ����������[34,35],Ҳ���ŷ�[36]������ˮ������ֱ�ӻ��Ӹı�������������ͺ���������������Ⱥ������,Ӱ������CH4ͨ��,��˲�ͬ��̬ϵͳ������ˮ��״���IJ��쵼������CH4ͨ��Ҳ������ͬ�����о�����,�˰���Ҷ���֡��������ֺͰ���������CH4ͨ��������Ϊ���ջ㡣��������3��������������ΪCH4������ͨ��,�Ʋ���ԭ���Ƕ�����������ˮ����Խϸ�,���궳�����γɺ���/ȱ������,����²������γ���������,�������ͨ����ԭ���ò���CH4[37];������ϲ����ں�������,������������Ծ����CH4,��˹۲CH4������[38]������ĩ����Ϊǿ����,һ����,�����¶Ȳ�������,��������Ƚ�һ������,Ϊ�����������ṩ�ϴ�������л����,�Ҷ������������ͷŵ�C��NΪ���ṩ��Ҫ����,������CH4������[36];��һ����,�꼾��δ����,����������ǿ,�������ֶ��ݸɺ���,�����ڿ�����CH4�������������д���,����CH4����������[34]���ļ��ܽ�ˮӰ��,����ʪ������,����CH4��������Լ��١��^ĩ��,�о����������Ϯ,���¼�������CH4�������ʡ�2016��2017��������,3����������CH4ƽ������ͨ������Ϊ������>��������>�˰���Ҷ����,��Ҷ������CH4����ͨ��������Ҷ��������,��Steudler��[46]���о����һ�¡�������ԭ��,�˰���Ҷ�ɺ���������Ϊ������,������ʵ,ͨ���Խϲ�,������������������Խ�С����1��,��ʯ������Խ϶�,�ʵ�����,������������������,��ǿ�����м�������ø�ͼ�����������Ļ���,����˰���������CH4����������[47]������,����ɭ����������Ч����NO3--N��NH4+-N������ƶ��[48],���о��в�ͬ����������Ч���������ֳ������֣�5.10 mg��kg-1�����������������֣�3.39 mg��kg-1�����˰���Ҷ���֣�3.07 mg��kg-1������1��,��������������û��ʺ�����Էḻ,��ǿ����CH4����������2017��������3����������CH4����ͨ����С��2016��,���뺬ˮ���Լ������¶��������,��������2017��۲��������¶Ⱥ�ʪ�Ƚϸߣ�ͼ2��ͼ3��,��ɶ����в�������Ķ����Ժͷḻ������,��������������II������������a-Proteobacteria������Ҫ��,����CH4������ǿ,��������CH4��������[49,50]���Ա���2����6�в�ͬ���������о�����,CH4������ʪ������ˮ״��Ӱ���Ϊ�ͷ�Դ,���ֵض�Ϊ���ջ㡣���о�����ڶ��궳������,CH4����ͨ����С,�ڼ��ڶ�����������ˮ�ĵ�����Ӱ��,ͨ����С������ͬ,�����һ������̽����4.3 ����N2Oͨ��������Ӱ������
2��۲ⷢ��,������3����������N2Oͨ��������Ϊ�ŷ�Դ������5����Ѯ��6��,����N2Oͨ���������ŷŸ߷��ڡ���Ҫԭ������Ƕ������������ⲿ�����㸲��,�ڲ�������δ��ˮĤ�γ���������,Ϊ��������Ӧ�ṩ�����õij���,����N2O��ͬʱ����ֹ������,���������ڻ�,�ۻ����е�N2O���ͷŵ�������[51];�������ⶳ�ں�ˮ���ϸ��Ҹ�����������̼������Ӫ������,������N2O�IJ������о����ش����궳����,�ܵ����������������ʽϵ�,��Ч����NO3--N��NH4+-Nƽ��ֵΪ3.86 mg��kg-1��������Խϵ��Ҳ���ȫ����1%����1��,�ļ�ֲ��������ʢ,�������ô�������Ч��,ֲ����������γɾ�����ռ������,Ӱ�����������ͷ���������[52];ͬʱ,�ļ�����Ƶ��,dz��������ʪ����,��Ӱ������N2O�ŷ�����[53]���^���¶��½�Ӱ��,��������N2O�������̵�ø����Ҳ����,����N2Oͨ����С[54]������������,�۲���������¶����������˰���Ҷ���ֺͰ�����,3����������N2Oͨ�����¶�����,��������������أ���4��,��һ����ɽ���������������N2Oͨ�������˰���Ҷ���ֺͰ����֡����[55]�о�����,pHֵ����5~6֮��ʱ��������N2O�ŷ��������,���ڻ�����������N2O�ŷ����ʾ��½�,���뱾�о����һ��,����������pH < 5����1��,N2O�ŷ����ʵ����������ֺ��˰���Ҷ����,Ȼ��3�����ͼ�����N2Oͨ�����첻����,���Ͳ���Ӱ������N2Oͨ������Ҫ���ء��Ա���2����6����,���о�������N2Oͨ���ڶ��궳�������ڸ��ŷ�ˮƽ,�������й����ڶ������������е�N2O��Ҫͨ�������������̺��������������̲���,����һϵ�з�Ӧ�ܵ�����仯���������������Լ������ﺬ����������Ⱥ������Ӱ��[41,42]�����,���������о����������������ͷ��������ù��̼�������������Ũ�ȼ����Ϲ�ϵ,������ʶ���궳����̬ϵͳ��������N2O���ŷŻ��ơ�5 ����
��1�����˰�����궳��������ɭ���˰���Ҷ���֡��������ֺͰ�����������������CO2��N2O�ġ�Դ����CH4�ġ��㡱,3����������ͨ���������Եļ����Բ���,��ͬ���ͺ���ʼ�CO2��CH4ͨ��������������2��ͨ��2���о�����,�����¶Ⱥ�������ˮ����Ӱ���γ�ȶ��궳������ͬ��������CO2��CH4��N2Oͨ���Ĺؼ��������ӡ�5 cm��10 cm��15 cm�����¶ȿ�������CO2ͨ��,�������¶Ⱥ�������ˮ����ͬӰ��CH4ͨ��,����N2Oͨ��������Ӱ��ϴ�
��3�������ů������,3����������CO2��N2O�ŷ����������¶����߶�����,CH4����������֮����,�����ǿ��������ЧӦ����100 aʱ��߶���,���˰�����궳����3�������������������ȫ�������ů�������������á�
�����ů������,���˰�����궳��������ЧӦ������,�Ӷ���ɶ��궳���������Ӹ��ӵ�ˮ�ȱ仯,ֱ�ӻ���Ӱ�캮��ɭ����̬����,Ӱ������̼����֧ƽ�⡣����ۺ������ȶ�ͬλ��ʾ�ٺͷ�������ѧ����,����������궳��������̼��ѭ��������
�ο����� ԭ��˳��
������ȵ���
������������
�����ڿ�Ӱ������
[��������: 1]
[��������: 1]
DOI:10.1007/s11442-016-1300-5URL [��������: 1]

Eddy Covariance technique (EC) achieves the direct measurement on ecosystem carbon, nitrogen and water fluxes, and it provides scientific data for accurately assessing ecosystem functions in mitigating global climate change. This paper briefly reviewed the construction and development of Chinese terrestrial ecosystem flux observation and research network (ChinaFLUX), and systematically introduced the design principle and technology of the terrestrial ecosystem carbon, nitrogen and water fluxes coordinated observation system of ChinaFLUX. In addition, this paper summarized the main progress of ChinaFLUX in the ecosystem carbon, nitrogen and water exchange and environmental controlling mechanisms, the spatial pattern of carbon, nitrogen and water fluxes and biogeographical mechanisms, and the regional terrestrial ecosystem carbon budget assessment. Finally, the prospects and emphases of the terrestrial ecosystem carbon, nitrogen and water fluxes coordinated observation of ChinaFLUX are put forward to provide theoretical references for the development of flux observation and research in China.
[��������: 1]
[��������: 1]
[��������: 1]
[��������: 1]
DOI:10.1038/nature14338URLPMID:25855454 [��������: 1]
Large quantities of organic carbon are stored in frozen soils (permafrost) within Arctic and sub-Arctic regions. A warming climate can induce environmental changes that accelerate the microbial breakdown of organic carbon and the release of the greenhouse gases carbon dioxide and methane. This feedback can accelerate climate change, but the magnitude and timing of greenhouse gas emission from these regions and their impact on climate change remain uncertain. Here we find that current evidence suggests a gradual and prolonged release of greenhouse gas emissions in a warming climate and present a research strategy with which to target poorly understood aspects of permafrost carbon dynamics.
[��������: 1]
[��������: 1]
DOI:10.11821/dlxb201609012URL [��������: 1]
Water, land, energy and carbon are key elements of earth's surface system. Researches on regional water-land-energy-carbon system (WLEC system) will not only help to reveal the impact mechanism of resource coupling exploitation on carbon emissions, but also has great significance to explore low-carbon development mode based on water, land and energy saving. Based on the literature review, this paper analyzed the element relationship of regional WLEC system, discussed the coupling interaction mechanism, research perspectives and impact factors of regional WLEC system, and put forward the future research points in this field. The main conclusions are as follows: (1) Regional WLEC system reflects the interactions among different spheres of earth's surface system. Through water cycle, land use, energy flow and carbon cycle, WLEC system becomes the core of regional natural-economic-social system. It not only reflects the matching relationship and exploitation efficiency of regional resources, but also embodies the impact extent of human activities on environment. (2) Regional WLEC system can be divided into three subsystems: water system, land system and energy system. They interacted with each other and together formed the resource base for the regional socio-economic development. Regional carbon emission intensity is mainly determined by the need relationship among three subsystems, industrial activities and energy structure. (3) Regional WLEC system can be studied from different perspectives such as microscopic view, industrial activities and land use. (4) Regional WLEC system is influenced by natural, economic, social and pressure factors, in which economic factor, especially economic development level, production efficiency and technology, is the determinant factor of the function and efficiency of regional WLEC system. (5) In the future, modeling of regional WLEC system, relationship between WLEC system and climate change and food security, carbon emission efficiency of resource coupling exploitation and the integrated evaluation and regulation of WLEC system should be strengthened.
[��������: 1]
URL [��������: 1]
On the basis of analyses of the importance of cryospheric researches in China and the current status of cryospheric sciences over the world, this paper addresses some key issues and main contents that must be handled at present. Generally, the impacts of cryospheric changes on climate, sea level and physical environments receive worldwide concerns, whereas in China, cryospheric changes are of great importance in ecology, fresh water, physical environments and climate since China has a most developed cryosphere among countries in mid- and low-latitudes. The key issues that should be currently addressed are: i) fluctuation mechanisms of different types of glaciers in responses to climate changes and the scale-conversion in water resources assessments of glaciers; ii) modeling of water and heat exchanges between frozen soil and vegetation; iii) parameterization of physical processes in the cryosphere as well as their coupling with climate models. Towards full solution of these key issues, works in following three aspects should be highlighted, i.e. cyrospheric processes and their responses to climate changes, influences of cryospheric changes, and adaptation strategies for cryospheric changes.
[��������: 1]
DOI:10.1126/science.1204588URL [��������: 1]
Immune clearance and resource limitation (via red blood cell depletion) shape the peaks and troughs of malaria parasitemia, which in turn affect disease severity and transmission. Quantitatively partitioning the relative roles of these effects through time is challenging. Using data from rodent malaria, we estimated the effective propagation number, which reflects the relative importance of contrasting within-host control mechanisms through time and is sensitive to the inoculating parasite dose. Our analysis showed that the capacity of innate responses to restrict initial parasite growth saturates with parasite dose and that experimentally enhanced innate immunity can affect parasite density indirectly via resource depletion. Such a statistical approach offers a tool to improve targeting of drugs or vaccines for human therapy by revealing the dynamics and interactions of within-host regulatory mechanisms.
DOI:10.11821/dlxb201811008URL [��������: 1]
-1. This increase was mainly observed in the topsoil (0-20 cm). Forest, grassland, and cropland SOC storage increased by 2.52±0.77, 0.40±0.78, and 0.07±0.31 Pg C, respectively, which can be attributed to the several ecological restoration projects and agricultural practices implemented. On the other hand, SOC storage in wetlands declined by 0.76±0.29 Pg C, most likely due to the decrease in wetland area and SOC density. These results, combined with those of vegetation C sink (0.100 Pg C yr-1), show that the net C sink in Chinese terrestrial ecosystems was about 0.201±0.061 Pg C yr-1, which offsets 14.85%-27.79% of the C emissions from fossil fuels from the 1980s to the 2010s. These estimates of soil C sink based on field measured data supported the premise that China's terrestrial ecosystems have a large C sequestration potential, and further emphasized the importance of forest protection and reforestation to increase SOC storage capacity.]]>
[��������: 1]
DOI:10.1111/gcb.2009.15.issue-2URL [��������: 1]
DOI:10.1007/s11284-006-0041-9URL [��������: 1]
Methane is one of the strongest of the greenhouse gases, being 30-fold more radiatively active than carbon dioxide on a molar basis. In addition, its atmospheric concentrations have increased by 1% per year since the Industrial Revolution. As such, the dynamics of methane is of great importance for the prediction of global climatic changes caused by increasing concentrations of greenhouse gases in the atmosphere. One of the most important biological sinks for methane is forest soils, where methanotrophic bacteria oxidize methane to carbon dioxide. Based on data mined from a review of the literature, we determined that the mean methane oxidation rate was 1.90mgCH4m−2day−1 and that the main variables controlling this rate were soil water content and inorganic nitrogen in the soils. In contrast, the effects of temperature and pH are minimal. In addition to reviewing the literature, we monitored methane oxidation rates in a temperate forest soil in Korea on a monthly basis for a year, using a static chamber method. The mean oxidation rate was 1.96mgCH4m−2day−1 and was positively correlated with nitrate concentration in the soil.]]>
[��������: 2]
[��������: 2]
DOI:10.1139/x04-028URL [��������: 1]
DOI:10.1007/s11104-010-0408-0URL [��������: 1]
2O, CH4 and CO2. One coniferous plantation was composed of Pinus massoniana (PM), and the three broadleaf plantations were Castanopsis hystrix (CH), Michelia macclurei (MM) and Mytilaria laosensis (ML). We found that mean soil N2O and CO2 emissions in the PM plantation were 4.34μgN m−2 h−1 and 43.25mg C m−2 h−1, respectively, lower than those in the broadleaf plantations (>5.25μgN m−2 h−1 and >56.38mg C m−2 h−1). The PM plantation soil had higher mean CH4 uptake (39.03μg C m−2 h−1) than the broadleaf plantation soils (<32.67μg C m−2 h−1). Variations in soil N2O emissions among tree species could be primarily explained by the differences in litter C:N ratio and soil total N stock. Differences in soil CH4 uptake among tree species could be mostly attributed to the differences in mean soil CO2 flux and water filled pore space (WFPS). Litter C:N ratio could largely account for variations in soil CO2 emissions among tree species. This study confirms that there is no GHG benefit of converting PM plantation to broadleaf plantations in subtropical China. Therefore, the future strategy of tree species selection for substituting in place of large coniferous plantations in subtropical China needs to consider the potential effects of tree species on soil-atmosphere GHG exchanges.]]>
DOI:10.1029/94GB02651URL [��������: 1]
DOI:10.1023/A:1015825615309URL [��������: 1]
During 4 years continuous measurements of N-trace gas exchange were carried out at the forest floor-atmosphere interface at the Höglwald Forest that is highly affected by atmospheric N-deposition. The measurements included spruce control, spruce limed and beech sites. Based on these field measurements and on intensive laboratory measurements of N2-emissions from the soils of the beech and spruce control sites, a total balance of N-gas emissions was calculated. NO2-deposition was in a range of –1.6 –2.9 kg N ha–1 yr–1 and no huge differences between the different sites could be demonstrated. In contrast to NO2-deposition, NO- and N2O-emissions showed a huge variability among the different sites. NO emissions were highest at the spruce control site (6.4–9.1 kg N ha–1 yr–1), lowest at the beech site (2.3–3.5 kg N ha–1 yr–1) and intermediate at the limed spruce site (3.4–5.4 kg N ha–1 yr–1). With regard to N2O-emissions, the following ranking between the sites was found: beech (1.6–6.6 kg N ha–1 yr–1) >> spruce limed (0.7–4.0 kg N ha–1 yr–1) > spruce control (0.4–3.1 kg N ha–1 yr–1). Average N-trace gas emissions (NO, NO2, N2O) for the years 1994–1997 were 6.8 kg N ha–1 yr–1 at the spruce control site, 3.6 kg N ha–1 yr–1 at the limed spruce site and 4.5 kg N ha–1 yr–1 at the beech site. Considering N2-losses, which were significantly higher at the beech (12.4 kg N ha–1 yr–1) than at the spruce control site (7.2 kg N ha–1 yr–1), the magnitude of total gaseous N losses, i.e. N2-N + NO-N + NO2-N + N2O-N, could be calculated for the first time for a forest ecosystem. Total gaseous N-losses were 14.0 kg N ha–1 yr–1 at the spruce control site and 15.5 kg N ha–1 yr–1 at the beech site, respectively. In view of the huge interannual variability of N-trace gas fluxes and the pronounced site differences in N-gas emissions it is concluded that more research is needed in order to fully understand patterns of microbial N-cycling and N-gas production/emission in forest ecosystems and mechanisms of reactions of forest ecosystems to the ecological stress factor of atmospheric N-input.]]>
DOI:10.1016/j.atmosenv.2018.10.045URL [��������: 3]
URL [��������: 1]
Seasonal dynamics of N��2O flux and its controlling factors for four representative temperate forests in northeastern China were examined with a static closed chamber-gas chromatograph technique. These forests were Korean pine (��Pinus koraiensis��) plantation, Dahurian larch (��Larix gmelinii��) plantation, Mongolian oak (��Quercus mongolica��) forest and hardwood broadleaved forest (dominated by ��Fraxinus mandshurica, Juglans mandshurica��, and ��Phellodendron amurense��). The results showed that all ecosystems were overall atmospheric N��2O source during the growing season. The N��2O flux (��g��m����-2����h����-1��) decreased in order of the hardwood broadleaved forest (21��0��4��9)>the pine plantation (17��6��4��6)>the larch plantation (9��8��5��9)>the oak forest (1��6��12��6). Overall, there was no consistent seasonal pattern in N��2O flux for the four ecosystems. The N��2O flux was significantly positively correlated to soil gravimetric water content (0��KG-*2��-��KG-*7��10 cm depth) consistently for all ecosystems, but significantly negatively correlated to NO��3��--N content for each ��ecosystem��. However, the responses of N��2O flux to soil temperature and NH��4��+-N differed among the ecosystems. The N��2O fluxes for the coniferous plantations were positively correlated to NH��4��+-N, but not correlated to the soil temperature at 5 cm depth; while those for the broadleaved forests displayed an opposite trend. The soil water content was the dominator of soil N��2O emission for the forests in 2007 perhaps resulting from relative drought in the year. Interactions of vegetation type, environmental factor, and nitrogen availability to soil N��2O emission should be further studied in the future. ]]>
[��������: 1]
[��������: 1]
[��������: 1]
[��������: 1]
[��������: 1]
DOI:10.1016/j.catena.2018.02.026URL [��������: 1]
DOI:10.1016/j.scitotenv.2017.10.246URL [��������: 2]
[��������: 2]
[��������: 2]
DOI:10.1016/j.ecoleng.2017.05.033URL [��������: 1]
DOI:10.1016/j.soilbio.2014.10.026URL [��������: 1]
[��������: 1]
[��������: 1]
DOI:10.11707/j.1001-7488.20100702URL [��������: 2]
The seasonal variation and the influence factors of emission fluxes of greenhouse gas (CO2, N2O and CH4) from the soil ofLarix gmelinii-Betula ovalifolia-Carex schmidtii swamp, Larix gmelinii-Betula ovalifolia-Vaccinium uliginosum-moss swamp and Larix gmelinii-Ledum palustre var. anjustum-Sphagnum magellanicum swamp were studied during the growing season by static opaque chamber-GC technique in Xiaoxing′an Mountains of China. The results showed that: 1��The patterns of seasonal variation of emission fluxes of CO2 from the soil of the three forested swamp communities all were a single-peak curve, high in summer(651.4��823.6 mg·m-2h-1), lower in spring and autumn(233.3��310.0 mg·m-2h-1); That of Emission fluxes of N2O from the three communities respectively were 0.010��0.049, 0.012��0.020 and 0.010��0.080 mg·m-2h-1, and their seasonal changes were in a order of summer ��spring��autumn, spring��summer��autumn, and autumn��spring��summer respectively; Emission fluxes of CH4 from the three communities were -0.083��0.037,-0.122��0.078 and-0.05��0.026 mg·m-2h-1, that was the soil emitted CH4in spring and autumn, absorbing CH4 in summer; emitted CH4 in spring, absorbed CH4 in summer and autumn, and emitted CH4 in spring and summer, absorbed CH4 in autumn respectively in the three communities. 2��In the three communities, temperature of the soil (��30 cm ) was the main affecting factors of CO2emission; Higher temperature of the soil (��30 cm ) and lower water table were the main affecting factors of N2O emission; Water table was the main affecting factors of CH4 emission; The soil with lower water table emitted CH4, while the soil with higher water table absorbed CH4. 3��During the growing season, the soils of the three forested swamps all were the sources of CO2(20.8��25.2 t·hm-2), higher in summer, and lower in spring and autumn; The soils all were the sources of N2O (0.192��1.128 kg·hm-2). The soil ofLarix gmelinii-Betula ovalifolia-Carex schmidtii swamp emitted more N2O than the other two. The soils of Larix gmelinii-Betula ovalifolia-Carex schmidtii swamp and Larix gmelinii-Betula ovalifolia-Vaccinium uliginosum-moss swamps both were strong sinks of CH4 (1.152��1.200 kg·hm-2), but the soils of Larix gmelinii-Ledum palustre var. anjustum-Sphagnum magellanicum swamp were a weak sources of CH4 (0.168 kg·hm-2). 4�� The emission of greenhouse gases from the soil of Larix gmelinii-Betula ovalifolia-Carex schmidtii swamp was higher (CO2:25.4 t·hm-2) than others (CO2�� 20.8��21.2 t·hm-2). The greenhouse gas all were composed of CO2 mainly (99.63%��99.93%), few N2O and CH4 (0.19%��0.92% and 0.02%��0.10%).]]>
[��������: 2]
DOI:10.1134/S1067413615020071URL [��������: 1]
DOI:10.1007/s12665-015-4241-xURL [��������: 1]
DOI:10.1007/s11104-015-2771-3URL [��������: 2]
DOI:10.11821/xb201009003URL [��������: 1]
Leymus chinensis steppe in Xilin River Basin of Inner Mongolia, China. Soil temperature and moisture are the most important factors affecting CO2 flux. Soil temperature was the main factor influencing respiration rates. Exponential models based on soil temperature can explain large percent of CO2 efflux variations (R2 = 0.375-0.655) excluding data of low soil water conditions. Soil moisture can also effectively explain some variations of soil and ecosystem respiration (R2 = 0.314-0.583), but it can not explain much of variation of soil microbial respiration (R2 = 0.063). Low soil water content (≤5%) inhibited CO2 efflux though soil temperature was high. Rewetting the soil after a long drought resulted in substantial increases in CO2 flux at high temperature. Bi-variable models based on soil temperature at 5 cm depth and soil water content at 0-10 cm depth can explain about 70% of variations of CO2 effluxes. The contribution of soil respiration to ecosystem respiration averaged 59.4%, ranging from 47.3% to 72.4%; the contribution of root respiration to soil respiration averaged 20.5% , ranging from 11.7% to 51.7% . The contribution of soil to ecosystem respiration was a little overestimated and root to soil respiration underestimated because of increased soil water content that occurred as a result of plant removal.]]>
[��������: 1]
DOI:10.11821/xb201209002URL [��������: 2]
P. australis. Measurements were taken at three tidal stages. Potential rates of methane production and oxidation from the marsh sediments were also estimated in situ in summer and winter using acetylene as a methane oxidation inhibitor. We devised a ‘hanging' enclosed static chamber to measure methane transport and emission directly from single stems of P. australis on days of neap tide. Methane emission from the P. australis tidal marsh showed a seasonal variation in all the three tidal stages, and reached a maximum during the summer when soil temperature was relatively high. The ranges of methane flux were 0.69-40.95, 0.26-9.57 and 0.74-22.10 mg m-2 h-1 before the flood, during the flood/ebb and after the ebb respectively and the average methane fluxes were 7.53, 2.19 and 4.93 mg m-2 h-1, respectively. Methane production and oxidation potentials in summer were all higher than those in winter. Methane concentrations within the lacunal of the P. australis stems were the greatest at the base and decreased faster compared with stem height, which start at the stem base, and showed lower lacunal methane concentrations at daytime and higher lacunal methane concentrations at night-time. On an annual basis, the average methane transport and emission of a single P. australis culm was 33.67 μg·culm-1·h-1. These methane transport rates differed between growth stages, with the highest transport and emission detected within the stage of fastest plant growth. Nearly half (43.4%) of the whole plant transport and emission occurred from P. australis culms nearest the ground (0-20 cm above the ground). We estimated that plant-mediated methane transport contributed 2.3%-28.5% of the total methane emission within this P. australis-dominated marsh.]]>
[��������: 2]
DOI:10.1016/j.scitotenv.2016.10.219URL [��������: 1]
URL [��������: 2]
[��������: 1]
[��������: 1]
DOI:10.1016/S1164-5563(01)01067-6URL [��������: 1]
DOI:10.1111/gcb.13563URLPMID:27862698 [��������: 1]
Rapidly rising temperatures in the Arctic might cause a greater release of greenhouse gases (GHGs) to the atmosphere. To study the effect of warming on GHG dynamics, we deployed open-top chambers in a subarctic tundra site in Northeast European Russia. We determined carbon dioxide (CO2 ), methane (CH4 ), and nitrous oxide (N2 O) fluxes as well as the concentration of those gases, inorganic nitrogen (N) and dissolved organic carbon (DOC) along the soil profile. Studied tundra surfaces ranged from mineral to organic soils and from vegetated to unvegetated areas. As a result of air warming, the seasonal GHG budget of the vegetated tundra surfaces shifted from a GHG sink of -300 to -198 g CO2 -eq m(-2) to a source of 105 to 144 g CO2 -eq m(-2) . At bare peat surfaces, we observed increased release of all three GHGs. While the positive warming response was dominated by CO2 , we provide here the first in situ evidence of increasing N2 O emissions from tundra soils with warming. Warming promoted N2 O release not only from bare peat, previously identified as a strong N2 O source, but also from the abundant, vegetated peat surfaces that do not emit N2 O under present climate. At these surfaces, elevated temperatures had an adverse effect on plant growth, resulting in lower plant N uptake and, consequently, better N availability for soil microbes. Although the warming was limited to the soil surface and did not alter thaw depth, it increased concentrations of DOC, CO2, and CH4 in the soil down to the permafrost table. This can be attributed to downward DOC leaching, fueling microbial activity at depth. Taken together, our results emphasize the tight linkages between plant and soil processes, and different soil layers, which need to be taken into account when predicting the climate change feedback of the Arctic.
[��������: 1]
DOI:10.1111/j.1747-0765.2008.00309.xURL [��������: 2]
DOI:10.1016/j.chemosphere.2012.02.077URL [��������: 2]
To assess the effects of nitrogen (N) deposition on greenhouse gas (GHG) fluxes in alpine grassland of the Tianshan Mountains in central Asia, CH4, CO2 and N2O fluxes were measured from June 2010 to May 2011. Nitrogen deposition tended to significantly increase CH4 uptake, CO2 and N2O emissions at sites receiving N addition compared with those at site without N addition during the growing season, but no significant differences were found for all sites outside the growing season. Air temperature, soil temperature and water content were the important factors that influence CO2 and N2O emissions at year-round scale, indicating that increased temperature and precipitation in the future will exert greater impacts on CO2 and N2O emissions in the alpine grassland. In addition, plant coverage in July was also positively correlated with CO2 and N2O emissions under elevated N deposition rates. The present study will deepen our understanding of N deposition impacts on GHG balance in the alpine grassland ecosystem, and help us assess the global N effects, parameterize Earth System models and inform decision makers. (C) 2012 Elsevier Ltd.
DOI:10.1016/j.soilbio.2010.02.011URL [��������: 1]
DOI:10.1016/j.envpol.2011.06.025URL [��������: 1]
Based on multi-year measurements of CH(4) exchange in sub-daily resolution we show that clear-cutting of a forest in Southern Germany increased soil temperature and moisture and decreased CH(4) uptake. CH(4) uptake in the first year after clear-cutting (-4.5 +/- 0.2 mu g C m(-2) h(-1)) was three times lower than during the pre-harvest period (-14.2 +/- 1.3 mu g C m(-2) h(-1)). In contrast, selective cutting did not significantly reduce CH4 uptake. Annual mean uptake rates were -1.18 kg C ha(-1) yr(-1) (spruce control), -1.16 kg C ha(-1) yr(-1) (selective cut site) and -0.44 kg C ha(-1) yr(-1) (clear-cut site), respectively. Substantial seasonal and inter-annual variations in CH(4) fluxes were observed as a result of significant variability of weather conditions, demonstrating the need for long-term measurements. Our findings imply that a stepwise selective cutting instead of clear-cutting may contribute to mitigating global warming by maintaining a high CH(4) uptake capacity of the soil. (C) 2011 Elsevier Ltd.
[��������: 1]
[��������: 1]
DOI:10.1038/341314a0URL [��������: 1]
[��������: 1]
[��������: 1]
DOI:10.1038/nature07276URLPMID:18784722 [��������: 1]
Old-growth forests remove carbon dioxide from the atmosphere at rates that vary with climate and nitrogen deposition. The sequestered carbon dioxide is stored in live woody tissues and slowly decomposing organic matter in litter and soil. Old-growth forests therefore serve as a global carbon dioxide sink, but they are not protected by international treaties, because it is generally thought that ageing forests cease to accumulate carbon. Here we report a search of literature and databases for forest carbon-flux estimates. We find that in forests between 15 and 800 years of age, net ecosystem productivity (the net carbon balance of the forest including soils) is usually positive. Our results demonstrate that old-growth forests can continue to accumulate carbon, contrary to the long-standing view that they are carbon neutral. Over 30 per cent of the global forest area is unmanaged primary forest, and this area contains the remaining old-growth forests. Half of the primary forests (6 x 10(8) hectares) are located in the boreal and temperate regions of the Northern Hemisphere. On the basis of our analysis, these forests alone sequester about 1.3 +/- 0.5 gigatonnes of carbon per year. Thus, our findings suggest that 15 per cent of the global forest area, which is currently not considered when offsetting increasing atmospheric carbon dioxide concentrations, provides at least 10 per cent of the global net ecosystem productivity. Old-growth forests accumulate carbon for centuries and contain large quantities of it. We expect, however, that much of this carbon, even soil carbon, will move back to the atmosphere if these forests are disturbed.
DOI:10.1038/ismej.2007.84URLPMID:18180745 [��������: 1]
Archaeal populations are abundant in cold and temperate environments, but little is known about their potential response to climate change-induced temperature changes. The effects of temperature on archaeal communities in unamended slurries of weakly acidic peat from Spitsbergen were studied using a combination of fluorescent in situ hybridization (FISH), 16S rRNA gene clone libraries and denaturing gradient gel electrophoresis (DGGE). A high relative abundance of active archaeal cells (11-12% of total count) was seen at low temperatures (1 and 5 degrees C), and this community was dominated by Group 1.3b Crenarchaeota and the euryarchaeal clusters rice cluster V (RC-V), and Lake Dagow sediment (LDS). Increasing temperature reduced the diversity and relative abundance of these clusters. The methanogenic community in the slurries was diverse and included representatives of Methanomicrobiales, Methanobacterium, Methanosarcina and Methanosaeta. The overall relative abundance and diversity of the methanogenic archaea increased with increasing temperature, in accordance with a strong stimulation of methane production rates. However, DGGE profiling showed that the structure of this community changed with temperature and time. While the relative abundance of some populations was affected directly by temperature, the relative abundance of other populations was controlled by indirect effects or did not respond to temperature.
DOI:10.1016/j.soilbio.2008.08.020URL [��������: 1]
AbstractThe abundance, activity, and temperature response of aerobic methane-oxidizing bacteria were studied in permafrost-affected tundra soils of northeast Siberia. The soils were characterized by both a high accumulation of organic matter at the surface and high methane concentrations in the water-saturated soils. The methane oxidation rates of up to 835 nmol CH4 h−1 g−1 in the surface soils were similar to the highest values reported so far for natural wetland soils worldwide. The temperature response of methane oxidation was measured during short incubations and revealed maximum rates between 22 °C and 28 °C. The active methanotrophic community was characterized by its phospholipid fatty acid (PLFA) concentrations and with stable isotope probing (SIP). Concentrations of 16:1��8 and 18:1��8 PLFAs, specific to methanotrophic bacteria, correlated significantly with the potential methane oxidation rates. In all soils, distinct 16:1 PLFAs were dominant, indicating a predominance of type I methanotrophs. However, long-term incubation of soil samples at 0 °C and 22 °C demonstrated a shift in the composition of the active community with rising temperatures. At 0 °C, only the concentrations of 16:1 PLFAs increased and those of 18:1 PLFAs decreased, whereas the opposite was true at 22 °C. Similarly, SIP with 13CH4 showed a temperature-dependent pattern. When the soils were incubated at 0 °C, most of the incorporated label (83%) was found in 16:1 PLFAs and only 2% in 18:1 PLFAs. In soils incubated at 22 °C, almost equal amounts of 13C label were incorporated into 16:1 PLFAs and 18:1 PLFAs (33% and 36%, respectively). We concluded that the highly active methane-oxidizing community in cold permafrost-affected soils was dominated by type I methanotrophs under in situ conditions. However, rising temperatures, as predicted for the future, seem to increase the importance of type II methanotrophs, which may affect methane cycling in northern wetlands.]]>
DOI:10.1002/ppp.v31.1URL [��������: 1]
DOI:10.1111/gcb.15119URLPMID:32301539 [��������: 1]
Soil nitrification, an important pathway of nitrogen transformation in ecosystems, produces soil nitrate that influences net primary productivity, while the by-product of nitrification, nitrous oxide, is a significant greenhouse gas. Although there have been many studies addressing the microbiology, physiology, and impacting environment factors of soil nitrification at local scales, there are very few studies on soil nitrification rate over large scales. We conducted a global synthesis on the patterns and controlling factors of soil nitrification rate normalized at 25 degrees C by compiling 3,140 observations from 186 published articles across terrestrial ecosystems. Soil nitrification rate tended to decrease with increasing latitude, especially in the Northern Hemisphere, and varied largely with ecosystem types. The soil nitrification rate significantly increased with mean annual temperature (MAT), soil nitrogen content, microbial biomass carbon and nitrogen, soil ammonium, and soil pH, but decreased with soil carbon:nitrogen and carbon:nitrogen of microbial biomass. The total soil nitrogen content contributed the most to the variations of global soil nitrification rate (total coefficient = 0.29) in structural equation models. The microbial biomass nitrogen (MBN; total coefficient = 0.19) was nearly of equivalent importance relative to MAT (total coefficient = 0.25) and soil pH (total coefficient = 0.24) in determining soil nitrification rate, while soil nitrogen and pH influenced soil nitrification via changing soil MBN. Moreover, the emission of soil nitrous oxide was positively related to soil nitrification rate at a global scale. This synthesis will advance our current understanding on the mechanisms underlying large-scale variations of soil nitrification and benefit the biogeochemical models in simulating global nitrogen cycling.
[��������: 1]
[��������: 1]
DOI:10.1016/j.agrformet.2011.02.001URL [��������: 1]
Savanna soil was generally a net CH4 sink that equated to between -2.0 and -1.6 kg CH4 ha(-1) y(-1) with no clear seasonal pattern in response to changing soil moisture conditions. Irrigation in the dry season significantly reduced soil gas diffusion and as a consequence soil CH4 uptake. There were short periods of soil CH4 emission, up to 20 mu g C m(-2) h(-1), likely to have been caused by termite activity in, or beneath, automated chambers. Soil CO2 fluxes showed a strong bimodal seasonal pattern, increasing fivefold from the dry into the wet season. Soil moisture showed a weak relationship with soil CH4 fluxes, but a much stronger relationship with soil CO2 fluxes, explaining up to 70% of the variation in unburnt treatments. Australian savanna soils are a small N2O source, and possibly even a sink. Annual soil CH4 flux measurements suggest that the 1.9 million km(2) of Australian savanna soils may provide a C sink of between -7.7 and -9.4 Tg CO2-e per year. This sink estimate would offset potentially 10% of Australian transport related CO2-e emissions. This CH4 sink estimate does not include concurrent CH4 emissions from termite mounds or ephemeral wetlands in Australian savannas. (C) 2011 Elsevier B.V.]]>
[��������: 1]
[��������: 1]
