 ,1, 李会2, 申玉铭,2
Spatiotemporal patterns and driving factors of environmental stress in Beijing-Tianjin-Hebei region: A county-level analysis
ZHOU Kan,1, LI Hui2, SHEN Yuming,2通讯作者:
收稿日期:2019-09-6修回日期:2020-03-23网络出版日期:2020-09-25
| 基金资助: |
Received:2019-09-6Revised:2020-03-23Online:2020-09-25
| Fund supported: |
作者简介 About authors
周侃(1986-), 男, 云南丽江人, 博士, 副研究员, 硕士生导师, 研究方向为资源环境承载力与区域可持续发展。E-mail:

摘要
关键词:
Abstract
Keywords:
PDF (5403KB)元数据多维度评价相关文章导出EndNote|Ris|Bibtex收藏本文
本文引用格式
周侃, 李会, 申玉铭. 京津冀地区县域环境胁迫时空格局及驱动因素. 地理学报[J], 2020, 75(9): 1934-1947 doi:10.11821/dlxb202009009
ZHOU Kan, LI Hui, SHEN Yuming.
1 引言
城市群地区通常城镇化和工业化水平高,人口和经济集聚规模大,是中国推进城镇化的主要形态和地区经济增长的重要空间载体[1]。但与此同时,在快速城镇化进程驱动下,高速度、高密度、高强度扩张过程将不可避免地引发高耗能、高排放、高污染问题,加剧了城市群地区的区域性环境污染,这在京津冀地区尤为突出[2]。京津冀地区是全国人口与产业最密集的区域之一,也是环境问题最突出的区域[3],在占全国2.25%的国土面积上,承载了全国5.75%的化学需氧量、5.83%的氨氮排放量、8.10%的二氧化硫排放量和5.61%的氮氧化物排放量,环境污染问题已经成为制约京津冀地区一体化高质量发展的重大阻碍。为此,国家发布的《京津冀协同发展规划纲要》中将生态环境保护作为优先突破的重点领域,在《京津冀协同发展生态环境保护规划》中进一步明确提出要遏制区域环境质量恶化趋势,并大幅削减主要污染物排放总量。2012年以来,京津冀3省市按照县域主体功能区定位,相继实施差别化环境准入负面清单管理,加大京津冀及周边地区污染管控与治理力度,为加速缓解社会经济发展对环境的胁迫态势提供了可能。环境胁迫是指在人类生产生活过程中各类污染物输出对区域环境系统产生的综合压力。随着工业化和城镇化进程加速,污染物的排放强度和规模迅速增长,对环境系统自然净化过程的扰动加剧,导致区域生态环境发生结构失调、功能退化乃至系统崩溃等受胁反应或症状[4,5,6]。国内外****从各类污染物的排放强度和减排过程、主要影响因素等方面,对环境胁迫的变化及相应症状、驱动力进行了大量研究,为健康环境系统的维持和受损环境系统的重建提供了科学依据。在时空格局变化研究方面,多采用单个或多个典型污染物指标,从国家[7,8,9,10,11]、典型流域[3, 12-13]、省域[14,15]等大尺度对污染物排放强度进行测度与分解,研究表明了主要水体、大气污染物排放存在显著空间差异和集聚特征,且环境胁迫格局在时间上存在路径依赖。而关于环境胁迫的驱动因素研究,在早期较多关注收入水平与环境污染的关系,大量实证研究证实了“环境库兹涅茨曲线(Environmental Kuznets Curve)”的存在[16,17],而后运用LMDI指数法[18]、最小二乘法回归法[19]、面板模型估计[20,21]、脱钩指数法[22]、地理加权回归模型[23]等方法,将驱动因素的分析进一步拓展到了社会经济与制度领域,发现了人口与城镇化、产业结构、投资水平、技术进步、环保投入和环境规制等方面的驱动作用。针对环境胁迫呈现出的空间溢出特征,一些****采用空间滞后模型(SLM)和空间误差模型(SEM)[24]、广义矩估计模型(GMM)[25]、混合OLS模型[26]等空间计量模型,考察空间效应和区域传导对省域环境胁迫的驱动作用。此外,京津冀地区实证研究表明,环境胁迫程度呈平原区高、山区低的空间分异,各城市间也存在空间溢出效应,特别是大气环境胁迫可跨区域传导[27,28,29,30];驱动因素研究还发现,技术进步、工业结构调整对京津冀地区的环境胁迫程度具有缓解作用[31],北京的产业转移过程会加剧产业接纳地河北省污染物排放及环境胁迫[32,33]。
由此可见,既有环境胁迫研究主要集中在水体或大气环境的单要素分析上,而反映区域性环境综合胁迫态势的定量评价有待加强;在研究尺度上,多侧重于国家、省份、城市等宏观层面,需降尺度开展更精细化的微观研究,而将基本研究单元降至县域尺度,有助于反映城市内中心城区与郊区、流域内上下游及干支流等微观区位特征及影响。此外,不同县域发展模式和开发方式差异十分显著,在按照县域实施差异化主体功能区环境政策、产业准入负面清单等政策规制背景下,分析县域层面环境胁迫及驱动力,有助于揭示环境胁迫的政策响应过程与机理。因此,本文运用熵权法综合测算县域环境胁迫指数,分析2012—2016年京津冀地区环境胁迫的时空格局和各类主体功能区县域的差异性,并针对空间格局分析反映的空间溢出效应,在STIRPAT模型框架基础上,运用地理加权回归方法定量解析时空演化的驱动因素,以期为提出精细化的区域环境联防联治与污染减排对策、提升环境协同管制效果提供参考。
2 数据与方法
2.1 数据来源与处理
以县域作为基础评价与研究单元,构建2012—2016年京津冀地区化学需氧量、氨氮、二氧化硫和氮氧化物4类污染物排放数据集,以及人口与社会经济数据集。截止2016年底,京津冀地区共辖200个县(市、区)行政单元,但因行政区划调整,并考虑到数据可获得性、统计口径一致性,将北京市东城区、西城区、海淀区、朝阳区、丰台区和石景山区等主体功能定位一致的中心城区合并为1个研究单元,对天津市及河北省各地级市中心城区也进行了相应合并处理,最终得到154个县域单元。本文行政边界数据从国家基础地理信息系统网站获取,污染物排放和社会经济数据主要来源于《中国县域统计年鉴》《北京市统计年鉴》《天津市统计年鉴》《河北经济年鉴》,以及河北省各地级市统计年鉴和中国工业企业数据库。优化开发区域、重点开发区域和限制开发区的农产品主产区、重点生态功能区4类主体功能区来源于《全国主体功能区规划》和京津冀三省市的省级主体功能区规划(图1)。图1
 新窗口打开|下载原图ZIP|生成PPT
图1研究区位置与主体功能区分布
Fig. 1Location of the study area and distribution of its major functional zones
2.2 研究方法
2.1.1 环境胁迫指数 采用熵权法(Entropy Weight Method)测度京津冀地区县域环境胁迫指数(Environmental Stress Index, ESI)。熵权法按照评价指标的原始信息确定指标权重,是较为客观的多指标评价方法[34],用该方法进行环境胁迫指数测算的步骤为:首先,采用极差标准化法对i县域j污染物排放量指标(rij)进行无量纲化处理,得到无量纲化属性值(式中:
ESI反映县域环境受各类污染物的综合胁迫态势,ESI值越大,表明污染排放强度越高,水体和大气环境面临的污染物排放压力越大,县域所受环境胁迫程度越高。
2.1.2 地理加权回归模型 为解析京津冀地区县域环境胁迫的驱动力,同时探索驱动因素在不同地域上的空间异质性,采用地理加权回归模型(Geographically Weighted Regression Model, GWR)进行分析[35]。GWR模型将地理位置信息嵌入回归参数中,允许回归系数存在空间异质性,是考察空间非平稳性的有效方法。其基本模型为:
式中:
式中:X为解释变量的矩阵;XT为其转置矩阵;
3 结果分析
3.1 京津冀地区县域环境胁迫时空格局
3.1.1 县域环境胁迫演变特征 运用熵权法测度县域环境胁迫指数,并利用Jenks自然断裂点法划分为低、较低、一般、较高、高5个等级,结果如表1、图2所示。2012—2016年京津冀地区县域环境胁迫的演变特征如下:Tab. 1
表1
表12012年和2016年京津冀地区县域排放强度和环境胁迫指数
Tab. 1
| 地区 | 2012年 | 2016年 | ||||||||
|---|---|---|---|---|---|---|---|---|---|---|
| 化学需 氧量(t) | 氨氮(t) | 二氧 化硫(t) | 氮氧 化物(t) | 环境胁 迫指数 | 化学需 氧量(t) | 氨氮(t) | 二氧 化硫(t) | 氮氧 化物(t) | 环境胁 迫指数 | |
| 北京市 | 16954.62 | 1862.13 | 8531.76 | 8876.63 | 0.10 | 7917.70 | 506.92 | 3019.09 | 3191.49 | 0.04 |
| 天津市 | 32776.27 | 3630.82 | 32074.49 | 40024.72 | 0.28 | 14753.91 | 2235.31 | 10087.73 | 13820.09 | 0.12 |
| 河北省 | 9933.54 | 814.72 | 9871.90 | 8921.88 | 0.07 | 3023.46 | 451.93 | 5804.73 | 4786.54 | 0.03 |
| 京津冀地区 | 11473.35 | 1017.54 | 10785.39 | 10332.41 | 0.08 | 3906.25 | 536.92 | 5800.44 | 5083.22 | 0.04 |
新窗口打开|下载CSV
图2
 新窗口打开|下载原图ZIP|生成PPT
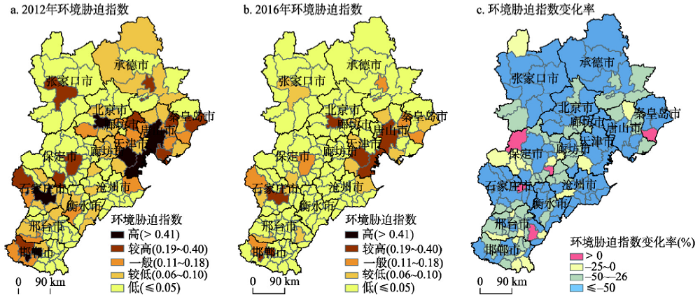
图22012—2016年京津冀地区县域环境胁迫指数及空间变化
Fig. 2ESI and its spatial changes in Beijing-Tianjin-Hebei region in 2012 and 2016
2012年以来,京津冀地区面临的环境胁迫态势显著缓解,县域平均环境胁迫指数从0.084降至2016年的0.038,较之2012年降幅达到54.68%。环境胁迫程度的大幅下降反映出国家实施《大气污染防治行动计划》(“大气国十条”)和《水污染防治行动计划》(“水国十条”)等一系列强有力环保规制效果,以及部署京津冀及周边地区的重点行业污染限期治理方案和区域性大气、水污染减排细则,从源头上对县域污染物排放强度起到的遏制作用。较之2012年,2016年京津冀地区的化学需氧量、氨氮、二氧化硫和氮氧化物排放量依次下降65.9%、47.2%、46.2%和50.8%。其中,北京县域环境胁迫程度下降最为显著,环境胁迫指数下降了63.35%,高于天津(57.75%)和河北(53.07%)县域降幅。
5年间,京津冀地区县域环境胁迫程度整体降低,特别是以城市中心城区为主的环境胁迫指数高值区降幅最为显著。2012年,环境胁迫高等级县域包括唐山、天津、石家庄、北京和邯郸市辖区以及天津滨海新区,主要分布于环渤海及京广线沿线一带,这类县域环境胁迫指数占京津冀地区总和的28.57%,即承载了京津冀地区近3成的污染排放压力;较高等级县域包括张家口、保定、秦皇岛和承德市辖区以及迁安市、曹妃甸区、蓟州区、武安市、平山县和定州市等,主要分布于北部地级市中心和高等级区外围。而到2016年环境胁迫高等级县域已经消除,较高等级县域也从10个降至6个,仅分布于东部津唐滨海地区、以及南部的石家庄、邯郸市辖区。环境胁迫较低等级县域主要分布在较高、一般等级区周边,包括曹妃甸区、沙河市、滦县、张家口市辖区和秦皇岛市辖区等15个县域单元;低等级县域面积占总面积的80%以上,县域环境胁迫指数占总和的18.20%,仅承载了京津冀地区约2成的污染排放压力。进一步分析还发现,京津冀地区环境胁迫指数随着与中心城区距离增大而梯度递减,环境胁迫程度形成由中心城区向外逐步降低的核心与外围结构。
进一步测算5年间县域环境胁迫指数变化率,并对变化率为0%~-25%、-26%~-50%、小于等于-50%的3类降低区和大于0的胁迫指数增长区进行分析,结果如图2c所示。2012年以来,县域环境胁迫指数降低区共计149个,其中,降幅在50%以上的县域共83个,占土地总面积的65.31%,基本包括北京、天津、承德、石家庄、张家口全域;降幅在26%~50%之间的县域共47个,占土地总面积的23.18%,以邯郸、邢台、沧州、保定和承德的县域为主。需要指出的是,2016年局部地区尚存在环境胁迫指数增长的县域,包括威县、涞源县、高阳县、昌黎县和无极县,该类县域处于地市行政边界的交界地区,通常是环境规制与管控强度较为薄弱的区域。
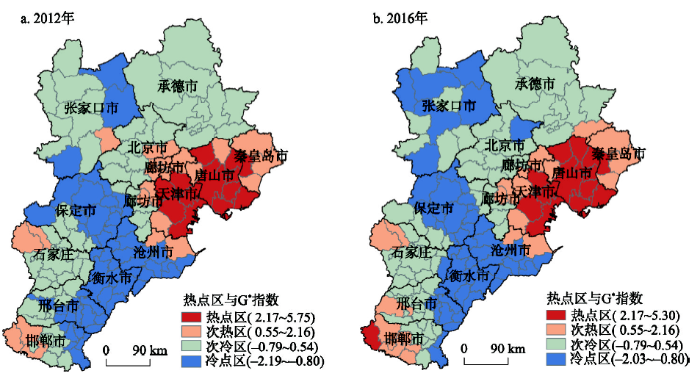
3.1.2 县域环境胁迫空间效应 县域环境胁迫指数和主要污染物排放量的全局Moran's I值如表2所示,2012—2016年县域的估计值均大于0,且通过了5%的显著性检验,表明环境胁迫和污染物排放在京津冀地区县域单元存在显著空间相关。2012年以来,县域环境胁迫指数的Moran's I值由0.2014增大为0.2325,显示了环境胁迫的空间溢出效应呈增大趋势,在空间上表现为胁迫程度的高值区或低值区更加集聚。对污染物排放的分解发现,氨氮和氮氧化物排放量Moran's I指数也显著增大,而化学需氧量和二氧化硫排放量的Moran's I指数分别由0.1666和0.2186降低为0.1309和0.1865。为进一步分析县域环境胁迫的空间关联特征,分别计算2012年和2016年县域环境胁迫指数的Getis-Ord G*指数,再将G*指数从高到低分为热点区、次热区、次冷区和冷点区4种类型,生成局部空间关联变化图。如图3所示,整体上看,县域环境胁迫指数的热度基本保持着从沿海向内陆递减的态势,环渤海沿岸县域单元的热度显著高于内陆县域,且津唐地区长期处于热点区域,呈现出较强空间锁定和路径依赖。
Tab. 2
表2
表2京津冀地区县域环境胁迫指数和主要污染物排放量的Moran's I估计值
Tab. 2
| 项目 | 2012年 | 2016年 | ||||
|---|---|---|---|---|---|---|
| Moran's I | z值 | p值 | Moran's I | z值 | p值 | |
| 化学需氧量排放量 | 0.1666 | 3.6114 | 0.0003 | 0.1309 | 2.9777 | 0.0029 |
| 氨氮排放量 | 0.1592 | 3.6328 | 0.0003 | 0.1933 | 4.4142 | 0.0000 |
| 二氧化硫排放量 | 0.2186 | 4.8671 | 0.0000 | 0.1865 | 4.1760 | 0.0000 |
| 氮氧化物排放量 | 0.1847 | 4.0896 | 0.0000 | 0.2720 | 5.9211 | 0.0000 |
| 环境胁迫指数 | 0.2014 | 4.3945 | 0.0000 | 0.2325 | 5.0628 | 0.0000 |
新窗口打开|下载CSV
图3
 新窗口打开|下载原图ZIP|生成PPT
图32012—2016年京津冀环境胁迫指数冷、热点区空间变化
Fig. 3Spatial changes of ESI in cold and hot spots in Beijing-Tianjin-Hebei region in 2012 and 2016
从2012年的热点图来看(图3a),热点区域包括天津和唐山市辖区以及滨海新区、曹妃甸区、滦南县、乐亭县等13个县域单元,基本覆盖天津和唐山全域;次热点区包括热点区外围以及磁县、涉县、武安市、平山县、灵寿县和怀来县等23个县域单元,在津唐周边和秦皇岛集中分布,河北西部山区零散分布。至2016年(图3b),热点区微增至14个,其中,迁西、涉县由次热点变为热点区,武清区变为次热点区,热点区域基本稳定,京津冀西南部初现高值区集聚格局;次热点区在2016年减少至21个,北京所辖县域均退出次热点区范围。热点区、次热区的环境胁迫指数平均值分别从2012年的0.26、0.11下降至2016年的0.12、0.06,表明尽管在京津冀地区的环境胁迫集聚格局未变,但通过区域性环境污染物协同减排和控制,仍然能够实现环境胁迫程度整体缓解。从冷点区变化来看,2012年环境胁迫指数的冷点区均位于河北省境内,主要分布在保定、沧州、衡水和邢台,共计58个县域单元;次冷点区以京津冀北部和中西部为主,基本覆盖承德、北京和石家庄全域;至2016年,环境胁迫指数的冷点区总量不变,低值集聚区向京津冀地区的西北部延伸,即张家口所辖县域和密云区变为冷点区。
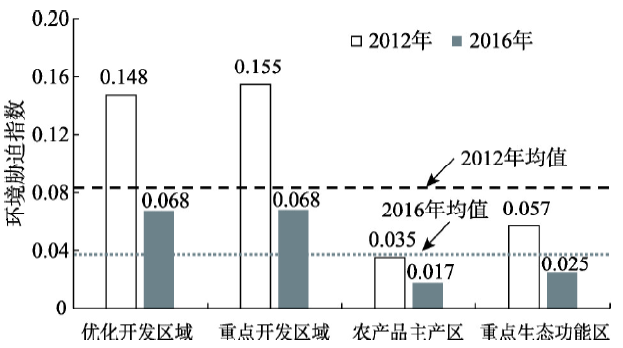
3.1.3 各类主体功能区环境胁迫特征 按照优化开发区域、重点开发区域、农产品主产区和重点生态功能区,对各类主体功能区的环境胁迫指数进行分解。两类城市化地区环境胁迫程度显著高于限制开发区域,且是京津冀地区水和大气污染物排放的主要承压区(图4)。2016年重点开发区域县域的环境胁迫指数均值最高为0.0683,略高于优化开发区域0.0677,分别是重点生态功能区和农产品主产区的2.72倍和3.93倍。同时,优化开发区域、重点开发区域的环境胁迫指数占京津冀地区总和的65.98%,即城市化地区承载了超过6成的污染物排放压力,是京津冀主要环境胁迫区,而农产品主产区和重点生态功能区的占比仅为15.60%、18.42%。
图4
 新窗口打开|下载原图ZIP|生成PPT
图42012—2016年京津冀主体功能区环境胁迫指数
Fig. 4The ESI of major functional zones in Beijing-Tianjin-Hebei region in 2012 and 2016
对比5年间胁迫指数均值发现,京津冀地区各类主体功能区的环境胁迫指数降低幅度均在50%以上。其中,降幅最大的为重点生态功能区,环境胁迫指数均值较之2012年下降了56.51%,降幅最小的农产品主产区也在50.94%。当然,城市化地区是水和大气污染物排放主要承压区的特征未变,优化开发和重点开发区域仍然是京津冀地区环境污染防治的重点。分各省市来看,北京的优化开发和重点开发区域、重点生态功能区降幅依次为64.84%、61.51%、62.32%,是京津冀地区降幅最突出的省市,反映出在京津冀协同发展背景下,北京的非首都功能疏解给自身环境胁迫态势带来更明显的改善。
3.2 京津冀地区县域环境胁迫驱动因素分析
3.2.1 模型构建和结果检验 借鉴既有研究STIRPAT模型设定和因素选择经验[36,37],兼顾县级行政区数据的可获得性和代表性,构建县域环境胁迫驱动因素的GWR回归模型。其中,县域环境胁迫指数为被解释变量,从人口规模、经济发展水平、工业化水平、国土开发强度、环境处理技术水平、城镇化水平以及农业生产投入强度等方面选取相应指标作为解释变量。回归模型如下:式中:ESIi为县域环境胁迫指数;TPi为年末常住人口(万人),反映县域人口规模;PGDPi为人均国民生产总值(元/人),反映县域经济发展水平;ISi为第二产业增加值占GDP比重(%),反映县域工业化水平;TDIi为建设用地面积占县域土地总面积的比重(%),反映县域国土开发强度;因县域环境技术指标难以直接获取,借鉴相关研究通过单位GDP排污强度(ETTi)替代反映县域环境处理技术水平[38];URi为城镇化率,反映县域城镇化水平;IAPi为农业生产投入强度,通过农业机械总动力和化肥使用量测算得到[15, 39];εi为误差项。
在进行GWR模型建模之前,对其进行全局OLS回归以比较拟合优度。结果显示(表3),Koenker (BP)统计量检验结果通过1%显著性检验,说明模型具有统计学上的显著异方差性(非平稳性),且需要采用卡方统计量评估解释变量的统计显著性;联合卡方统计量通过1%显著性检验,即所有解释变量对模型均有一定解释力;方差膨胀因子VIF均小于7.5,变量不存在冗余及多重共线性;Jarque-Bera检验结果通过1%显著性检验,回归系数残差非正态分布;决定系数R2表明OLS回归只能解释约80%的环境胁迫指数,变量存在空间异质性,需引入GWR模型分析。GWR模型以县域单元的中心经纬度为地理坐标,选择固定距离法确定高斯核函数(Fixed Gaussian),通过AIC最小信息准则决定最佳带宽。拟合结果如表4所示,GWR模型的AIC值显著小于OLS模型,校正R2较之OLS模型提升11.89%和14.74%,反映出GWR模型在考察驱动因素的空间异质性方面效果更好。
Tab. 3
表3
表3京津冀地区县域环境胁迫驱动因素OLS模型估计结果
Tab. 3
| 变量 | 2012年 | 2016年 | ||||||||
|---|---|---|---|---|---|---|---|---|---|---|
| 系数 | 标准差 | T统计量 | p值 | VIF | 系数 | 标准差 | T统计量 | p值 | VIF | |
| 截距 | -0.1521** | 0.0200 | -7.5971 | 0.0000 | — | -0.1939** | 0.0232 | -8.3752 | 0.0000 | — |
| TP | 0.8183** | 0.0691 | 11.8378 | 0.0000 | 1.9735 | 0.6341** | 0.0764 | 8.2948 | 0.0000 | 2.0188 |
| PGDP | 0.7390** | 0.0684 | 10.8029 | 0.0000 | 1.4166 | 0.6220** | 0.0764 | 8.1423 | 0.0000 | 1.3983 |
| IS | 0.0413 | 0.0277 | 1.4900 | 0.1062 | 1.1709 | 0.0763* | 0.0324 | 2.3520 | 0.0034 | 1.2015 |
| TDI | -0.1650** | 0.0498 | -3.3139 | 0.0044 | 2.4017 | -0.1347** | 0.0543 | -2.4799 | 0.0131 | 2.3414 |
| ETT | 0.3260** | 0.0351 | 9.2818 | 0.0000 | 1.0524 | 0.3028** | 0.0319 | 9.4878 | 0.0000 | 1.0906 |
| UR | 0.2135** | 0.0346 | 6.1780 | 0.0001 | 2.0578 | 0.2630** | 0.0378 | 6.9495 | 0.0001 | 2.0217 |
| IAP | 0.2802** | 0.0326 | 8.5851 | 0.0002 | 1.0872 | 0.2515** | 0.0349 | 7.1992 | 0.0007 | 1.1159 |
| 模型 诊断 | 卡方 统计量 | 校正R2 | AIC | Koenker (BP)检验 | Jarque- Bera检验 | 卡方 统计量 | 校正R2 | AIC | Koenker (BP)检验 | Jarque- Bera检验 |
| 1277.1215 | 0.8469 | -411.5215 | 33.50139** | 3816.7202** | 996.9724 | 0.7847 | -376.3448 | 31.2104** | 3411.6170** | |
新窗口打开|下载CSV
Tab. 4
表4
表4京津冀地区县域环境胁迫驱动因素GWR模型估计结果
Tab. 4
| 变量 | 2012年 | 2016年 | |||||||||||
|---|---|---|---|---|---|---|---|---|---|---|---|---|---|
| 最小值 | 最大值 | 平均值 | 上四 分位数 | 中位数 | 下四 分位数 | 最小值 | 最大值 | 平均值 | 上四 分位数 | 中位数 | 下四 分位数 | ||
| 截距 | -0.407 | -0.035 | -0.137 | -0.170 | -0.094 | -0.073 | -0.399 | -0.084 | -0.169 | -0.197 | -0.146 | -0.122 | |
| TP | 0.658 | 2.896 | 1.307 | 0.798 | 1.083 | 1.655 | 0.420 | 2.985 | 1.055 | 0.571 | 0.867 | 1.306 | |
| PGDP | -1.277 | 2.071 | 0.973 | 0.704 | 0.749 | 1.540 | 0.020 | 3.405 | 0.868 | 0.554 | 0.607 | 0.936 | |
| IS | -0.052 | 0.244 | 0.032 | -0.020 | 0.007 | 0.060 | -0.040 | 0.345 | 0.071 | 0.026 | 0.047 | 0.094 | |
| TDI | -1.110 | 0.052 | -0.145 | -0.144 | -0.095 | -0.058 | -0.377 | 0.088 | -0.074 | -0.107 | -0.062 | -0.022 | |
| ETT | 0.150 | 0.621 | 0.327 | 0.210 | 0.293 | 0.429 | 0.171 | 0.486 | 0.275 | 0.227 | 0.252 | 0.302 | |
| UR | -0.004 | 0.459 | 0.136 | 0.076 | 0.097 | 0.165 | 0.004 | 0.352 | 0.157 | 0.110 | 0.144 | 0.197 | |
| IAP | -0.165 | 0.918 | 0.202 | 0.014 | 0.161 | 0.395 | -0.119 | 0.544 | 0.182 | 0.028 | 0.161 | 0.301 | |
| 模型 诊断 | 带宽 | 校正R2 | AICc | 带宽 | 校正R2 | AICc | |||||||
| 99877.656 | 0.948 | -527.574 | 105540.116 | 0.900 | -454.605 | ||||||||
新窗口打开|下载CSV
3.2.2 驱动因素及其空间异质性分析 OLS模型估计结果表明,2012—2016年对京津冀地区县域环境胁迫具有显著正向驱动的因素为:人口规模、经济发展水平、环境处理技术水平、农业生产投入强度和城镇化水平。在2012年,人口规模每提高1%,将引起环境胁迫指数增加0.8183%;经济发展水平每提高1%,将引起环境胁迫指数增加0.7390%;通过单位GDP排污强度指数表征的环境处理技术水平每提高1%,将引起环境胁迫指数增加0.3260%;农业生产投入强度每提高1%,将引起环境胁迫指数增加0.2802%;城镇化水平每提高1%,将引起环境胁迫指数增加0.2135%。从其变化来看,人口规模、经济发展水平驱动强度下降明显,2016年人口规模、经济发展水平因素的弹性系数分别降低了22.51%和15.83%;环境处理技术水平的驱动强度则保持在0.3%左右,反映出环境处理技术提升有助于县域清洁生产生活方式形成,从而实现污染排放强度降低,并达到缓解环境胁迫程度的效果。在2016年,工业化水平回归系数也通过5%显著性检验,表明工业在产业结构中的比重提升对县域环境胁迫的拉动开始显现,工业比重每提高1%,将引起环境胁迫指数增加0.0763%;2016年城镇化水平的作用增大,已超过农业生产投入强度的驱动作用。此外,国土开发强度呈显著负向驱动作用,国土开发强度每提高1%,将会使环境胁迫指数降低0.13%~0.17%。如表4所示,GWR模型估算的回归系数平均值反映因素的边际贡献度[40],各驱动因素呈现的驱动效应与OLS模型估计结果基本一致。进一步生成GWR模型回归系数的空间分布图(图5),各驱动因素的空间异质性呈现以下特征:
图5
 新窗口打开|下载原图ZIP|生成PPT
图5京津冀县域环境胁迫驱动因素回归系数空间分布图
Fig. 5Spatial distribution of regression coefficients in Beijing-Tianjin-Hebei region
(1)人口规模因素的回归系数在京津冀全域均为正,人口规模增大将显著加大县域环境胁迫程度。2012年以来,人口规模对县域环境胁迫的影响由西南和东北向中西部递减,其中,石家庄、邯郸、邢台等冀中南地区所受影响最大,而对北京、天津两个特大城市及周边、张家口和承德等地区影响较小。这意味着,在京津疏解城市人口的背景下,南部作为过剩人口转移的主要承接地区,未来人口规模增长潜力仍然较大,但鉴于区内人口增长与环境胁迫的正向耦合效应,应警惕人口过快增长和过度集中导致环境恶化风险。
(2)经济发展水平因素的回归系数在京津冀全域均为正,人均GDP提高将显著加大县域环境胁迫程度,且经济发展水平对县域环境胁迫的影响由南向北递减。按照环境库兹涅茨曲线规律,可推测京津冀中部、北部更接近倒“U”型曲线的拐点位置。从2016年回归系数分布来看,经济发展水平的驱动强度在中部优化开发区域呈现减退,反映出该类主体功能区以牺牲环境作为代价的发展方式逐步转变,使得环境高胁迫态势改善。
(3)工业化水平因素在2016年通过了显著性检验,其对县域环境胁迫程度的作用方向具有空间分异。在东部唐山、秦皇岛一带呈显著正向驱动,而在张家口和邯郸东南部呈显著负向驱动,即第二产业比重增加有利于环境胁迫程度缓解。结合县域工业部门分析发现,可瞄准对县域环境胁迫呈强驱动(皮尔逊相关系数r>0.5且显著性p < 0.05)的重污染工业企业进行技术改造和升级,具体包括非金属矿物制品业、黑色金属冶炼和压延加工业、石油加工炼焦业、电力热力生产和供应业、煤炭开采和洗选业、化学原料和化学制品业、金属制品业、医药制造业等行业类型。
(4)国土开发强度因素的回归系数在2012年以负向驱动为主,但到2016年,国土开发强度在衡水、沧州南部、承德北部等地区呈显著正向驱动力,表明建设用地扩张对这类重点开发区域的环境胁迫驱动作用开始显现,需要加强建设用地管控,严防城市蔓延扩张、工业遍地开花和开发区过度分散引发污染扩散。针对冀北地区处于京津冀地区“上风山水”的特殊区位,应适度收紧该类重点生态功能区的土地开发政策,以实现生态涵养功能维系和生态环境安全风险防范。
(5)环境处理技术水平因素的回归系数在京津冀全域均为正,因采用单位GDP排污强度指数反映环境处理技术水平,指数值越大则反映环境处理技术水平越低。故表明环境处理技术水平偏低将加剧区域环境胁迫程度,该因素在空间上呈京津唐地区向外围递减趋势,在北京、天津及其以北一带,污染处理能力仍难以应对居高不下的环境胁迫态势。
(6)城镇化水平因素在2016年通过显著性检验,回归系数在京津冀全域为正,城镇化率提高将显著加大县域环境胁迫程度。2012—2016年间,尤其在环渤海津唐、邢台、张家口等地区,人口城镇化直接驱动生活源污染物的高强度排放,城镇化过程是加大县域环境胁迫程度的重要原因。
(7)农业生产投入强度因素的回归系数在京津冀全域均为正,并呈东北向西南递减特征。除南部邯郸和邢台市外,农业生产投入强度提高显著加大县域环境胁迫程度。表明引导农户采用清洁生产方式,从源头上控制农业面源污染发生,对缓解京津冀地区的环境胁迫态势具有重要意义。
综上各因素及空间异质性分析发现,京津冀地区的县域环境胁迫受人口规模和经济发展水平两个控制性因素作用,并在四类区域呈差异化的多因素驱动模式:中部的核心功能区呈城镇化和环境处理水平因素强驱动,城镇生活源的污染防治是管控焦点,区内应强化与人居环境直接挂扣的污染物排放总量控制与质量标准考核,倒逼城镇生产、生活与消费方式转变;东部的滨海发展区呈工业化和城镇化因素强驱动,针对区内工业结构及高排放特点,应突出环境准入清单的分类管理,引导高耗能、高污染产能淘汰,约束能源重化工行业发展规模,通过城镇生活空间与工业空间布局优化促进与环境胁迫脱钩;南部的功能拓展区呈人口规模、经济发展水平和城镇化因素强驱动,区内应加强环境基础设施配套,提升区域综合承载力中环境短板的同时,以优质人居环境增强城市自身的人口吸引力;西北部的生态涵养区呈城镇化和农业生产投入因素强驱动,区内应在城镇开发边界落地基础上突出污染源头管控,健全涉农产污过程的处置与回收体系,鼓励发展生态农业、绿色农业、有机农业,逐步削减农业面源污染物排放量。
4 结论与讨论
(1)京津冀地区面临的环境胁迫态势显著缓解,2012年以来县域ESI平均降幅达到54.68%,县域环境胁迫程度由中心城区向外围呈现梯度递减。到2016年环境胁迫高等级县域已经消除,较高等级县域也从10个降至6个。其中,北京、唐山、天津、石家庄、邯郸的中心城区以及滨海新区显著下降,北京县域ESI降幅为63.35%,高于天津(57.75%)和河北(53.07%)县域降幅。(2)京津冀地区县域环境胁迫的空间溢出效应趋强,2012—2016年县域ESI的Moran's I值由的0.2014增大到0.2325,并在津唐地区呈现显著的空间锁定和路径依赖。环境胁迫热点区和次热区ESI分别降低56.19%和44.93%,表明尽管环境胁迫的集聚态势未变,但通过区域性协同减排和环境治理,仍可实现环境胁迫程度整体缓解。
(3)城市化地区(优化开发和重点开发区域)是京津冀地区污染物排放的主要承压区,其环境胁迫程度占全域的65.98%,仍然是环境污染防治的重点区域。5年间,各类主体功能区ESI降幅均在50%以上,降幅最大的重点生态功能区下降56.51%,降幅最小的农产品主产区也在50.94%。
(4)OLS模型估计结果表明,2012—2016年间,对京津冀地区县域环境胁迫具有显著正向驱动的因素为:人口规模、经济发展水平、环境处理技术水平、农业生产投入强度和城镇化水平,其中,县域人口规模和经济发展水平是环境胁迫的控制性因素,同时二者驱动强度下降明显。进一步地,GWR模型拟合优度高于OLS模型,且各驱动因素对县域环境胁迫的驱动作用存在空间异质性,并在四类区域呈差异化的多因素驱动模式:中部的核心功能区呈城镇化和环境处理水平因素强驱动,东部的滨海发展区呈工业化和城镇化因素强驱动,南部的功能拓展区呈人口规模、经济发展水平和城镇化因素强驱动,西北部的生态涵养区呈城镇化和农业生产投入因素强驱动,需针对因素驱动作用的强度及其空间差异,采取差别化环境治理与源头减排对策,精准提升京津冀地区环境协同管制效果。
(5)本文基于京津冀地区县域环境胁迫指数,解析了协同发展背景下的环境胁迫时空格局及减排效应,并构建了影响因素计量模型,探讨了县域环境胁迫空间效应和驱动因素,为制定环境协同治理和污染物排放总量削减对策提供参考。未来,需要深化研究的方面包括:尽管本研究已初步表明,非首都功能疏解显著改善了北京自身的环境胁迫态势,相关资料也显示[41],2014年以来,北京市累计关停、退出、转移制造业企业1341家,煤炭消费量降低了55.19%,但是,以产业转移为代表的功能疏解过程,对转出地北京及转入地京津冀周边的环境胁迫过程研究有待深化;进一步加强机制研究,从不同排污强度属性的工业部门、各类主体功能区的环境规制等角度,解析县域环境胁迫的影响效应,研究环境胁迫对区域生产生活方式调适的作用和反馈机制;由于县域尺度的数据获取限制,本文选取的研究时间序列偏短,未来可在第二次全国污染源普查基础上完善时空面板数据,以进一步开展长时间序列机制研究。
参考文献 原文顺序
文献年度倒序
文中引用次数倒序
被引期刊影响因子
[本文引用: 1]
[本文引用: 1]
[本文引用: 1]
[本文引用: 1]
[本文引用: 2]
[本文引用: 2]
//
[本文引用: 1]
[本文引用: 1]
[本文引用: 1]
[本文引用: 1]
[本文引用: 1]
[本文引用: 1]
[本文引用: 1]
[本文引用: 1]
DOI:10.1016/j.ssresearch.2017.11.009URLPMID:29455744 [本文引用: 1]

This study investigates the presence of environmental inequality in Germany and analyses its spatial pattern on a very fine grained level. Using the 2011 German census and pollution measures of the E-PRTR, the study relies on nearly 100,000 one squared km census cells over Germany. SLX and community-fixed SLX models incorporate spatial spillover-effects into the analysis to account for the spatial distribution of socio-demographic characteristics. Results reveal that the share of minorities within a census cell indeed positively correlates with the exposure to industrial pollution. Furthermore, spatial spillover effects are highly relevant: the characteristics of the neighbouring spatial units matter in predicting the amount of pollution. Especially within urban areas, clusters of high minority neighbourhoods are affected by high levels of environmental pollution. This highlights the importance of spatial clustering processes in environmental inequality research.
URLPMID:30469058 [本文引用: 1]
[本文引用: 1]
[本文引用: 1]
[本文引用: 1]
[本文引用: 1]
[本文引用: 1]
[本文引用: 1]
DOI:10.13287/j.1001-9332.201907.031URLPMID:31418240 [本文引用: 2]
Based on pollutant emissions and social-economic data during 2011 and 2015, we selec-ted the total emission index of four pollutants, including the industrial source, agricultural source, and urban living source. The comprehensive index of environmental pollution and sub-source pollution index were built to reflect the pollution of Jilin Province at county scale. Furthermore, the Moran's I, spatial-temporal transition analysis, and standard deviation ellipse analysis were used to quantitatively examine the spatial-temporal evolutionary characteristics of environmental pollution in Jilin Province. A spatial econometric model was built to analyze the influencing factors of environmental pollution. The results showed that environmental pollution in Jilin Province presented spatial agglomeration characteristics, which was mainly concentrating in central areas such as Changchun and Jilin cities. There were obvious regional differences in the spatial distribution of environmental pollution from different sources. There were spatial correlation of the total environmental pollution and agricultural source pollution separately at county scale in Jilin Province. The correlation structure stability of the spatial distribution of environmental pollution was high, which had path locking characteristic. The spatial distribution of environmental pollution showed a northwest-southeast distribution pattern and a spread from the center to the surroundings. The barycenter of environmental pollution moved in the area between 43.65-43.66 degrees N and 125.83-125.84 degrees E. The level of regional economic development, urbanization level and agricultural production were main driving factors for county-scale environmental pollution and industrial source pollution. The adjustment and optimization of industrial structure had improved the overall environmental pollution and industrial source pollution situation. Overuse of chemical fertilizers significantly increased agricultural source pollution. The level of economic development and urbanization were the main drivers of urban living source pollution. The overall environmental pollution and agricultural source pollution had spatial diffusion effects, and their pollution status was closely related to the overall environmental pollution and agricultural source pollution status in adjacent areas, respectively.
PMID:31418240 [本文引用: 2]
DOI:10.1016/j.ecolecon.2004.02.011URL [本文引用: 1]
[本文引用: 1]
[本文引用: 1]
[本文引用: 1]
[本文引用: 1]
DOI:10.11821/dlxb201611004URL [本文引用: 1]
2 and various sources, the spatial differentiation and agglomeration effects of pollutant discharge are measured quantitatively in 339 cities at prefecture level or above in China. Meanwhile, the socio-economic drivers of environmental pollution are estimated through the econometric model, and some suggestions are put forward to reduce and control pollutant discharge. The results show that: (1) The regional differences of the structure of pollutant source are of great significance in China. Specifically, the types of water pollutant sources are mainly included in the region dominated by agricultural source, the region dominated by urban domestic source, and in the region jointly dominated by agricultural and urban domestic source, with the proportions of these regions being 35.40%, 33.92% and 25.66%, respectively. Among them, the discharge intensity of water pollutant is the highest in the region dominated by agricultural source, which are mainly located in North and Northeast China. Meanwhile, the types of air pollutant sources in China are mostly involved in the region absolutely dominated by industrial source, which accounts for 74.63% and is distributed in the vast area of China in addition to the Qinghai-Tibet Plateau. (2) Single and bivariate LISA cluster maps of total discharge and various sources indicate that the agricultural source makes contribution to the spatial agglomeration of high intensity discharge of water pollutants, while the industrial source leads to the concentrated discharge of air pollutants. Especially, in the Bohai Rim region and its economic hinterland, the structure of pollutant sources strengthens the agglomeration effects of pollutant discharge intensity. (3) By means of OLS estimation for nationwide regression model, it is demonstrated that population size, urbanization rate and economic growth are the main driving factors of environmental pollution, and population size is the key factor in China. Moreover, in terms of regression models of regional types, the economic development level makes different contributions to pollutant discharge in various regions, which shows a positive effect on the air pollutant discharge in the region dominated by industrial source, while shows a negative effect on the water pollutant discharge in the region dominated by urban domestic source. In addition, the degree of industrialization has positive influence on the air pollutant discharge in the region absolutely dominated by industrial source.]]>
[本文引用: 1]
[本文引用: 1]
[本文引用: 1]
[本文引用: 1]
[本文引用: 1]
[本文引用: 1]
[本文引用: 1]
[本文引用: 1]
[本文引用: 1]
[本文引用: 1]
[本文引用: 1]
[本文引用: 1]
[本文引用: 1]
[本文引用: 1]
[本文引用: 1]
[本文引用: 1]
[本文引用: 1]
DOI:10.11821/dlxb201801015URL [本文引用: 1]
2.5 concentration in 202 counties of Jing-Jin-Ji urban agglomeration using spatial analysis and visualization. Then we quantified the effect degree of different natural and human factors and the spatial spillover effect of these factors using Spatial Durbin Model (SDM). The results are as follows: (1) The PM2.5 concentration was on the rise as a whole from 2000-2014, and it was high in autumn and winter, while low in spring and summer. Seen from spatial distribution, the PM2.5 concentration was high in the southeast, while low in the northwest of the study area, and the concentration in urban built-up area was 10-20 μg/m3 higher than that of its surrounding suburban and rural areas. (2) The counties, whose PM2.5 concentration was below 35 μg/m3, only accounted for 13.9% in 2014. There were significant spatial agglomeration and diffusivity of PM2.5, and the mean distance interacting among the cities was 200 km. The PM2.5 of a city increased by more than 0.5% for every 1% increase in the average PM2.5 of neighboring cities. (3) Socio-economic factors have positive impact on PM2.5, and most of natural factors have negative impact. (4) Among the influencing factors, contributions to local atmospheric pollution with direct effect are: mean wind speed > annual mean temperature > population density > relief amplitude > the secondary industry share of GDP > energy consumption > vegetation coverage; however, per capita GDP, annual precipitation, and relative humidity have no significant effect on local pollution. (5) Contributions to neighborhood atmospheric pollution with spatial spillover effect are: vegetation coverage > relief amplitude > population density. The findings suggest that we should adopt the adaptation strategies for natural factors and control strategies for human factors. A coordinated and strengthened cooperation between local governments should be established for air pollution control, and environmental planning and legislation should be strengthened in a new round of urban agglomeration planning in China.]]>
[本文引用: 1]
[本文引用: 1]
[本文引用: 1]
[本文引用: 1]
[本文引用: 1]
[本文引用: 1]
[本文引用: 1]
[本文引用: 1]
[本文引用: 1]
[本文引用: 1]
[本文引用: 1]
[本文引用: 1]
DOI:10.1111/gean.1996.28.issue-4URL [本文引用: 1]
DOI:10.11821/xb201008009URL [本文引用: 1]
2, the study has become one of hotspots in the developing model of Chinese cities in order to slow down CO2 emissions. Using the STIRPAT model, this paper analyzed the impact of population, affluence, urbanization and technology on the total CO2 emissions, and the results showed that 1% change of population, per capita GDP, urbanization and technology would cause a corresponding occurrence of 0.618%, (0.178+0.009lnA)%, 0.816% and 0.264% change in the total CO2 emissions. Based on this study, taking Shanghai as an example, it set 10 developing scenarios and analyzed the best model of reducing CO2 emissions. Results show that under the scenario of economy, population in mid-speed, low urbanization and high technology, it would be best for Shanghai to reduce CO2 emissions, and the emissions of CO2 in 2010, 2015, 2020 would be 17053.57, 19286.64, 20885.69 ten thousands tons, respectively.]]>
[本文引用: 1]
DOI:10.1016/j.enpol.2011.08.056URL [本文引用: 1]
With the intensification of global warming and continued growth in energy consumption, China is facing increasing pressure to cut its CO2 (carbon dioxide) emissions down. This paper discusses the driving forces influencing China's CO2 emissions based on Path-STIRPAT model-a method combining Path analysis with STIRPAT (stochastic impacts by regression on population, affluence and technology) model. The analysis shows that GDP per capita (A), industrial structure (IS), population (P), urbanization level (R) and technology level (T) are the main factors influencing China's CO2 emissions, which exert an influence interactively and collaboratively. The sequence of the size of factors' direct influence on China's CO2 emission is A>T>P>R>IS, while that of factors' total influence is A>R>P>T>IS. One percent increase in A, IS, P, R and T leads to 0.44, 1.58, 1.31, 1.12 and -1.09 percentage change in CO2 emission totally, where their direct contribution is 0.45, 0.07, 0.63, 0.08, 0.92, respectively. Improving T is the most important way for CO2 reduction in China. (C) 2011 Elsevier Ltd.
[本文引用: 1]
[本文引用: 1]
URL [本文引用: 1]
Features of the environmental Kuznets curve(EKC) potentially existing between the outputs of some main pollutants,i.e. COD and ammonia nitrogen,from agriculture in 2000-2009 and the economic development level in the same period in China are studied,and stage of the agricultural pollution and its ongoing tendedcy analyzed.Results show that the relationship between the outputs of COD and ammonia nitrogen from agriculture and the per capita agricultural GDP in 2000-2009 in China fits the features of EKC,suggesting that when the per capita agricultural GDP reaches ¥7037.04,the output of COD from agriculture arrives at an inflection point,where it is 14871400 tons;and when the per capita agricultural GDP reaches to ¥6513.03,the output of ammonia nitrogen from agriculture comes to an inflection point,where it is 1937200 tons.So if after 2009 the per capita agricultural GDP continues to grow at a rate of 5.76%,which was the lowest per capita agricultural GDP growth rate in 2000-2009,the output of ammonia nitrogen from agriculture will reach to an reflection point in the year of 2014 and the output of COD will in the year of 2016.Meanwhile,becase sharp differences exist between regions in output of the main pollutants from agriculture,in dustrial structure,demographic characteristics,and agricultural production,no obvious relationships that fie the EKC feature are found between the output of the main pollutants,i.e.COD and ammonia nitrogen,from agriculture and the per capita agricultural GDP in Liaoning,Jiangsu,Henan,Hubei,Guangdong,and Sichuan provinces.
[本文引用: 1]
URL [本文引用: 1]
Based on the spatial properties of the database and the final retained Jiangning District Residential land transfer data from 2004 to 2011, spatial expansion method and geographically weighted regression (GWR) model are applied to simulate the spatial heterogeneity of residential land market in urban district. The influencing factors of residential land price were also tested and analyzed. The results show the following aspects.1)Spatial expansion method and geographically weighted regression (GWR) model can be well applied to simulate spatial heterogeneity of land market in target area. The model could respectively explain 63% of the price changes of residential land and 61% of the price changes of residential land. The interpreting abilities improve significantly than that based on global regression model (47%). Both explanations capacity increased by 16%, 14% and spatial expansion method is slightly better than geographically weighted regression (GWR) model. 2) Spatial expansion method can effectively characterize the spatial structure of the overall trend, which is reflected from the explanatory variables and their interaction term effects on residential land. Geographically weighted regression (GWR) model has advantages in terms of the local parameter estimation. It can make the mode of action of each variable premium visualization by means of GIS. This is a strong rebuttal of the traditional assumptions that hedonic price model has coefficient stability. Overall, the spatial expansion model fits relatively better results. Compared with spatial expansion method, geographically weighted regression (GWR) model can more effectively depict spatial non-stationarity of the influencing factors. In the geographically weighted regression(GWR) model, the order of the average marginal contribution on the land premium from high to low is the distance from water, subway, college and CBD, facility, hospital. Additionally, two variables, the distance from facility and hospital, have the directional difference. 3) The distance from subway, water, university and CBD all have positive effect on marginal residential land price in the entire sample area. They are the key driving factors of residential land price.Each of the affecting patterns has a unique land premium space mode of action. Therefore it can provide scientific basis for segmentation of residential land market in target area. Marginal price effect of waters in residential areas of rapid urbanization is generally greater than industrial areas surrounding. The construction of the subway greatly contributed to construction land expansion of Crisscross and upgrading of residential land price. The construction of University City is also an important strategy for urban development in Urban District, The higher the density of University City, the more significant Its role in promoting residential land price. The marginal price effect of entral business dstrict (CBD) on residential land is progressively decreasing trend from the periphery inward City, but it still has upgrading effect on the surrounding residential land price.
[本文引用: 1]
[本文引用: 1]
[本文引用: 1]
