 , ����ΰ
Revealing the climatic impacts on spatial heterogeneity of NDVI in China during 1982-2013
GAOJiangbo, JIAOKewei�ո�����:2017-08-21
������:2018-12-6
�����������:2019-03-25
��Ȩ����:2019������ѧ�����༭�������ǿ��Ż�ȡ�ڿ����ף�����������¿�������ʹ�ã�ѧ���о���ѧ�����������н�ѧ�ȣ���������������ҵĿ��.
��������:
�����:
-->
չ��
ժҪ
�ؼ��ʣ�
Abstract
Keywords��
-->0
PDF (3689KB)Ԫ������ά��������������ղ�����
�������ø�ʽ����EndNoteRisBibtex�ղر���-->
1 ����
ֲ����½����֮������������Լ���̬ϵͳ����ά�ֺ��Ż��ȹ����з�������Ҫ����[1,2],��ȫ���仯������ָʾ������һ��ֲ��ָ����NDVI����ָʾ��߶�ֲ�����Ǻ�����������Ҫָ��,����ֵ�Ĵ�С���Ա���ֲ���ǿ��[3,4],������ӳ����̬ϵͳ�ṹ������������,�㷺Ӧ���ڵ���ѧ����̬ѧ��ȫ��仯��̬ѧ��������о�[5,6]����Ϊֲ�������������������绷������,����Ҫ�أ��¶Ⱥ�ˮ�ֵȣ���ֲ����ı仯����Ҫ����[7,8]�����������ĸı��ڴٽ�ֲ�����������Լ������������õ�ͬʱ,�����ܻ��ֲ�����������Ӱ��[9]�����,��ʾֲ���������仯�Ŀռ��ƽ�ȹ�ϵ������Ӧ���,��ΪӦ������仯��������̬ϵͳ��Ӧ�����ṩ��������,��Ϊ��ǰȫ��仯�о�����Ҫ����[10]����ȫ��������߶���,����仯��ֲ���֮��Ĺ�ϵ�õ��˹㷺��ע[11,12]��20����ȫ��DZ��ֲ���ľ�������������NPP��������仯��Ӱ��������13%[13],��������߶���,ֲ�������Ӧ����ȡ�������������뱳�������Ŀռ�������[14,15],����ɺ�����ֲ��NPP�ڼ��н�ˮ��Ӱ������������[16],��ʪ���ʪ�������ֲ��NPP���ڽ�ˮ���ӵ��������ܵ�����[17,18];�ڴ����ʪ��ı�������,����¶�ֲ��NDVI��Ӱ��Ϊ�����,���´��ɺ����������Ϊ�����,��NDVI������µ���Ӧ�������ָ�Ϊ����[19]������,ֲ���������仯��Ӧ�о���ʱ��߶ȵ�ѡ��ͬ��������Ҫ���塣�����ʹ����¶ȵ����ߴٽ�������á��ӳ�ֲ��������,������ֲ��������������Ӫ�����ʵ��ۻ�,��NDVI���^�¶ȵ���������ֳ�����ЧӦ[20]�����,Ӱ��ֲ���������������ʱ�ճ߶��ϵĵ���ЧӦ,����������ֲ����ϵ���ֳ���ȷ���Ժ�����������
��ǰ,ֲ���������仯�Ŀռ��ƽ�ȹ�ϵ������Ӧ����о�,��Ҫ�۽���ֲ���������仯�������Է��������ù���ʶ��,����Ժ�۳߶�����������ֲ�����ʱ�ձ�����,ͨ���ռ�ͳ�Ʒ����ֶ�,��ʾ�������������������Լ�ֲ�����̬��Ӧ����,�������Ϸ���NDVI������仯��ϵ�Ŀռ��ƽ���Ե��о�����,���д��ƽ�[21,22,23]�����ڴ�,����Ӧ�õ�����Ȩ�ع飨GWR���ȷ���,�о�1982-2013���й�ֲ��NDVI�벻ͬ����Ҫ�ؼ�����ʵĿռ��ƽ�ȹ�ϵ,�Ա�ʶ����Ҫ�ض�ֲ����Ŀ������ü���ֲ�����,������ֲ�����̬��Ӧ����仯�Ŀռ���,�����ƽ�ֲ��-�����ϵ�о�����������չ��
2 ������Դ���о�����
2.1 ����ָ��
����ѡȡ������ָ������¶�ָ�꣨ƽ�����¡�������¡�������£��Լ�ˮ��ָ�꣨��ˮ�������ʪ�ȣ�����������ʹ���й������ѧ���ݹ����������ṩ�ĵ�������������ֵ���ݼ�,��������ȱʧ��վ���ѡȡȫ����Χ��652������վ��,ʱ����Ϊ1982-2013�ꡣ�Ը��µ��¶Ⱥ����ʪ�����ݽ�������ƽ��,�����������º�����·ֱ�Ϊ������ߡ�����¶ȵ���ƽ��ֵ,�ֱ���������ҹ����¶�״��,�Խ�ˮ��������͵õ�����������ݡ����ʹ��Auspline������վ���������ݲ�ֵΪ50 kmդ������,�Ա�֮��ķ������㡣���ѡȡ��ֵ������δʹ�ù�������վ��,���ѡȡʱ��,����������������Ӧ��ֵ����ڵ����ݽ��жԱ���֤,��������¶�ָ���ֵ������ʵ��ֵ�����ϵ������0.99����,����ˮ�������ʪ��ָ������ϵ��Ҳ�ﵽ��0.92��0.86,��˲�ֵ���ȽϺ�,�ܹ����������������о���������,����ѡ��50 km�ռ�ֱ��ʵ�ԭ��,һ�����DZ�֤�о������ڿռ�����������ܹ�ͨ�������Լ���,��һ�������ܹ������������о��������ǽ�ˮ������ݼ���[24]��һ���ԺͿɱ��ԡ�2.2 ֲ��NDVI
NDVI���ݳ���������ֲ�����������Ǽ���̬�仯��ֲ���״��[25]������ѡȡ1982-2013��GIMMS NDVI���ݼ���Ϊֲ���ָ��,�����ݼ����������պ���֣�NASA��ȫ������ģ���о��飨Global Inventory Monitoring and Modeling Studies���ṩ,�ռ�ֱ���Ϊ8 km,ʱ��ֱ���Ϊ15 d��GIMMS NDVI���ݼ����о��ȸߡ����г����ص�,��ȫ������߶�ֲ���仯���о��еõ��㷺Ӧ��[26,27]���̶���ȡ���ϳɷ���Maximum Value Composite, MVC�����NDVI��ֵ,�Ը��·ݵ�ƽ��ֵ��Ϊ�����NDVI�Ľ��,��ʹ�����NDVI����ӳֲ������������仯�����µ��ݱ�����,����������������仯�Ŀռ��ϵ[20, 28]��Ϊʹ�ռ�ֱ���������ָ��һ��,ʹ��ArcGIS 10.3���������ز���,��8 km�ռ�ֱ��ʵ�NDVIת��Ϊ50 kmդ�����ݡ�2.3 ������ֲ��NDVI����ʱ仯����
���IJ��û���դ��߶ȵ���С���˷���OLS������������ֲ��ָ�����ʱ仯����,ͨ��ArcGIS 10.3�е�դ�����������ʵ�֡����Ʒ����ļ��㹫ʽΪ��ʽ�У���slopeΪ���Իع��б��,��ʾ�о�����ı仯���Ƽ�����;n��ʾ�о���ݵ�����,����Ϊ32;Yi��ʾ��i�������ֲ��ָ�����ֵ��
2.4 ����ֲ��NDVI�ռ��ƽ���Եı�������
������Ȩ�ع飨Geographically Weighted Regression, GWR������Brunsdon��[29]�����һ�ּ�ʵ�õľ���ռ��������,�����ڽ�ʾ�о������ڲ��ռ��ϵ�ı仯��GWRģ���Ƕ���ͨ���Իع飨��OLS������չ,�÷����IJ����ǿռ�λ�õĺ���,ͨ����ȡ�ֲ����������Ա������������ϵ�ڿռ�߶��ϵı��졣��ģ�͵ı�����ʽΪ��ʽ�У�yi��xik����i�ֱ�����ռ���i�����������Ա�����������;
GWRģ�Ͳ��þֲ���Ȩ��С���˷�,����Ȩ���������㵽�������۲��Ŀռ����ĺ���,���о���˥��ЧӦ��������ʽΪ��
ʽ�У���(��i, vi)�ǻع�ϵ������ƫ����;W(��i, vi)ΪȨ�ؾ���;X��Y�ֱ�����Ա�����������ľ���
GWR����һ����ø�˹ģ����ΪȨ�غ���,���д���������Ȩ��ֵ�����ĺ�����Ȩ�غ�������Ϊ��
ʽ�У���ijΪi��۲��j��Ȩ��;dij����i��j��ŷ����þ���;b�Ǵ��������۲���ľ���dij����bֵʱ,Ȩ����ij����0;����dij����0ʱ,��ij����1���������Ŵ�����ѡ��,����ͨ�����ø�˹ģ��,������AICc��Ϣ��ȷ�����Ŵ�����AICc��Ϊ����ģ�����Ժ;�ȷ�ȵ�ָ��,ȡֵԽ�ʹ���ģ�͵�ģ��Ч��Խ��,ͨ����ģ��AICc��ֵ����3ʱ,����н�СAICcֵģ�͵Ĵ���bΪ���Ŵ���[30]��
3 ��������
3.1 �й�ֲ��NDVI������仯��ϵ�ķ�ƽ������֤
GWR����Ӧ�õ�ǰ���ǵ����ռ�������Ա�������������ڿռ����,���ع�ϵ�������Ա����Ŀռ�λ�ö��仯[31]��Ϊ����ֲ֤��NDVI���䶯̬������仯�Ĺ�ϵ�ڿռ����Ƿ�ƽ��,�ֱ�Ծ�ֵ�ͱ��ʵĻع�������пռ�����ط�������1�����������,������ʹ�õ�GWRģ�ͻع�����������ָ��������0,˵��ѡȡ�IJ����������Ŀռ������,����Щ�ع�����ڿռ��Ͼ��з�ƽ����,��Zֵ������2.58,˵����0.01����ˮƽ�¾���ͳ�����塣���,GWR�����ܹ���Ϊȫ������ֳ�������Ҫ���ڲ�ͬ����λ�ö�NDVI���䶯̬�Ķ���Ӱ�졣Tab. 1
��1
��1��Ҫ��GWR�ع�����Ŀռ������ָ��Moran's I ��Zֵ
Tab. 1Moran's I and Z scores of regression coefficients for each factor in GWR model
| �ع���� | ƽ������ | ������� | ������� | �ܽ�ˮ�� | ���ʪ�� | |
|---|---|---|---|---|---|---|
| Moran's I | ��ֵ | 0.75 | 0.75 | 0.74 | 0.76 | 0.76 |
| ���� | 0.68 | 0.73 | 0.70 | 0.70 | 0.63 | |
| Z | ��ֵ | 41.58 | 42.03 | 41.22 | 42.07 | 41.99 |
| ���� | 34.18 | 39.72 | 36.64 | 37.28 | 30.54 | |
�´��ڴ�
3.2 �й�ֲ��NDVI���¶�ָ��Ŀռ��ƽ�ȹ�ϵ
1982-2013���й����NDVI�Ŀռ��ֲַ���ͼ1a��ʾ�����Կ���,��1982��2013���30����,�й����NDVI���ֳ��ɶ��ϵ���������ݼ��ı仯���ơ���NDVI���¶�ָ��ĵ�����Ȩ�ع�����֪,�ڶ����������Լ����ϲ�����,NDVI�������ڿռ��ϳʸ���ع�ϵ��ͼ1b��1c��1d��,˵������Щ����,ֲ����Ŀռ�ֲ����¶����߶��ܵ��������á�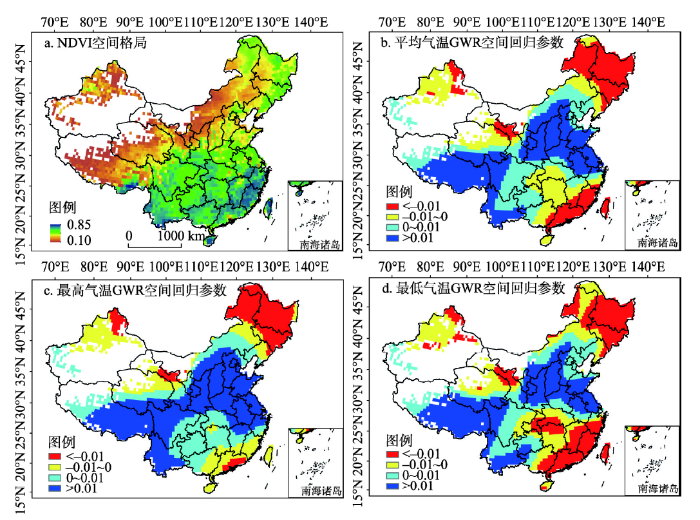 ��ʾԭͼ|����ԭͼZIP|����PPT
ͼ11982-2013���й�NDVI�ռ��ּ������¶�ָ���GWR�ռ�ع����
-->Fig. 1The spatial pattern of NDVI (a) and its spatial regression coefficients with temperature (b: average; c: maximum; d: minimum) in GWR model
-->
�ڶ�������������,3���¶�ָ���ֲ��NDVI�����˸���ЧӦ,�ڿռ���ֲ�����˥�����������µ�������������ˮ�ֵ���ɢ,��ǿ�˸ɺ��̶ȡ����ڶ��ϵ���,����������ɽ��ѩ��ɽ�Լ�����ƽԭһ��,���������¶�ֲ��NDVI�ĸ���������Ϊ���ԣ�ͼ1d��,˵��ֲ���������������ҹ�����µ����ߴٽ��˺�������,�����˸����ʵ�����������ġ�����,�������غ��ļ��ٲ��ֵ�����,1982-2013���й�ֲ��NDVI��ˮ��ָ���ڿռ��ϳ�����ع�ϵ,˵����ˮ�����ʪ�ȵ�ˮ��Ҫ�صı仯�����϶�ֲ����������á�
3.3 �й���ͬ����ֲ��NDVI�ռ�ֲ���������������
Ϊ��������Ӱ��,ʵ���¶���ˮ��ָ��֮��ıȽ�,��Ҫ��NDVI������ָ�����ֵ����0~1��������ͨ��GWR��������ع�ϵ��,�õ�ֲ����Բ�ͬ����ָ�����Ӧ��֡������ֲ��������ָ��ı仯����,�Ƚϲ�ָͬ��ı���ϵ��,ȷ��Ӱ��̶���ߵ�����ָ��,ʶ���ֲ����ռ�ֲ��������������Ӽ�����������ͼ2����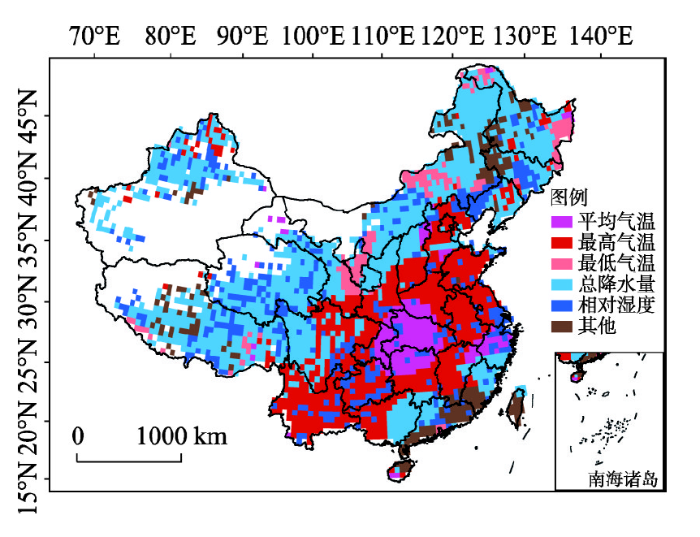 ��ʾԭͼ|����ԭͼZIP|����PPT
ͼ2��ͬ����Ҫ�ض��й�ֲ���Ӱ�����������
-->Fig. 2The effect regions of climatic factors to vegetation activity in China
-->
������������,�ڻ���ƽԭ������������ƽԭ���Ĵ�����Լ��ƹ��ԭ�ȵ���,ֲ��NDVI�ܵ��¶ȵĿ������ø�Ϊ��������2���������������¶ȶ�ֲ��NDVI������������,ռȫ���������24.81%���ڶ�������,�¶��ڿռ��������ߴٽ���ֲ�������ǿ,��λ�����������ϲ��ֵ������¶�����������,ֲ��NDVI������º������������ڿռ��ϳʸ���ع�ϵ��ͼ1b��1c��,���,��Щ����ֲ����ļ�����Ҫ���ܵ��¶����ߵ��������á�
Tab. 2
��2
��2��ͬ����Ҫ�������������й��ķֲ�����
Tab. 2The distribution proportion of effect regions of climatic factors in China
| ƽ������ | ������� | ������� | �ܽ�ˮ�� | ���ʪ�� | ����Ҫ�� | |
|---|---|---|---|---|---|---|
| դ������ | 187 | 743 | 131 | 1278 | 454 | 202 |
| ����(%) | 6.24 | 24.81 | 4.37 | 42.67 | 15.16 | 6.74 |
�´��ڴ�
�ڶ���ƽԭ�����ɹŸ�ԭ������ɽ����ɽ�Լ���ظ�ԭ�ȵ���,ֲ��NDVI�ռ������ܵ�ˮ�ֵ�Ӱ�������ǿ�ҡ����н�ˮ��ֲ��NDVI����������ֲ����,ռȫ���������42.67%,�����ʪ�ȶ�ֲ��NDVI��������ķֲ����Ϊ��ɢ��ͼ2������Ϲ�ȥ30����Ľ�ˮ�仯���ƣ�ͼ3b�����з������Կ���,����ƽԭ�������Ľ�ˮ����,ֲ����ڿռ��ϵļ����ܵ�ˮ����������������,�����µ�������ʹ����ɢ�ӿ�,���¸ɺ���,ˮ����������ֲ������������ý�һ���Ӿ�;��������ɽһ������NDVI����������Ϊ���ԣ�ͼ3a��,��ˮͬ�����ֳ���������,�����ˮ�ֺ�������ֲ�������ǿ�����ƶ����á�
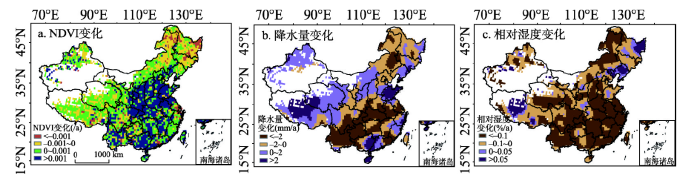 ��ʾԭͼ|����ԭͼZIP|����PPT
ͼ31982-2013���й�NDVI����ˮ�������ʪ�ȵı仯���Ʒֲ�
-->Fig. 3The spatial distribution of NDVI (a), precipitation (b) and relative humidity trend (c) during 1982-2013
-->
3.4 ֲ��NDVI��̬��������ʵ���Ӧ���
��������ֲ��NDVI���ʵ�GWR���������Կ���,NDVI������3���¶�ָ����ʾ�Ϊ�ռ为��ع�ϵ�ĵ�����Ҫ�ֲ�������ƽԭ�����˰����ϲ�,�Լ��������ϲ��غ�������ͼ4�����������غ����ֵ�����,���������NDVI����������ͼ3a��,����������Խ��ĵط�,ֲ�������ǿ����Խ����Ȼ����Щ������û��λ���¶�ָ�����������ͼ2��,���ֲ����ܵ�ˮ�ֻ��������ص�Ӱ��̶�Ҫ�����¶ȡ��ɼ�����Щ����,�������ʵ�������������ˮ���Լ�ֲ������ˮ�ֵ�ɢʧ,��������ֲ��������������á�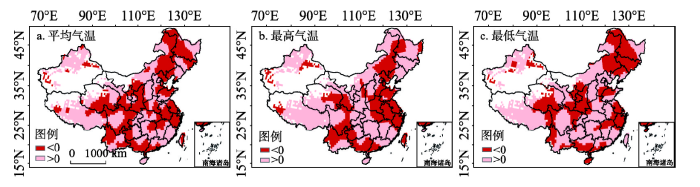 ��ʾԭͼ|����ԭͼZIP|����PPT
ͼ4�й�NDVI�����벻ͬ�¶�ָ����ʵ�GWR�ռ�ع����
-->Fig. 4The spatial regression coefficients between NDVI variability and temperature variability (a: average; b: maximum; c: minimum) from GWR model
-->
���ƹ��ԭ�����Լ�����������ƽԭ����,NDVI�ı仯��Ϊ�������ƣ�ͼ3a����NDVI������������±����ڿռ���Ϊ����ع�ϵ,����ƽ��/������±���ȴΪ����أ�ͼ4��,���,ֲ����ܵ��¶ȱ��ʵIJ���Ӱ����Ҫ����������±����������ڿռ���,������±��ʵ�������,ͨ����ǿֲ���������á�����������õķ�ʽ,��ֲ��������������á�������������ˮ��ָ���Ϊ�½����ƣ�ͼ3b��3c��,NDVI���ʶ�ˮ�ֱ��ʵĿռ��ϵ������ͬ��ǰ�ߵ�NDVI�����뽵ˮ��ʪ�ȱ����Կռ为���Ӱ��Ϊ��,��ˮ��Ҫ���½����ʿ������,ֲ�����ǿ������Խ��;�����ߵ�NDVI���ʶ�ˮ�ֱ��ʾ�������ع�ϵΪ��,��ֲ�������ǿ��������ˮ���½����ʵ����Ӷ�������ͼ5����
 ��ʾԭͼ|����ԭͼZIP|����PPT
ͼ5�й�NDVI�����벻ͬˮ��ָ����ʵ�GWR�ռ�ع����
-->Fig. 5The spatial regression coefficients between NDVI variability and moisture variability from GWR model
-->
�ڶ����Ĵ��˰��뱱��������ɽ����,NDVI��ˮ��ָ��ı仯�����ֳ��½����ƣ�ͼ3����NDVI������������±����ڿռ���Ϊ����ع�ϵ,����ƽ��/������±���ȴΪ����أ�ͼ4��,���,ֲ����ܵ��¶ȱ��ʵIJ���Ӱ����Ҫ����������±���������������±��ʵ����ͨ������ֲ��ҹ��ͬ�����ʵķ�ʽ���ӿ�������������,��Ϊֲ�����������Ҫ�������ء�ͬʱֲ��NDVI������ˮ�ֱ����ڿռ��ϳ�����ع�ϵ��ͼ5��,˵���õ���ֲ����ļ����ܵ��¶Ⱥ�ˮ�����ʱ仯�Ĺ�ͬӰ��;��ͬ����������¶ȱ���Ӱ���Ϊ����������,������ԭ������NDVI�뽵ˮ������������ͼ3a��3b��,NDVI���ʶԽ�ˮ���ʵĹ�ϵͬ��Ϊ����أ�ͼ5a��,��˸õ���ֲ�������ǿ�ܵ���ˮ���ʵ�Ӱ��Ҫ��Ϊ����,��һ���̶����������¶ȱ��ʶ�ֲ���������ЧӦ����Ҳ��õ������ڽ�ˮ��������Ľ����һ�£�ͼ2����
4 ����������
�й���ͬ����������о�����,�����¶ȵ�����,ֲ������¶ȵ���ӦԽ��Խ����[32,33]���ڴﵽ��������������¶�ǰ,�¶ȵ�����ٽ��������[34];��������һ�¶�ʱ,һ��������ֲ���ĺ�������,����Ӫ�����ʵ�����,��һ���������ˮ����ɢ�ļӿ�,�����ʵĻ��ۼ���[35]������,������º�������¶�ֲ��������ù�������ʽ��Ҳ���ڲ��졣ˮ�ֵı仯������һ���̶��ϵ���ֲ���,��ˮ�ֵ�����Ҳ����ͨ�����������ʪ�ȵ���������ֲ��������,ֲ�������Ӧ����仯���������ֳ������Թ��̺�����ЧӦ,��Ҫ�Ӷ������ۺϷ����ĽǶȼ��ֲ����ռ�ֲ���ʱ�䶯̬���ɡ�����ģ����ֲ���������Ҫ�صĿռ��ƽ�ȹ�ϵ,������NDVI��̬��ˮ��ָ����ʵĻع�,�����˲�ͬ����������������Ӽ������û��ơ�ˮ�ֶ�ֲ��NDVI����������������Ҫ�������ҹ������Լ���ظ�ԭ����,��Щ������ֲ�������ܵ�ˮ�ֵ�����,��ˮ��ʪ�ȵ������ܹ��ٽ�ֲ������,���¶��������������ˮ����ɢ��ǿ,�Ӿ�ɺ�����[36];�¶ȶ�ֲ��NDVI���������������ڻ��������м����ϵ���,��Щ����������ˮ�ֺ�����Ը�,��ˮ����,�¶ȵ�����������ֲ�����������ӳ����������Ļ���,���ֲ������¶ȵĹ�ϵ��Ϊ����[5]��
������ʵĻع������ֲ���������Ҫ����Ӧ����������,������ֲ���������仯��Ӧ�Ķ�̬����,�ܹ����õĽ����¶Ⱥ�ˮ����ֲ���֮��Ķ�̬��ϵ���������ʵ����߶�ֲ��NDVI����������,�Ҳ�ͬ�¶�ָ���Ӱ��̶�������ͬ,�������ʮ������;��ˮ�ֱ��ʵ���Ӧ��ֲַ�����,��һ���̶����ܹ�ƽ��ֲ�������������ˮ�����,��ֲ���״������Ҫ�ĵ������á�ֲ�����ǿ��ȡ���ڹ�ϡ��������̶�����Ҫ�ص���Ӧ����[37],��������ʵ����ӳ�����������ʱ,������ʵ���������õ������֡��ɼ�,��ֲ��NDVI�ı仯�����������Ϊ�о�������з���,�ܹ����õ�����ֲ�����̬������仯��ϵ,ͻ��������仯��ֲ������Ƶ�Ӱ�졣
Ȼ��,ֲ��NDVI�ܵ�����ͷ��������ص��ۺ�Ӱ��,�����ڹ�ע��ͬ����NDVI�ռ������Ե�Ӱ������ʱ������������Ҫ��,��ʵ��,���������Ļ�������Ҳ��Ӱ�쵽ֲ����Ŀռ�������,�������κ�����������,����ijЩ������ֲ��������߳̾������������,ֲ���˻��ĵ�����Ҫ�����ڵͺ��κ͵��¶���[38],�������������ʵIJ���Ҳ��Ӱ��ֲ�����������͵Ŀռ�������[39]������,���ģ����̬����Ҳ��Ӱ����̬��������Ҫ����[31, 40]�����������õ�GWRģ��,���ں��ǻ��ھֲ���Χ�Ŀռ�ع�,������������Χ�ھ���һ���̶ȵ�������,��ͨ���÷����ܹ���ʾ�������Ӷ���ֲ��NDVI�ռ������Ե�Ӱ��;����,����GWR����������ȫ�����������̬ϵͳ��Ӱ��,���ͨ����������õ�ֲ��NDVI���������ӿռ�ع����Ҳ����һ���̶��ϼ�ӷ�ӳ������Ӱ��̶ȼ���ռ�����ԡ�
The authors have declared that no competing interests exist.
�ο����� ԭ��˳��
������ȵ���
������������
�����ڿ�Ӱ������
| [1] | . Vegetation coverage is an important indicator ofweighting ecological environment;grassland ecosystem plays animportant role in regional ecological safety and sustainabledevelopment.Statistics was used to analysis the grasslandcoverage changes in Maqu County.Results showed that:1)thegrassland coverage show decreasing trend overall,and has periodcharacteristics;2)changes in grass coverage both have positiveand negative conversion,depending on using rationality ofgrassland resource;3)Climate warming and drying andirrational exploitation activities are the main driving factors ofecological environment deterioration;4)Prohibition grazingproject have obvious effect on grassland restoration. |
| [2] | . ��������Ժ���̬ϵͳ������������̬ϵͳ����������ƶ�����Ҫ����,ָ����ϵ�ǿ�չ��������Ҫ����.�й����������������̬ϵͳ��������ָ����ϵ���跽��,����û���γ�ͳһ��ָ����ϵ�ͼ�������,���²�ͬ��������������ɱ��Բ�,������ҳ߶��ϵļ����о����Կ�չ.���,����һ���������й����ҳ߶ȵĿ�ѧ����ϵͳ�Ժ淶������������Ժ���̬ϵͳ��������ָ����ϵ,���Ϊ��ǰ������Ҫ�о����������.���IJο��������������������̬ϵͳ������������Ҫ�о��ɹ�,�ڳ�ֿ��ǡ���������ԡ���̬ϵͳ�ṹ�������빦�ܡ���������ϵ������,�������������������̬ϵͳ��������ָ����ϵ��������Ҫԭ��,�������й��������������̬ϵͳ��������ָ����ϵ. . ��������Ժ���̬ϵͳ������������̬ϵͳ����������ƶ�����Ҫ����,ָ����ϵ�ǿ�չ��������Ҫ����.�й����������������̬ϵͳ��������ָ����ϵ���跽��,����û���γ�ͳһ��ָ����ϵ�ͼ�������,���²�ͬ��������������ɱ��Բ�,������ҳ߶��ϵļ����о����Կ�չ.���,����һ���������й����ҳ߶ȵĿ�ѧ����ϵͳ�Ժ淶������������Ժ���̬ϵͳ��������ָ����ϵ,���Ϊ��ǰ������Ҫ�о����������.���IJο��������������������̬ϵͳ������������Ҫ�о��ɹ�,�ڳ�ֿ��ǡ���������ԡ���̬ϵͳ�ṹ�������빦�ܡ���������ϵ������,�������������������̬ϵͳ��������ָ����ϵ��������Ҫԭ��,�������й��������������̬ϵͳ��������ָ����ϵ. |
| [3] | . Climate change is a major driver of vegetation activity but its complex ecological relationships impede research efforts. In this study, the spatial distribution and dynamic characteristics of climate change effects on vegetation activity in China from the 1980s to the 2010s and from 2021 to 2050 were investigated using a geographically weighted regression (GWR) model. The GWR model was based on combined datasets of satellite vegetation index, climate observation and projection, and future vegetation productivity simulation. Our results revealed that the significantly positive precipitation-vegetation relationship was and will be mostly distributed in North China. However, the regions with temperature-dominated distribution of vegetation activity were and will be mainly located in South China. Due to the varying climate features and vegetation cover, the spatial correlation between vegetation activity and climate change may be altered. There will be different dominant climatic factors for vegetation activity distribution in some regions such as Northwest China, and even opposite correlations in Northeast China. Additionally, the response of vegetation activity to precipitation will move southward in the next three decades. In contrast, although the high warming rate will restrain the vegetation activity, precipitation variability could modify hydrothermal conditions for vegetation activity. This observation is exemplified in the projected future enhancement of vegetation activity in the Tibetan Plateau and weakened vegetation activity in East and Middle China. Furthermore, the vegetation in most parts of North China may adapt to an arid environment, whereas in many southern areas, vegetation will be repressed by water shortage in the future. |
| [4] | ��The global carbon cycle is one of the most important biogeochemical cycles. Through photosynthesis, green plants absorb CO2 from the atmosphere to produce organic matters, |
| [5] | . Variations in vegetation activity during the past 18 years in China were investigated using the normalized difference vegetation index (NDVI) derived from the 3rd generation time series dataset of NOAA-AVHRR from 1982 to 1999. In order to eliminate the effects of non-vegetation factors, we characterized areas with NDVI < 0.1 as ��sparsely vegetated areas�� and areas with NDVI ��0.1 as ��vegetated areas��. The results showed that increasing NDVI trends were evident, to varying extents, in almost all regions in China in the 18 years, indicating that vegetation activity has been rising in recent years in these regions. Compared to the early 1980s, the vegetated area increased by 3.5% by the late 1990s, while the sparsely vegetated area declined by 18.1% in the same period. The national total mean annual NDVI increased by 7.4% during the study period. Extended growing seasons and increased plant growth rates accounted for the bulk of these increases, while increases in temperature and summer rainfall, and strengthening agricultural activity were also likely important factors. NDVI changes in China exhibited relatively large spatial heterogeneity; the eastern coastal regions experienced declining or indiscernibly rising trends, while agricultural regions and western China experienced marked increases. Such a pattern was due primarily to urbanization, agricultural activity, regional climate characteristics, and different vegetation responses to regional climate changes. |
| [6] | . The normalised difference vegetation index (NDVI) is a useful tool for studying vegetation activity and ecosystem performance at a large spatial scale. In this study we use the Gravity Recovery and Climate Experiment (GRACE) total water storage (TWS) estimates to examine temporal variability of the NDVI across Australia. We aim to demonstrate a new method that reveals the moisture dependence of vegetation cover at different temporal resolutions. Time series of monthly GRACE TWS anomalies are decomposed into different temporal frequencies using a discrete wavelet transform and analysed against time series of the NDVI anomalies in a stepwise regression. The results show that combinations of different frequencies of decomposed GRACE TWS data explain NDVI temporal variations better than raw GRACE TWS alone. Generally, the NDVI appears to be more sensitive to interannual changes in water storage than shorter changes, though grassland-dominated areas are sensitive to higher-frequencies of water-storage changes. Different types of vegetation, defined by areas of land use type, show distinct differences in how they respond to the changes in water storage, which is generally consistent with our physical understanding. This unique method provides useful insight into how the NDVI is affected by changes in water storage at different temporal scales across land use types. |
| [7] | . Terrestrial net primary production (NPP) quantifies the amount of atmospheric carbon fixed by plants and accumulated as biomass. Previous studies have shown that climate constraints were relaxing with increasing temperature and solar radiation, allowing an upward trend in NPP from 1982 through 1999. The past decade (2000 to 2009) has been the warmest since instrumental measurements began, which could imply continued increases in NPP; however, our estimates suggest a reduction in the global NPP of 0.55 petagrams of carbon. Large-scale droughts have reduced regional NPP, and a drying trend in the Southern Hemisphere has decreased NPP in that area, counteracting the increased NPP over the Northern Hemisphere. A continued decline in NPP would not only weaken the terrestrial carbon sink, but it would also intensify future competition between food demand and proposed biofuel production. |
| [8] | . react-text: 350 i) to setup models framework to simulate 139 small rivers in Xinjiang Province; ii)to transform the hydrological parameters from existing calibrated watershed; to the ungauged watersheds; /react-text react-text: 351 /react-text |
| [9] | . <p>�ر����̸��Ӷ������漰�㷺����Ե�ǰ�ر������о���״���ӵ���ϵͳ��ѧ��ȫ��仯���ӽ���������ر�������ص�һЩ����о��ں����ڷ�����Ҫ�صر����̺Ͷ�Ҫ�صر����̵Ļ����ϣ����о����ݵ��ۺ��ԡ���������Ĺ����ԡ��������ͻ������������ԡ��Թ��̱仯Ϊ���ĵĶ�̬�Լ��о������Ķ����Եȷ��������˵ر������о����ص�,�ܽ��Եظ����˹������о����������ơ����������������ϣ���һ���ӹ��ʿ�ѧ��չ���ơ�������Ҫ����Ϣ�������ȷ���������й��ر������о������ٵĻ������Ӷ�ѧ�ƽ��桢��Ȼ�����Ĺ��̵Ķ������л���ϵȷ��������˵ر������о������ٵ���ս����</p> . <p>�ر����̸��Ӷ������漰�㷺����Ե�ǰ�ر������о���״���ӵ���ϵͳ��ѧ��ȫ��仯���ӽ���������ر�������ص�һЩ����о��ں����ڷ�����Ҫ�صر����̺Ͷ�Ҫ�صر����̵Ļ����ϣ����о����ݵ��ۺ��ԡ���������Ĺ����ԡ��������ͻ������������ԡ��Թ��̱仯Ϊ���ĵĶ�̬�Լ��о������Ķ����Եȷ��������˵ر������о����ص�,�ܽ��Եظ����˹������о����������ơ����������������ϣ���һ���ӹ��ʿ�ѧ��չ���ơ�������Ҫ����Ϣ�������ȷ���������й��ر������о������ٵĻ������Ӷ�ѧ�ƽ��桢��Ȼ�����Ĺ��̵Ķ������л���ϵȷ��������˵ر������о������ٵ���ս����</p> |
| [10] | . Global assessments of variation in plant functional traits and the way that these traits influence competitive interactions provide a launching pad for future ecological studies. See Article p.167 & Letter p.204 |
| [11] | . Global climate change has emerged as a major driver of ecosystem change. Here, we present evidence for globally consistent responses in vegetation dynamics to recent climate change in the world's mountain ecosystems located in the pan-tropical belt (30��N�C30��S). We analyzed decadal-scale trends and seasonal cycles of vegetation greenness using monthly time series of satellite greenness (Normalized Difference Vegetation Index) and climate data for the period 1982�C2006 for 47 mountain protected areas in five biodiversity hotspots. The time series of annual maximum NDVI for each of five continental regions shows mild greening trends followed by reversal to stronger browning trends around the mid-1990s. During the same period we found increasing trends in temperature but only marginal change in precipitation. The amplitude of the annual greenness cycle increased with time, and was strongly associated with the observed increase in temperature amplitude. We applied dynamic models with time-dependent regression parameters to study the time evolution of NDVI�Cclimate relationships. We found that the relationship between vegetation greenness and temperature weakened over time or was negative. Such loss of positive temperature sensitivity has been documented in other regions as a response to temperature-induced moisture stress. We also used dynamic models to extract the trends in vegetation greenness that remain after accounting for the effects of temperature and precipitation. We found residual browning and greening trends in all regions, which indicate that factors other than temperature and precipitation also influence vegetation dynamics. Browning rates became progressively weaker with increase in elevation as indicated by quantile regression models. Tropical mountain vegetation is considered sensitive to climatic changes, so these consistent vegetation responses across widespread regions indicate persistent global-scale effects of climate warming and associated moisture stresses. |
| [12] | |
| [13] | . Net primary production (NPP), the difference between CO fixed by photosynthesis and CO lost to autotrophic respiration, is one of the most important components of the carbon cycle. Our goal was to develop a simple regression model to estimate global NPP using climate and land cover data. Approximately 5600 global data points with observed mean annual NPP, land cover class, precipitation, and temperature were compiled. Precipitation was better correlated with NPP than temperature, and it explained much more of the variability in mean annual NPP for grass- or shrub-dominated systems (r2 = 0.68) than for tree-dominated systems (r2 = 0.39). For a given precipitation level, tree-dominated systems had significantly higher NPP (~ 100 150 g C.m-2.yr-1) than non-tree-dominated systems. Consequently, previous empirical models developed to predict NPP based on precipitation and temperature (e.g., the Miami model) tended to overestimate NPP for non-tree-dominated systems. Our new model developed at the National Center for Ecological Analysis and Synthesis (the NCEAS model) predicts NPP for tree-dominated systems based on precipitation and temperature; but for non-tree-dominated systems NPP is solely a function of precipitation because including a temperature function increased model error for these systems. Lower NPP in non-tree-dominated systems is likely related to decreased water and nutrient use efficiency and higher nutrient loss rates from more frequent fire disturbances. Late 20th century aboveground and total NPP for global potential native vegetation using the NCEAS model are estimated to be ~28 Pg and ~46 Pg C/yr, respectively. The NCEAS model estimated an ~13% increase in global total NPP for potential vegetation from 1901 to 2000 based on changing precipitation and temperature patterns. |
| [14] | . The global hydrological cycle is predicted to become more intense in future climates, with both larger precipitation events and longer times between events in some regions. Redistribution of precipitation may occur both within and across seasons, and the resulting wide fluctuations in soil water content (SWC) may dramatically affect plants. Though these responses remain poorly understood, recent research in this emerging field suggests the effects of redistributed precipitation may differ from predictions based on previous drought studies. We review available studies on both extreme precipitation (redistribution within seasons) and seasonal changes in precipitation (redistribution across seasons) on grasslands and forests. <br><br> Extreme precipitation differentially affected above-ground net primary productivity (ANPP), depending on whether extreme precipitation led to increased or decreased SWC, which differed based on the current precipitation and aridity index of the site. Specifically, studies to date reported that extreme precipitation decreased ANPP in mesic sites, but, conversely, increased ANPP in xeric sites, suggesting that plant-available water is a key factor driving responses to extreme precipitation. Similarly, the effects of seasonal changes in precipitation on ANPP, phenology, and leaf and fruit development varied with the effect on SWC. Reductions in spring or summer generally had negative effects on plants, associated with reduced SWC, while subsequent reductions in autumn or winter had little effect on SWC or plants. Similarly, increased summer precipitation had a more dramatic impact on plants than winter increases in precipitation. <br><br> The patterns of response suggest xeric biomes may respond positively to extreme precipitation, while comparatively mesic biomes may be more likely to be negatively affected. Moreover, seasonal changes in precipitation during warm or dry seasons may have larger effects than changes during cool or wet seasons. Accordingly, responses to redistributed precipitation will involve a complex interplay between plant-available water, plant functional type and resultant influences on plant phenology, growth and water relations. These results highlight the need for experiments across a range of soil types and plant functional types, critical for predicting future vegetation responses to future climates. |
| [15] | . The identification of properties that contribute to the persistence and resilience of ecosystems despite climate change constitutes a research priority of global relevance. Here we present a novel, empirical approach to assess the relative sensitivity of ecosystems to climate variability, one property of resilience that builds on theoretical modelling work recognizing that systems closer to critical thresholds respond more sensitively to external perturbations. We develop a new metric, the vegetation sensitivity index, that identifies areas sensitive to climate variability over the past 14 years. The metric uses time series data derived from the moderate-resolution imaging spectroradiometer (MODIS) enhanced vegetation index, and three climatic variables that drive vegetation productivity (air temperature, water availability and cloud cover). Underlying the analysis is an autoregressive modelling approach used to identify climate drivers of vegetation productivity on monthly timescales, in addition to regions with memory effects and reduced response rates to external forcing. We find ecologically sensitive regions with amplified responses to climate variability in the Arctic tundra, parts of the boreal forest belt, the tropical rainforest, alpine regions worldwide, steppe and prairie regions of central Asia and North and South America, the Caatinga deciduous forest in eastern South America, and eastern areas of Australia. Our study provides a quantitative methodology for assessing the relative response rate of ecosystems--be they natural or with a strong anthropogenic signature--to environmental variability, which is the first step towards addressing why some regions appear to be more sensitive than others, and what impact this has on the resilience of ecosystem service provision and human well-being. |
| [16] | . Aridland ecosystems are predicted to be responsive to both increases and decreases in precipitation. In addition, chronic droughts may contribute to encroachment of native C-3 shrubs into C-4-dominated grasslands. We conducted a long-term rainfall manipulation experiment in native grassland, shrubland and the grass-shrub ecotone in the northern Chihuahuan Desert, USA. We evaluated the effects of 5 years of experimental drought and 4 years of water addition on plant community structure and dynamics. We assessed the effects of altered rainfall regimes on the abundance of dominant species as well as on species richness and subdominant grasses, forbs and shrubs. Nonmetric multidimensional scaling and MANOVA were used to quantify changes in species composition in response to chronic addition or reduction of rainfall. We found that drought consistently and strongly decreased cover of Bouteloua eriopoda, the dominant C-4 grass in this system, whereas water addition slightly increased cover, with little variation between years. In contrast, neither chronic drought nor increased rainfall had consistent effects on the cover of Larrea tridentata, the dominant C-3 shrub. Species richness declined in shrub-dominated vegetation in response to drought whereas richness increased or was unaffected by water addition or drought in mixed- and grass-dominated vegetation. Cover of subdominant shrubs, grasses and forbs changed significantly over time, primarily in response to interannual rainfall variability more so than to our experimental rainfall treatments. Nevertheless, drought and water addition shifted the species composition of plant communities in all three vegetation types. Overall, we found that B. eriopoda responded strongly to drought and less so to irrigation, whereas L. tridentata showed limited response to either treatment. The strong decline in grass cover and the resistance of shrub cover to rainfall reduction suggest that chronic drought may be a key factor promoting shrub dominance during encroachment into desert grassland. |
| [17] | . <p>�о�����仯������ֲ���仯���Ƽ�����ˮ�����ӵĹ�ϵ, ���ڻƺ�Դ������̬�ָ�����̬���������Ҫ���塣���û���FAO Penman-Monteith�Ľ�ˮ��ɢ������������ĸ�ʪ״��, �����˻ƺ����ε����ĸ�ʪ���������ڴ˻�����, ����AVHRR��һ��ֲ��ָ��(<em>NDVI</em>)��GLOPEM������������(<em>NPP</em>)���ݼ���ͬ�ڵ���������, �����˻ƺ�����ֲ�����ǡ�ֲ��������������仯������, ̽���˲�ͬ��ʪ������Ӱ��ֲ���仯����Ҫ�������ӡ��������, �о������ϲ�Ϊ��ʪ��������, ����Ϊ��ɺ�������, ��ʪ����ֽ�����450 mm��ˮ��ֵ�߽Ͻӽ�; 1981–2006�������������ڸ�ů��, ���������µ�������������; ��ʪ�����<em>NDVI</em>��<em>NPP</em>��������, ��ɺ�������������; ��ʪ�������<em>NDVI</em>�����������������, �뽵ˮ��������Խ���, ������ֲ����������Ҫ������Լ����; ��ɺ�������<em>NDVI</em>���뽵ˮ����������Ը�ǿ, �Խ�ˮ���ı仯��Ϊ���С�<em>NPP</em>������仯����Ӧģʽ��<em>NDVI</em>���ơ�ֲ��������仯����Ӧ�����������о��������߱���ˮ������, ��ʪ���������ڸ��õؽ���ֲ��������仯��Ӧ�Ŀռ���졣</p> . <p>�о�����仯������ֲ���仯���Ƽ�����ˮ�����ӵĹ�ϵ, ���ڻƺ�Դ������̬�ָ�����̬���������Ҫ���塣���û���FAO Penman-Monteith�Ľ�ˮ��ɢ������������ĸ�ʪ״��, �����˻ƺ����ε����ĸ�ʪ���������ڴ˻�����, ����AVHRR��һ��ֲ��ָ��(<em>NDVI</em>)��GLOPEM������������(<em>NPP</em>)���ݼ���ͬ�ڵ���������, �����˻ƺ�����ֲ�����ǡ�ֲ��������������仯������, ̽���˲�ͬ��ʪ������Ӱ��ֲ���仯����Ҫ�������ӡ��������, �о������ϲ�Ϊ��ʪ��������, ����Ϊ��ɺ�������, ��ʪ����ֽ�����450 mm��ˮ��ֵ�߽Ͻӽ�; 1981–2006�������������ڸ�ů��, ���������µ�������������; ��ʪ�����<em>NDVI</em>��<em>NPP</em>��������, ��ɺ�������������; ��ʪ�������<em>NDVI</em>�����������������, �뽵ˮ��������Խ���, ������ֲ����������Ҫ������Լ����; ��ɺ�������<em>NDVI</em>���뽵ˮ����������Ը�ǿ, �Խ�ˮ���ı仯��Ϊ���С�<em>NPP</em>������仯����Ӧģʽ��<em>NDVI</em>���ơ�ֲ��������仯����Ӧ�����������о��������߱���ˮ������, ��ʪ���������ڸ��õؽ���ֲ��������仯��Ӧ�Ŀռ���졣</p> |
| [18] | . Abstract Climate change forecasts of more frequent climate extremes suggest that such events will become increasingly important drivers of future ecosystem dynamics and function. Because the rarity and unpredictability of naturally occurring climate extremes limits assessment of their ecological impacts, we experimentally imposed extreme drought and a mid-summer heat wave over two years in a central U.S. grassland. While the ecosystem was resistant to heat waves, it was not resistant to extreme drought, which reduced aboveground net primary productivity (ANPP) below the lowest level measured in this grassland in almost 30 years. This extreme reduction in ecosystem function was a consequence of reduced productivity of both C4 grasses and C3 forbs. However, the dominant forb was negatively impacted by the drought more than the dominant grass, and this led to a reordering of species abundances within the plant community. Although this change in community composition persisted post-drought, ANPP recovered completely the year after drought due to rapid demographic responses by the dominant grass, compensating for loss of the dominant forb. Overall, these results show that an extreme reduction in ecosystem function attributable to climate extremes (e.g., low resistance) does not preclude rapid ecosystem recovery. Given that dominance by a few species is characteristic of most ecosystems, knowledge of the traits of these species and their responses to climate extremes will be key for predicting future ecosystem dynamics and function. |
| [19] | . Temperature data over the past five decades show faster warming of the global land surface during the night than during the day(1). This asymmetric warming is expected to affect carbon assimilation and consumption in plants, because photosynthesis in most plants occurs during daytime and is more sensitive to the maximum daily temperature, T-max, whereas plant respiration occurs throughout the day(2) and is therefore influenced by both T-max and the minimum daily temperature, T-min. Most studies of the response of terrestrial ecosystems to climate warming, however, ignore this asymmetric forcing effect on vegetation growth and carbon dioxide (CO2) fluxes(3-6). Here we analyse the interannual covariations of the satellite-derived normalized difference vegetation index (NDVI, an indicator of vegetation greenness) with Tmax and Tmin over the Northern Hemisphere. After removing the correlation between Tmax and Tmin, we find that the partial correlation between Tmax and NDVI is positive in most wet and cool ecosystems over boreal regions, but negative in dry temperate regions. In contrast, the partial correlation between Tmin and NDVI is negative in boreal regions, and exhibits a more complex behaviour in dry temperate regions. We detect similar patterns in terrestrial net CO2 exchange maps obtained from a global atmospheric inversion model. Additional analysis of the long-term atmospheric CO2 concentration record of the station Point Barrow in Alaska suggests that the peak-to-peak amplitude of CO2 increased by 23 +/- 11% for a +1 degrees C anomaly in T-max from May to September over lands north of 51 degrees N, but decreased by 28 +/- 14% for a +1 degrees C anomaly in T-min. These lines of evidence suggest that asymmetric diurnal warming, a process that is currently not taken into account in many global carbon cycle models, leads to a divergent response of Northern Hemisphere vegetation growth and carbon sequestration to rising temperatures. |
| [20] | . Abstract Satellite-derived Normalized Difference Vegetation Index (NDVI), a proxy of vegetation productivity, is known to be correlated with temperature in northern ecosystems. This relationship, however, may change over time following alternations in other environmental factors. Here we show that above 30 N, the strength of the relationship between the interannual variability of growing season NDVI and temperature (partial correlation coefficient RNDVI-GT) declined substantially between 1982 and 2011. This decrease in RNDVI-GT is mainly observed in temperate and arctic ecosystems, and is also partly reproduced by process-based ecosystem model results. In the temperate ecosystem, the decrease in RNDVI-GT coincides with an increase in drought. In the arctic ecosystem, it may be related to a nonlinear response of photosynthesis to temperature, increase of hot extreme days and shrub expansion over grass-dominated tundra. Our results caution the use of results from interannual time scales to constrain the decadal response of plants to ongoing warming. |
| [21] | . We review observational, experimental, and model results on how plants respond to extreme climatic conditions induced by changing climatic variability. Distinguishing between impacts of changing mean climatic conditions and changing climatic variability on terrestrial ecosystems is generally underrated in current studies. The goals of our review are thus (1) to identify plant processes that are vulnerable to changes in the variability of climatic variables rather than to changes in their mean, and (2) to depict/evaluate available study designs to quantify responses of plants to changing climatic variability. We find that phenology is largely affected by changing mean climate but also that impacts of climatic variability are much less studied, although potentially damaging. We note that plant water relations seem to be very vulnerable to extremes driven by changes in temperature and precipitation and that heatwaves and flooding have stronger impacts on physiological processes than changing mean climate. Moreover, interacting phenological and physiological processes are likely to further complicate plant responses to changing climatic variability. Phenological and physiological processes and their interactions culminate in even more sophisticated responses to changing mean climate and climatic variability at the species and community level. Generally, observational studies are well suited to study plant responses to changing mean climate, but less suitable to gain a mechanistic understanding of plant responses to climatic variability. Experiments seem best suited to simulate extreme events. In models, temporal resolution and model structure are crucial to capture plant responses to changing climatic variability. We highlight that a combination of experimental, observational, and/or modeling studies have the potential to overcome important caveats of the respective individual approaches. |
| [22] | . δ������ƻ���Ŀǰ�����Ϲ���ȫ���仯ǰ���о����ۺϿ�ѧ�ƻ�,�����ʿ�ѧ���»�(ICSU)���쵼���Ĵ��ѧ�ƻ�Ϊһ��,ּ�ڽ���Ȼ��ѧ������ѧ�����һ��,����ǿ����֧�ֺ��о�����,Ѱ�����ϵͳ�ɳ���;��,ȫ���仯�о�������ѧ�����ѧ���������ۺϼ���ƽ̨,�ƽ���ѧ�о�Ϊ��ᾭ�ÿɳ�����չ����������½�ر������ص�,����½�ر����ֵĹ������ע���㼰���о������ת����Ӧ���������չ����������:½�ر�����δ������ƻ���ע���ص�֮һ,½�ر���Ҫ�����������ò��������������γɵĸ��,����Ϊδ������ƻ���һ���о������������ܡ�δ��,½�ر������о�Ӧ�����۵�ͻ��,Ϊ��Ȼ����ѧ�ۺ��о��ķ�չ�ṩ֧�š� . δ������ƻ���Ŀǰ�����Ϲ���ȫ���仯ǰ���о����ۺϿ�ѧ�ƻ�,�����ʿ�ѧ���»�(ICSU)���쵼���Ĵ��ѧ�ƻ�Ϊһ��,ּ�ڽ���Ȼ��ѧ������ѧ�����һ��,����ǿ����֧�ֺ��о�����,Ѱ�����ϵͳ�ɳ���;��,ȫ���仯�о�������ѧ�����ѧ���������ۺϼ���ƽ̨,�ƽ���ѧ�о�Ϊ��ᾭ�ÿɳ�����չ����������½�ر������ص�,����½�ر����ֵĹ������ע���㼰���о������ת����Ӧ���������չ����������:½�ر�����δ������ƻ���ע���ص�֮һ,½�ر���Ҫ�����������ò��������������γɵĸ��,����Ϊδ������ƻ���һ���о������������ܡ�δ��,½�ر������о�Ӧ�����۵�ͻ��,Ϊ��Ȼ����ѧ�ۺ��о��ķ�չ�ṩ֧�š� |
| [23] | . <p align="justify">��ArcGIS֧����, ����1982—2010��8 km�ֱ��ʵ�AVHRR NDVI�����ºͽ�ˮ����, Ӧ����С���˷��͵�����Ȩ�ع鷽��, �����й�NDVI���������ӵĵ�����Ȩ�ع�ģ��, ���������й�NDVI�����ºͽ�ˮ�����ϵ, ��ȡ�����ع�����Ŀռ���, ����ģ������ȫ���Իع������жԱȡ��������, �����Իع�ģ�����, ������Ȩ�ع�ģ�͵����Ч���������, ����Ŷȴ�0.3��ߵ�0.6���������Ӷ�NDVI��Ӱ����пռ�������: �ӱ�����, �������Ӷ�NDVI��Ӱ����С; ������½�ȸɺ���Į�ش�, �������Ӷ�NDVI��Ӱ��ϴ��й��ֵ�������, ���¶�NDVI��Ӱ�쳬����ˮ������NDVI�������������ӷ������õ������߶Ȳ�ͬ��</p> . <p align="justify">��ArcGIS֧����, ����1982—2010��8 km�ֱ��ʵ�AVHRR NDVI�����ºͽ�ˮ����, Ӧ����С���˷��͵�����Ȩ�ع鷽��, �����й�NDVI���������ӵĵ�����Ȩ�ع�ģ��, ���������й�NDVI�����ºͽ�ˮ�����ϵ, ��ȡ�����ع�����Ŀռ���, ����ģ������ȫ���Իع������жԱȡ��������, �����Իع�ģ�����, ������Ȩ�ع�ģ�͵����Ч���������, ����Ŷȴ�0.3��ߵ�0.6���������Ӷ�NDVI��Ӱ����пռ�������: �ӱ�����, �������Ӷ�NDVI��Ӱ����С; ������½�ȸɺ���Į�ش�, �������Ӷ�NDVI��Ӱ��ϴ��й��ֵ�������, ���¶�NDVI��Ӱ�쳬����ˮ������NDVI�������������ӷ������õ������߶Ȳ�ͬ��</p> |
| [24] | . ����2012��6�¸��µĸ�����2 400��̨վ��ˮ����,���ñ���������,�ƶ��˲���3���Ա���(���ȡ�γ�ȡ����θ߶�)����ˮ����ƽ��Ԥ������3�������IJ�ֵ����,���������ָ߳�����,�Լ����й����ص��������¸̶߳Խ�ˮ�ռ��ֵ���ȵ�Ӱ��,����1961��2010���й�������潵ˮվ�����Ͻ����˿ռ��ڲ�,�õ����й����潵ˮ0.5���0.5�������ݼ��������ݼ������������������:����ֵ��վ��۲�ֵ���������ƽ��Ϊ0.49 mm,���ϵ��ƽ����0.93(ͨ��0.01�������Լ���),�ļ���ֵ�����ڶ���,���ϵ�������ձ�����������������������ġ��^�������̨վ��������ڡ�10 mm/�����ڡ����������ġ��^�ֱ���60%��82%��54%��77%��̨վ�������ڡ�10%֮�䡣��ֵ��ĸ�㻯��ˮ�����ܹ��Ƚ�ϸ�¡�ȷ�������й���½��ƽ����ˮ���Ķ��϶ࡢ�����ٵ���Ҫ�ռ�����,��Ҳƽ�����˷�Χ��С�Ľ�ˮ��ֵ���ġ�̨վ�ֲ�Խ�ܼ��ĵط�,��ֵЧ��Խ��,�����������С��40 km��̨վ��ֵ���Ƚϸ�,����40 km��ֵ����˥���Ͽ졣 . ����2012��6�¸��µĸ�����2 400��̨վ��ˮ����,���ñ���������,�ƶ��˲���3���Ա���(���ȡ�γ�ȡ����θ߶�)����ˮ����ƽ��Ԥ������3�������IJ�ֵ����,���������ָ߳�����,�Լ����й����ص��������¸̶߳Խ�ˮ�ռ��ֵ���ȵ�Ӱ��,����1961��2010���й�������潵ˮվ�����Ͻ����˿ռ��ڲ�,�õ����й����潵ˮ0.5���0.5�������ݼ��������ݼ������������������:����ֵ��վ��۲�ֵ���������ƽ��Ϊ0.49 mm,���ϵ��ƽ����0.93(ͨ��0.01�������Լ���),�ļ���ֵ�����ڶ���,���ϵ�������ձ�����������������������ġ��^�������̨վ��������ڡ�10 mm/�����ڡ����������ġ��^�ֱ���60%��82%��54%��77%��̨վ�������ڡ�10%֮�䡣��ֵ��ĸ�㻯��ˮ�����ܹ��Ƚ�ϸ�¡�ȷ�������й���½��ƽ����ˮ���Ķ��϶ࡢ�����ٵ���Ҫ�ռ�����,��Ҳƽ�����˷�Χ��С�Ľ�ˮ��ֵ���ġ�̨վ�ֲ�Խ�ܼ��ĵط�,��ֵЧ��Խ��,�����������С��40 km��̨վ��ֵ���Ƚϸ�,����40 km��ֵ����˥���Ͽ졣 |
| [25] | . We present an approach to regional environmental monitoring in the Northern Eurasian grain belt combining time series analysis of MODIS normalized difference vegetation index (NDVI) data over the period 2001-2008 and land cover change (LCC) analysis of the 2001and 2008 MODIS Global Land Cover product (MCD12Q1).NDVI trends were overwhelmingly negative across the grain belt with statistically significant (p �� 0.05)positive trends covering only 1�� of the land surface.LCC was dominated by transitions between three classes;cropland,grassland,and a mixed cropland/natural vegetation mosaic.Combining our analyses of NDVI trends and LCC,we found a pattern of agricultural abandonment (cropland to grassland) in the southern range of the grain belt coinciding with statistically significant (p��0.05)negative NDVI trends and likely driven by regional drought.In the northern range of the grain belt we found an opposite tendency toward agricultural intensification; in this case,represented by LCC from cropland mosaic to pure cropland,and also associated with statistically significant (p��0.05) negative NDVI trends.Relatively small clusters of statistically significant (p �� 0.05) positive NDVI trends corresponding with both localized land abandonment and localized agricultural intensification show that land use decision making is not uniform across the region.Land surface change in the Northern Eurasian grain belt is part of a larger pattern of land cover land use change (LCLUC) in Eastern Europe,Russia,and former territories of the Soviet Union following realignment of socialist land tenure and agricultural markets.Here,we show that a combined analysis of LCC and NDVI trends provides a more complete picture of the complexities of LCLUC in the Northern Eurasian grain belt,involving both broader climatic forcing,and narrower anthropogenic impacts,than might be obtained from either analysis alone. |
| [26] | . On the basis of AVHRR GIMMS NDVI and MODIS NDVI, we constructed monthly NDVI sequences covering Northeast China from 1982 to 2009 using a per-pixel unary linear regression model. The expanded NDVI passed the consistency check and were well used for analysis. The monthly NDVI trends were highly correlated with climatic changes. Spatially averaged NDVI in summer exhibited a downward trend with increased temperature and significantly decreased precipitation in the 28 years. NDVI trends were spatially heterogeneous, corresponding with the regional climatic features of different seasons. NDVI for the 95 meteorological stations exhibited significant correlations with monthly mean temperature and monthly precipitation during the study period. The NDVI�Ctemperature correlation was stronger than NDVI�Cprecipitation correlation in most stations and for all vegetation types. Different vegetation types showed various spatial responses to climatic changes. |
| [27] | . ����NDVI3g����,���Ķ�����18��ֲ�����ָ���о�ֲ�����仯���������1��100��ֲ������,����ظ�ԭ����Ϊ8��ֲ�����֡������仯�Ƚ�����������,��������¶ȡ�����¶ȡ�ƽ���¶ȡ���ˮ��̫����������,����ƫ��С���˷��ع飨PLS���о����仯����������������1��ظ�ԭ�������������ָ��,ת�۷�����1997-2000��,ת��ǰ�������ָ��ƽ����ǰ2~3 d/10a;��ظ�ԭĩ�����ָ��ת�۷�����2004-2007������,�������������ָ��ͻ�䷢����2005������,ת��ǰĩ�����ָ��ƽ���ӳ�1~2 d/10a������������ƽ���ӳ�1~2 d/10a;ת��֮���������������ָ���Ƴ����Ƶ�������ˮƽ��Ϊ0.1,������ĩ�����ָ�ꡢ����������ָ�����Ʋ�������2�ߺ��ݵ���ߺ���ľ�ݵ�����ظ�ԭ���仯����ҵ�ֲ���������ߺ��ݵ������������ȵ��ӳ���Ҫ�����������������ָ����ǰ���µġ��ߺ���ľ�ݵ������������ȵ��ӳ���Ҫ�����ڳ������ָ�����ǰ,�Լ�ĩ�����ָ����Ƴٹ�ͬ���õ��µġ�3����PLS��һ�������������ضԸߺ��ݵ���ߺ���ľ�ݵ������ұ仯��Ӱ�졣����,�¶ȶ�����Ӱ��ռ������λ,��ֲ����������ʾ�����^�������¶ȶ���������������������Ӱ��,��ʱ���¶�һ����ᵼ������ĩ�����ָ���Ƴ�,����Ƴ���������ʼʱ��;��һ������²����ö������ߡ����ļ���,�����·���С�¶ȶ�ֲ������Ӱ����ƽ���¶ȡ�����¶ȵ�Ӱ�����ơ���ˮ��ֲ������Ӱ�첻ͬ�·ݲ����ϴ�,�����ﶬ���ڽ�ˮ�Գ������ָ����и���Ӱ��,������ˮ�Գ������ָ���������Ӱ�졣8�·�����ֲ������������Ҫ�����ǽ�ˮ,��ʱ��ˮ��ĩ�����ָ��ģ��ϵ��Ϊ����̫�������ֲ������Ӱ����Ҫ���ļ��������PLS���������仯�о��о���17 . ����NDVI3g����,���Ķ�����18��ֲ�����ָ���о�ֲ�����仯���������1��100��ֲ������,����ظ�ԭ����Ϊ8��ֲ�����֡������仯�Ƚ�����������,��������¶ȡ�����¶ȡ�ƽ���¶ȡ���ˮ��̫����������,����ƫ��С���˷��ع飨PLS���о����仯����������������1��ظ�ԭ�������������ָ��,ת�۷�����1997-2000��,ת��ǰ�������ָ��ƽ����ǰ2~3 d/10a;��ظ�ԭĩ�����ָ��ת�۷�����2004-2007������,�������������ָ��ͻ�䷢����2005������,ת��ǰĩ�����ָ��ƽ���ӳ�1~2 d/10a������������ƽ���ӳ�1~2 d/10a;ת��֮���������������ָ���Ƴ����Ƶ�������ˮƽ��Ϊ0.1,������ĩ�����ָ�ꡢ����������ָ�����Ʋ�������2�ߺ��ݵ���ߺ���ľ�ݵ�����ظ�ԭ���仯����ҵ�ֲ���������ߺ��ݵ������������ȵ��ӳ���Ҫ�����������������ָ����ǰ���µġ��ߺ���ľ�ݵ������������ȵ��ӳ���Ҫ�����ڳ������ָ�����ǰ,�Լ�ĩ�����ָ����Ƴٹ�ͬ���õ��µġ�3����PLS��һ�������������ضԸߺ��ݵ���ߺ���ľ�ݵ������ұ仯��Ӱ�졣����,�¶ȶ�����Ӱ��ռ������λ,��ֲ����������ʾ�����^�������¶ȶ���������������������Ӱ��,��ʱ���¶�һ����ᵼ������ĩ�����ָ���Ƴ�,����Ƴ���������ʼʱ��;��һ������²����ö������ߡ����ļ���,�����·���С�¶ȶ�ֲ������Ӱ����ƽ���¶ȡ�����¶ȵ�Ӱ�����ơ���ˮ��ֲ������Ӱ�첻ͬ�·ݲ����ϴ�,�����ﶬ���ڽ�ˮ�Գ������ָ����и���Ӱ��,������ˮ�Գ������ָ���������Ӱ�졣8�·�����ֲ������������Ҫ�����ǽ�ˮ,��ʱ��ˮ��ĩ�����ָ��ģ��ϵ��Ϊ����̫�������ֲ������Ӱ����Ҫ���ļ��������PLS���������仯�о��о���17 |
| [28] | . Global climate change has led to significant vegetation changes in the past half century. North China Plain, the most important grain production base of china, is undergoing a process of prominent warming and drying. The vegetation coverage, which is used to monitor vegetation change, can respond to climate change (temperature and precipitation). In this study, GIMMS (Global Inventory Modelling and Mapping Studies)-NDVI (Normalized Difference Vegetation Index) data, MODIS (Moderate-resolution Imaging Spectroradiometer) �C NDVI data and climate data, during 1981�C2013, were used to investigate the spatial distribution and changes of vegetation. The relationship between climate and vegetation on different spatial (agriculture, forest and grassland) and temporal (yearly, decadal and monthly) scales were also analyzed in North China Plain. (1) It was found that temperature exhibiting a slight increase trend (0.20��C/10a, P<0.01). This may be due to the disappearance of 0��C isotherm, the rise of spring temperature. At the same time, precipitation showed a significant reduction trend (611.75mm/10a, P>0.05). The climate mutation period was during 1991�C1994. (2) Vegetation coverage slight increase was observed in the 55% of total study area, with a change rate of 0.00039/10a. Human activities may not only accelerate the changes of the vegetation coverage, but also c effect to the rate of these changes. (3) Overall, the correlation between the vegetation coverage and climatic factor is higher in monthly scale than yearly scale. The correlation analysis between vegetation coverage and climate changes showed that annual vegetation coverage was better correlatend with precipitation in grassland biome; but it showed a better correlated with temperature i the agriculture biome and forest biome. In addition, the vegetation coverage had sensitive time-effect respond to precipitation. (4) The vegetation coverage showed the same increasing trend before and after the climatic variations, but the rate of increase slowed down. From the vegetation coverage point of view, the grassland ecological zone had an obvious response to the climatic variations, but the agricultural ecological zones showed a significant response from the vegetation coverage change rate point of view. The effect of human activity in degradation region was higher than that in improvement area. But after the climate abruptly changing, the effect of human activity in improvement area was higher than that in degradation region, and the influence of human activity will continue in the future. |
| [29] | . Spatial nonstationarity is a condition in which a simple 090008global090009 model cannot explain the relationships between some sets of variables. The nature of the model must alter over space to reflect the structure within the data. In this paper, a technique is developed, termed geographically weighted regression, which attempts to capture this variation by calibrating a multiple regression model which allows different relationships to exist at different points in space. This technique is loosely based on kernel regression. The method itself is introduced and related issues such as the choice of a spatial weighting function are discussed. Following this, a series of related statistical tests are considered which can be described generally as tests for spatial nonstationarity. Using Monte Carlo methods, techniques are proposed for investigating the null hypothesis that the data may be described by a global model rather than a non-stationary one and also for testing whether individual regression coefficients are stable over geographic space. These techniques are demonstrated on a data set from the 1991 U.K. census relating car ownership rates to social class and male unemployment. The paper concludes by discussing ways in which the technique can be extended. |
| [30] | . Traditional regression techniques such as ordinary least squares (OLS) are often unable to accurately model spatially varying data and may ignore or hide local variations in model coefficients. A relatively new technique, geographically weighted regression (GWR) has been shown to greatly improve model performance compared to OLS in terms of higher R (2) and lower corrected Akaike information criterion (AIC(C)). GWR models have the potential to improve reliabilities of the identified relationships by reducing spatial autocorrelations and by accounting for local variations and spatial non-stationarity between dependent and independent variables. In this study, GWR was used to examine the relationship between land cover, rainfall and surface water habitat in 149 sub-catchments in a predominately agricultural region covering 2.6 million ha in southeast Australia. The application of the GWR models revealed that the relationships between land cover, rainfall and surface water habitat display significant spatial non-stationarity. GWR showed improvements over analogous OLS models in terms of higher R (2) and lower AIC(C). The increased explanatory power of GWR was confirmed by the results of an approximate likelihood ratio test, which showed statistically significant improvements over analogous OLS models. The models suggest that the amount of surface water area in the landscape is related to anthropogenic drainage practices enhancing runoff to facilitate intensive agriculture and increased plantation forestry. However, with some key variables not present in our analysis, the strength of this relationship could not be qualified. GWR techniques have the potential to serve as a useful tool for environmental research and management across a broad range of scales for the investigation of spatially varying relationships. |
| [31] | . �ҹ����Ͽ�˹�ص���ʯĮ�������ʵ�־�����,ֲ��״���������Ը���.Ϊ�˸��������˽����ֲ���仯�������Ӱ�����ص��������,���ó�ʱ������ң������,�ۺ����ÿռ�����ط��������ɷַ���(PCA)�͵�����Ȩ�ع�(GWR)���о�����,������̬����ʵʩ�������ǭ��˹��ֲ���仯������ҪӰ�����صĿռ��ƽ����.�������:��1982-2000�����,2001-2011����������һ��ֲ��ָ��(GSN)�������о������������Ҿ��������Ŀռ伯����(IgΪ0.90),�����ӳ̶��ڿռ��Ͼ��в�����(����ϵ��Ϊ43��);Ӱ����ǭֲ���仯����Ҫ���ذ����������ӡ������ʵء�������ˮ����Ч�ԡ��������ֺ���ᾭ������,�Ҷ�ֲ���仯��Ӱ��̶������λ�õı仯���仯.��ͬ���̵�ò��������,Ӱ��ֲ���仯���������ز�ͬ,�Ҵ��������Ŀռ������,���ۺϿ���ֲ���仯�������ص����������������Ľ�������̬���̴�ʩ. . �ҹ����Ͽ�˹�ص���ʯĮ�������ʵ�־�����,ֲ��״���������Ը���.Ϊ�˸��������˽����ֲ���仯�������Ӱ�����ص��������,���ó�ʱ������ң������,�ۺ����ÿռ�����ط��������ɷַ���(PCA)�͵�����Ȩ�ع�(GWR)���о�����,������̬����ʵʩ�������ǭ��˹��ֲ���仯������ҪӰ�����صĿռ��ƽ����.�������:��1982-2000�����,2001-2011����������һ��ֲ��ָ��(GSN)�������о������������Ҿ��������Ŀռ伯����(IgΪ0.90),�����ӳ̶��ڿռ��Ͼ��в�����(����ϵ��Ϊ43��);Ӱ����ǭֲ���仯����Ҫ���ذ����������ӡ������ʵء�������ˮ����Ч�ԡ��������ֺ���ᾭ������,�Ҷ�ֲ���仯��Ӱ��̶������λ�õı仯���仯.��ͬ���̵�ò��������,Ӱ��ֲ���仯���������ز�ͬ,�Ҵ��������Ŀռ������,���ۺϿ���ֲ���仯�������ص����������������Ľ�������̬���̴�ʩ. |
| [32] | . Monitoring changes in vegetation growth has been the subject of considerable research during the past several decades, because of the important role of vegetation in regulating the terrestrial carbon cycle and the climate system. In this study, we combined datasets of satellite-derived Normalized Difference Vegetation Index (NDVI) and climatic factors to analyze spatio-temporal patterns of changes in vegetation growth and their linkage with changes in temperature and precipitation in temperate and boreal regions of Eurasia (> 23.5��N) from 1982 to 2006. At the continental scale, although a statistically significant positive trend of average growing season NDVI is observed (0.5 �� 10613 year611, P = 0.03) during the entire study period, there are two distinct periods with opposite trends in growing season NDVI. Growing season NDVI has first significantly increased from 1982 to 1997 (1.8 �� 10613 year611, P < 0.001), and then decreased from 1997 to 2006 (611.3 �� 10613 year611, P = 0.055). This reversal in the growing season NDVI trends over Eurasia are largely contributed by spring and summer NDVI changes. Both spring and summer NDVI significantly increased from 1982 to 1997 (2.1 �� 10613 year611, P = 0.01; 1.6 �� 10613 year611P < 0.001, respectively), but then decreased from 1997 to 2006, particularly summer NDVI which may be related to the remarkable decrease in summer precipitation (612.7 mm yr611, P = 0.009). Further spatial analyses supports the idea that the vegetation greening trend in spring and summer that occurred during the earlier study period 1982�C1997 was either stalled or reversed during the following study period 1997�C2006. But the turning point of vegetation NDVI is found to vary across different regions. |
| [33] | . Current predictions of extinction risks from climate change vary widely depending on the specific assumptions and geographic and taxonomic focus of each study. I synthesized published studies in order to estimate a global mean extinction rate and determine which factors contribute the greatest uncertainty to climate change nduced extinction risks. Results suggest that extinction risks will accelerate with future global temperatures, threatening up to one in six species under current policies. Extinction risks were highest in South America, Australia, and New Zealand, and risks did not vary by taxonomic group. Realistic assumptions about extinction debt and dispersal capacity substantially increased extinction risks. We urgently need to adopt strategies that limit further climate change if we are to avoid an acceleration of global extinctions. Author: Mark C. Urban |
| [34] | . Abstract Variation in terrestrial net primary production (NPP) with climate is thought to originate from a direct influence of temperature and precipitation on plant metabolism. However, variation in NPP may also result from an indirect influence of climate by means of plant age, stand biomass, growing season length and local adaptation. To identify the relative importance of direct and indirect climate effects, we extend metabolic scaling theory to link hypothesized climate influences with NPP, and assess hypothesized relationships using a global compilation of ecosystem woody plant biomass and production data. Notably, age and biomass explained most of the variation in production whereas temperature and precipitation explained almost none, suggesting that climate indirectly (not directly) influences production. Furthermore, our theory shows that variation in NPP is characterized by a common scaling relationship, suggesting that global change models can incorporate the mechanisms governing this relationship to improve predictions of future ecosystem function. |
| [35] | . [1] The historical surface temperature data set HadCRUT provides a record of surface temperature trends and variability since 1850. A new version of this data set, HadCRUT3, has been produced, benefiting from recent improvements to the sea surface temperature data set which forms its marine component, and from improvements to the station records which provide the land data. A comprehensive set of uncertainty estimates has been derived to accompany the data: Estimates of measurement and sampling error, temperature bias effects, and the effect of limited observational coverage on large-scale averages have all been made. Since the mid twentieth century the uncertainties in global and hemispheric mean temperatures are small, and the temperature increase greatly exceeds its uncertainty. In earlier periods the uncertainties are larger, but the temperature increase over the twentieth century is still significantly larger than its uncertainty. |
| [36] | . Revegetation of degraded ecosystems provides opportunities for carbon sequestration and bioenergy production. However, vegetation expansion in water-limited areas creates potentially conflicting demands for water between the ecosystem and humans. Current understanding of these competing demands is still limited. Here, we study the semi-arid Loess Plateau in China, where the `Grain to Green large-scale revegetation programme has been in operation since 1999. As expected, we found that the new planting has caused both net primary productivity (NPP) and evapotranspiration (ET) to increase. Also the increase of ET has induced a significant (p < 0.001) decrease in the ratio of river runoff to annual precipitation across hydrological catchments. From currently revegetated areas and human water demand, we estimate a threshold of NPP of 400 +/- 5 g C myrabove which the population will suffer water shortages. NPP in this region is found to be already close to this limit. The threshold of NPP could change by -36% in the worst case of climate drying and high human withdrawals, to +43% in the best case. Our results develop a new conceptual framework to determine the critical carbon sequestration that is sustainable in terms of both ecological and socio-economic resource demands in a coupled anthropogenic-biological system. |
| [37] | . |
| [38] | . <p>��HJ����CCDӰ��Ϊ����Դ������ͷ�������2008 ��2011 ��ֲ�������ݱ�Ϳռ�ֲ����������ò���ӹ�ϵ�������������������ֲ�����Ƕ���߳���2008��2011 �����ϵ���ֱ�Ϊ0.946 1��0.954 5������ǿ������ԣ�ֲ���˻���Ҫ�����ڸ�ֲ����������100~300 m�̡߳�1~5°�¶ȡ�306~360°����Χ�ֱ�ռ���˻������88.84%��88.41%��30.73%��50~150 m�̡߳�13°�����¶Ⱥ�27°�¶���������Ϊ�˻����������������ֲ���������ò���ӵĹ�ϵ��Ϊ�������������ͼ���ṩ��ѧ���ݣ�����һ����ʵ�ü�ֵ��</p> . <p>��HJ����CCDӰ��Ϊ����Դ������ͷ�������2008 ��2011 ��ֲ�������ݱ�Ϳռ�ֲ����������ò���ӹ�ϵ�������������������ֲ�����Ƕ���߳���2008��2011 �����ϵ���ֱ�Ϊ0.946 1��0.954 5������ǿ������ԣ�ֲ���˻���Ҫ�����ڸ�ֲ����������100~300 m�̡߳�1~5°�¶ȡ�306~360°����Χ�ֱ�ռ���˻������88.84%��88.41%��30.73%��50~150 m�̡߳�13°�����¶Ⱥ�27°�¶���������Ϊ�˻����������������ֲ���������ò���ӵĹ�ϵ��Ϊ�������������ͼ���ṩ��ѧ���ݣ�����һ����ʵ�ü�ֵ��</p> |
| [39] | . Vegetation plays an important role in improving and restoring fragile ecological environments. In the Antaibao opencast coal mine, located in a loess area, the eco-environment has been substantially disturbed by mining activities, and the relationship between the vegetation and environmental factors is not very clear. Therefore, it is crucial to understand the effects of soil and topographic factors on vegetation restoration to improve the fragile ecosystems of damaged land. An investigation of the soil, topography and vegetation in 50 reclamation sample plots in Shanxi Pingshuo Antaibao opencast coal mine dumps was performed. Statistical analyses in this study included one-way ANOVA and significance testing using SPSS 20.0, and multivariate techniques of detrended correspondence analysis (DCA) and redundancy analysis (RDA) using CANOCO 4.5. The RDA revealed the environmental factors that affected vegetation restoration. Various vegetation and soil variables were significantly correlated. The available K and rock content were good explanatory variables, and they were positively correlated with tree volume. The effects of the soil factors on vegetation restoration were higher than those of the topographic factors. |
| [40] | . Ecological conservation and restoration are necessary to mitigate environmental degradation problems. China has taken great efforts in such actions. To understand the ecological transition during 2000-2010 in China, this study analysed trends in vegetation change using remote sensing and linear regression. Climate and socioeconomic factors were included to screen the driving forces for vegetation change using correlation or comparative analyses. Our results indicated that China experienced both vegetation greening (restoration) and browning (degradation) with great spatial heterogeneity. Socioeconomic factors, such as human populations and economic production, were the most significant factors for vegetation change. Nature reserves have contributed slightly to the deceleration of vegetation browning and the promotion of greening; however, a large-scale conservation approach beyond nature reserves was more effective. The effectiveness of the Three-North Shelter Forest Program lay between the two above approaches. The findings of this study highlighted that vegetation trend detection is a practical approach for large-scale ecological transition assessments, which can inform decision-making that promotes vegetation greening via proper socioeconomic development and ecosystem management. |
