 , 刘亚溪
, 刘亚溪Principle of big geodata mining
PEITao, LIUYaxi收稿日期:2018-10-8
修回日期:2019-02-15
网络出版日期:2019-03-25
版权声明:2019《地理学报》编辑部本文是开放获取期刊文献,在以下情况下可以自由使用:学术研究、学术交流、科研教学等,但不允许用于商业目的.
基金资助:
作者简介:
-->
展开
摘要
关键词:
Abstract
Keywords:
-->0
PDF (1932KB)元数据多维度评价相关文章收藏文章
本文引用格式导出EndNoteRisBibtex收藏本文-->
1 引言
早在30年前,计算机领域的研究者就已经预见到海量数据将会给计算机科学及其他学科的发展带来的挑战与机遇,提出了“数据挖掘”一词。1995年,李德仁院士率先倡导从GIS数据库中发现知识[1]。之后,Harvey等提出“地理数据挖掘与知识发现”(Geographic Data Mining and Knowledge Discovery)[2],标志着地理学与数据挖掘技术的实质性交叉,地理数据挖掘作为发现地理学规律的重要手段,已被地理****所承认。然而,之后的10多年里,地理数据挖掘虽在方法研究中取得了显著的进展,但对地理学领域新知识的揭示仍未取得令人信服的成就。随着大数据时代到来,一系列重量级的研究相继涌现:基于手机数据的人类行为预测[3]、利用搜索引擎对流感的预测[4]以及深度学习算法对于人类思维能力的挑战[5,6]等。这些发现不仅颠覆了传统的认识,更为重要的是,它们证明了大数据对于科学发现的潜在推动力。毫无例外,大数据对于地理学也形成了巨大的冲击,迫使地理****思考一系列问题:地理大数据挖掘的本质是什么?其与地理学之间的关系如何?在地理学发展中究竟能够起到何种作用?为了回答以上问题,本文拟从以下几个方面进行论述:首先,将阐述地理大数据的内涵与外延是什么;其次,系统分析地理大数据的特点;第三,从地理大数据挖掘的核心问题入手揭示其本质;第四,根据挖掘目标对地理大数据挖掘方法进行分类;最后,对地理大数据挖掘的发展和面临的挑战进行展望。
2 地理大数据的内涵及外延
大数据虽已成为当前学界的热词,但关于大数据内涵以及外延的界定一直未有定论。实际上,给大数据以确切定义其意义并非在于明确地圈定哪些数据属于大数据,而是在于指导如何进行大数据分析以及如何在应用中避免大数据的局限性。Mayer-Schonberger等曾经在《Big Data: A Revolution That Will Transform How We Live, Work, and Think》中给出了大数据的价值(Value)定义[7],Marr总结出大数据的“5V”特征[8],即:Volume(大量)、Velocity(更新快)、Variety(多样)、Value(价值)、Veracity(真实性)。大数据的产生主要源于传感器、网络和计算技术的突破,因而体现出数据量大、更新快以及种类多(前3个“V”)的特征;而另一方面,大数据的获取多为传感器用户的自发性上传(如微博和微信数据的获取)或非目的性记录(如手机信令、公交刷卡记录等),如以数据产生的主体为研究对象,则此大数据当属非目的性的观测数据,故通常含有大量噪声,最终导致价值密度低、真实性差(后2个“V”)的特征。其实,“5V”的刻画也仅仅是大数据的表象,并非大数据真正的定义。本文中,大数据的本质被认为是针对研究对象的样本“超”覆盖,当然,此处并非指完全没有遗漏的样本覆盖,而是指超出目的性采样(也可称为“小数据”)范畴的、趋向于全集的信息获取(只有在极端情况下,“超“覆盖才可能是全集样本)。大数据的本质所导致的这种信息覆盖,突破了目的性和局部性的传统采样的局限,必然带来思维方式和认识上的变革。由此可以推论,地理大数据就是针对地理对象的“超”覆盖样本集,此处的“超”覆盖涉及时间、空间与属性维度。同样地,地理大数据也具备“5V”特征,但地理大数据同时还具有自己独特的性质,这将在后面的章节进一步论述。地理大数据的内涵至少表明,其辨识度集中体现在以下两点:① 地理大数据与其他大数据之间的差别在于是否具有时空属性;② 地理大数据与小数据的区别在于样本的覆盖度。
地理大数据内涵的确定是基于获取信息的模式,而其外延的划分则依赖于信息采集的手段。根据所使用的传感器类型以及数据所记录对象的不同,可将地理大数据分为对地观测大数据和人类行为大数据两类。其中,对地观测大数据记录地表要素的特征,获取信息的传感器类型主要包括航天、航空以及地表监测传感器等,以主动的获取方式为主,对应的数据包括:卫星遥感、无人机影像以及各类监测台站(网)的数据等。人类行为大数据记录人类移动、社交、消费等各种行为的信息,信息获取的传感器种类繁多,包括:手机终端、智能卡、社交媒体应用、导航系统等,以被动的获取方式居多,可视为人类活动的足迹(footprint),产生的数据包括:手机信令数据、出租车轨迹数据、物联网数据以及社交媒体数据等。两类大数据直接关注的主要对象分别为“地”和“人”。人类发展与地理环境之间的关系一直是地理学的核心论题,而地理大数据的爆发,使得对地观测与人类行为大数据的全面结合成为可能,从而为地理学中人地关系的研究提供了新资源、新动力和新视角。两类数据关注的角度各异,数据结构、粒度和表达方式又不尽相同,继而为地理大数据的分析与处理提出了新命题。
3 地理大数据的特征
前已述及大数据区别于小数据的主要特征,但作为具有特定内涵与外延的地理大数据,是否包含一般大数据共性之外的特征对于地理大数据的分析处理至关重要。为此,本文将从地理大数据产生机理的角度着重讨论其内在的特征。一方面,相对于小数据,地理大数据样本的“超”覆盖主要体现在3个方面:粒度更细、密度更高、范围更大;另一方面,地理大数据,尤其是人类行为大数据的获取大多属于非目的性,从而导致有偏性和不确定性。因此,地理大数据可以总结为时空粒度、时空广度、时空密度、时空偏度和时空精度等“5度”的特征。3.1 时空粒度
如果将地理信息承载单元的大小称为粒度,那么地理大数据的出现,则让地理信息的承载粒度由大变小。由于不同类型大数据的获取方式不同,因此粒度对于不同数据的含义也不一样。在对地观测大数据中,粒度是指数据所代表的(地表)范围大小,粒度的变化体现在由对地观测大数据反演得到的地物单元不断地细化。例如,城市影像分辨率的提升使得由其反演得到的地物单元从粗粒度的地块细化到具体的建筑。而在人类行为大数据中,粒度是指记录和统计单元的大小[9],粒度的变细表现为用以记录和统计的单元的缩小。以人口统计为例,中国实施的人口普查方案中,普查小区为人口统计的最小粒度。普查小区在城市中多为街道的尺度,而在农村中则为乡镇的级别。普查小区的大小范围从几平方千米到几十平方千米,某些区域甚至更大。而手机数据的应用,为人口的精细化估计提供了可能。图1即为利用北京市手机用户数据进行精细人口估计的结果[10]。图1中人口信息的基本单元为基站小区(可近似为以手机基站位置划分的泰森多边形)。在城市人口的密集区,基站小区的尺度约为200 m左右。同样,利用浮动车轨迹数据针对城市道路拥堵状况的评估可以精细到任意时刻和任意路 段[11,12,13];融合微信请求数据、出租车定位数据、兴趣点(Point of Interest, POI)数据以及Quickbird高分影像可以将城市功能区的识别粒度细化至建筑物[14];利用住户智能水电表信息可以对年龄、工作状态和收入的估计细化到家庭[15]。地理大数据粒度的精细化可以使我们从微观的角度观察地理现象,为研究其细部特征和机理提供了新的可能性。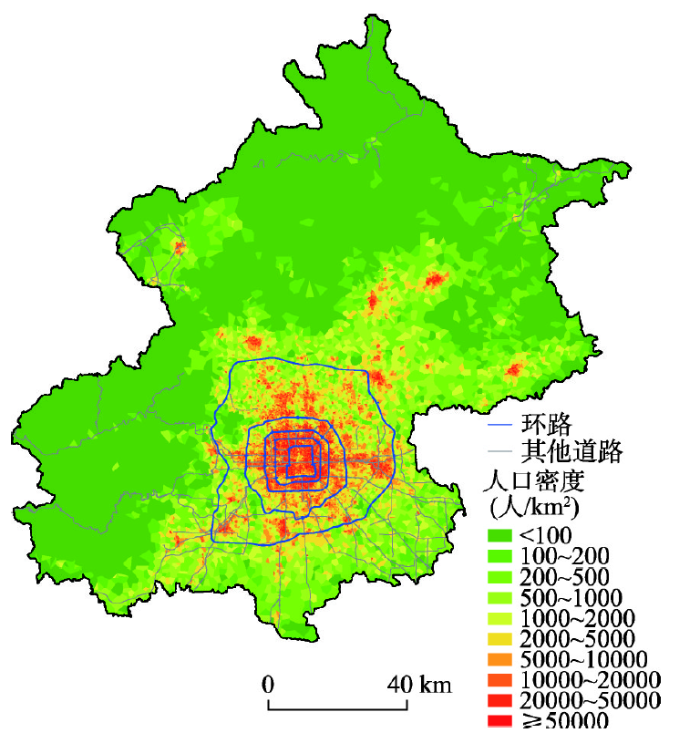 显示原图|下载原图ZIP|生成PPT
图1基于手机数据的城市精细人口估计[
-->Fig. 1Fine-grained population estimation using mobile phone data
-->
3.2 时空广度
传统的地理小数据因受到信息获取手段和成本的限制,往往只能集中于局部的区域,或者需要在研究粒度与范围之间进行权衡,即在选择较大范围的同时不得不采用较粗的粒度。而在大数据时代,部分IT公司借助互联网的优势,可获取较大范围,甚至全国直至全球范围内的数据及其衍生的产品,同时又保持较小的时空粒度,从而使其研究范围在“豁然开朗”的同时又保持着“高清晰度”。对地观测大数据中全球性的数据产品已涉及多个研究领域,如全球夜光遥感数据产品[16],国产30 m分辨率的全球土地利用数据[17],全球长时间序列叶面积指数产品[18]等。而在人类行为大数据中,数据覆盖范围之广也是前所未有:百度发布的全国(不含港澳台地区)春运人口迁徙图(http://qianxi.baidu.com),滴滴发布的全国出租车(不含港澳台地区)运营状态图(https://www.didiglobal.com/)、Facebook发布的全球用户网络(http://fbmap.bitaesthetics.com/)等。地理大数据提供了观察大尺度下地理现象和规律的可能性,为研究全球变化、宏观社会行为提供了宝贵的素材。3.3 时空密度
由于成本的原因,传统的地理学研究对于地理现象的观测除了受限于范围的局部性,样本的密度也相对稀疏。因此,在有限样本基础上进行地理现象的刻画通常需要借助空间估计和推断的方法,如克立格插值[19,20]、地理加权回归[21,22]、环境因子模型[23,24]等。由空间统计方法获得的分布特征,虽然可通过空间相关性在一定程度上弥补样本稀疏的缺憾,但估计的结果毕竟无法取代属性的真实分布。与此相反,地理大数据的基本特征之一就是面向地理对象的高密度样本。在对地观测大数据中,数据的密度是随着粒度的变细而不断增加的。随着传感器分辨率的提升以及无人机等技术的广泛应用,影像像素分辨率不断提高,使得像素密度相应增加,混合像元信息不断裂解细化,导致像元所代表的信息更加精细;随着全球对地观测台网的逐步升级,对地监测的台站数目也不断增加,其中,气象台站从20世纪60年代的8000多个[25]增加到现在的超过100000个[26],平均密度已达每1490 km2就有1个观测站;对海洋观测的Argo浮标从2000年开始布设,数目已增加到2018年7月的3762个[27]。相比于人类行为大数据,以问卷调查得到的传统“小数据”虽然粒度也小,但密度很低,而以手机通话和信令为代表的大数据,用户已覆盖了城市的大部分人口,与此类似的还有腾讯的QQ及微信用户。随着智能卡和互联网应用的普及,人类行为大数据中样本的密度也越来越高。地理大数据样本密度的提升使得对地理现象的观测更加细致与逼真。3.4 时空偏度
虽然地理大数据在粒度、广度以及密度等方面较传统小数据具有明显的优势,但同时也普遍存在着缺陷,而使其饱受诟病。需特别说明的是,人类行为大数据普遍存在有偏的现象,集中体现为数据载体在时间、空间和属性等几个方面的有偏性。以微博数据为例,很多研究使用其进行城市功能和人群行为的研究。而实际上,微博的使用者,在年龄属性上主要集中在18~30岁的年龄段;在性别上,女性用户的比例更大[28];而在空间上,沿海地区较中西部使用率更高;不仅如此,微博所含的内容更加偏重于娱乐、教育、财经等方面的热点事件[29]。针对地理大数据有偏性对统计结果的影响,Zhao等应用手机数据进行了研究[30],结果显示:由部分抽样的手机数据得到的移动距离、回旋半径、移动熵的数值与全样本之间存在显著的差异。由此可见,将有偏的大数据的规律推断为全体性质存在风险。偏度的普遍性存在导致其所得到的规律往往表现出一定程度的“偏见”,故在使用地理大数据时需要谨慎甄别。3.5 时空精度
地理大数据另一个不容忽视的缺陷是其精度较差。精度问题在空间数据中普遍存在,而地理大数据的精度问题尤为突出,有时甚至会影响到计算结果的可信度。对地观测数据中的精度问题已经为众多研究所揭示[31,32,33],在此不再赘述。对于人类行为大数据,由于其在获取过程中的被动性(例如,用于估计城市精细人口的手机信令数据并非为估计人口而设计收集)和自发性(例如,用于度量城市心情的微博数据由用户自发上传),数据中往往充斥着各种类型的误差,这种误差同样会存在于空间、时间以及属性中。以手机信令数据为例,由于城市建筑物的遮挡以及基站容量的限制,手机在通话时并不一定与其最近的基站发生通信,此时若将用户位置归于最近基站的小区内,则会产生空间误差。同样,在社交媒体数据中,用户所上传的事件位置、时间和文本内容,往往并不能代表事件发生的真实状况。因此,与目的性采样的小数据不同,地理大数据中的误差除了技术原因之外,很多源于数据产生主体的不可控因素,有时甚至是一些主观故意造成的时空位置信息的改变[34]。地理大数据中误差的存在,往往会引发认识的偏差,甚至导致谬误的发生,谷歌公司对于流感预测的成功与失败就是例证[4, 35]。地理大数据所具有的冲击力源于其粒度细、广度宽和密度大,这些都是传统小数据所不具备的;然而,地理大数据的偏度重和精度差同样也是小数据所力求避免的,传统的采样理论和误差理论就是针对偏度和精度而产生的模型体系,可以有效地限制偏度和控制精度。由此可见,地理大数据与小数据之间各有优劣,在现有条件下,一方不能完全取代另外一方,二者的结合可扬长避短,而在地理大数据的应用中,应注重其局限性,避免错误的产生与滥用。
4 地理大数据挖掘的核心问题
数据的价值在于隐匿其中的规律[36,37,38],而数据挖掘的主要目的就是发现其中的知识。对于地理大数据所蕴藏的地理特征,数据挖掘方法如何应对?本文认为以下4个方面需要重点关注。① 对地观测大数据的获取是以对客体的观测为主要方式,故数据易于结构化,而人类行为大数据以主体记录为主,由记录产生的数据结构复杂、特征多变、类型多样,因此,如何进行表达成为地理大数据挖掘的前提。② 地理大数据繁冗复杂,需要确定挖掘的目标及其本质,唯此,地理大数据挖掘方有可能发展成为地理信息科学的分支乃至独立的学科。③ 由于地理大数据所具有的粒度、广度和密度等特征,地理现象从微观到宏观诸多尺度特征贯穿于地理大数据中,这是传统小数据所无法比拟的,因此,需要阐述清楚在挖掘过程中如何处理地理大数据内含的尺度性。④ 面对当前地理学研究的重要素材——地理大数据,有必要弄清地理大数据挖掘与地理学之间的关系,尤其是地理大数据挖掘在地理学的发展中能够起到何种作用。4.1 地理大数据的表达:位空间和流空间
地理大数据中对地观测大数据所聚焦的对象是地表要素,而人类行为大数据的主体是人,二者间的作用可以视为主体与环境之间存在的关系。对地表要素观测的数据以位置为核心,属性的变化都以位置为支点,在研究中可视为影响人类行为与活动的环境要素。这种以时空位置为核心的数据类型可用位空间为框架进行表达,而位空间是指以位置为基本表达单元,以欧氏距离作为基本测度的空间[39]。在其中,地理要素表达的基础是位置,地理现象以瞬时状态为表现形式[40]。位空间是传统地图表达的框架,位置及其相对关系就是地理现象时空格局的内涵,而地理大数据挖掘的任务之一就是在位空间中揭示这种格局。人类行为大数据是人类各种活动的反映。在与人相关的活动和关系中,流可以作为基本要素(流可定义为包含起点和终点的点对),这其中包括:人流、物流、信息流、资金流、关系流等。流可以视为两个结点(位置)之间的流动或交互[41,42]。在人类行为大数据中,流的起点与终点之间,距离不再是唯一衡量其关系的测度,而是与时间、成本、吸引力等多种测度并存[43]。人类行为大数据中对于人的关注不仅限于位置上的变化,而是以各种出行、社会关系等为核心。距离效应的减弱以及时空模式关注点的改变使得位空间已无法满足人类行为大数据更深层次的表达与分析,而需要借助流空间的概念。在流空间中,流作为基本单元,流和流之间的交错形成网络。流空间中表达的是交互关系,而流空间中数据挖掘的目的是提取位置之间的交互模式。目前传统的地图方式尚难以有效表达流的模式,而全息地图和虚拟现实技术将有可能成为其新的载体。流空间与位空间的测度不一样,性质也不一样,其分析模型也存在本质的区别,而针对其时空特征提取方法的研究则是地理大数据挖掘重要的发展方向。
4.2 地理大数据挖掘的内容:模式与关系
本文将地理数据挖掘的目标定义为寻找地理对象之间、地理对象与环境之间存在的规则和异常。据此,地理大数据挖掘的内容也分为两个部分:① 地理时空模式的挖掘,其本质是发现地理对象的分布规则与时空分布;② 地理时空关系的挖掘,其本质是发现地理对象与不同环境因子之间的关系。由于地理大数据的特点,挖掘内容较之“小数据”也有所改变。4.2.1 地理时空模式 地理学中目前公认的定理是空间相关性与空间异质性定理[44,45]。两个定理表述的意义看似相向,但实际是从两个侧面共同描述了地理现象:相近者相似,但彼此相异。在位空间中,地理学第一定律表现为属性相似度与距离的关系,而异质性则表现为空间上的非平稳性。在流空间中,空间相关性表现为空间网络结构的存在,即具有相近起点和终点的流构成了位置之间的联系,且联系的强度与距离等变量相关;而异质性则表现为不同单元之间流的差异性。地理大数据时空模式挖掘的本质是揭示地理对象因时空相关与异质性而形成的“异—同”规则及由此产生的时空分布。所谓“异”,是指地理对象之间的差别,而“同”则是指不同对象的共性。以地震数据的模式挖掘为例,一方面,需要确定提取丛集地震的“异—同”规则,从而将其与背景地震区分开来,并判别它们各自的统计分布类型(如泊松分布或威布尔分布等);另一方面,在找出“异—同”规则的基础上,还要确定丛集地震和背景地震的空间分布范围和特征。前者属于“异—同”规则的推断,“同”类地震属于相同的统计分布,相“异”的地震分属不同的统计分布;后者属于时空分布的提取,而实际上,丛集地震和背景地震的时空分布可视为时空相关和异质性定律综合、直观的反映。针对时空模式,传统地理数据挖掘的主要任务包括:时空异质性的判别、地理时空异常模式的提取、空间分布模式的识别、地理时空演化趋势提取等。地理大数据所带来的改变集中体现在模式的类型及尺度两个方面:对于模式的类型,除了传统的栅格、要素、场的异质性与分布之外,地理大数据挖掘将更加关注序列、流与网络的结构与异质性等复杂模式;对于模式的尺度,由于具有的粒度、广度与密度的特征,地理大数据的挖掘将会产生更宏观、更综合、更精细的模式。
4.2.2 地理时空关系 地理对象与环境因子之间通常表现为相关或关联关系。相关关系通常用以刻画地理对象属性与环境因子之间的定量关系,例如:铅污染的程度与高速公路的远近[46];而关联通常描述地理对象同时出现或存在的某种依赖关系,例如:盗窃与入室抢劫案件之间的关系[47]。地理时空关系中通常蕴藏着两方面的因素,以铅污染与高速公路之间的关系为例,一方面是变量之间的作用机制,即高速公路上汽车的尾气排放导致周围土壤中铅含量增加;而另一方面是这种土壤铅含量的变化与污染源远近之间的关系,即距离高速公路越近,铅的含量越高。针对时空关系的挖掘,地理大数据所带来的改变主要体现在关系的类型以及关系的转换上。一方面,变量之间关系的类型更加多样和复杂,非线性、不确定性及多元的时空关系成为大数据挖掘的重点之一[48];另一方面,除了同类型空间下的时空关系挖掘,不同类型空间(如:社交空间、现实空间、情感空间)之间信息的反演与延伸成为大数据挖掘的主要特点之一,由此而导致的关系的转换也成为大数据思维的核心体现,例如:通过遥感数据反演经济状况[49]、利用搜索热词预测流感趋势[4]、应用手机数据反演城市土地利用[50]等。
需要说明的是,由于地理大数据的密度大、粒度小,相较于传统小数据,数据间具有很强的时空相关性,因此,从中容易“发现”各种时空关系,而这些关系往往涉及非常复杂的成因,是否具有因果关系需要仔细甄别。以盗窃与入室抢劫案的相伴发生为例,二者共现的实际原因可能是某些区域自然与社会环境较差而导致各种类型案件的高发,而并非存在明显的因果关系[47]。
4.3 地理模式的内在结构:尺度与叠加
前已述及地理大数据挖掘的目的是提取时空模式与时空关系。众多研究表明,地理格局、分布与过程的发生等都是尺度依存的。换句话说,地理模式都是在一定尺度下出现的,而地理大数据挖掘也离不开尺度。具体地,模式的挖掘就是要找出内部相“同”、对外相“异”的若干分布,而异质性与均匀性这种看似矛盾的性质可随尺度的变化而发生转换。这种转换正是地理格局尺度特征的重要原因。图2就揭示了点过程中异质性与均匀性在不同观测尺度下的转换,即在大尺度下呈异质性的点数据(图2a),其某个局部在小尺度下是均匀的分布(图2b)。由此,我们认为大尺度的复杂模式可以视为若干局部均匀模式的叠加。而对于地理大数据中的时空关系,也是尺度依存的。具体表现为,地理要素的尺度特征决定了相关关系的尺度性,大尺度的要素特征决定了总体趋势,而较小尺度的要素特征决定了局部的相关性,不同尺度上规律的叠加最终形成了总体上复杂的关系。例如,地形和气候要素的大尺度分布确定了中国人口东密西疏的宏观格局,而中尺度的要素(如局部的区位、地形、交通等)特征决定了人口的局部分布。多因子的多尺度叠加最终导致地理现象的复杂空间分布。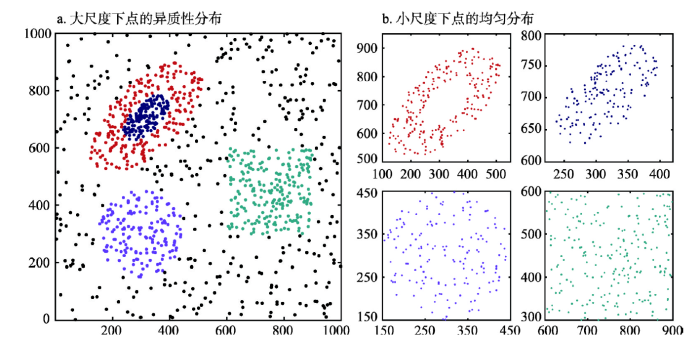 显示原图|下载原图ZIP|生成PPT
图2地理点过程中均匀性与异质性随尺度的变化
-->Fig. 2Transformation between homogeneity and heterogeneity of geographical point processes at difference scales (a. heterogeneity at large scale; b. homogeneity at small scale)
-->
数据挖掘的尺度性体现在不同观察尺度下所挖掘出的模式不同,为此,裴韬等[51,52]提出点过程的混合模式分解理论。其主要思想为,地理点集现象可以视为不同时空尺度、不同性质地理过程叠加的结果。一方面,其时空特征可视为不同尺度下模式的叠加,而另一方面,地理现象产生的原因是不同时空尺度下因子相互叠加作用的结果。例如,一个地区的地震分布可以视为背景地震、断裂带地震以及地震序列的叠加,同时,地震的形成也是不同尺度构造运动叠加的结果。由于地理大数据所具有的特点,在一套地理大数据中通常存在着从细—粗的多尺度特征。既然地理的模式与机制是综合叠加的结果,那么反过来,地理大数据挖掘就可以看成是对模式和关系进行分解的过程。
4.4 地理大数据挖掘的知识—地理模式背后的人地关系
地理数据挖掘一般都会伴随着未知模式的发现及其原因的探索两个阶段。针对对地观测数据的挖掘,所提取的模式为地表要素的格局,而针对人类行为数据的挖掘,提取的是人的行为模式。而模式的背后究竟是何种机制在起作用?地理大数据,尤其是人类行为大数据的出现,构成了从人地关系中揭示地理模式之机制的完备条件。地表要素的模式,表面是地的特征,其后则是人类行为的结果,例如,土地利用的分布与变化表面上属于地表要素的特征,而实际上则是人类活动的印记。手机通话数据看似反映人类行为的特征,在空间上展现出不同模式,但换角度观之却是城市功能区差异的体现[50]。地理大数据背后的模式,其机理都可以归结为人地关系,地的模式中蕴藏着人的因素,而人的行为模式受到地的制约。人和地的关系类似于中国古代易经中“阴”和“阳”的关系,对立统一,互有你我。通过人可知地、通过地可知人,而从地理模式中解析出的人地关系则是地理大数据挖掘的内涵。地理学的发展经历了从经验范式(第一范式)—实证范式(第二范式)—系统仿真范式(第三范式)—数据驱动范式(第四范式)的演进[48],现阶段地理学发展更加依赖于地理大数据及其分析方法。由此不难看出,地理大数据挖掘已成为地理学规律发现的重要工具。然而需要说明的是,地理大数据挖掘虽可产生地理模式及其与环境的相关性等“规律”,但“规律”中模式的真实性以及相关性中是否存在因果关系仍然需要通过观察、实验以及模拟等手段进行验证。
5 地理大数据的挖掘方法
地理大数据的挖掘方法非常多,其分类方案也存在多种标准,目前主要有以下几种:按照是否依赖于先验知识,可将其分为模型驱动和数据驱动两类挖掘方法[53,54];依据挖掘任务,又可将其分为:数据总结、聚类、分类、关联规则、序列模式、依赖关系、异常以及趋势的挖掘方法[55,56];根据挖掘对象可分为:关系数据、对象数据、图像数据、文本数据、多媒体数据、网络数据的挖掘方法等[57,58];根据挖掘模型的特征可分为:机器学习方法、统计方法、神经网络方法和数据库方法等[59]。上述方案虽然都对数据挖掘方法进行了划分,但仍存在一定缺憾。针对任务、对象和特征的分类,均属于不完备的方案,一旦有新的挖掘任务、挖掘对象和挖掘模型,原有的分类方案就必须增补。不仅如此,划分方案中存在重叠,具体为:以挖掘对象进行分类的对象数据、图像数据与多媒体数据,以挖掘任务进行分类的异常与聚类模式的挖掘模型、趋势与序列模式的挖掘方法,以模型特征分类的机器学习与统计学方法等。本文根据地理大数据挖掘的目标,将挖掘方法分为两类:时空分类的挖掘方法和时空关系的挖掘方法。前者用于区分地理对象的异同,旨在提取时空模式,而后者用于寻找时空变量的相关性,旨在挖掘地理对象与环境之间的时空关系。分类挖掘方法包括:空间聚类[60,61]、空间分类[62]、空间决策树[63]、点过程分解[51]等。时空关系的挖掘方法包括:关联规则挖掘[64,65]、主成分分析[66,67]、回归分析方法[68,69]等。此外,还有一些方法既可用于时空分类,也可用于时空关系挖掘,如神经网络[70,71]、支持向量机[72,73],随机森林[74,75]等,可视具体算法模型而定。除了上述挖掘方法之外,还有部分方法是优化模型,用于参数的估计,并辅助于数据挖掘方法,如深度学习策略[76]、EM算法[77]、MCMC算法[78]等。由于地理现象的复杂性,人工智能方法已经广泛应用于地理学的研究中,而人工智能与地理大数据的结合,将为地理大数据挖掘的发展提供新的动力源。
由于地理大数据的“5V”和“5度”特征,传统的数据挖掘方法在应用时需要顾及地理大数据的特点。首先,数据量对数据挖掘方法提出了严峻挑战,大数据必然带来更大的计算量,现有算法如何进行并行化和分布式计算是首当其冲的问题。其次,对于复杂场景的应用,大数据的出现往往会产生两类效应,一方面会简化模型,例如,对于复杂交通环境下时间最短路径的计算,传统研究会采用复杂的预测模型,而浮动车GPS大数据的出现,则使得时间最短路径的计算转化为简单的查询[79,80];另一方面则会催生出更加复杂的模型,例如,浮动车GPS大数据的出现又会带来“如何进行出租车共享以节省资源”[81]等问题;第三,由于地理大数据的偏度以及不等精度的特点,对于地理大数据计算所得结果的真伪需要更为谨慎的评价,这样才能保证方法应用的效果。
6 结论
大数据的时代已经来临,地理学的发展也沐浴其中。作为一种特殊的大数据,地理大数据的挖掘所面临的挑战主要来自以下三个方面。第一,多源地理大数据的聚合问题成为深入解析时空模式和时空关系的瓶颈。地理大数据的种类众多,其时空粒度、模态性质和数据结构不尽相同,如何从时空和属性维度进行不同大数据的“垂直”融合和“横向”贯通成为未来深度挖掘地理大数据的关键。第二,地理大数据的有偏性和不等精度给地理大数据的知识发现带来诸多不确定性,如何有效评价和应用其挖掘结果是地理大数据研究不可回避的问题。第三,产生“有价值而非常识”的知识是地理大数据挖掘所面临的艰巨任务。大数据挖掘的目的就是知识的提取,目前的研究虽然在统计物理、人工智能等领域已有若干颠覆传统认识的成果,但在地理学的领域,数据挖掘所发挥的作用仍然缺乏说服力,正如腾讯位置大数据所展示的中国人口分布的不均匀模式一样(https://heat.qq.com/index.php),虽然震撼,但其显示的人口分界线却早已被几十年前诞生的“胡焕庸线”所揭示。面向未来的挑战,地理大数据挖掘今后的发展脉络也不难梳理。首先,地理大数据挖掘应从更大尺度、更细粒度、更全维度出发解决地理学的基础问题,全球变化及其影响、人类行为特征、地表要素的社会特征、城市动力学演化等都是未来地理大数据关注的热点。其次,地理数据分析模型的发展将会更加顾及地理大数据的“5V”和“5度”特征,一方面,以人工智能为代表的数据挖掘方法,通过大数据样本的训练,在面对复杂地理问题时,其进展令人期待;另一方面,只有效率更高、更加稳健的算法方能适应地理大数据挖掘。最后,遥感研究从传统的对地表要素的观测将会延伸至对社会的观测,产生更多的科学和商业应用;而针对人类行为大数据的探索,则将感知社会拓展到对地表要素特征的反演,从而应用于与城市相关的研究中;最终两类大数据的结合,将成为揭示地理学中人地关系的重要突破口。
The authors have declared that no competing interests exist.
参考文献 原文顺序
文献年度倒序
文中引用次数倒序
被引期刊影响因子
| [1] | . 从数据库中发现知识(KDD)是当前人工智能界的研究热点,本文先简要介绍了KDD的一些基本情况,然后探讨了KDD在GIS中应用的可能性和必要性,并就从GIS数据库中发现知识的方法进行了讨论。 . 从数据库中发现知识(KDD)是当前人工智能界的研究热点,本文先简要介绍了KDD的一些基本情况,然后探讨了KDD在GIS中应用的可能性和必要性,并就从GIS数据库中发现知识的方法进行了讨论。 |
| [2] | |
| [3] | . |
| [4] | . |
| [5] | . Abstract The game of Go has long been viewed as the most challenging of classic games for artificial intelligence owing to its enormous search space and the difficulty of evaluating board positions and moves. Here we introduce a new approach to computer Go that uses 'value networks' to evaluate board positions and 'policy networks' to select moves. These deep neural networks are trained by a novel combination of supervised learning from human expert games, and reinforcement learning from games of self-play. Without any lookahead search, the neural networks play Go at the level of state-of-the-art Monte Carlo tree search programs that simulate thousands of random games of self-play. We also introduce a new search algorithm that combines Monte Carlo simulation with value and policy networks. Using this search algorithm, our program AlphaGo achieved a 99.8% winning rate against other Go programs, and defeated the human European Go champion by 5 games to 0. This is the first time that a computer program has defeated a human professional player in the full-sized game of Go, a feat previously thought to be at least a decade away. |
| [6] | . A long-standing goal of artificial intelligence is an algorithm that learns, , superhuman proficiency in challenging domains. Recently, AlphaGo became the first program to defeat a world champion in the game of Go. The tree search in AlphaGo evaluated positions and selected moves using deep neural networks. These neural networks were trained by supervised learning from human expert moves, and by reinforcement learning from self-play. Here we introduce an algorithm based solely on reinforcement learning, without human data, guidance or domain knowledge beyond game rules. AlphaGo becomes its own teacher: a neural network is trained to predict AlphaGo’s own move selections and also the winner of AlphaGo’s games. This neural network improves the strength of the tree search, resulting in higher quality move selection and stronger self-play in the next iteration. Starting , our new program AlphaGo Zero achieved superhuman performance, winning 100–0 against the previously published, champion-defeating AlphaGo. |
| [7] | . Big data : a revolution that will transform how we live, work and think Viktor Mayer-Sch02nberger and Kenneth Cukier John Murray, 2013 : pbk |
| [8] | . Big Data in practice.[ Marr, Bernard; ]. The best-selling author of Big Data is back, this time with a unique and in-depth insight into how specific companies use big data. Big data is on the tip of everyone's tongue. Everyone understands its power and importance, but many ... |
| [9] | . 近年来,不同类型大数据在地理研究中得到了越来越多的重视,许多****基于手机、社交媒体、出租车等数据开展了大量实证研究。社会感知概念刻画了地理空间大数据基于大量人的行为时空模式获取地理环境特征的的技术手段,该手段有助于重新审视地理学研究中的一些基本问题,因而本文选择了空间分布和空间交互这两个基本地理概念以及定性方法和定量方法这两个人文地理基本研究方法展开讨论。大数据从微观个体和宏观群体两个层面同时感知空间分布和空间交互,可以定量分析其中的距离以及尺度效应。进而,由于小样本访谈人群和场所是定性研究的基础,而大数据可以通过定量方法识别特定人群和场所并进行刻画,因此,社会感知手段为集成定性和定量研究方法,构建混合地理学奠定了基础。 , 近年来,不同类型大数据在地理研究中得到了越来越多的重视,许多****基于手机、社交媒体、出租车等数据开展了大量实证研究。社会感知概念刻画了地理空间大数据基于大量人的行为时空模式获取地理环境特征的的技术手段,该手段有助于重新审视地理学研究中的一些基本问题,因而本文选择了空间分布和空间交互这两个基本地理概念以及定性方法和定量方法这两个人文地理基本研究方法展开讨论。大数据从微观个体和宏观群体两个层面同时感知空间分布和空间交互,可以定量分析其中的距离以及尺度效应。进而,由于小样本访谈人群和场所是定性研究的基础,而大数据可以通过定量方法识别特定人群和场所并进行刻画,因此,社会感知手段为集成定性和定量研究方法,构建混合地理学奠定了基础。 |
| [10] | . Abstract Understanding the spatiotemporal dynamics of urban population is crucial for addressing a wide range of urban planning and management issues. Aggregated geospatial big data have been widely used to quantitatively estimate population distribution at fine spatial scales over a given time period. However, it is still a challenge to estimate population density at a fine temporal resolution over a large geographical space, mainly due to the temporal asynchrony of population movement and the challenges to acquiring a complete individual movement record. In this article, we propose a method to estimate hourly population density by examining the time-series individual trajectories, which were reconstructed from call detail records using BP neural networks. We first used BP neural networks to predict the positions of mobile phone users at an hourly interval and then estimated the hourly population density using log-linear regression at the cell tower level. The estimated population density is linearly correlated with population census data at the sub-district level. Trajectory clustering results show five distinct diurnal dynamic patterns of population movement in the study area, revealing spatially explicit characteristics of the diurnal commuting flows, though the driving forces of the flows need further investigation. |
| [11] | |
| [12] | |
| [13] | . 61Floating car trajectory data can be used to predict traffic congestion effectively.61A Fuzzy Comprehensive Evaluation method with dynamic adaptive weight is introduced.61A Traffic Flow Prediction method utilizing particle swarm optimization is proposed.61Experiments verify methods’ performances in accuracy, instantaneity and stability. |
| [14] | . (2017). Integrating multi-source big data to infer building functions. International Journal of Geographical Information Science: Vol. 31, No. 9, pp. 1871-1890. doi: 10.1080/13658816.2017.1325489 |
| [15] | . Abstract Debates over the future of the UK's traditional decadal census have led to the exploration of supplementary data sources, which could support the provision of timely and enhanced statistics on population and housing in small areas. This paper reviews the potential value of a number of commercial datasets before focusing on high temporal resolution household electricity load data collected via smart metering. We suggest that such data could provide indicators of household characteristics that could then be aggregated at the census output area level to generate more frequent official small area statistics. These could directly supplement existing census indicators or even enable development of novel small area indicators. The paper explores this potential through preliminary analysis of a ‘smart meter-like’ dataset, and when set alongside the limited literature to date, the results suggest that aggregated household load profiles may reveal key household and householder characteristics of interest to census users and national statistical organisations. The paper concludes that complete coverage, quasi-real time reporting, and household level detail of electricity consumption data in particular could support the delivery of population statistics and area-based social indicators, and we outline a research programme to address these opportunities. 08 2015 The Authors. Population, Space and Place published by John Wiley & Sons Ltd. |
| [16] | |
| [17] | . China : Open access to Earth land-cover map |
| [18] | . <p>叶面积指数是描述土壤-植被-大气之间物质和能量交换的关键参数,获取大区域长时间序列叶面积指数有助于研究气候变化条件下植被的响应及反馈。本文利用MODIS观测和经过重新处理的地表长时间数据集(Land Long Term Data Record)LTDR AVHRR数据,生成了全球1981-2012年叶面积指数数据。算法通过建立二者之间像元级关系,利用高质量MODIS观测约束历史AVHRR数据的反演,这有助于减小2种存在显著差别传感器反演结果的不一致性,也有助于提高AVHRR反演质量。首先算法利用高质量MODIS地表反射率反演2000-2012年叶面积指数,然后利用多年每8 d的LTDR AVHRR地表反射率数据计算简单比植被指数(Simple Ratio,SR),利用SR平均值和MODIS LAI平均值建立像元级AVHRR SR-MODIS LAI关系。在此基础上,实现1981-1999年AVHRR LAI反演,最终得到全球1981-2012年叶面积指数数据。本算法反演的AVHRR和MODIS LAI与全球植被的空间分布吻合,能表征主要生物群系类型的季节变化特征,2个数据集一致性较好,并且与NASA MODIS LAI标准产品(MOD15A2)的空间分布和季节变化曲线吻合较好。</p> . <p>叶面积指数是描述土壤-植被-大气之间物质和能量交换的关键参数,获取大区域长时间序列叶面积指数有助于研究气候变化条件下植被的响应及反馈。本文利用MODIS观测和经过重新处理的地表长时间数据集(Land Long Term Data Record)LTDR AVHRR数据,生成了全球1981-2012年叶面积指数数据。算法通过建立二者之间像元级关系,利用高质量MODIS观测约束历史AVHRR数据的反演,这有助于减小2种存在显著差别传感器反演结果的不一致性,也有助于提高AVHRR反演质量。首先算法利用高质量MODIS地表反射率反演2000-2012年叶面积指数,然后利用多年每8 d的LTDR AVHRR地表反射率数据计算简单比植被指数(Simple Ratio,SR),利用SR平均值和MODIS LAI平均值建立像元级AVHRR SR-MODIS LAI关系。在此基础上,实现1981-1999年AVHRR LAI反演,最终得到全球1981-2012年叶面积指数数据。本算法反演的AVHRR和MODIS LAI与全球植被的空间分布吻合,能表征主要生物群系类型的季节变化特征,2个数据集一致性较好,并且与NASA MODIS LAI标准产品(MOD15A2)的空间分布和季节变化曲线吻合较好。</p> |
| [19] | . |
| [20] | . Michael L. STEIN. New York: Springer-Verlag, 1999. ISBN 0-387-98629-4. xvii + 247 pp. $49.95. Books on kriging tend to focus on its applications for predicting observations at unsampled sites from data collected on a spatial network of sampled sites. For example, applications in mining have been considered by David (1978), and Journel and Huijbregts (1978); those in petroleum reserve estimation, by Hohn (1988); those in geology, by Clark (1979) and Olea (1999), those in hydrology, by Kitanidis (1997); and those in natural resources evaluation, by Goovaerts (1997). More general treatments have been provided by Cressie (1991) and Chiles and Delfiner (1999). Recently, more specialized books have appeared, including Rivoirard's (1994) book on disjunctive kriging and Wackernagel's (1995) text on multivariate approaches. Although these books investigate the statistical properties of the kriging predictor, most rely on simulation and empirical investigations of those properties. Stein's research monograph provides a thorough theoretical treatment of the statistical properties of the kriging predictor. Synthesizing his past work with many new results, he investigates the efficiency of the kriging predictor under fixed domain asymptotics, where the number of observations is increased in a fixed, bounded study region. This asymptotic approach is natural for geostatistical applications, where interest typically focuses on interpolation, as opposed to extrapolation into regions where observations were not taken and hence should be of little interest. The asymptotic efficiency of the kriging predictor under misspecified auto-covariance functions is explored under assumptions regarding the... |
| [21] | . Spatial nonstationarity is a condition in which a simple 090008global090009 model cannot explain the relationships between some sets of variables. The nature of the model must alter over space to reflect the structure within the data. In this paper, a technique is developed, termed geographically weighted regression, which attempts to capture this variation by calibrating a multiple regression model which allows different relationships to exist at different points in space. This technique is loosely based on kernel regression. The method itself is introduced and related issues such as the choice of a spatial weighting function are discussed. Following this, a series of related statistical tests are considered which can be described generally as tests for spatial nonstationarity. Using Monte Carlo methods, techniques are proposed for investigating the null hypothesis that the data may be described by a global model rather than a non-stationary one and also for testing whether individual regression coefficients are stable over geographic space. These techniques are demonstrated on a data set from the 1991 U.K. census relating car ownership rates to social class and male unemployment. The paper concludes by discussing ways in which the technique can be extended. |
| [22] | . |
| [23] | . Fuzzy membership function is an effective tool to represent relationship between soil and environment for predictive soil mapping. Usually construction of a fuzzy membership function requires knowledge on soil-landscape relationships obtained from local soil experts or from extensive field samples. For areas with no soil survey experts and no extensive soil field observations, a purposive sampling approach could provide the descriptive knowledge on the relationships. However, quantifying this descriptive knowledge in the form of fuzzy membership functions for predictive soil mapping is a challenge. This paper presents a method to construct fuzzy membership functions using descriptive knowledge. Construction of fuzzy membership functions is accomplished based on two types of knowledge: 1) knowledge on typical environmental conditions of each soil type and 2) knowledge on how each soil type corresponds to changes in environmental conditions. These two types of knowledge can be extracted from catenary sequences of soil types and the associated environment information collected at a few field samples through purposive sampling. The proposed method was tested in a watershed located in Heshan farm of Nenjiang County in Heilongjiang Province of China. A set of membership functions were constructed to represent the descriptive knowledge on soil-landscape relationships, which were derived from 22 field samples collected through a purposive sampling approach. A soil subgroup map and an A-horizon soil organic matter content map for the area were generated using these membership functions. Forty five field validation points were collected independently to evaluate the two soil maps. The soil subgroup map achieved 76% of accuracy. The A-horizon soil organic matter content map based on the derived fuzzy membership functions was compared with that derived from a multiple linear regression model. The comparison showed that the soil organic content map based on fuzzy membership functions performed better than the soil map based on the linear regression model. The proposed method could also be used to construction membership functions from descriptive knowledge obtained from other sources. |
| [24] | . Detailed information on the spatial variation of soils is desirable for many agricultural and environmental applications. This research explores three approaches that use soil fuzzy membership values to predict detailed spatial variation of soil properties. The first two are weighted average models with which the soil property value at a location is the average of the typical soil property values of the soil types weighted by fuzzy membership values. We compared two options to determine the typical property values: one that uses the representative values from existing soil survey and the other that uses the property value of a field observation typical of a soil type. The third approach is a multiple linear regression in which the soil property value at a location is predicted using a regression between the soil property and fuzzy membership values. We compared this to multiple linear regression with environmental variables. In a case study in the Driftless Area of Wisconsin, the models were also compared with a predictive model based on existing soil survey. The results showed that regression with environmental variables works well for areas where the soil errain relationship is relatively simple but regression with fuzzy membership values is an improvement for areas where soil errain relationships are more complicated. From the perspectives of data requirement and model simplicity as well as accuracy of prediction the weighted average with maximum fuzzy membership option has obvious advantages. |
| [25] | . 回首世界气象组织(WMO)成立以来的60年光辉历程,突出的成就之一就是所建立的功能强大、标准化的全球观测网,结合开放的数据政策及强大的实时数据交换业务能力,大大促进了全球、区域和国家级气象业务的发展,满足了不断增长和日趋复杂的社会需求,为人类安全和福祉做出了巨大贡献。世界天气监视计划(WWW)建立的全球观测系统(GOS)是世界气象组织国际合作的重要里程碑。本文首先回顾了世界天气监视计划全球观测系统(GOS)的起源、演进和现状,及其对全球气象业务发展的巨大贡献。第二部分描述了滚动需求评估过程的要点,即世界气象组织如何评估观测能力满足用户的过程,这使得我们得以更好地指导观测系统的发展。第三部分给出了全球观测系统到2025年发展的远景的描述,解释了未来观测系统的主要组成部分的发展要点。第四部分阐述世界气象组织新举措:WMO全球综合观测系统(WIGOS),一个综合、全面和协调的观测系统,它将以高效益成本比和可持续的方式,满足世界气象组织成员国日益增长的观测需求,提升他们为天气、气候、水和有关的环境领域的服务能力,同时加强与世界气象组织观测系统与伙伴组织观测系统的协调合作,造福社会。 . 回首世界气象组织(WMO)成立以来的60年光辉历程,突出的成就之一就是所建立的功能强大、标准化的全球观测网,结合开放的数据政策及强大的实时数据交换业务能力,大大促进了全球、区域和国家级气象业务的发展,满足了不断增长和日趋复杂的社会需求,为人类安全和福祉做出了巨大贡献。世界天气监视计划(WWW)建立的全球观测系统(GOS)是世界气象组织国际合作的重要里程碑。本文首先回顾了世界天气监视计划全球观测系统(GOS)的起源、演进和现状,及其对全球气象业务发展的巨大贡献。第二部分描述了滚动需求评估过程的要点,即世界气象组织如何评估观测能力满足用户的过程,这使得我们得以更好地指导观测系统的发展。第三部分给出了全球观测系统到2025年发展的远景的描述,解释了未来观测系统的主要组成部分的发展要点。第四部分阐述世界气象组织新举措:WMO全球综合观测系统(WIGOS),一个综合、全面和协调的观测系统,它将以高效益成本比和可持续的方式,满足世界气象组织成员国日益增长的观测需求,提升他们为天气、气候、水和有关的环境领域的服务能力,同时加强与世界气象组织观测系统与伙伴组织观测系统的协调合作,造福社会。 |
| [26] | |
| [27] | . 随着海洋观测,模拟手段的快速提升和数据科学的重大突破,现代海洋科学经历了理论牵引,技术驱动与 数据主导三大范式变革,海洋大数据已成为人类从认识海洋到经略海洋的必经之路.文章从海洋大数据的获取, 分析及应用,上,中,下游全链条分析了目前的发展现状,指出现今将海洋科学领域与数据科学领域紧密结合, 有效应对海洋发展中科学,技术,工程,人文等方面的挑战,是海洋科研领域的核心问题之一.在此基础上,提 出了未来 5--10 年海洋大数据科学发展的主要方向和关键技术,对于准确掌握海洋状况,提升海洋预测服务能力, 维护国家海洋权益具有重要的现实意义和深远的战略意义. . 随着海洋观测,模拟手段的快速提升和数据科学的重大突破,现代海洋科学经历了理论牵引,技术驱动与 数据主导三大范式变革,海洋大数据已成为人类从认识海洋到经略海洋的必经之路.文章从海洋大数据的获取, 分析及应用,上,中,下游全链条分析了目前的发展现状,指出现今将海洋科学领域与数据科学领域紧密结合, 有效应对海洋发展中科学,技术,工程,人文等方面的挑战,是海洋科研领域的核心问题之一.在此基础上,提 出了未来 5--10 年海洋大数据科学发展的主要方向和关键技术,对于准确掌握海洋状况,提升海洋预测服务能力, 维护国家海洋权益具有重要的现实意义和深远的战略意义. |
| [28] | . |
| [29] | |
| [30] | . Understanding the bias of call detail records in human mobility research. . ???aop.label???. doi: 10.1080/13658816.2015.1137298 |
| [31] | . This paper reviews the necessary considerations and available techniques for assessing the accuracy of remotely sensed data. Included in this review are the classification system, the sampling scheme, the sample size, spatial autocorrelation, and the assessment techniques. All analysis is based on the use of an error matrix or contingency table. Example matrices and results of the analysis are presented. Future trends including the need for assessment of other spatial data are also... |
| [32] | . Spatial data quality is a paramount concern in all GIS applications. Existing spatial data accuracy standards, including the National Standard for Spatial Data Accuracy (NSSDA) used in the United States, commonly assume the positional error of spatial data is normally distributed. This research has characterized the distribution of the positional error in four types of spatial data: GPS locations, street geocoding, TIGER roads, and LIDAR elevation data. The positional error in GPS locations can be approximated with a Rayleigh distribution, the positional error in street geocoding and TIGER roads can be approximated with a log-normal distribution, and the positional error in LIDAR elevation data can be approximated with a normal distribution of the original vertical error values after removal of a small number of outliers. For all four data types considered, however, these solutions are only approximations, and some evidence of non-stationary behavior resulting in lack of normality was observed in all four datasets. Monte-Carlo simulation of the robustness of accuracy statistics revealed that the conventional 100% Root Mean Square Error (RMSE) statistic is not reliable for non-normal distributions. Some degree of data trimming is recommended through the use of 90% and 95% RMSE statistics. Percentiles, however, are not very robust as single positional accuracy statistics. The non-normal distribution of positional errors in spatial data has implications for spatial data accuracy standards and error propagation modeling. Specific recommendations are formulated for revisions of the NSSDA. |
| [33] | |
| [34] | . |
| [35] | . Large errors in flu prediction were largely avoidable, which offers lessons for the use of big data. In February 2013, Google Flu Trends (GFT) made headlines but not for a reason that Google executives or the creators of the flu tracking system would have hoped. Nature reported that GFT was predicting more than double the proportion of doctor visits for influenza-like illness (ILI) than the Centers for Disease Control and Prevention (CDC), which bases its estimates on surveillance reports from laboratories across the United States ( 1, 2). This happened despite the fact that GFT was built to predict CDC reports. Given that GFT is often held up as an exemplary use of big data ( 3, 4), what lessons can we draw from this error? |
| [36] | . Knowledge Discovery in Databases creates the context for developing the tools needed to control the flood of data facing organizations that depend on ever-growing databases of business, manufacturing, scientific and personal information. |
| [37] | . Remote sensing from airborne and spaceborne platforms provides valuable data for mapping, environmental monitoring, disaster management and civil and military intelligence. However, to explore the full value of these data, the appropriate information has to be extracted and presented in standard format to import it into geo-information systems and thus allow efficient decision processes. The object-oriented approach can contribute to powerful automatic and semi-automatic analysis for most remote sensing applications. Synergetic use to pixel-based or statistical signal processing methods explores the rich information contents. Here, we explain principal strategies of object-oriented analysis, discuss how the combination with fuzzy methods allows implementing expert knowledge and describe a representative example for the proposed workflow from remote sensing imagery to GIS. The strategies are demonstrated using the first object-oriented image analysis software on the market, eCognition, which provides an appropriate link between remote sensing imagery and GIS. |
| [38] | . |
| [39] | . 信息和通信技术ICTs(Information and Communication Technologies)的发展,使空间形态发生了或正在发生隐性变化,表现为由地理空间向地理网络空间转换.地理网络空间的外在表现即是流空间,它是信息社会占支配地位的空间形态,为地理学研究提供新视角.该文基于流空间的形成机制,流空间与地理网络空间、位空间的关系和流空间的发展对地理科学的影响,对流空间的基本性质予以地理学透视. . 信息和通信技术ICTs(Information and Communication Technologies)的发展,使空间形态发生了或正在发生隐性变化,表现为由地理空间向地理网络空间转换.地理网络空间的外在表现即是流空间,它是信息社会占支配地位的空间形态,为地理学研究提供新视角.该文基于流空间的形成机制,流空间与地理网络空间、位空间的关系和流空间的发展对地理科学的影响,对流空间的基本性质予以地理学透视. |
| [40] | . 地理表达是地理学的一个基本问题,也是地理信息科学研究面临的一个重大挑战。从地理表达机理、内容和形式的角度,对近期地理表达研究进行了总结。本质上,地理表达是一个空间认知、信息转换与信息传输的交互过程。地理表达内容涉及地理实体及其空间关系、不确定性、地理动态及地理本体等方面。地理表达形式经历了从自然语言、地图到GIS的演变过程;近年出现了多种新型表达形式,如虚拟地理环境、地理增强现实、地理超媒体等;并分析了当前地理表达的局限性。最后,从发展新的时空过程表达方法、地理表达形式的选择与协同问题等方面对地理表达的研究拓展进行了讨论,并根据UCGIS的研究计划,从表达理论、表达方法以及计算支持的角度,对地理表达研究目标进行了展望。 . 地理表达是地理学的一个基本问题,也是地理信息科学研究面临的一个重大挑战。从地理表达机理、内容和形式的角度,对近期地理表达研究进行了总结。本质上,地理表达是一个空间认知、信息转换与信息传输的交互过程。地理表达内容涉及地理实体及其空间关系、不确定性、地理动态及地理本体等方面。地理表达形式经历了从自然语言、地图到GIS的演变过程;近年出现了多种新型表达形式,如虚拟地理环境、地理增强现实、地理超媒体等;并分析了当前地理表达的局限性。最后,从发展新的时空过程表达方法、地理表达形式的选择与协同问题等方面对地理表达的研究拓展进行了讨论,并根据UCGIS的研究计划,从表达理论、表达方法以及计算支持的角度,对地理表达研究目标进行了展望。 |
| [41] | . The “space of flows,” the concept I advocated a decade ago, represents the material arrangements that allow for simultaneity of social practices without territorial contiguity. In this article, I refer to a series of dimensions of autonomous expression of social meaning in the space of flows, with emphasis on electronic spaces, but in interaction with the space of places. I argue that a new dynamics is operating, a dynamics of interpenetration of uniformity and autonomy, of domination and resistance, and of instrumentality and experience, within the space of flows. The geography of the new history will not be made of the separation between places and flows, but out of the interface between places and flows and between cultures and social interests, both in the space of flows and in the space of places. |
| [42] | . Geographic representation has become more complex through time as researchers have added new concepts, leading to apparently endless proliferation and creating a need for simplification. We show that many of these concepts can be derived from a single foundation that we term the atomic form of geographic information. The familiar concepts of continuous fields and discrete objects can be derived under suitable rules applied to the properties and values of the atomic form. Fields and objects are further integrated through the concept of phase space, and in the form of field objects. A second atomic concept is introduced, termed the geo‐dipole, and shown to provide a foundation for object fields, metamaps, and the association classes of object‐oriented data modelling. Geographic dynamics are synthesized in a three‐dimensional space defined by static or dynamic object shape, the possibility of movement, and the possibility of dynamic internal structure. The atomic form also provides a tentative argument that discrete objects and continuous fields are the only possible bases for geographic representation. |
| [43] | |
| [44] | . react-text: 589 The notion of a cartogram is reviewed. Then, based on a presentation from the 1960s, a direct and simple introduction is given to the design of a computer algorithm for the construction of contiguous value-by-area cartograms. As an example, a table of latitude/longitude to rectangular plane coordinates is included for a cartogram of the United States, along with Tissot's measures for this map... /react-text react-text: 590 /react-text [Show full abstract] |
| [45] | . My contribution to the session at the New Orleans meetings of the Assocation of American Geographers at which the ideas that appear in this forum were initially aired was as discussant, following the three main presentations by Barnes, Miller, and Smith. This paper expands on the comments I made during the session, and include reactions to |
| [46] | . Automobile exhaust can bring about Pb pollution to soils and trees along expressway,which can be decreased by green belts to some extent.However,fewer reports are available on this subject.The Pb concentration of soil and tree leaf sampled from roadside were measured and present situation of Pb pollution along expressways in Shandong province was studied.Also,the Pb attenuation by green belt was evaluated for different afforestation mode.The results showed that the pollution existed in roadside soil along expressway,which mainly within 50 m.The positive correlation was found between Pb pollution and traffic vehicle density,which might be used to indicate expressway pollution.The Pb concentration of tree leaf from inner side of green belt was increased by Pb pollution.Large traffic vehicle density resulted in heavier Pb pollution on green trees along expressway.The Pb attenuation by green belt varied much depending on afforestation mode.Green belt with too big width was not ideal to decrease Pb pollution. . Automobile exhaust can bring about Pb pollution to soils and trees along expressway,which can be decreased by green belts to some extent.However,fewer reports are available on this subject.The Pb concentration of soil and tree leaf sampled from roadside were measured and present situation of Pb pollution along expressways in Shandong province was studied.Also,the Pb attenuation by green belt was evaluated for different afforestation mode.The results showed that the pollution existed in roadside soil along expressway,which mainly within 50 m.The positive correlation was found between Pb pollution and traffic vehicle density,which might be used to indicate expressway pollution.The Pb concentration of tree leaf from inner side of green belt was increased by Pb pollution.Large traffic vehicle density resulted in heavier Pb pollution on green trees along expressway.The Pb attenuation by green belt varied much depending on afforestation mode.Green belt with too big width was not ideal to decrease Pb pollution. |
| [47] | . 抢劫和入室盗窃犯罪行为是日常生活中最长见的违法行为,而这两种违法行为的发生有一定的规律可循。例如抢劫行为主要发生在市中心、CBD和商业中心的人群、商铺密集区域,而入室盗窃则多发生于生活社区及其周边地带。然而,想要防范这两种犯罪行为需要根据实际情况进行分析和比对,结合分析结果提出准确合理的警力部署。美国内布拉斯加州林肯市警察局针对该市抢劫和入室盗窃犯罪行为高发的情况,需要针对具体分析结果对于警力进行部署,主要针对徒步巡逻和是否需要对住户进行入户警示进行分析,根据分析结果进行具体部署。本文中使用的分析方法为紧邻层空间聚类分析(NNH)和针对犯罪的空间和时间分析法(SPAC),分别对林肯市入室行窃和抢劫的数据进行分析并尝试将两种方法进行对比以便给出更加科学的分析报告。 . 抢劫和入室盗窃犯罪行为是日常生活中最长见的违法行为,而这两种违法行为的发生有一定的规律可循。例如抢劫行为主要发生在市中心、CBD和商业中心的人群、商铺密集区域,而入室盗窃则多发生于生活社区及其周边地带。然而,想要防范这两种犯罪行为需要根据实际情况进行分析和比对,结合分析结果提出准确合理的警力部署。美国内布拉斯加州林肯市警察局针对该市抢劫和入室盗窃犯罪行为高发的情况,需要针对具体分析结果对于警力进行部署,主要针对徒步巡逻和是否需要对住户进行入户警示进行分析,根据分析结果进行具体部署。本文中使用的分析方法为紧邻层空间聚类分析(NNH)和针对犯罪的空间和时间分析法(SPAC),分别对林肯市入室行窃和抢劫的数据进行分析并尝试将两种方法进行对比以便给出更加科学的分析报告。 |
| [48] | . 大数据之风自2010年席卷全球,已在科学、工程和社会等领域产生深远影响.本文首先从地理大数据、第四范式以及非线性复杂地理系统3组基本概念出发,剖析上述3组概念之间的科学联系与相互支撑作用,提出大数据和第四范式为地理复杂性研究提供新机遇.其后,探讨如何利用大数据和复杂性科学的理论方法开展地理复杂性研究.基于地理大数据,可以通过统计物理学的系列指标描述现实地理世界的复杂非线性特征,同时,还可利用深度学习、复杂网络、多智能体等方法,实现复杂非线性地理系统的推演和模拟.上述方法对认知地理现象和过程的复杂性,对复杂地理系统的分析、模拟、反演与预测有重要作用.最后,提出地理大数据和复杂性科学相互支撑可能成为21世纪地理学的主流科学方法. . 大数据之风自2010年席卷全球,已在科学、工程和社会等领域产生深远影响.本文首先从地理大数据、第四范式以及非线性复杂地理系统3组基本概念出发,剖析上述3组概念之间的科学联系与相互支撑作用,提出大数据和第四范式为地理复杂性研究提供新机遇.其后,探讨如何利用大数据和复杂性科学的理论方法开展地理复杂性研究.基于地理大数据,可以通过统计物理学的系列指标描述现实地理世界的复杂非线性特征,同时,还可利用深度学习、复杂网络、多智能体等方法,实现复杂非线性地理系统的推演和模拟.上述方法对认知地理现象和过程的复杂性,对复杂地理系统的分析、模拟、反演与预测有重要作用.最后,提出地理大数据和复杂性科学相互支撑可能成为21世纪地理学的主流科学方法. |
| [49] | . This study demonstrates estimations of economic activities on global, national, and subnational levels using remote sensing data, with a focus on developing economies. It extends a recent statistical framework which uses nighttime lights to estimate official income growth by accounting for agriculture and forestry which emit less or no additional observable nighttime light. The study argues that nighttime lights alone may not explain value-added by agriculture and forestry. By adding land cover data, our framework can be used to estimate economic growth in administrative areas of virtually any size. |
| [50] | . Land-use classification is essential for urban planning. Urban land-use types can be differentiated either by their physical characteristics (such as reflectivity and texture) or social functions. Remote sensing techniques have been recognized as a vital method for urban land-use classification because of their ability to capture the physical characteristics of land use. Although significant progress has been achieved in remote sensing methods designed for urban land-use classification, most techniques focus on physical characteristics, whereas knowledge of social functions is not adequately used. Owing to the wide usage of mobile phones, the activities of residents, which can be retrieved from the mobile phone data, can be determined in order to indicate the social function of land use. This could bring about the opportunity to derive land-use information from mobile phone data. To verify the application of this new data source to urban land-use classification, we first construct a vector of aggregated mobile phone data to characterize land-use types. This vector is composed of two aspects: the normalized hourly call volume and the total call volume. A semi-supervised fuzzy c-means clustering approach is then applied to infer the land-use types. The method is validated using mobile phone data collected in Singapore. Land use is determined with a detection rate of 58.03%. An analysis of the land-use classification results shows that the detection rate decreases as the heterogeneity of land use increases, and increases as the density of cell phone towers increases. |
| [51] | . 中国科学院机构知识库(CAS IR GRID)以发展机构知识能力和知识管理能力为目标,快速实现对本机构知识资产的收集、长期保存、合理传播利用,积极建设对知识内容进行捕获、转化、传播、利用和审计的能力,逐步建设包括知识内容分析、关系分析和能力审计在内的知识服务能力,开展综合知识管理。 |
| [52] | . 栅格计算因其具有简单的构架成为目前地学分析的主流模型,然而,由于栅格计算平均分配计算和存储资源的弱点,不仅容易产生冗余,更重要的是难以凸显研究对象的突变部分,从而使研究者有可能忽略地学现象的变化特征。为此,本文提出将时空点过程模型应用于地学研究。时空点过程不仅适用于模拟以点事件为基本单元的地学现象,而且由于大多数地学过程可以转化为时空点过程,故其具有更广泛的应用范围。因此,时空点过程不仅是一种数据模型,同时也是地学问题的分析方法,更是观察和理解地学问题的一种新视角。为了实现从点过程数据中提取模式,作者经过多年研究提出了时空点过程层次分解理论框架,该理论与信号处理理论中的谱分析思路类似,首先,假设任意点集为有限多个均匀点过程的叠加,然后,通过点局部密度表达工具K阶邻近距离,将空间点转换为混合概率密度函数,再应用优化方法将混合密度函数进行分解得到丛集点和噪声,最终利用密度相连原理从丛集点中提取模式。该理论框架可适用于绝大多数点集数据,初步实现了点集数据的“傅里叶变换”。 . 栅格计算因其具有简单的构架成为目前地学分析的主流模型,然而,由于栅格计算平均分配计算和存储资源的弱点,不仅容易产生冗余,更重要的是难以凸显研究对象的突变部分,从而使研究者有可能忽略地学现象的变化特征。为此,本文提出将时空点过程模型应用于地学研究。时空点过程不仅适用于模拟以点事件为基本单元的地学现象,而且由于大多数地学过程可以转化为时空点过程,故其具有更广泛的应用范围。因此,时空点过程不仅是一种数据模型,同时也是地学问题的分析方法,更是观察和理解地学问题的一种新视角。为了实现从点过程数据中提取模式,作者经过多年研究提出了时空点过程层次分解理论框架,该理论与信号处理理论中的谱分析思路类似,首先,假设任意点集为有限多个均匀点过程的叠加,然后,通过点局部密度表达工具K阶邻近距离,将空间点转换为混合概率密度函数,再应用优化方法将混合密度函数进行分解得到丛集点和噪声,最终利用密度相连原理从丛集点中提取模式。该理论框架可适用于绝大多数点集数据,初步实现了点集数据的“傅里叶变换”。 |
| [53] | . |
| [54] | . |
| [55] | . <p>随着现代科技和传感器的发展和应用,复杂多变的空间数据日益膨胀,远远超出了人的解译能力,迫切需要数据挖掘和知识发现为其提供知识。本文研究了空间数据挖掘和知识发现的含义、可发现的空间的关联、特征、分类和聚类等知识,以及它与数据挖掘和知识发现、机器学习、地学数据分析、空间数据库、空间数据仓库、数字地球等相关学科的关系,概述了SDMKD的产生和发展,分析和展望了SDMKD的应用开发</p> . <p>随着现代科技和传感器的发展和应用,复杂多变的空间数据日益膨胀,远远超出了人的解译能力,迫切需要数据挖掘和知识发现为其提供知识。本文研究了空间数据挖掘和知识发现的含义、可发现的空间的关联、特征、分类和聚类等知识,以及它与数据挖掘和知识发现、机器学习、地学数据分析、空间数据库、空间数据仓库、数字地球等相关学科的关系,概述了SDMKD的产生和发展,分析和展望了SDMKD的应用开发</p> |
| [56] | . <p>首先分析了空间数据挖掘和知识发现(SDMKD)的内涵和外延;然后分别研究了用于SDMKD的概率论、证据理论、空间统计学、规则归纳、聚类分析、空间分析、模糊集、云理论、粗集、神经网络、遗传算法、可视化、决策树、空间在线数据挖掘等理论和方法及其进展;最后展望了SDMKD的发展前景。</p> . <p>首先分析了空间数据挖掘和知识发现(SDMKD)的内涵和外延;然后分别研究了用于SDMKD的概率论、证据理论、空间统计学、规则归纳、聚类分析、空间分析、模糊集、云理论、粗集、神经网络、遗传算法、可视化、决策树、空间在线数据挖掘等理论和方法及其进展;最后展望了SDMKD的发展前景。</p> |
| [57] | . Abstract ining information and knowledge from large databases has been recognized by many researchers as a key research topic in database systems and machine learning, and by many industrial companies as an important area with an opportunity of major revenues. Researchers in many different fields have shown great interest in data mining. Several emerging applications in information providing services, such as data warehousing and on-line services over the Internet, also call for various data mining techniques to better understand user behavior, to improve the service provided, and to increase the business opportunities. In response to such a demand, this article is to provide a survey, from a database researcher's point of view, on the data mining techniques developed recently. A classification of the available data mining techniques is provided, and a comparative study of such techniques is presented. |
| [58] | . |
| [59] | . 空间数据具有海量、非线性、多尺度、高维和模糊性等复杂性特点,空间数据挖掘技术是对空间数据中非显性的知识、空间关系等模式的自动提取.该文从空间数据挖掘的知识类型、方法、体系结构、过程以及与GIS系统集成等方面对其进行综述.重点阐述空间特征及区分规则、空间分类及聚类规则、空间分布及关联规则、空间序列及演化规则等知识类型以及统计分析、机器学习、探索性数据分析、可视化分析等数据挖掘方法.通过对空间数据挖掘理论、应用和系统实现等方面研究方向、存在问题的分析,指出集数据库、知识库、专家系统、决策支持系统、可视化工具、网络等技术于一体的空间数据挖掘系统是其主要发展方向. . 空间数据具有海量、非线性、多尺度、高维和模糊性等复杂性特点,空间数据挖掘技术是对空间数据中非显性的知识、空间关系等模式的自动提取.该文从空间数据挖掘的知识类型、方法、体系结构、过程以及与GIS系统集成等方面对其进行综述.重点阐述空间特征及区分规则、空间分类及聚类规则、空间分布及关联规则、空间序列及演化规则等知识类型以及统计分析、机器学习、探索性数据分析、可视化分析等数据挖掘方法.通过对空间数据挖掘理论、应用和系统实现等方面研究方向、存在问题的分析,指出集数据库、知识库、专家系统、决策支持系统、可视化工具、网络等技术于一体的空间数据挖掘系统是其主要发展方向. |
| [60] | |
| [61] | . |
| [62] | |
| [63] | . Decision tree classification algorithms have significant potential for land cover mapping problems and have not been tested in detail by the remote sensing community relative to more conventional pattern recognition techniques such as maximum likelihood classification. In this paper, we present several types of decision tree classification algorithms and evaluate them on three different remote sensing data sets. The decision tree classification algorithms tested include an univariate decision tree, a multivariate decision tree, and a hybrid decision tree capable of including several different types of classification algorithms within a single decision tree structure. Classification accuracies produced by each of these decision tree algorithms are compared with both maximum likelihood and linear discriminant function classifiers. Results from this analysis show that the decision tree algorithms consistently outperform the maximum likelihood and linear discriminant function classifiers in regard to classification accuracy. In particular, the hybrid tree consistently produced the highest classification accuracies for the data sets tested. More generally, the results from this work show that decision trees have several advantages for remote sensing applications by virtue of their relatively simple, explicit, and intuitive classification structure. Further, decision tree algorithms are strictly nonparametric and, therefore, make no assumptions regarding the distribution of input data, and are flexible and robust with respect to nonlinear and noisy relations among input features and class labels. |
| [64] | . Given a collection of Boolean spatial features, the colocation pattern discovery process finds the subsets of features frequently located together. For example, the analysis of an ecology data set may reveal symbiotic species. The spatial colocation rule problem is different from the association rule problem since there is no natural notion of transactions in spatial data sets which are embedded in continuous geographic space. We provide a transaction-free approach to mine colocation patterns by using the concept of proximity neighborhood. A new interest measure, a participation index, is also proposed for spatial colocation patterns. The participation index is used as the measure of prevalence of a colocation for two reasons. First, this measure is closely related to the cross-K function, which is often used as a statistical measure of interaction among pairs of spatial features. Second, it also possesses an antimonotone property which can be exploited for computational efficiency. Furthermore, we design an algorithm to discover colocation patterns. This algorithm includes a novel multiresolution pruning technique. Finally, experimental results are provided to show the strength of the algorithm and design decisions related to performance tuning. |
| [65] | |
| [66] | . Two four-channel Landsat scenes of the same area, which were recorded on different dates, were superimposed and treated as a single eight-dimensional (channel) data array. Principal component analysis (PCA) of this array resulted in the gross differences associated with overall radiation and atmospheric changes appearing in the major component images and statistically minor changes associated with local changes in land cover appearing in the minor component images. |
| [67] | . Abstract Understanding the genetic structure of human populations is of fundamental interest to medical, forensic and anthropological sciences. Advances in high-throughput genotyping technology have markedly improved our understanding of global patterns of human genetic variation and suggest the potential to use large samples to uncover variation among closely spaced populations. Here we characterize genetic variation in a sample of 3,000 European individuals genotyped at over half a million variable DNA sites in the human genome. Despite low average levels of genetic differentiation among Europeans, we find a close correspondence between genetic and geographic distances; indeed, a geographical map of Europe arises naturally as an efficient two-dimensional summary of genetic variation in Europeans. The results emphasize that when mapping the genetic basis of a disease phenotype, spurious associations can arise if genetic structure is not properly accounted for. In addition, the results are relevant to the prospects of genetic ancestry testing; an individual's DNA can be used to infer their geographic origin with surprising accuracy-often to within a few hundred kilometres. |
| [68] | . Many of the most interesting questions ecologists ask lead to analyses of spatial data. Yet, perhaps confused by the large number of statistical models and fitting methods available, many ecologists seem to believe this is best left to specialists. Here, we describe the issues that need consideration when analysing spatial data and illustrate these using simulation studies. Our comparative analysis involves using methods including generalized least squares, spatial filters, wavelet revised models, conditional autoregressive models and generalized additive mixed models to estimate regression coefficients from synthetic but realistic data sets, including some which violate standard regression assumptions. We assess the performance of each method using two measures and using statistical error rates for model selection. Methods that performed well included generalized least squares family of models and a Bayesian implementation of the conditional auto-regressive model. Ordinary least squares also performed adequately in the absence of model selection, but had poorly controlled Type I error rates and so did not show the improvements in performance under model selection when using the above methods. Removing large-scale spatial trends in the response led to poor performance. These are empirical results; hence extrapolation of these findings to other situations should be performed cautiously. Nevertheless, our simulation-based approach provides much stronger evidence for comparative analysis than assessments based on single or small numbers of data sets, and should be considered a necessary foundation for statements of this type in future. |
| [69] | . No abstract is available for this item. |
| [70] | . Over the past decade there have been considerable increases in both the quantity of remotely sensed data available and the use of neural networks. These increases have largely taken place in parallel, and it is only recently that several researchers have begun to apply neural networks to remotely sensed data. This paper introduces this special issue which is concerned specifically with the use of neural networks in remote sensing. The feed-forward back-propagation multi-layer perceptron (MLP) is the type of neural network most commonly encountered in remote sensing and is used in many of the papers in this special issue. The basic structure of the MLP algorithm is described in some detail while some other types of neural network are mentioned. The most common applications of neural networks in remote sensing are considered, particularly those concerned with the classification of land and clouds, and recent developments in these areas are described. Finally, the application of neural networks to multi-source data and fuzzy classification are considered. |
| [71] | . This paper presents a new method to simulate the evolution of multiple land uses based on the integration of neural networks and cellular automata using GIS. Simulation of multiple land use changes using cellular automata (CA) is difficult because numerous spatial variables and parameters have to be utilized. Conventional CA models have problems in defining simulation parameter values, transition rules and model structures. In this paper, a three-layer neural network with multiple output neurons is designed to calculate conversion probabilities for competing multiple land uses. The model involves iterative looping of the neural network to simulate gradual land use conversion processes. Spatial variables are not deterministic because they are dynamically updated at the end of each loop. A GIS is used to obtain site attributes and training data, and to provide spatial functions for constructing the neural network. The parameter values for modelling are automatically generated by the training procedure of neural networks. The model has been successfully applied to the simulation of multiple land use changes in a fast growing area in southern China. |
| [72] | . ABSTRACT Support vector machines (SVM) represent a promising development in machine learning research that is not widely used within the remote sensing community. This paper reports the results of two experiments in which multi-class SVMs are compared with maximum likelihood (ML) and artificial neural network (ANN) methods in terms of classification accuracy. The two land cover classification experiments use multispectral (Landsat-7 ETM+) and hyperspectral (DAIS) data, respectively, for test areas in eastern England and central Spain. Our results show that the SVM achieves a higher level of classification accuracy than either the ML or the ANN classifier, and that the SVM can be used with small training datasets and high-dimensional data. |
| [73] | . The increasing interest in Support Vector Machines (SVMs) over the past 15 years is described. Methods are illustrated using simulated case studies, and 4 experimental case studies, namely mass spectrometry for studying pollution, near infrared analysis of food, thermal analysis of polymers and UV/visible spectroscopy of polyaromatic hydrocarbons. The basis of SVMs as two-class classifiers is shown with extensive visualisation, including learning machines, kernels and penalty functions. The influence of the penalty error and radial basis function radius on the model is illustrated. Multiclass implementations including onevs.all, onevs.one, fuzzy rules and Directed Acyclic Graph (DAG) trees are described. One-class Support Vector Domain Description (SVDD) is described and contrasted to conventional two- or multi-class classifiers. The use of Support Vector Regression (SVR) is illustrated including its application to multivariate calibration, and why it is useful when there are outliers and non-linearities. |
| [74] | . Random Forests are considered for classification of multisource remote sensing and geographic data. Various ensemble classification methods have been proposed in recent years. These methods have been proven to improve classification accuracy considerably. The most widely used ensemble methods are boosting and bagging. Boosting is based on sample re-weighting but bagging uses bootstrapping. The Random Forest classifier uses bagging, or bootstrap aggregating, to form an ensemble of classification and regression tree (CART)-like classifiers. In addition, it searches only a random subset of the variables for a split at each CART node, in order to minimize the correlation between the classifiers in the ensemble. This method is not sensitive to noise or overtraining, as the resampling is not based on weighting. Furthermore, it is computationally much lighter than methods based on boosting and somewhat lighter than simple bagging. In the paper, the use of the Random Forest classifier for land cover classification is explored. We compare the accuracy of the Random Forest classifier to other better-known ensemble methods on multisource remote sensing and geographic data. |
| [75] | . The saturation problem associated with the use of NDVI for biomass estimation in high canopy density vegetation is a well known phenomenon. Recent field spectroscopy experiments have shown that narrow band vegetation indices computed from the red edge and the NIR shoulder can improve the estimation of biomass in such situations. However, the wide scale unavailability of high spectral resolution satellite sensors with red edge bands has not seen the up-scaling of these techniques to spaceborne remote sensing of high density biomass. This paper explored the possibility of estimate biomass in a densely vegetated wetland area using normalized difference vegetation index (NDVI) computed from WorldView-2 imagery, which contains a red edge band centred at 725nm. NDVI was calculated from all possible two band combinations of WorldView-2. Subsequently, we utilized the random forest regression algorithm as variable selection and a regression method for predicting wetland biomass. The performance of random forest regression in predicting biomass was then compared against the widely used stepwise multiple linear regression. Predicting biomass on an independent test data set using the random forest algorithm and 3 NDVIs computed from the red edge and NIR bands yielded a root mean square error of prediction (RMSEP) of 0.441kg/m2 (12.9% of observed mean biomass) as compared to the stepwise multiple linear regression that produced an RMSEP of 0.5465kg/m2 (15.9% of observed mean biomass). The results demonstrate the utility of WorldView-2 imagery and random forest regression in estimating and ultimately mapping vegetation biomass at high density a previously challenging task with broad band satellite sensors. |
| [76] | . |
| [77] | . |
| [78] | . |
| [79] | . http://ieeexplore.ieee.org/lpdocs/epic03/wrapper.htm?arnumber=6025355 |
| [80] | . When planning routes, drivers usually consider a multitude of different travel costs, e.g., distances, travel times, and fuel consumption. Different drivers may choose different routes between the same source and destination because they may have different driving preferences (e.g., time-efficient driving v.s. fuel-efficient driving). However, existing routing services support little in modeling multiple travel costs and personalization hey usually deliver the same routes that minimize a single travel cost (e.g., the shortest routes or the fastest routes) to all drivers. We study the problem of how to recommend personalized routes to individual drivers using big trajectory data. First, we provide techniques capable of modeling and updating different drivers' driving preferences from the drivers' trajectories while considering multiple travel costs. To recommend personalized routes, we provide techniques that enable efficient selection of a subset of trajectories from all trajectories according to a driver's preference and the source, destination, and departure time specified by the driver. Next, we provide techniques that enable the construction of a small graph with appropriate edge weights reflecting how the driver would like to use the edges based on the selected trajectories. Finally, we recommend the shortest route in the small graph as the personalized route to the driver. Empirical studies with a large, real trajectory data set from 52,211 taxis in Beijing offer insight into the design properties of the proposed techniques and suggest that they are efficient and effective. |
| [81] | . |
