 , 潘中哲, 徐勇
Mixing spatial-temporal transmission patterns of metropolis dengue fever: A case study of Guangzhou, China
TAOHaiyan, PANZhongzhe, XUYong通讯作者:
收稿日期:2016-02-17
修回日期:2016-06-10
网络出版日期:2016-11-25
版权声明:2016《地理学报》编辑部本文是开放获取期刊文献,在以下情况下可以自由使用:学术研究、学术交流、科研教学等,但不允许用于商业目的.
基金资助:
作者简介:
-->
展开
摘要
关键词:
Abstract
Keywords:
-->0
PDF (2747KB)元数据多维度评价相关文章收藏文章
本文引用格式导出EndNoteRisBibtex收藏本文-->
1 引言
登革热(dengue fever, DF)是热带、亚热带流行的一种虫媒传染病,多发生在城市地区,全世界有128个国家约39.7亿人面临登革热病毒的感染风险[1],每年约有3.9亿例登革热感染者,其中9600万出现不同程度的临床症状[2]。随着各国城市化进程加快,现代大都市巨量的人口、高效而密集的交通网络、复杂的居住分异模式、多样的自然地理环境,使得城市中登革热爆发的频度和强度越来越高,并呈现出不同以往的传播特征。由于目前尚无特效的治疗药物和疫苗,避免人—蚊直接接触[3]、控制传染源、切断传播途径是登革热防控的主要策略。随着地理学在公共健康领域研究的发展,其以独特的地理学视角,揭示了登革热的传播受地理环境[4-6]、气象条件[7-10]和城市化[11-16]影响,其时空分布具有显著的区域特征。Morrison等[17]通过对Florida的Puerto Rico 1991-1992年病例数据的时空分析,发现短时间内(3天内)呈现显著的家庭式集聚;Trans等[18]对法属圭亚那2001年确诊病例的研究发现,登革热病例主要聚集在100 m范围。这些研究充分说明了控制局部传播的必要性和有效性。Rotela等[19]对阿根廷北部塔塔卡尔市2004年487例登革热数据的分析发现除了100 m内1天之内的集聚,在500~2800 m空间尺度上1~3天和12~15天内还存在两个显著的时空集聚;Estallo等[20]对阿根廷第二大城市科尔多瓦2009年病例时空分布的研究,也发现了在4~24天时间尺度上和2.4~12 km空间尺度上存在多个集聚;Kan等[21]研究发现高雄市2001-2003年登革热,早期的传播主要是连续传播,由初始的集聚中心向邻域的连续扩散传播;数周后出现扩散传播,即由集聚中心向相距一定距离的其他区域跳跃式传播。由于蚊子的飞行距离有限[22],在城市内引发大面积爆发的原因除了局部环境因素外,人们日常移动是登革热在城市内大范围扩散传播的重要因素之一[4, 23-24]。
网络科学给传染病传播动力学研究带来了变革。20世纪80年代中期,个体之间(individual-based)接触传播网络模型成功用于HIV传播机制的研究[25-26]。复合群体(metapopulation)网络模型成功用于SARS[27-28]、H1N1等[29-30]新型传染病传播的理论分析、爆发预测与防控策略的研究。在实际应用中,基于个体的网络模型,由于流行病学追踪调查耗时耗力,且接触程度难以定量化表示,建立大规模的传播网络非常困难;复合群体网络模型,更适合研究大尺度具有空间异质性的跨地区传播问题[29]。因此,利用精细化的病例数据,通过病例点对之间的时空交互关系,构建传染病时空传播网络模型,为虫媒传染病传播研究提供一种新的方法和途径。
登革热作为国家法定的乙类传染病,网络直报系统中的病例包含发病时间和居住位置信息,为传染病时空传播网络模型建立提供了精细化病例数据。Knox检验方法[31],一种优雅的数学统计方法[32],用于检验病例之间的时空交互,即空间邻近的病例时间也邻近。据此,本文提出了一种新的时空传播网络建模方法,以确诊病例中发生时空交互的病例点对为边,构成时空传播网络,研究登革热传播的时空特征和规律。
2 研究区域与数据来源
2.1 研究区域
广州市位于东经112°57′~114°3′,北纬22°26′~23°56′。全年平均气温在21.5~22.2℃之间,平均年降水量在1800多mm。广州的地理位置及气象条件较适合于登革热病毒的生存和繁殖。本研究以广州白云区、海珠区、黄埔区、荔湾区、萝岗区、天河区、越秀区作为研究区域(图1)。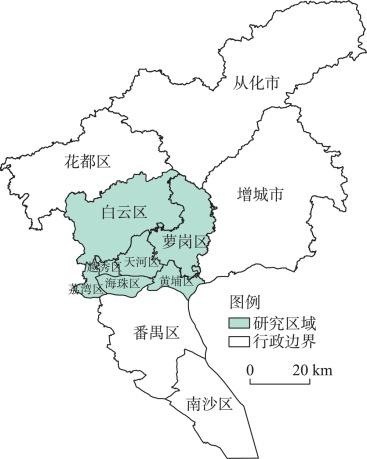 显示原图|下载原图ZIP|生成PPT
图1研究区域
-->Fig. 1Study area: Guangzhou, China
-->
2.2 登革热病例数据
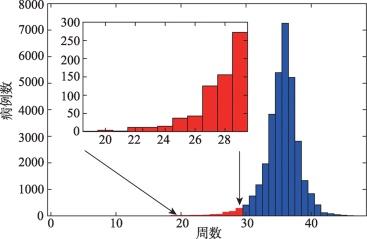
登革热作为国家法定的乙类传染病,要求首诊医师发现登革热病人或者疑似病人后应该在24小时内填写传染病报告卡,其中包括年龄、性别、家庭住址、确诊时间等基本信息。广东省疾病预防控制中心开发的基于GIS的病例收集应用系统,标注了每个病例的发病时间和地理位置,为本文提供了高品质的病例数据。2014年广州市爆发了大规模的登革热疫情,是数十年来最严重的一次疫情,中心城区共报告登革热病例32367例,占全市所有病例的86.58%。从第一例病例(1月26日)到最后一例病例(12月21日),共持续了48周(图2)。在开始的几周,登革热呈现散发现象,至第20周病例数开始呈现持续缓慢增加的趋势,从31周开始病例数急剧上升,37周时达到峰值;然后开始快速下降,直到48周出现最后3例病例。
 显示原图|下载原图ZIP|生成PPT
图22014年登革热病例时序图
-->Fig. 2Temporal progression of Dengue Fevercases of the outbreak in 2014
-->
研究早期疫情的发源地、时空传播特征,才能建立有效防控措施,减少疫情对社会秩序的影响,降低疫情带来的经济损失,因此本研究采用20~30周共计679病例数据作为研究对象(图2)。
3 研究方法
本文提出基于扩展Knox检验的疾病时空传播网络建模方法。运用该方法构建的网络是简单的无权无向图,且覆盖绝大多数病例,可保证节点之间是时空强关联关系。运用复杂网络理论和方法,分析登革热时空传播网络特征,识别登革热爆发中心和扩散中枢的空间分布和特征。3.1 扩展Knox检测
Knox检测[31-32]是传染病时空交互研究中最常用的一种统计方法,用来判定空间距离相邻的两个病例其发生时间也接近,反之亦然。该方法常用于探测传染病病例之间时空距离分布,对原因不明和机理复杂的疾病可以“诊断”具有传播特征的时空距离,因此对传染病早期预警有一定作用。假如有n个病例,Knox方法需要构建两个n×n的两两病例的邻近矩阵。第一个矩阵定义为空间邻近矩阵:如果i病例与j病例之间的空间距离在一定的阈值范围内,则矩阵元素SDij =1,否则为0;第二个矩阵定义为时间邻近矩阵:如果病例i与病例j之间的发病时间距离在一定的阈值范围内,则矩阵元素TDij =1,否则为0。当i=j时,则矩阵元素为0,那么Knox指数表示为:Knox检验的时间和空间阈值较难设定,因此在实际应用中,Knox扩展了Knox检 验方法[33],在时间维上把研究时段划分为:0~1t, 1t~2t, …, (n-1)t~nt;空间维上把空间距离划分为:0~1d, 1d~2d, …, (m-1)d~md,构成n×m的列联表,利用蒙特卡罗模拟方法[34]探测不同时空单元上是否存在显著地时空交互现象。如果在某个时间和空间标度下存在显著的时空交互,则说明疾病在该时空标度下的扩散传播概率远远大于其他非交互标度。
3.2 时空传播网络建模
时空交互是疾病传播中存在的一个普遍现象。一个感染传染病的人,如果将他置于暴露的人群之中,那么与其在时间上和空间存在交互的人患这种疾病的风险就会大大提高。将这些时空交互的病例点对作为网络的边,构成时空传播网络:式中:
如此构造的时空传播网络可能仅反应特定时段部分病例传播的局部特征。因此,本文定义覆盖系数
式中:
3.3 传播重点区域识别
同配度(同配混合)表示复杂网络中节点与相似节点以某些方式接触的偏好。Newman[35]提出了同配系数的计算方法,并分析了大量的社会网络、计算机网络和生物网络,发现同配度相近的现实网络具有相似的网络行为特征。式中:
针对不同的网络类型,本文对同配网络采用亲近中心度(closeness centrality)标定疾病的爆发中心;对异配网络采用中介中心度(betweenness centrality)标定疾病传播途径中关键节点。
亲近中心表示某节点到其他节点最短路径的平均距离最短,在社会网络中表示信息中心,即信息经过此节点时得到爆发性传播,被传播者都在它的周边。类似地,在疾病传播网络中,假如一个病毒感染者具有很高的亲近中心性,则该病人可以通过直接或者间接的方式将病毒传染给网络中的许多人,就会形成一个以其为爆发中心,并向周边邻域传播形成时空集聚。亲近中心度的量化计算公式[37]如下:
式中:
中介中心表示某节点处于许多节点之间最短路径之上,用来衡量社会网络中起桥接作用的关键节点。同理,在疾病网络中,一个中介中心度高的病例节点表示通过该节点的传播最短路径多,是疾病传播网络中的中枢节点,是需要重点防控的目标。中介中心度计算公式[37-38]:
式中:
4 结果分析
4.1 登革热时空交互识别
在时间尺度上以天为单位,空间尺度上以100 m为单位,对时空单元内病例点对数进行统计(图3)。可见很多的病例点对集聚在1 km、2周以及5~7 km、1周的时空标度下。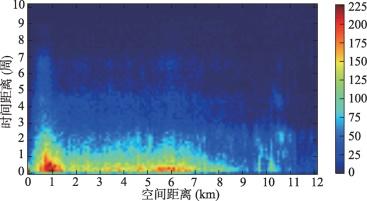 显示原图|下载原图ZIP|生成PPT
图3点对时空距离模式
-->Fig. 3Patterns of pairwise space-time distance
-->
表1中列出了时间距离0~5周,空间距离0~9 km的Knox指数联列表,其中,时间间隔为1周,空间间隔为1 km。
Tab. 1
表1
表1Knox指数联列表
Tab. 1Contingency table of Knox index
| 空间距离 (km) | 时间距离(周) | ||||
|---|---|---|---|---|---|
| [0, 1) | [1, 2) | [2, 3) | [3, 4) | [4, 5) | |
| [0, 1) | 9649* | 6779* | 4229 | 2707* | 2180* |
| [1, 2) | 9322 | 6063 | 3620 | 2244* | 1440 |
| [2, 3) | 8037 | 5118 | 3083 | 1692 | 1319 |
| [3, 4) | 8311 | 5321 | 3141 | 1725 | 1294 |
| [4, 5) | 8421 | 5583 | 3476 | 1653 | 1184 |
| [5, 6) | 9132* | 5720 | 3246 | 1467 | 1173 |
| [6, 7) | 8942* | 5510 | 3070* | 1402 | 1197 |
| [7, 8) | 6502 | 3825 | 2523 | 1019 | 791 |
| [8, 9) | 4789 | 2983 | 2088 | 727 | 618 |
新窗口打开
表1中共有8个单元具有显著的时空交互现象,其中[[0, 2), [0, 1)]以及[[0, 1), [5, 7)]两个区域不仅具有显著的时空交互而且具有大量的病例点对。本研究将2周内、1 km内的病例点对之间的扩散传播称为时空邻近传播(Spatial-Temporal affinity Transmission, STAT);1周内,5~7 km的病例点对之间的扩散传播称为日常移动传播(Human Daily Movement Transmission, HDMT)。虽然登革热不会在人与人之间直接传播,但是,白蚊或者伊蚊叮咬登革热病人或隐性感染者后,病毒在蚊子体内大量复制,它再叮咬其他健康人时,就会将病毒传播给他人,从而导致登革热的时空邻近传播。病例点对空间距离在5~7 km之间出现显著地时空交互现象,这一距离已远远超出了蚊子的飞行距离,揭示了感染者日常移动在病毒扩散中的作用。这两个时空交互区域的发现,说明广州登革热的时空传播属于混合模式,防控重点不仅是新发病例周边的时空邻近传播,还有日常移动传播。
4.2 登革热时空传播网络特征
2014年登革热爆发早期11周内共有679个病例数据,以时空邻近传播病例点对构成的STAT网络共包含631个病例点,覆盖系数为92.93%(图4a);以日常移动传播病例点对构成的HDMT网络共包含659个病例节点,覆盖系数为97.05%(图4b)。覆盖系数均大于90%,即每个新发病例在它周边1 km内2周内或5~7 km 1周内有90%以上概率找到相邻病例,说明由此构建的传播网络可以展现登革热传播的时空传播总体特征。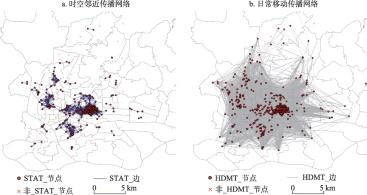 显示原图|下载原图ZIP|生成PPT
图4登革热时空传播网络
-->Fig. 4Networks of DF space-time transmission
-->
进一步计算其同配系数,STAT的同配系数为0.7,属于同质网络;HDMT的同配系数为-0.4,属于异质网络。STAT网络同配,说明一旦一个区域发生伊蚊传播,短期内就会发生向邻域的快速传播,导致每个病例周边都有很多病例出现。HDMT网络异配,说明日常移动传播是异质的,仅部分有特定条件的点成为新的扩散中枢。在爆发早期,这些节点度很高,在它周围5~7 km有许多度较低的节点,形成向外扩散的趋势。
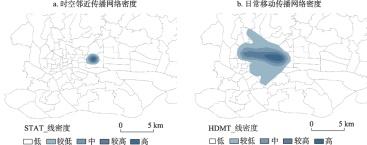
两个网络的线密度(图5)直观地反映了疾病的传播方向。邻近传播网络的线密度在农林街道和东湖街道形成集聚,而日常移动传播网络线密度也是从农林街道和东湖街道为中心向外扩散,并沿着几个主要方向向城市的西面传播。
 显示原图|下载原图ZIP|生成PPT
图5传播网络线密度图
-->Fig. 5Line density of transmission networks
-->
4.3 爆发中心与扩散中枢的位置识别
亲近中心性从整体上衡量了该点到其他所有点的接近程度。在同配网络中,度大的节点相互连接在一起。如果这些节点在空间也呈聚集状态,则这些区位成为高风险区域。将STAT网络中亲近中心性在前20%的节点进行可视化(图6a),可以清楚地看到这些节点在空间上呈现集聚现象,形成一个爆发中心。图6b是对所有研究案例点使用核密度方法得到的疾病爆发中心,两个中心在空间上高度一致,说明了网络分析方法在疾病时空传播研究中的有效性和应用价值。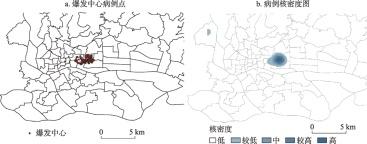 显示原图|下载原图ZIP|生成PPT
图6邻近传播网络中亲近中心性前20%节点空间分布
-->Fig. 6Spatial distribution of nods with top 20% closeness centrality
-->
 显示原图|下载原图ZIP|生成PPT
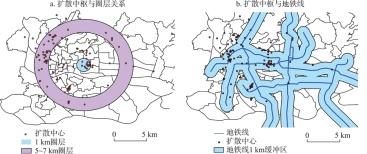
图7日常移动传播网络中枢节点空间分布
-->Fig. 7Spatial distribution of betweenness hub in HDMT transmission network
-->
中介中心度越高的节点表示通过该节点的最短路径越多,是疾病传播网络中越重要的扩散中枢。在异配网络中,消除这些节点就可以切断子网络之间的传播,对疾病控制意义重大。将中介中心度在前20%的节点定义为扩散中枢,共计132个。以爆发中心的质心为圆心分别作1 km、5 km、7 km的缓冲区(图7a),扩散中枢节点在5~7 km圈层中有60个,占总数的45.45%。当把扩散中枢节点图与广州市地铁线图叠置后(图7b),有101个扩散中枢在地铁沿线的1 km缓冲区内,占总数的76.52%。
沿地铁交通线按0.5 km、1.0 km、1.5 km、2.0 km、2.5 km、3.0 km、3.5 km、4.0 km做缓冲区,对应扩散中枢数量分别为65、36、21、4、2、1、2、1,呈现显著的随距离增大而减小的特征。将圈层中心1 km及5~7 km圈层划分为重点区域,距离重点区域1 km的为次要区域,其他为普通区域,区域编码分别为1、2、3,对应扩散中枢数量分别为76、39、21。将地铁缓冲区与圈层做交集,得到中枢数量、地铁缓冲区、区域编码表,应用地理探测器[39-40],检验地铁以及圈层对扩散中枢的影响。结果显示两个因子
5 结论与讨论
本文以广州市2014登革热早期679个病例数据为研究案例,使用扩展Knox时空交互检验方法,发现病例之间在2周内1 km、1周内5~7 km两个时空标度下具有显著的交互现象,说明了登革热传播不仅具有时空邻近传播的特征,同时还具有日常移动传播的特征。并由此分别构建STAT和HDMT两个特征网络,通过传播网络线密度图和网络特征分析,发现在农林街道和东湖街道形成集聚中心,并以此集聚中心向外扩散传播的特征。由网络亲近中心度确定的“爆发中心”与核密度中心基本一致,中介中心度确定的“扩散中枢”与城市快速交通存在关联。本文提出的基于扩展Knox检验疾病时空传播网络模型,可用于城市虫媒传染病的扩散传播研究,并得到如下结论:(1)Knox检验可用于空间异质条件下两个事件的时空关联显著性判定。传统地理学研究中认为时空上相近的事物关联更紧密。但随着城市空间大规模向外扩张,职住分离现象明显,人们日常移动频繁,导致空间上某些并不邻近的区域之间联系紧密,从而成为疾病易于传播的“相邻”区域。现有研究已表明,温度、降雨、人口密度、伊蚊密度、交通路网、土地利用类型,甚至风向都是登革热扩散传播的影响因子,通过建模的方法来判断任意两个区域之间疾病传播的难易程度是非常困难的。利用Knox方法,可以从现有病例数据中发现显著的时空交互区域,疾病在该时空标度内扩散传播的概率远远大于非交互区域。
(2)以时空交互病例点对构建传播网络,不仅数据易于获取,而且很好地揭示登革热集聚与传播特征。作为国家法定的传染病,病例的发病时间和居住地址都是传染病网络直报系统中的基础信息。通过传播网络地图以及线密度图,能直观地反映出登革热的集聚特征与传播方向,丰富了传染病时空规律分析研究的手段。
(3)复杂网络分析技术提升了登革热防控应用研究能力。本研究以疾病防控中时空集聚和传播中的关键病例识别为案例,应用网络分析中的度相关指标不仅能够识别出登革热疫情的“爆发中心”,而且能够标识出早期的“扩散中枢”的空间位置。可以快速掌握疫情动态与传播规律,及时实施有效干预措施,实现登革热的科学防控。
登革热的扩散传播机制非常复杂,研究中发现登革热传播方向并不是均匀的,需要进一步结合伊蚊的生境及其密度,人口密度以及地表等数据,研究其对登革热传播的影响;同时随着信息和通讯技术的发展,城市中大量的传感器,例如全球定位系统GPS、移动通讯GSM、智能卡收费系统数据(Smart Card Data, SCD)等,可以获取大规模的、高质量的个体时空数据,有助于更有效地干预登革热的传播。
The authors have declared that no competing interests exist.
参考文献 原文顺序
文献年度倒序
文中引用次数倒序
被引期刊影响因子
| [1] | |
| [2] | Dengue is a systemic viral infection transmitted between humans by Aedes mosquitoes(1). For some patients, dengue is a life-threatening illness(2). There are currently no licensed vaccines or specific therapeutics, and substantial vector control efforts have not stopped its rapid emergence and global spread(3). The contemporary worldwide distribution of the risk of dengue virus infection(4) and its public health burden are poorly known(2,5). Here we undertake an exhaustive assembly of known records of dengue occurrence worldwide, and use a formal modelling framework to map the global distribution of dengue risk. We then pair the resulting risk map with detailed longitudinal information from dengue cohort studies and population surfaces to infer the public health burden of dengue in 2010. We predict dengue to be ubiquitous throughout the tropics, with local spatial variations in risk influenced strongly by rainfall, temperature and the degree of urbanization. Using cartographic approaches, we estimate there to be 390 million (95% credible interval 284-528) dengue infections per year, of which 96 million (67-136) manifest apparently (any level of disease severity). This infection total is more than three times the dengue burden estimate of the World Health Organization(2). Stratification of our estimates by country allows comparison with national dengue reporting, after taking into account the probability of an apparent infection being formally reported. The most notable differences are discussed. These new risk maps and infection estimates provide novel insights into the global, regional and national public health burden imposed by dengue. We anticipate that they will provide a starting point for a wider discussion about the global impact of this disease and will help to guide improvements in disease control strategies using vaccine, drug and vector control methods, and in their economic evaluation. |
| [3] | . |
| [4] | Commuters who acquire dengue infections could be an important route for the transmission of the virus from their homes to workplaces. Understanding the effects of routine human movement on dengue transmission can be helpful in identifying high-risk areas for effective intervention. This study investigated the effects of local environmental and demographic characteristics to clarify the role of the daily commute in dengue transmission. We analyzed the clustering patterns of space-time distances between commuting and noncommuting dengue cases from June 2007 to January 2008 in Tainan City, Taiwan. We also analyzed the network topology of space-time distances to identify possible key individuals and conducted time-to-event analysis for geographic diffusion through commuting versus noncommuting dengue cases. Our significant findings indicate that most of the space-time distances of noncommuting cases clustered within 100 m and one week, whereas commuting cases clustered within 2 to 4 km and one to five weeks. Analysis of the temporality of the geographical diffusion by villages showed that commuting cases diffuse more rapidly across villages than noncommuting cases in the late epidemic period. The role of commuting was identified as a significant risk factor contributing to epidemic diffusion (hazard ratio: 3.08, p value < 0.05). Local neighborhood characteristics (number of vacant grounds and empty houses) are independent facilitating factors for diffusion through both noncommuting cases and commuting cases (hazard ratio: 1.035 and 1.022, respectively, both p < 0.05). Higher population density is a significant risk factor only for diffusion through commuters (hazard ratio: 1.174). In summary, noncommuters, mostly elderly adults and housewives, might initiate local outbreaks, whereas commuters carrying the virus to geographically distant areas cause large-scale epidemics. |
| [5] | 目的通过分析广州市2002年 登革热疫情数据,采用遥感以及地理信息系统技术标识与登革热(DF)的流行风险相关的地表景观种类。方法首先,通过基于泊松模型的回顾式空间-时间分析方 法获取疫情数据的时空聚集状况。其后,从MODIS卫星图像中提取地表景观信息,并逐月逐区计算各地类所占对应研究区的面积比例。最终,由广义线性模型分 析确定DF病例的存在与否与地表景观种类面积比例的关系,并使用二态逻辑回归分析建立预测模型。结果最有可能的登革热聚集圈中心位于东山区,同时覆盖越秀 区以及荔湾区,其时间窗为8月至10月。最佳预测模型对"某行政区在气候条件允许下是否存在登革热病例"的预测达到了91.1%的准确度。结论开放水域, 以沼泽和湿地为主的湿草场,以水稻为主的农田以及开发用地被标识为与登革热病例存在与否最为相关的地类因子。 . 目的通过分析广州市2002年 登革热疫情数据,采用遥感以及地理信息系统技术标识与登革热(DF)的流行风险相关的地表景观种类。方法首先,通过基于泊松模型的回顾式空间-时间分析方 法获取疫情数据的时空聚集状况。其后,从MODIS卫星图像中提取地表景观信息,并逐月逐区计算各地类所占对应研究区的面积比例。最终,由广义线性模型分 析确定DF病例的存在与否与地表景观种类面积比例的关系,并使用二态逻辑回归分析建立预测模型。结果最有可能的登革热聚集圈中心位于东山区,同时覆盖越秀 区以及荔湾区,其时间窗为8月至10月。最佳预测模型对"某行政区在气候条件允许下是否存在登革热病例"的预测达到了91.1%的准确度。结论开放水域, 以沼泽和湿地为主的湿草场,以水稻为主的农田以及开发用地被标识为与登革热病例存在与否最为相关的地类因子。 |
| [6] | Abstract BACKGROUND: As a result of changes in climatic conditions and greater resistance to insecticides, many regions across the globe, including Colombia, have been facing a resurgence of vector-borne diseases, and dengue fever in particular. Timely information on both (1) the spatial distribution of the disease, and (2) prevailing vulnerabilities of the population are needed to adequately plan targeted preventive intervention. We propose a methodology for the spatial assessment of current socioeconomic vulnerabilities to dengue fever in Cali, a tropical urban environment of Colombia. METHODS: Based on a set of socioeconomic and demographic indicators derived from census data and ancillary geospatial datasets, we develop a spatial approach for both expert-based and purely statistical-based modeling of current vulnerability levels across 340 neighborhoods of the city using a Geographic Information System (GIS). The results of both approaches are comparatively evaluated by means of spatial statistics. A web-based approach is proposed to facilitate the visualization and the dissemination of the output vulnerability index to the community. RESULTS: The statistical and the expert-based modeling approach exhibit a high concordance, globally, and spatially. The expert-based approach indicates a slightly higher vulnerability mean (0.53) and vulnerability median (0.56) across all neighborhoods, compared to the purely statistical approach (mean65=650.48; median65=650.49). Both approaches reveal that high values of vulnerability tend to cluster in the eastern, north-eastern, and western part of the city. These are poor neighborhoods with high percentages of young (i.e., < 1502years) and illiterate residents, as well as a high proportion of individuals being either unemployed or doing housework. CONCLUSIONS: Both modeling approaches reveal similar outputs, indicating that in the absence of local expertise, statistical approaches could be used, with caution. By decomposing identified vulnerability "hotspots" into their underlying factors, our approach provides valuable information on both (1) the location of neighborhoods, and (2) vulnerability factors that should be given priority in the context of targeted intervention strategies. The results support decision makers to allocate resources in a manner that may reduce existing susceptibilities and strengthen resilience, and thus help to reduce the burden of vector-borne diseases. |
| [7] | This paper considers the potential for using seasonal climate forecasts in developing an early warning system for dengue fever epidemics in Brazil. In the first instance, a generalised linear model (GLM) is used to select climate and other covariates which are both readily available and prove significant in prediction of confirmed monthly dengue cases based on data collected across the whole of Brazil for the period January 2001 to December 2008 at the microregion level (typically consisting of one large city and several smaller municipalities). The covariates explored include temperature and precipitation data on a 2.5掳 x 2.5掳 longitude-latitude grid with time lags relevant to dengue transmission, an El Nino Southern Oscillation index and other relevant socio-economic and environmental variables. A negative binomial model formulation is adopted in this model selection to allow for extra-Poisson variation (overdispersion) in the observed dengue counts caused by unknown/unobserved confounding factors and possible correlations in these effects in both time and space. Subsequently, the selected global model is refined in the context of the South East region of Brazil, where dengue predominates, by reverting to a Poisson framework and explicitly modelling the overdispersion through a combination of unstructured and spatio-temporal structured random effects. The resulting spatio-temporal hierarchical model (or GLMM鈥攇eneralised linear mixed model) is implemented via a Bayesian framework using Markov Chain Monte Carlo (MCMC). Dengue predictions are found to be enhanced both spatially and temporally when using the GLMM and the Bayesian framework allows posterior predictive distributions for dengue cases to be derived, which can be useful for developing a dengue alert system. Using this model, we conclude that seasonal climate forecasts could have potential value in helping to predict dengue incidence months in advance of an epidemic in South East Brazil. |
| [8] | European Commission's Seventh Framework Research Programme projects DENFREE, EUPORIAS, and SPECS; Conselho Nacional de Desenvolvimento Científico e Tecnológico and Funda0400o de Amparo à Pesquisa do Estado do Rio de Janeiro. |
| [9] | . This paper demonstrates an empirical approach to identify suitable areas for dengue fever using species distribution modeling and evaluates the relative contribution of climatic and socio-economic factors as dengue fever suitability determinants. Several models showing the potential distribution of dengue fever within all the Mexican municipalities are produced using different sets of predictor variables. The results suggest that at the scale of this study the climatic variables were more important determinants of suitability for dengue fever than the socio-economic variables considered in this study. All the models perform well (average testing AUC about 0.8) and show similar patterns. The model with the least number of variables and best performance includes the variables minimum temperature of the coldest month, mean temperature of the wettest quarter, and annual precipitation. However, there is not a high variability of AUC scores among the models generated. |
| [10] | Dengue fever is one of the most widespread vector-borne diseases and has caused more than 50 million infections annually over the world. For the purposes of disease prevention and climate change health impact assessment, it is crucial to understand the weather-disease associations for dengue fever. This study investigated the nonlinear delayed impact of meteorological conditions on the spatiotemporal variations of dengue fever in southern Taiwan during 1998-2011. We present a novel integration of a distributed lag nonlinear model and Markov random fields to assess the nonlinear lagged effects of weather variables on temporal dynamics of dengue fever and to account for the geographical heterogeneity. This study identified the most significant meteorological measures to dengue fever variations, i.e., weekly minimum temperature, and the weekly maximum 24-hour rainfall, by obtaining the relative risk (RR) with respect to disease counts and a continuous 20-week lagged time. Results show that RR increased as minimum temperature increased, especially for the lagged period 5-18 weeks, and also suggest that the time to high disease risks can be decreased. Once the occurrence of maximum 24-hour rainfall is >50 mm, an associated increased RR lasted for up to 15 weeks. A temporary one-month decrease in the RR of dengue fever is noted following the extreme rain. In addition, the elevated incidence risk is identified in highly populated areas. Our results highlight the high nonlinearity of temporal lagged effects and magnitudes of temperature and rainfall on dengue fever epidemics. The results can be a practical reference for the early warning of dengue fever. (C) 2014 Elsevier Ltd. All rights reserved, |
| [11] | Our study conducted spatial analysis to examine how temperature and other environmental factors might affect dengue fever distributions, and to forecast areas with potential risk for dengue fever endemics with predicted climatic change in Taiwan. Geographic information system (GIS) was used to demonstrate the spatial patterns of all studied variables across 356 townships. Relationships between cumulative incidence of dengue fever, climatic and non-climatic factors were explored. Numbers of months with average temperature higher than 18 degrees C per year and degree of urbanization were found to be associated with increasing risk of dengue fever incidence at township level. With every 1 degrees C increase of monthly average temperature, the total population at risk for dengue fever transmission would increase by 1.95 times (from 3,966,173 to 7,748,267). A highly-suggested warmer trend, with a statistical model, across the Taiwan Island is predicted to result in a sizable increase in population and geographical areas at higher risk for dengue fever epidemics. |
| [12] | This study examined the impact of road networks on the distribution of dengue fever cases in Trinidad, West Indies. All confirmed cases of dengue hemorrhagic fever (DHF) observed during 1998 were georeferenced and spatially located on a road map of Trinidad using Geographic Information Systems software. A new digital geographic layer representing these cases was created and the distances from these cases to the nearest classified road category (5 classifications based on a functional utility system) were examined. The distance from each spatially located DHF case to the nearest road in each of the 5 road subsets was determined and then subjected to an ANOVA and t-test to determine levels of association between minor road networks (especially 3rd and 4th class roads) and DHF cases and found DHF cases were located away from forests, especially 5th class roads). The frequency of DHF cases to different road classes was: 0% (1st class roads), 7% (2nd class roads), 32% (3rd class roads), 57% (4th class roads) and 4% (5th class road). The data clearly demonstrated that both class 3 and class 4 roads account for 89% of nearby dengue cases. These results represent the first evidence of dengue cases being found restricted between forested areas and major highways and would be useful when planning and implementing control strategies for dengue and Aedes aegypti mosquitoes. (C) 2012 Elsevier B.V. All rights reserved. |
| [13] | Dengue fever (DF) is a mosquito-borne disease that significantly endangers the well-being of people in most tropical Asia-Pacific areas. The transmission of DF is inherently a spatial process, requiring susceptible humans encountering infectious mosquito. The relationships between humans, mosquito and environment underpin the dynamics and patterns of the epidemic. In this article, the objective is to find out the key abiotic factors in the spatial dynamics of DF. An interdisciplinary study has been carried out by taking advantage of statistics, geographical information science, and remote sensing technologies. The case study is the DF outbreak in the Chinese city of Guangzhou throughout the year of 2002--the most serious DF outbreak in the recent decade. This study shows that the presence and abundance of DF cases can be associated with (a) socioeconomic factors relating to urbanization and (b) meteorological factors favoring mosquito survival. |
| [14] | Author Summary Global trends in population growth and human redistribution and movement have reshaped the map of dengue transmission risk, exposing a significant proportion of the world's population to the threat of dengue epidemics. Knowledge on the relative contribution of vector and human movement to the widespread and explosive nature of dengue epidemic spread within an urban environment is limited. By analyzing a very detailed dataset of a dengue epidemic that affected the Australian city of Cairns we performed a comprehensive quantification of the spatio-temporal dimensions of dengue virus epidemic transmission and propagation within a complex urban environment. Space and space-time analysis and models allowed derivation of detailed information on the pattern of introduction and epidemic spread of dengue infection within the urban space. We foresee that some of the results and recommendations derived from our study may also be applicable to many other areas currently affected or potentially subject to dengue epidemics. |
| [15] | Author Summary Aedes albopictus has expanded its ecological habitat range throughout the world. Although Ae. albopictus was previously considered a rural vector, this species has adapted well to suburban and urban environments, and it has become the most important and sometimes the sole vector of dengue virus transmission in urban areas. Dengue is a vector-borne disease that has become a severe global public health problem during the last decade. We explored the effect of ecology in different ecological settings (urban, suburban, and rural) on Ae. albopictus larval habitat and mosquito development in Guangzhou, where recently dengue has caused serious public health concerns. The environmental changes caused by urbanization had a significant impact on the ecology of Ae. albopictus . Compared with rural and suburban areas, urban areas had more Ae. albopictus larval habitats, shorter larval development time, higher adult emergence rate, and longer lifespan. These results imply that urbanization significantly increases the potential for dengue outbreaks. Because urbanization is a global trend resulting from economic development, the elucidation of Ae. albopictus adaptation to different environments in China also reveals the potential for this important vector to colonize other parts of the world. |
| [16] | To block human鈥搈osquito interactions by eliminating dengue vectors, Aedes aegypti L. and Aedes albopictus Skuse have been considered the main strategies for dengue prevention. Spatial targeting of dengue risk areas is the highest priority for implementing control measures. However, the frequency of human- Aedes mosquito contacts as human factors for assessing the risk of dengue has not been taken into account by past studies. The objective of this study is to clarify the geographic effects of crowd-gathering places on the frequency of dengue vector for assessing the spatial risk of exposure to dengue in Kaohsiung City, Taiwan. A geographic information system (GIS) was used to integrate crowd-gathering places and ovitrap locations for investigating potential human鈥搈osquito contacts. A negative binominal regression was used to estimate the spatial risk of dengue by integrating vector mosquitoes from the ovitrap survey, urban environmental risk factors and human crowd-gathering places as the surrogate of human activities. We also compared the estimated spatial risk of exposure to dengue with traditional approaches. Our results indicated that the spatial distribution of the residential populations is not consistent with the locations of social activities. Additionally, people closer to crowd-gathering places have a higher frequency of contact with Ae . aegypti than with Ae . albopictus larvae. The dengue risk is caused by the human- Aedes aegypti contacts concentrated around city centers, while the risk caused by the human- Aedes albopictus contacts is distributed around the city boundary. Our study concluded that only relying on infected human cases or the abundance of vector mosquitoes is not enough for assessing the spatial risk of dengue. This reliance could ignore the areas with frequent vector existence and; therefore, result in the underestimated risk of dengue transmission. This study demonstrates the methodological framework for estimating the potential dengue risk and identifies the crowd-gathering places that facilitate dengue transmission. |
| [17] | |
| [18] | To study a 2001 dengue fever outbreak in Iracoubo, French Guiana, we recorded the location of all patients' homes and the date when symptoms were first observed. A geographic information system (GIS) was used to integrate the patient-related information. The Knox test, a classic space-time analysis technique, was used to detect spatiotemporal clustering. Analysis of the relative-risk (RR) variations when space and time distances vary, highlighted the maximum space and time extent of a dengue transmission focus. The results show that heterogeneity in the RR variations in space and time corresponds to known entomologic and epidemiologic factors, such as the mosquito feeding cycle and host-seeking behavior. This finding demonstrates the relevance and potential of the use of GIS and spatial statistics for elaborating a dengue fever surveillance strategy. |
| [19] | The spreading dynamic of the 2004 dengue outbreak that occurred in Tartagal, Northwestern Argentina, was investigated. A total of 487 suspected cases were recorded and geo-referenced. Maps of daily cases were generated for the 109 days of the outbreak. The epidemic affected the majority of the city within 11 days. The age-distribution of the cases was different from the population age-distribution. The spatio-temporal clustering of the cases was analyzed using Knox test concept. Results of the space and time geo-referencing of the cases showed outbreak spotlights and spreading patterns that could be related to entomologic and epidemiologic factors. An environmental risk prediction model was developed based on a synthetic multi-band image created from LandSat 5 TM satellite image. The potential and limitations of remote sensing data and spatial statistics as landscape epidemiology tools for a surveillance strategy and prevention are discussed. |
| [20] | During 2009 the biggest dengue epidemic to date occurred in Argentina, affecting almost half the country. We studied the spatio-temporal dynamics of the outbreak in the second most populated city of the country, Cordoba city. Confirmed cases and the results of an Aedes aegypti monitoring during the outbreak were geolocated. The imported cases began in January, and the autochthonous in March. Thirty-three percent of the 130 confirmed cases were imported, and occurred mainly at the center of the city. The autochthonous cases were more frequent in the outskirts, specially in the NE and SE. Aedes aegypti infestation showed no difference between neighborhoods with or without autochthonous cases, neither between neighborhoods with autochthonous vs. imported cases. The neighborhoods with imported cases presented higher population densities. The majority of autochthonous cases occurred at ages between 25 and 44 years old. Cases formed a spatio-temporal cluster of up to 20 days and 12 km. According to a mathematical model that estimates the required number of days needed for transmission according to daily temperature, the number of cases begun to fall when more than 15.5 days were needed. This may be a coarse estimation of mean mosquito survival in the area, provided that the study area is close to the global distribution limit of the vector, and that cases prevalence was very low. (C) 2014 Elsevier B.V. All rights reserved. |
| [21] | |
| [22] | Reduction of aquatic habitats through environmental management mitigates malaria transmission not only by reducing emergence of host-seeking mosquitoes, but also by increasing the amount of time required for vectors to locate oviposition sites. However, the consequence of source reduction on mosquito oviposition has largely been neglected in evaluations of environment-management programs. Here, by theoretically examining the relationship between the time spent for oviposition and the availability of aquatic habitats, we show that prolonged oviposition cycles induced by source reduction account for a great deal of reductions in the basic reproductive rate of malaria, especially when aquatic habitats are scarce and the mosquito's flight ability is limited. Neglecting this mechanism may lead to substantial underestimation of the impact of source reduction of aquatic habitats on malaria transmission. Our findings suggest that the prolonged duration of the gonotrophic cycle might be one of the important mechanisms underlying the effectiveness of environment-management interventions for malaria control. |
| [23] | In metropolitan areas people travel frequently and extensively but often in highly structured commuting patterns. We investigate the role of this type of human movement in the epidemiology of vector-borne pathogens such as dengue. Analysis is based on a metapopulation model where mobile humans connect static mosquito subpopulations. We find that, due to frequency dependent biting, infection incidence in the human and mosquito populations is almost independent of the duration of contact. If the mosquito population is not uniformly distributed between patches the transmission potential of the pathogen at the metapopulation level, as summarized by the basic reproductive number, is determined by the size of the largest subpopulation and reduced by stronger connectivity. Global extinction of the pathogen is less likely when increased human movement enhances the rescue effect but, in contrast to classical theory, it is not minimized at an intermediate level of connectivity. We conclude that hubs and reservoirs of infection can be places people visit frequently but briefly and the relative importance of human and mosquito populations in maintaining the pathogen depends on the distribution of the mosquito population and the variability in human travel patterns. These results offer an insight in to the paradoxical observation of resurgent urban vector-borne disease despite increased investment in vector control and suggest that successful public health intervention may require a dual approach. Prospective studies can be used to identify areas with large mosquito populations that are also visited by a large fraction of the human population. Retrospective studies can be used to map recent movements of infected people, pinpointing the mosquito subpopulation from which they acquired the infection and others to which they may have transmitted it. |
| [24] | In metropolitan areas people travel frequently and extensively but often in highly structured commuting patterns. We investigate the role of this type of human movement in the epidemiology of vector-borne pathogens such as dengue. Analysis is based on a metapopulation model where mobile humans connect static mosquito subpopulations. We find that, due to frequency dependent biting, infection incidence in the human and mosquito populations is almost independent of the duration of contact. If the mosquito population is not uniformly distributed between patches the transmission potential of the pathogen at the metapopulation level, as summarized by the basic reproductive number, is determined by the size of the largest subpopulation and reduced by stronger connectivity. Global extinction of the pathogen is less likely when increased human movement enhances the rescue effect but, in contrast to classical theory, it is not minimized at an intermediate level of connectivity. We conclude that hubs and reservoirs of infection can be places people visit frequently but briefly and the relative importance of human and mosquito populations in maintaining the pathogen depends on the distribution of the mosquito population and the variability in human travel patterns. These results offer an insight in to the paradoxical observation of resurgent urban vector-borne disease despite increased investment in vector control and suggest that successful public health intervention may require a dual approach. Prospective studies can be used to identify areas with large mosquito populations that are also visited by a large fraction of the human population. Retrospective studies can be used to map recent movements of infected people, pinpointing the mosquito subpopulation from which they acquired the infection and others to which they may have transmitted it. |
| [25] | Conceptualizing a population as a set of individuals linked together to form a large social network provides a fruitful perspective for better understanding the spread of some . Data related to AIDS (the ) were used to illustrate the potential usefulness of a network approach in evaluating the infectious agent hypothesis when studying a disease or disease outbreak of unknown etiology and in developing strategies to limit the spread of an infectious agent transmitted through personal relationships. |
| [26] | |
| [27] | 为更好揭示传染病流行的个体受感染-发病-就诊-康复的时空过程变化模式以及区域之间的信息流与物质流的传播网络结构特征,基于2002~2003年中国SARS病例数据,选取SARS流行的三个典型空间位置信息:工作单位或住址、发病地点以及报告单位,从感染个体和空间区域两个角度来探索病毒感染扩展的输入与输出传播机制,定义并探讨了北京市SARS传播输入-输出流(In-Out Flow)的概念与流行病学特征.采用空间统计分析方法和网络特征分析方法,探索了北京市外部输入-输出流的高风险时空热点以及网络结构特征,并对北京市内部输入-输出流传播网络的空间自相关性与异质性、时空演化规律以及网络结构特征进行了全面分析.结果表明:(1)外部输入流集中在山西和广东,而外部输出流较为分散,主要是广东以及山东等北部省份,且防控措施重点应分别是SARS爆发的早中期与初期;(2)内部输出病例在整体区域上存在显著正自相关性特征,高危人群集中在20~60岁的医务与民工等中青年人群;(3)市中心区的若干区县是SARS传播高风险热点区域,西北方位市郊是次级高风险区域,而东北方位市郊则相对安全;(4)在内部传播网络中各区县节点存在显著小世界特征且具有信息流和物质流的异质性特征,市郊通州区与昌平区是潜在的高风险热点区域,顺义区与怀柔区等节点承载了极低的物质流和信息流信息,是相对的低风险冷点区域.基于输入-输出流的探索与分析更有助于揭示SARS流行过程中的潜在时空演化特征与规律,可为应急决策与防控措施提供更有效的理论依据. . 为更好揭示传染病流行的个体受感染-发病-就诊-康复的时空过程变化模式以及区域之间的信息流与物质流的传播网络结构特征,基于2002~2003年中国SARS病例数据,选取SARS流行的三个典型空间位置信息:工作单位或住址、发病地点以及报告单位,从感染个体和空间区域两个角度来探索病毒感染扩展的输入与输出传播机制,定义并探讨了北京市SARS传播输入-输出流(In-Out Flow)的概念与流行病学特征.采用空间统计分析方法和网络特征分析方法,探索了北京市外部输入-输出流的高风险时空热点以及网络结构特征,并对北京市内部输入-输出流传播网络的空间自相关性与异质性、时空演化规律以及网络结构特征进行了全面分析.结果表明:(1)外部输入流集中在山西和广东,而外部输出流较为分散,主要是广东以及山东等北部省份,且防控措施重点应分别是SARS爆发的早中期与初期;(2)内部输出病例在整体区域上存在显著正自相关性特征,高危人群集中在20~60岁的医务与民工等中青年人群;(3)市中心区的若干区县是SARS传播高风险热点区域,西北方位市郊是次级高风险区域,而东北方位市郊则相对安全;(4)在内部传播网络中各区县节点存在显著小世界特征且具有信息流和物质流的异质性特征,市郊通州区与昌平区是潜在的高风险热点区域,顺义区与怀柔区等节点承载了极低的物质流和信息流信息,是相对的低风险冷点区域.基于输入-输出流的探索与分析更有助于揭示SARS流行过程中的潜在时空演化特征与规律,可为应急决策与防控措施提供更有效的理论依据. |
| [28] | The rapid worldwide spread of the severe acute respiratory syndrome (SARS) demonstrated the potential threat an infectious disease poses in a closely interconnected and interdependent world. Here we introduce a probabilistic model which describes the worldwide spreading of infectious diseases and demonstrate that a forecast of the geographical spread of epidemics is indeed possible. It combines a stochastic local infection dynamics between individuals with stochastic transport in a worldwide network which takes into account the national and international civil aviation traffic. Our simulations of the SARS outbreak are in suprisingly good agreement with published case reports. We show that the high degree of predictability is caused by the strong heterogeneity of the network. Our model can be used to predict the worldwide spreading of future infectious diseases and to identify endangered regions in advance. The performance of different control strategies is analyzed and our simulations show that a quick and focused reaction is essential to inhibit the global spreading of epidemics.Hufnagel, L; Brockmann, D; Geisel, T |
| [29] | . |
| [30] | The flight itineraries for all passengers departing from commercial airports in Mexico between March and April 2009 were analysed using data from the International Air Transport Association to show how travellers - and consequently to predict how H1N1 - would disseminate worldwide during the initial wavefront of this epidemic. Analysis showed that in March and April 2008, a total of 2.35 millio... |
| [31] | Data on the postembryonic development, longevity, ageing and rejuvenation of planarians are reviewed. From the available information, including the results of their own experiments, the authors conclude that planarians display a pattern of ageing intermediate between that of the "non-ageing" (fully-renewable) invertebrates and typical senescence as seen in mammals. The reversibility of planarian age changes and the measurement of "rejuvenation" in planarians are discussed. |
| [32] | The Knox method, as well as other tests for space-time interaction, are biased when there are geographical population shifts, i.e., when there are different percent population in different regions. In this paper, the size of the population shift bias is investigated for the Knox test, and it is shown that it can be a considerable problem. A Monte Carlo method for constructing unbiased space-time interaction tests is then presented and illustrated on the Knox test as well as for a combined Knox test. Practical implications are discussed in terms of the interpretation of past results and the design of future studies. |
| [33] | No abstract available. |
| [34] | |
| [35] | . |
| [36] | 现实世界网络的连接具有多种相 关性,其对网络拓扑结构、动态行为特征等都有重要影响.针对网络中节点之间的度值相关性,提出一种基于给定网络或度序列构造具有极大和极小连续匹配系数网 络的方法——最大加权覆盖,并利用匹配系数分析了网络结构与度相关性之间的关系.在此基础上,基于连续匹配系数网络,通过仿真及理论推导研究了度相关特征 对病毒传播速度、传播阈值和稳态感染率的影响.发现异配网络会加速病毒的传播,而传播速度对同配网络具有更高的敏感性.此外,从免疫策略角度的研究表明, 以大度值为目标的免疫策略对异配网络具有更好的免疫效果,而在实际病毒防御中,应该根据有效传播率、匹配系数、免疫目标等综合考虑. . 现实世界网络的连接具有多种相 关性,其对网络拓扑结构、动态行为特征等都有重要影响.针对网络中节点之间的度值相关性,提出一种基于给定网络或度序列构造具有极大和极小连续匹配系数网 络的方法——最大加权覆盖,并利用匹配系数分析了网络结构与度相关性之间的关系.在此基础上,基于连续匹配系数网络,通过仿真及理论推导研究了度相关特征 对病毒传播速度、传播阈值和稳态感染率的影响.发现异配网络会加速病毒的传播,而传播速度对同配网络具有更高的敏感性.此外,从免疫策略角度的研究表明, 以大度值为目标的免疫策略对异配网络具有更好的免疫效果,而在实际病毒防御中,应该根据有效传播率、匹配系数、免疫目标等综合考虑. |
| [37] | . |
| [38] | |
| [39] | Physical environment, man‐made pollution, nutrition and their mutual interactions can be major causes of human diseases. These disease determinants have distinct spatial distributions across geographical units, so that their adequate study involves the investigation of the associated geographical strata. We propose four geographical detectors based on spatial variation analysis of the geographical strata to assess the environmental risks of health: the risk detector indicates where the risk areas are; the factor detector identifies factors that are responsible for the risk; the ecological detector discloses relative importance between the factors; and the interaction detector reveals whether the risk factors interact or lead to disease independently. In a real‐world study, the primary physical environment (watershed, lithozone and soil) was found to strongly control the neural tube defects (NTD) occurrences in the Heshun region (China). Basic nutrition (food) was found to be more important than man‐made pollution (chemical fertilizer) in the control of the spatial NTD pattern. Ancient materials released from geological faults and subsequently spread along slopes dramatically increase the NTD risk. These findings constitute valuable input to disease intervention strategies in the region of interest. |
| [40] | Human health is affected by many environmental factors. Geographical detector is software based on spatial variation analysis of the geographical strata of variables to assess the environmental risks to human health: the risk detector indicates where the risk areas are; the factor detector identifies which factors are responsible for the risk; the ecological detector discloses the relative importance of the factors; and the interaction detector reveals whether the risk factors interact or lead independently to disease. (C) 2012 Elsevier Ltd. All rights reserved. |
