 , 蒋湧
, 蒋湧Risk assessment of industrial geographical network in the scenario of seismic disaster: A case study of Toyota in Japan
LIWeijiang, JIANGYong收稿日期:2015-12-29
修回日期:2016-04-3
网络出版日期:2016-08-25
版权声明:2016《地理学报》编辑部本文是开放获取期刊文献,在以下情况下可以自由使用:学术研究、学术交流、科研教学等,但不允许用于商业目的.
基金资助:
作者简介:
-->
展开
摘要
关键词:
Abstract
Keywords:
-->0
PDF (3246KB)元数据多维度评价相关文章收藏文章
本文引用格式导出EndNoteRisBibtex收藏本文-->
1 引言
近年来,极端自然灾害事件的发生频率及其造成的社会经济损失呈现上升趋势。特别是,2011年日本东北地震和泰国洪水等自然灾害事件对地方制造业的破坏及其导致的全球经济波及影响,使现代产业经济的脆弱性和风险日益受到关注。如何有效评估自然灾害事件对产业网络的直接损失和间接影响,揭示灾害风险扩散过程和机理,构建兼具效率和弹性产业经济系统,成为灾害风险管理领域亟待解决的问题[1-4]。自然灾害风险评估的角度和服务主体不同,决定了灾害损失计算的空间尺度、内涵、方法和结果意义的差异性。从整个区域角度,需要综合评估灾害所导致的区域环境、经济产出、居民就业和收入等一系列影响。从企业角度,则更多考虑灾害对自身生产系统的固定资产直接损失及生产经营过程中断所造成的间接功能损失。目前,大多数研究是从宏观区域的角度,利用产业部门间或区域间投入产出关联系数以及投入产出法(IO)、可计算一般均衡模型(CGE)等,评估自然灾害在产业系统中的扩散效应及其造成的区域经济间接损失[3, 5-10]。IO、CGE模型主要应用在聚合的产业或区域尺度,把产业部门或者区域作为整体单元,反映它们之间的关联性。由于对区域产业中微观生产企业个体关注较少,在一定程度上忽视了具体产业网络的物理结构、拓扑及地理特性[11],难以深入认识和揭示灾害风险从局部关键生产节点扩散波及到整个产业网络的过程和机理[12]。
企业是产业经济系统最基本的承灾体单元,自然灾害造成的产业损失取决于微观企业个体及其相互关联的网络结构[13-14]。近年来,随着数据库技术及数据密集型分析方法的发展,利用企业个体数据及其复杂交易关系,从网络分析的视角研究产业风险成为一种新的可选择方法[11, 15],它能够更好地模拟产业网络的结构可靠性、关键性节点、以及灾害风险扩散的因果机理及依赖路径等。部分研究[4, 16]关注到企业在区域产业经济中的基础地位,利用企业个体地理分布数据,构建精细空间尺度的产业经济脆弱性评估模型,以探测产业经济脆弱性在连续空间变化。但是,由于数据限制,这些研究没有考虑到企业之间的交易网络及地理空间联系。另外一些研究[17-19]基于企业交易网络的拓扑结构,利用网络分析方法模拟灾害风险的间接扩散效应。但是这些研究更多应用于企业总部(公司)之间的社会交易网络,反映的是资金和信息流关系,而对工厂生产实体及其物流联系组成的地理空间网络涉及较少。自然灾害情景下,直接遭受破坏的是工厂设施,灾害影响扩散依赖的是空间物流网络,因此从地理空间网络层面分析产业风险更具合理性。
本文主要从企业网络角度,以日本丰田汽车为例,以东南海地震为情景,基于工厂个体数据及其供应链拓扑和空间网络,模拟灾害风险从局部节点扩散到整个产业网络过程,建立灾害对产业网络物理损失与间接功能损失的评估模型。理论意义方面,基于个体粒度基础数据及其地理空间关联网络,可以有效揭示灾害风险的空间扩散和放大机理,提高灾害风险评估结果的空间精度,为产业经济脆弱性和风险的精细尺度研究提供新的思路和方法。现实意义方面,从企业角度,可以使生产决策者充分了解自身产业网络脆弱性,有效识别关键性的脆弱节点,进一步优化产业供应网络结构和空间组织形式,防范和减轻自然灾害的负面影响,合理制定业务连续性计划(Business Continuity Planning, BCP)[20]。丰田汽车作为全球著名的制造企业之一,已经构建了全面的部件生产与供应网络。以丰田汽车为典型实例,从地理空间的角度探讨并建立产业网络风险评估理论和方法,可为中国今后开展相关研究提供借鉴。
2 研究方法与数据来源
2.1 研究区域及对象
主要以丰田汽车以及相关企业在日本国内的整车组装厂、不同层级部件供应厂组成的生产和供应网络为研究对象,不包括上游的原材料供应网络,以及下游延伸的销售和服务支持网络。共包括1612个工厂节点,其中整车组装厂11个,一级供应厂177个,二级供应厂357个(图1)。 显示原图|下载原图ZIP|生成PPT
图1研究区域及对象
-->Fig. 1Study area and objects
-->
2.2 数据来源
(1)地震与海啸强度数据:主要来自于2012年日本内阁府地震专家委员会模拟的地震震度分布数据[21]和海啸淹没深度分布数据[22]。该数据为点状格网格式,包括地理位置、地震震度、海啸淹没深度等信息。(2)产业网络数据:主要来源于日本产业调查公司IRC出版的《丰田汽车集团实际情况2010年版》文本资料集[23]。该数据包含各个企业及所属工厂的地址、员工人数、建筑面积、主要生产部件名称、生产类型、上下游交易关系等。基于文本信息挖掘的方法,首先将文本资料扫描、识别并转换成电子数据,利用自制系统抽出本文所需要的信息,自动将信息结构化存入数据库。然后根据企业和工厂的地址信息进行地理编码,生成点状空间数据。由于该资料中缺乏工厂出厂额信息,利用2011年日本工业统计的1 km栅格数据,对落在栅格内所有的企业,将其职工数与栅格内的运输机械制造业的人均出厂额的统计值相乘,得到每个工厂出厂额的估算值,并补充到数据库。基于以上资料,共提取2010年丰田集团和相关企业所属的1364个公司、1612个工厂以及2890个部件数据,这些数据主要涉及丰田汽车国内生产网络中整车组装工厂、1~3次中大型部件供应工厂。
(3)基本地形图数据、行政区划数据:来源于日本国土地理院的公开数据。
(4)道路网数据:来源于ESRI公司提供的日本全国详细公路网行车导航数据。
2.3 研究框架与方法
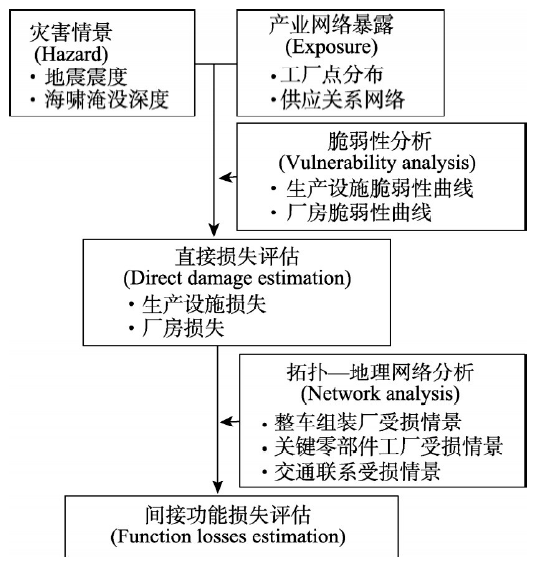
2.3.1 研究框架 自然灾害风险是指在给定的地点和时间段,特定的自然灾害发生所造成的期望损失。按照自然灾害风险系统理论,风险可以概念性地表示为:本文中,Hazard指东南海地震及其引发的海啸灾害,Exposure指丰田汽车产业空间网络,Vulnerability指产业网络中工厂节点及物流道路的物理易损性。Exposure和Vulnerability决定了直接受灾的工厂设施的物理损失。由于暴露对象是一个关联网络,局部受灾工厂节点又会导致整个网络运行的中断,造成间接的功能损失。因此地震灾害情景下的产业网络风险评估思路可以用图2表示。
 显示原图|下载原图ZIP|生成PPT
图2研究框架
-->Fig. 2Research framework
-->
2.3.2 研究方法 (1)灾害强度情景。基于2012年日本内阁府地震专家委员会发布的东南海地震震度及海啸淹没深度数据库,通过对点状格网数据进行栅格化,得到地震震度图和海啸淹没深度图。
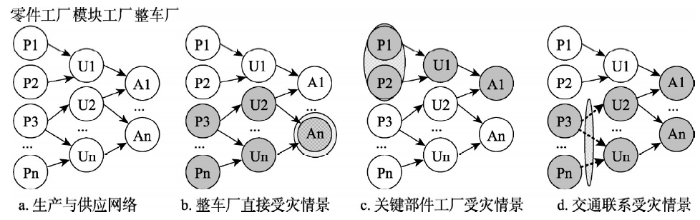
(2)产业网络(暴露)的构建。首先,获得各个企业及所属工厂的点状信息(包括地理位置、员工人数、建筑面积、主要生产部件名称、生产类型、出厂额)。其次,构建企业工厂之间的交易和供应链网络。由于整车部件涉及种类很多,整车企业除了部分关键部件(如发动机)自己制造外,还需要外购于其他的专业部件企业,其交易和供应关系如图3所示。整车制造企业是指丰田汽车公司,其下属汽车整车组装工厂,分别组装不同车型汽车。汽车部件对应于不同的车型,由相应的部件制造工厂生产,这些工厂归属于不同的企业和集团。公司作为经营实体以交易活动为主,而工厂作为生产实体从事生产活动。公司间的交易关系,以及工厂间的供应关系分别反映了生产网络中的资金流和物流信息。地震灾害对生产网络影响程度最大的是工厂设施及其物流供应关系,因此基于企业(公司)之间的交易关系数据库(包括企业名称,交易部件名称),在R软件中利用igraph程序包构建企业交易的图网络,然后再把企业所属工厂生产部件名称与交易部件名称进行匹配,使企业间的交易网络转换为工厂间的供应网络。在供应拓扑网络的基础上,分别抽取工厂节点的拓扑属性以及所处的供应层级(图4a)。
 显示原图|下载原图ZIP|生成PPT
图3汽车部件生产、交易与供应关系
-->Fig. 3Relationships of auto parts production, trading and supply
-->
 显示原图|下载原图ZIP|生成PPT
图4灾害风险间接波及概念图
-->Fig. 4Conceptual maps of disaster risk propagation in industrial network
-->
然后,在拓扑网络的基础上,根据各工厂节点的地理坐标以及它们之间的部件输出和输入供应关系,把拓扑网络转换为地理空间网络,以真实反映各工厂间的空间物流联系。由于工厂间部件实际运输路径存在较大的不确定性并且很难通过实地调查获取,因此基于运输成本最小假设,把工厂间的最短地理路径视为实际运输线路。丰田汽车部件运输主要依托于公路网络,利用ESRI公司提供的2014年日本全国详细公路网行车导航数据(包括高速公路、国道、区域道路3个等级,以及行车速度、单双通行、左右转弯限制、交叉口连通性等道路属性),在ArcGIS的Network Analysis模块中通过最短路径批处理计算,得到任意具有供应关系的工厂节点对之间最短路径,构建空间物流联系网络(图1)。
(3)受灾工厂节点脆弱性及其直接损失评估。地震及海啸会对工厂厂房、设施、原材料、存货等造成直接损坏。丰田汽车实行即时生产(Just In Time, JIT)模式,原材料存货损失可以忽略不计,因此重点考虑灾害对工厂厂房、生产设施的物理损失。评价物理损失的主要方法是建立损失率(损失额)与灾害强度关系的脆弱性曲线。脆弱性曲线可以通过工程试验模拟和历史灾情调查等方式建立。本文主要基于日本2004年中越地震、2007年中越冲地震和2011年东北地震相关调查资料、研究成果以及灾后调查访谈等,分别建立地震—生产设施、地震—厂房、海啸—生产设施、海啸—厂房的脆弱性曲线。然后利用脆弱性曲线评估各工厂节点直接受损程度和损失金额,划定直接受灾区域。
(4)灾害影响的间接波及效应模拟与功能中断损失评估。产业网络中某些关键节点受损或者节点之间的交通联系受阻,将导致整个网络运行中断和生产功能的下降,从而形成功能中断损失[24]。模拟产业网络中风险扩散的方法有距离模型、阈值模型、概率图模型等。本文主要基于丰田汽车部件供应的拓扑和地理网络模拟灾害影响的间接波及效应。假设整车厂An遭受直接破坏,则导致与其关联的上游模块工厂U2、Un和零件工厂P3、Pn等运行中断或生产能力受到限制(图4b)。假设零件工厂节点P1、P2直接受灾,则导致与其关联的模块工厂U1、整车厂A1受影响而运行中断(图4c)。假设P3与U2、Un之间以及Pn与Un之间的物流联系受阻,则导致下游整车厂A1、An运行中断(图4d)。
需要指出的是,在灾害影响的间接波及效应模拟中,除了分析产业网络结构的脆弱性及其导致的风险传递外,还应该考虑网络结构的弹性因素,如上游部件供应的多源结构对网络整体抗灾性能的影响。目前,丰田汽车部件生产存在两种情形:① 一些关键性的零部件和组装部件(如发动机和动力传动系统部件),由于技术保密原因,一般在丰田集团所属企业和工厂内部独断生产,其他外部企业工厂替代性生产的可能性非常小。② 一些标准化和模块化的部件(如电子、车轮和内外饰部件),则主要通过充分的市场竞争,委托外部企业进行多源生产和供应,以提高效率。由于汽车整车车型较多,可利用基础数据的限制,无法明确获知部件生产在工厂节点之间的可替代性。因此,本文仅对整车组装厂、一级工厂(主要是组装部件)、二级工厂(主要是关键零部件)组成的供应网络,假定节点不具有可替代性,对其直接受灾情景下的灾害影响扩散过程进行模拟。
生产网络功能中断所产生的经济损失取决于中断的时间以及单位时间的产出水平等因素[12]。本文利用Simchi-Levi等[25]提出的产业链风险评估模型,首先确定产业链中可能受损关键节点所需恢复时间(Time To Recover, TTR),并把节点中最长的恢复时间作为整个产业链的中断时间,然后所有节点在产业链中断时间内的经济损失总和即功能中断损失。
3 地震与海啸灾害强度情景
处于南海海沟(从静冈县骏河湾到四国、九州近海)沿线的日本东南海地区为地震多发区。南海海沟沿线地质活动相关痕迹调查和研究表明,该地区地震平均发生周期为114年。据资料记载,最近一次地震发生于1946年,地震及海啸造成1443人遇难和失踪。2012年日本内阁府地震专家委员会预测,未来10年内东南海地震发生概率为10%~20%,30年内达到60%,50年内达到90%,地震震级达到8.4级左右[26]。2012年日本内阁府地震专家委员会利用PSHA(Probabilistic Seismic Hazard Analysis)模型得到东南海地震震度分布图。根据震源位置不同,分为基本、东侧、西侧和陆侧4种情景。本文选择对爱知县影响最大的东侧情景[21],其震源为平行于海沟轴的东侧平移位置,从静冈县西部/爱知东部交界到高知县的室户岬之间区域。采用日本气象厅的“震度”等级表示地震烈度,从震度分布(图5a)看,达到6级强以上地区包括静冈县、爱知县、三重县、兵库县、和歌山县、德岛县和高知县等。同时,日本内阁府地震专家委员会利用PTHA(Probabilistic Tsunami Hazard Analysis)模型,对海啸的高度、浸水区域进行预测。本文选择第8种情景[22],对应于“骏河湾—爱知县东部外海”和“三重县南部外海—德岛县外海”区域发生大规模地面滑移情况。从海啸淹没深度分布(图5b)看,最深达到21.62 m。
 显示原图|下载原图ZIP|生成PPT
图5日本东南海地震震度与海啸淹没深度分布
-->Fig. 5Spatial distribution of seismic intensity and tsumami inundation depth induced by eastern Nankai earthquake in Japan
-->
4 产业网络暴露
工厂节点暴露规模及地理分布是影响产业网络脆弱性及潜在损失的重要因素。从总体规模来看,工厂总数达到1612个,厂房建筑面积达到2361万m2,员工数达到46.1万人。从工厂出厂额、员工数、厂房建筑面积等指标的区域构成比例来看(图6),爱知县比例最高,分别达到37.9%、34.4%和42.4%;其次是静冈县,分别达到12.4%、10.4%和9.1%。三重县、群马县、神奈川县、福冈县等各占有5.0%左右。这表明,丰田汽车在日本的生产工厂主要集聚在爱知、静冈、三重等核心区,并在其他外围区域有少部分拓展。 显示原图|下载原图ZIP|生成PPT
图62010年日本丰田汽车及关联供应商所属工厂出厂额、员工数和厂房建筑面积区域分布
-->Fig. 6Spatial distribution of factory shipment, employee and building area of Toyota and related suppliers in Japan in 2010
-->
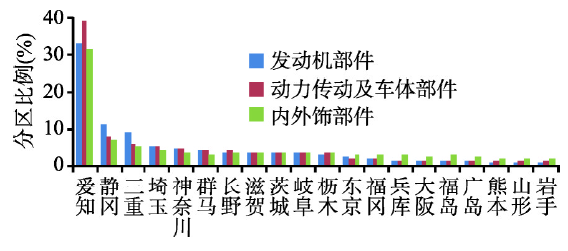
工厂节点的部件生产类型在一定程度上体现了其在整个产业网络的关键性。对不同部件的生产区域进行分区统计(图7),发动机系统(包括发动机主机部件、气门系统、燃油系统、进气排气系统、润滑冷却系统和电气系统)等核心关键性部件,以及动力传动系统和车体系统等体积大的部件主要集中于整车组装厂周围。内外饰部件和车轮系统部件的区域分布则相对分散。
 显示原图|下载原图ZIP|生成PPT
图72010年日本丰田汽车不同类型部件生产区域分布
-->Fig. 7Spatial distribution of different types of auto parts of Toyota according to manufacturing sites in Japan in 2010
-->
工厂节点关联的拓扑结构很大程度能够反映灾害风险从局部节点扩散到整个网络系统的依赖路径。从工厂之间的供应关系看,丰田汽车主要采用零部件工厂(parts plants)→模块工厂(component plants)→整车组装厂(assembly plants)多层次供应关系。其中整车组装厂是整个网络中部件流向的最下游,涉及不同的车型组装线。模块工厂直接为整车组装厂提供如车体、发动机、变速器等主要部件,工艺过程复杂,可替代性较小。处于上游的零部件工厂产品类型相对单一,工艺程序简单,可替代性较强。
工厂节点间的区域联系模式能够反映灾害风险从直接受灾区域可能间接扩散波及的外部空间范围。基于数据库中部件供应关系,对其输出和输入区域特征进行分析,以反映部件供应的区域流向特征和联系模式。其中部件输出区域比例最高的依次为爱知县、静冈县、神奈川县、岐阜县和滋贺县,总计达到70.5%。部件输入区域比例最高的依次为爱知县、福冈县、东京都、三重县、神奈川县,总计达到90.2%。同时,对供应关系的输出—输入区进行频次统计,得到频次较高的模式(表1)。从表1看,由于爱知县境内整车组装厂和部件配套工厂较多,区域内的部件供应关系比例最高,达到28.6%。地理位置近邻的静冈县、神奈川县、岐阜县和滋贺县也是爱知县内汽车整车厂主要的部件供应区域。此外,近年来由于丰田汽车整车厂逐步向外扩展,福冈县、神奈川县、三重县等也成为主要部件流向区域,但很大比重的部件仍然依赖于爱知县境内工厂配套供应。同时,对网络中零部件工厂、模块工厂和整车组装厂等不同层级节点的空间联系模式进行分析。其中,整车组装厂高度集聚在爱知县,在福冈县、神奈川县和东京都有少量分布。与整车组装厂直接关联的发动机系统、动力传动系统和车体系统模块工厂(如丰田集团、日本电装、爱信精机、丰田自动织机、丰田车体、爱信AW、山叶发动机、东海理化等企业所属工厂),其产品体积一般较大,为了缩短运输距离和节约时间成本,实现即时供应,大部分集聚于对应的整车组装厂附近。上游零部件工厂则依托模块工厂进行生产和配套供应,根据零部件类型的不同,空间集聚程度呈现一定的差异性。
Tab. 1
表1
表12010年日本丰田汽车部件供应主要输出—输入区域模式
Tab. 1Most frequent flow patterns of auto parts of Toyota according to outflow and inflow places in Japan in 2010
| 部件输出区域 | 输入区域 | 频次(%) |
|---|---|---|
| 爱知 | 爱知 | 28.6 |
| 静冈 | 爱知 | 8.3 |
| 爱知 | 东京 | 4.2 |
| 爱知 | 福冈 | 4.2 |
| 爱知 | 神奈川 | 3.9 |
| 爱知 | 三重 | 3.9 |
| 神奈川 | 爱知 | 3.4 |
| 岐阜 | 爱知 | 3.2 |
| 滋贺 | 爱知 | 1.9 |
新窗口打开
5 直接受灾区域及损失评估
5.1 生产设施脆弱性曲线及期望损失率
生产设施的地震脆弱性曲线主要通过历史灾损调查获得。典型的如Kambara等[27]对2007年中越冲地震中生产设施受损情况进行调查,获得了震度、生产设施规模与受损程度之间的关系;Nayoshioka等[28]对2011年东北地震中生产设施受损状况进行调查,获得了震度与不同产业类别生产设施损失程度之间的统计关系;Nakano等[29]基于2004年中越地震后受灾工厂的大量调查数据,建立了地震动强度和不同类型产业的工厂生产设施受损的脆弱性曲线,并以此作为其生产能力损失(Production Capacity Loss Rate, PCLR)的脆弱性曲线。基于以上历史灾情调查数据,分别抽取和整理有关汽车产业生产设施损失特征与震度有关描述信息,并通过实地调研和验证,建立汽车产业生产设施物理损失的脆弱性曲线(图8)。该脆弱性曲线分为3种类型,分别代表不同的生产设施损失范围,即0 < D1 ≤ 1/3、1/3 < D2 ≤ 2/3和2/3 < D3 ≤ 1。 显示原图|下载原图ZIP|生成PPT
图8地震情景下的生产设施脆弱性曲线
-->Fig. 8Fragility curves for production facilities in the case of earthquake
-->
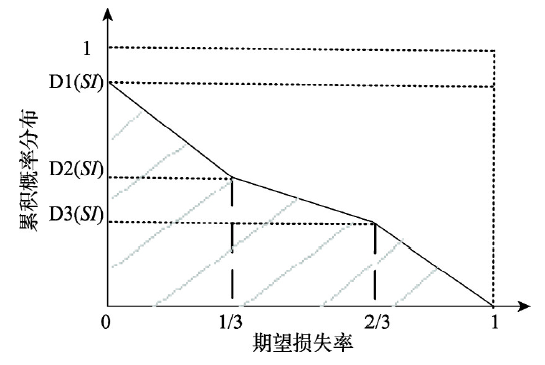
假定在以上3种类型损失区间内,某一给定震度下,损失概率是相同的,则累积概率分布和损失程度的关系可以用图9表示,其中阴影区域的面积D(SI)就是期望损失率。其计算方法如下:
根据公式(1)计算得出不同震度下的期望损失率。当地震震度在5级强时,生产设施的平均受损率在0.11~0.32之间。当震度6级弱时,损失率在0.34~0.64。当震度6级强时,损失率达到0.67~0.80。当震度7级时,则损失率达到1.0。
 显示原图|下载原图ZIP|生成PPT
图9期望损失率与累积概率分布的关系
-->Fig. 9Relationship between expected losses ratio and cumulated probability distribution
-->
生产设施对于海啸淹没深度脆弱性的研究相对较少。Kajitani等[30]通过对东北地震后受灾工厂调查发现,在海啸影响的区域,即使受淹深度很浅,厂房没有损坏,由于生产设施受到浸水、泥石流及其他因素的影响而会遭受严重破坏,企业的生产机能完全终止。因此,在海啸淹没区域把生产设施的期望损失率设为1。
5.2 厂房建筑脆弱性曲线及期望损失率
根据调查,多数工厂厂房为1981年后的非木制建筑物。利用日本内阁府2012年确定的地震建筑物受损率曲线(适用于1981年以后建非木制房屋部分)(图10)和海啸建筑物受损率曲线(适用于人口密集地区)(图11)[31],分别作为工厂厂房地震脆弱性曲线和海啸脆弱性曲线。其中,厂房受损包括半损和全损二种情形,反映了灾害强度与建筑物损坏发生的超越概率之间的关系。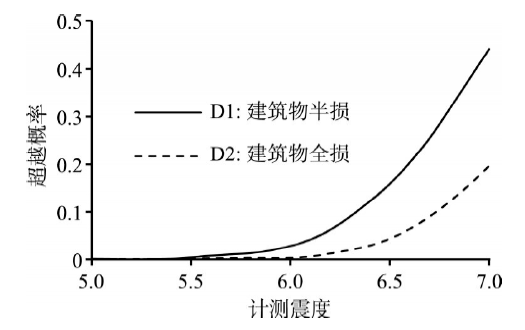 显示原图|下载原图ZIP|生成PPT
图10地震情景下的厂房脆弱性曲线
-->Fig. 10Fragility curves for factory building in the case of earthquake
-->
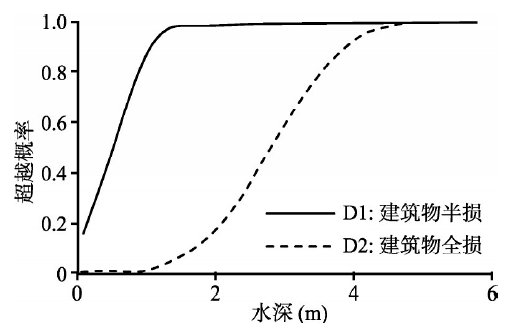 显示原图|下载原图ZIP|生成PPT
图11海啸情景下的厂房脆弱性曲线
-->Fig. 11Fragility curves for factory building in the case of tsunami
-->
利用5.1期望损失的计算方法,分别得到工厂厂房在不同地震震度下的期望损失率和不同海啸水深下的期望损失率。工厂厂房的抗震性能普遍较高,当震度达到6级强时,期望损失率仅为0.05。当震度达到7.0级时,期望损失率仅为0.22。而工厂厂房对于海啸淹没水深较为敏感,当水深达到3 m后,厂房的全坏概率达到0.6,半坏概率达到1.0。水深达到4 m后,则基本全坏。
5.3 直接受灾区域划分
根据5.1和5.2脆弱性分析结果,生产设施对于地震和海啸的脆弱性大于厂房,而且生产设施是影响工厂综合生产能力损失程度及灾后恢复中最为关键性的因素,因此重点以生产设施脆弱性为基础,对直接受灾区域进行灾情等级区划。以计测震度5.0~5.4,划定为轻度受灾区域;计测震度5.5~5.9划定为中度受灾区域;计测震度≥ 6.0或者海啸淹没深度> 0.5 m划定为重度受灾区域(图12)。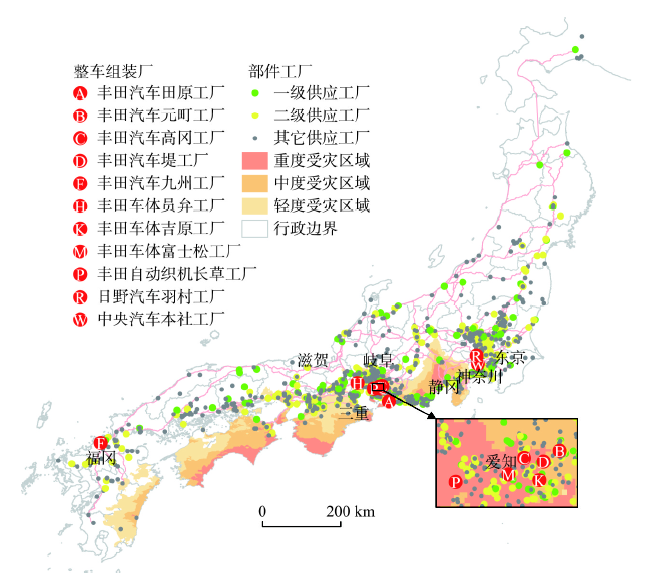 显示原图|下载原图ZIP|生成PPT
图12日本东南海地震及海啸导致的直接受灾区域
-->Fig. 12Directly affected area by eastern Nankai earthquake and related tsunami in Japan
-->
据统计,约775个工厂(48.1%)将直接受到损坏,其中整车组装厂7个(表2),二级以上部件工厂273个。直接受灾的整车厂均位于震度6.0级以上区域,预期受损率超过0.64。其中,丰田汽车田原工厂位于震度6.9区域(体感震度7级),预期将严重受损。整车厂直接受损,将导致与其关联的不同车型生产线中断。
Tab. 2
表2
表2日本东南海地震及海啸导致的丰田直接受灾整车组装厂
Tab. 2Directly damaged assembly plants of Toyota induced by eastern Nankai earthquake and related tsunami in Japan
| 公司 | 工厂 | 车型生产线 | 平均年产量 (万辆) | 计测 震度 | 预期 受损率 |
|---|---|---|---|---|---|
| 丰田汽车 | 元町工厂 | Mark X; Estima; Crown Hybrid, Majesta; Mirai; Lexus GS,LFA | 8.0 | 6.0 | 0.67 |
| 丰田汽车 | 高冈工厂 | (1) Corolla, iQ, Auris; Harrier, Harrier Hybrid; RAV4; (2) Wish, Prius | 30.0 | 6.0 | 0.67 |
| 丰田汽车 | 田原工厂 | (1) Land cruiser, prado, 4Runner; (2) RAV4, Vanguard, Wish; (3) Lexus LS(Hybrid), IS, IS-F, GS (Hybrid), GX, RC350/RC350h, RC F | 40.0 | 6.9 | 1.0 |
| 丰田汽车 | 堤工厂 | (1)Prius Premio, Allion; (2) Prius EX, PHV; Camry Hybrid | 36.0 | 5.9 | 0.64 |
| 丰田车体 | 富士松工厂 | (1)Prius; Land Cruiser 70 hardtop, Land Cruiser 70; (2)Prius, Estima, Voxy, Noah, Esquire | 24.8 | 6.2 | 0.70 |
| 丰田车体 | 吉原工厂 | Coaster; Land Cruiser 200, Land Cruiser 70 van, Land Cruiser 70 pickup; Lexus LX570 | 24.8 | 6.1 | 0.68 |
| 丰田自动织机 | 长草工厂 | (1) Vitz; (2) RAV4, Mark X ZiO | 30.0 | 6.1 | 0.68 |
新窗口打开
对直接受灾区域的部件工厂进行统计,约27.7%生产发动机部件、26.1%生产车体部件、46.2%生产内外饰部件。其中,某些发动机、动力传动系统等关键性部件工厂一旦受损,将会对整个生产和供应网络产生影响。例如山叶发动机株式会社分别为丰田汽车的田原工厂第3生产线LexusIS/IS F车型,元町工厂第1生产线Crown、Mark X车型,九州工厂(福冈)Lexus IS/IS C车型直接供应发动机部件。根据震度图,其位于静冈县的中濑、袋井、早出、森町、丰冈、磐田、磐田南、磐田本社、磐田2、浜北等10个工厂都属于7级区域(计测震度6.5以上),预期将严重受损并导致关联整车组装厂生产线中断。此外丰田汽车位于爱知县的明知工厂专业生产汽车悬架铸造和机械部件、衣浦工厂专业生产传动系统部件、下山工厂专业制造Prius、Lexus、Camry、Estima等车型发动机部件。这些关键节点都处在计测震度6.1~6.2区域,受损后也将导致相关生产线的整体中断。
5.4 直接损失估算
根据每个工厂所处的震度及海啸淹没深度,通过脆弱性曲线计算其预期损失率,并评估直接受灾损失金额。生产设施损失额计算公式为:式中:FAi为i工厂生产设施固定资产折现值,通过2011年日本运输机械制造业从业人员人均固定资产折现值5059千日元/人[32]×工厂从业人员数计算得到;LSi为i工厂的生产设施受损率,与所在地区的灾害强度有关,在地震和海啸叠加的地区,取二者最大受损率。根据计算得到直接受灾地区工厂生产设施资产现值约为9012亿日元,生产设施总损失约5587亿日元。
厂房建筑物损失额计算公式为:
式中:BDtotal为厂房总损失额;BAi为i厂房的建筑面积;LSi为i厂房平均受损率,与所在地区的灾害强度有关,在地震和海啸叠加的地区,取二者最大受损率;Pi为i厂房的单位面积重置成本,参考2011年日本建筑统计年报中新竣工厂房单位建筑面积成本,设定为170千日元/m2;n为受灾建筑物总数。根据计算得到受灾总厂房面积约1060万m2,厂房总损失约1980亿日元。
6 间接影响扩散模拟与功能损失评估
基于整车组装厂、一级工厂、二级工厂组成的供应网络,假定节点不具有可替代性,对整车组装厂受损、关键部件工厂受损和交通联系受损三种情景下的间接扩散效应进行模拟,并评估产业网络运行中断情景下的功能损失。6.1 整车组装厂直接受灾情景(前向关联影响)
下游整车组装厂受损,将导致上游具有供应关系的部件工厂生产能力下降或运行中断。据统计,直接受损的整车厂包括丰田汽车田原工厂、元町工厂、堤工厂、高冈工场,丰田车体富士松工厂和吉原工厂,以及丰田自动织机长草工厂。与直接受损整车厂关联的一级部件工厂达到253个,二级供应工厂357个。其中,直接受灾区域外围间接波及影响的一级工厂80个,二级工厂125个(图13a),主要集中在爱知县、神奈川县、岐阜县、滋贺县等区域。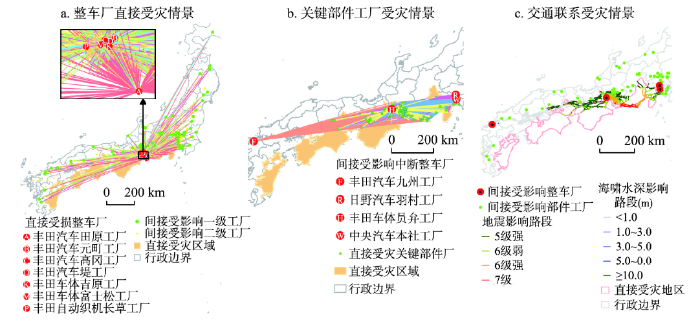 显示原图|下载原图ZIP|生成PPT
图13日本东南海地震及海啸导致的灾害风险在丰田汽车生产网络的间接扩散和波及情景
-->Fig. 13Scenarios of disaster risk propagation in industrial network of Toyota induced by eastern Nankai earthquake and related tsunami in Japan
-->
整车组装厂在整个生产线中生产设施和工艺最复杂,受到破坏后所需恢复时间最长。因此,与之关联的生产线运行中断时间将取决于直接受损的整车组装厂的恢复时间。Sasaki[33]分别对2007年中越冲地震和2011年东北地震后丰田、日产、本田、马自达、铃木、三菱等主要汽车整车组装厂的恢复过程及时间进行比较研究,并把震后的中断时间划分为部分中断时间和完全中断时间。Nayoshioka等[28]对东北地震中整车组装厂恢复时间与震度的关系进行了比较分析。参照以上调查结果和直接受灾整车厂所处震度区域(大于6级强),设定与直接受灾整车厂关联的生产线平均中断时间为37天。
6.2 关键部件工厂受灾情景(后向关联影响)
上游关键部件工厂节点受损,在可替代性缺乏的情况下,将导致下游有供应关系的模块工厂和整车组装厂间接受影响而运行中断。根据对供应链网络模拟结果,由于直接依赖的部件工厂受灾,间接导致丰田汽车九州宫田工厂、丰田车体员弁工厂、日野汽车羽村工厂、中央汽车本社工厂等受到影响(图13b)。九州宫田工厂主要组装丰田Harrier、Highlander、SAI、Lexus等混合动力车,丰田车体员弁工厂主要组装Hiace、Semibon、Alphard、Vellfire等中型车,日野汽车羽村工厂主要组装丰田Dyna、Toyoace、Hilux等大型卡车。其中,生产线上游的爱信AW公司同时为以上整车厂供应动力传动系统部件如无极变速箱、自动档组件等,其所属的爱知县田原、蒲郡、冈崎东、本社工厂处于计测震度6.0以上区域,冈崎工厂也处于计测震度5.6区域。这些工厂严重受损的情景下,由于缺乏可替代性,将导致相关联的车型生产线中断。在上游关键部件工厂节点受损情况下,整个生产线运行中断时间取决于关键节点的受损程度及最长恢复时间。由于汽车部件类型繁多,其生产设施和工艺差异较大,如包括冲压、焊装、涂装、总装等,因此定量化模拟和计算其修复时间非常困难。目前主要采用历史调查资料类比的方法,近似得到每个受灾关键节点的生产中断(恢复)时间:
式中:SIij表示第i个生产线上受损节点j所处的计测震度;SIR表示历史地震灾害中具有相似部件类型的参照点的计测震度;TR表示参照点的中断时间。如果该节点同时受到海啸影响,则视作完全受损。本文主要选择生产线中生产发动机部件、动力传动系统部件、车体部件的一级和二级工厂作为关键性节点,基于Nayoshioka等[28]对东北地震相关调查资料中震度与平均恢复时间的关系,确定其大致恢复时间在12~20天。
然后取所有受损节点中最长的恢复时间作为整个生产线的中断时间:
式中:Sin为第i生产线中第n个工厂节点的中断时间;Ti为第i生产线的中断时间。
6.3 交通联系受灾情景
由于道路设施受到地震或海啸的物理损坏,工厂之间部件供应联系受阻,而造成关联的生产线中断。在交通联系受阻情景下,生产线中断时间与道路的受损程度及修复时间有关。地震及其海啸对道路的影响主要表现为路面损伤、桥梁坍塌、立面脱落、侧面水土流失、泥石流残留物堆积等。道路的通行恢复时间与道路受害形态、受害规模、修复优先顺序、修复人员规模,投入物资材料送达时间等多种因素有关。相关研究通过对日本2004年中越地震、2007年中越冲地震和2011年东北地震的实地调查,建立了定量化的地震震度(海啸淹没深度)与道路网(包括高速公路、国道、区域道路)受损概率关系、以及道路受损点修复率随时间变化的概率密度分布[34-36]。本文主要利用2011年日本东北地震历史调查数据及其建立的道路网受损点数量与震度(水深)的经验关系[37],评估受灾点总数量。然后根据受灾点恢复过程随时间变化的关系,评估道路中断后的通行恢复时间。该研究成果被应用于日本内阁府东南海地震风险评估研究中,具有一定的代表性。具体过程是,首先把具有供应联系的所有工厂设施点之间的最短地理路径图层与震度分布图及海啸淹没深度图进行Intersect叠加运算,得出有供应关系的节点对之间受影响的路段,及其所处震度、淹水深度、长度等属性信息(图13c)。以国道道路受损点概率(表3,表4)作为平均参照,计算出总的可能受灾节点约为724个。再根据道路受灾点修复程度随时间变化的经验关系,评估出90%受损节点恢复情景下所需时间约为5天,计算公式如下:
式中:N0为道路网受灾点总数量;T为灾后经过的天数;N为未修复受灾点个数。
Tab. 3
表3
表32011年日本东北地震震度与道路受灾点概率
Tab. 3Probability of damaged points in road network under different seismic intensity of North-East Japan earthquake in 2011
| 震度 | 受灾点(个/km) |
|---|---|
| 7级 | 0.48 |
| 6级强 | 0.17 |
| 6级弱 | 0.16 |
| 5级强 | 0.11 |
| 5级弱 | 0.035 |
新窗口打开
Tab. 4
表4
表42011年日本东北地震海啸水深与道路受灾点概率
Tab. 4Probability of damaged points in road network at different tsunami inundation depths induced by North-East Japan earthquake in 2011
| 水深(m) | 受灾点(个/km) |
|---|---|
| ≥ 10.0 | 2.64 |
| 5.0~10.0 | 1.52 |
| 3.0~5.0 | 0.65 |
| 1.0~3.0 | 0.37 |
| < 1.0 | 0.13 |
新窗口打开
据统计由于11个整车厂与部件工厂联系的部分路段处于地震和海啸影响区,均会出现部件供应交通受阻而生产线中断的情形。其中,丰田汽车九州宫田工厂、丰田车体员弁工厂、日野汽车羽村工厂、中央汽车本社工厂等整车厂以及92个关键部件工厂,虽然处在直接受灾区域之外,也会间接受到道路中断的影响。
6.4 功能中断损失的计算
根据分析,各个整车组装厂及相关生产线均不同程度受到3种情景影响。为避免重复计算中断损失,取3种情景中最长的恢复时间作为生产线的中断时间。由于上游各个部件的价值最终会计入到整车中,只需要计算下游整车厂在中断期间的出厂额减少即为整个生产线的中断经济损失。其计算方法如下:式中:BRLtotal为总的中断经济损失;Pi为第i个直接受损整车厂日出厂额;Tia、Tip、Tir分别为第i个整车厂在直接受损、上游关键部件受损、道路受损情景下的中断时间。通过计算得到总的功能中断损失约为9230亿日元。
7 结论与讨论
本文以日本丰田汽车为例,以日本东南海地震为情景,从微观企业个体数据及其复杂交易关系的视角,提出产业空间网络风险评估的思路和框架。具体包括灾害强度情景、产业空间网络暴露、节点脆弱性及其直接损失评估、灾害影响间接扩散模拟与功能中断损失评估等。在暴露分析中,把企业交易网络转换为工厂节点供应链地理空间网络,作为灾害风险分析的基本层面。在直接损失评估中,建立生产设施与厂房建筑的脆弱性曲线作为物理损坏评估的依据,并进行灾损区划,确定关键性工厂节点的受损程度。在间接影响评估中,利用工厂节点供应链拓扑和空间网络,对整车厂受损、关键部件工厂受损及道路网络受损等情景下的风险扩散波及过程进行模拟,并基于产业网络运行中断后恢复时间的调查分析,定量评估间接功能中断损失。7.1 结论
实证研究结果表明,在东南海地震情景下,约48.1%的工厂节点将中度以上受损,并且高度集聚于爱知县、静冈县、三重县等核心区,生产设施损失约5587亿日元,厂房建筑损失约1980亿日元。由于整车组装厂,发动机、动力传动以及车体系统等核心部件供应工厂,以及交通物流联系受到直接破坏,将导致整个产业网络运行中断。假设最长恢复时间为37日,将导致9230亿日元的间接损失。这表明,东南海地震将对丰田汽车产业网络产生显著影响,应该采取有效的工程或非工程措施减灾降险,如调整关键部件工厂的空间布局结构、优化部件的供应关系、提高易受灾地区关键部件的库存水平等。本文在以下几个方面有新进展。① 从企业角度,以企业个体粒度数据及其复杂交易关系为基础,构建产业空间网络,提出产业网络风险的精细尺度评估方法,有效揭示灾害风险空间扩散和放大机理,对产业经济领域风险预警和防范措施的落地和空间化具有重要意义,与其他相关的宏观区域研究相比具有较大的进步。② 基于复杂企业交易数据,提出产业空间网络构建方法,为从地理空间角度开展产业网络风险研究提供新的思路。随着全球汽车产业数据库—Marklines、中国经济普查基础数据库、中国上市公司年报数据库、日本帝国数据库—TDB等企业交易数据库的公开,可利用的大体量、个体粒度基础数据日益丰富,本文产业空间网络的构建方法可以为今后相关研究提供借鉴。
7.2 讨论
本文同时在以下几个方面需要进一步探索。① 产业空间网络构建中,由于缺乏实际物流统计数据,基于运输成本最小假设,把工厂间的最短地理路径视为实际运输线路,存在一定的不确定性,需要进一步调查验证。② 灾害影响间接扩散效应模拟中,由于无法明确获知部件生产在工厂节点之间的可替代性,没有考虑产业网络结构的弹性特征,需要进一步实地调查和补充相关数据,并继续深入评估产业网络结构脆弱性和弹性,使研究结果更贴合实际。③ 本文只是考虑了地震灾害对汽车产业网络本身的直接损失和间接功能影响,而汽车产业对上游钢铁、塑料等其他原材料供应企业的影响没有涉及。随着相关企业交易数据的公开和应用,将进一步得到完善。The authors have declared that no competing interests exist.
参考文献 原文顺序
文献年度倒序
文中引用次数倒序
被引期刊影响因子
| [1] | . In the event of natural disasters, industrial production sites can be affected by both direct physical damage and indirect damage. The indirect damage, which often exceeds the direct ones in value, mainly arises from business interruptions resulting from the impairment of information and material flows as well as from domino effects in interlaced supply chains. The importance of industry for society and the domino effects often result in severe economic, social, and environmental consequences of industrial disasters making industrial risk management an important task for risk managers at the administrative level (e.g. civil protection authorities). Since the possible industrial disaster damage depends not only on hazard and exposure but also on the vulnerability of a system, an effective and efficient industrial risk management requires information about the system's regionalized vulnerability. This paper presents a new methodology for structural industrial vulnerability assessment based on production factors that enables to assess the regional industrial disaster vulnerability. In order to capture industry-specific vulnerability factors and to account for the processes underlying regional industrial vulnerability, a two-stage approach is developed. This approach combines a composite indicator model to assess sector-specific vulnerability indices ( V s ) with a new regionalization method. The composite indicator model is based on methodologies from the field of multicriteria decision analysis (MultiAttribute Value Theory) and the Decision-Making Trial and Evaluation Laboratory Method is applied to correct the ( V s ) for interdependencies among the indicators. Finally, the developed approach is applied to an exemplar case study and the industrial vulnerability of 44 administrative districts in the German federal state of Baden-Wuerttemberg is assessed. |
| [2] | . |
| [3] | . Macroeconomics models, such as the input-output model, the social accounting matrix, and the computable general equilibrium model, have been used for impact analysis of catastrophic disasters for some time. While the use of such models to disaster situation, which may quite differ from the ordinary economic setting, has been critiqued (for recent example, see Albala-Bertrand, 2013), there are still valuable reasons for the use of such models. In particular, such models can be used in order to quickly provide a ballpark estimate of the system-wide impact for recovery plan and finance and/or to evaluate disaster countermeasures in the pre-event period. This paper presents how these methodologies have evolved to incorporate with disaster-specific feature and discusses how far they still need to go from the current stage. This paper also serves as a preface to this special issue, which encompasses several papers devoted to the use of macroeconomic data and models to assess economic losses from disasters. |
| [4] | . <p>经济脆弱性评价是风险评估的重要步骤和制定有效防灾减灾规划的前提条件,是应急管理和灾后恢复的重要依据。本文提出了一个微观尺度的城市经济脆弱性评估模型,从各类企业的空间布局及其行业经济特征入手,综合考虑企业属性、产业易损性、产业重要性、经济密度等因素,并在此基础上构建了城市经济脆弱性模拟评估系统,以北京市海淀区为案例区对上述模型方法进行了检验。结果表明,城市经济脆弱性评估方法及系统的构建有利于决策者准确把握城市经济脆弱性的分布状况,甄别风险地区和确定风险级别,为城市灾害风险管理提供了可靠依据。系统的运行取得了良好的效果,在辅助决策方面有很好的应用前景,也为城市灾害管理的信息化提供了有益的探索。</p> . <p>经济脆弱性评价是风险评估的重要步骤和制定有效防灾减灾规划的前提条件,是应急管理和灾后恢复的重要依据。本文提出了一个微观尺度的城市经济脆弱性评估模型,从各类企业的空间布局及其行业经济特征入手,综合考虑企业属性、产业易损性、产业重要性、经济密度等因素,并在此基础上构建了城市经济脆弱性模拟评估系统,以北京市海淀区为案例区对上述模型方法进行了检验。结果表明,城市经济脆弱性评估方法及系统的构建有利于决策者准确把握城市经济脆弱性的分布状况,甄别风险地区和确定风险级别,为城市灾害风险管理提供了可靠依据。系统的运行取得了良好的效果,在辅助决策方面有很好的应用前景,也为城市灾害管理的信息化提供了有益的探索。</p> |
| [5] | . Recent natural and manmade disasters have had significant regional economic impacts. These effects have been muted, however, by the "resilience" of individual businesses and of regional markets, which refers to the inherent ability and adaptive responses that enable firms and regions to avoid potential losses. Computable general equilibrium (CGE) analysis is a promising approach to disaster impact analysis because it is able to model the behavioral response to input shortages and changing market conditions. However, without further refinement, CGE models, as well as nearly all other economic models, reflect only "business-as-usual" conditions, when they are based on historical data. This paper advances the CGE analysis of major supply disruptions of critical inputs by: specifying operational definitions of individual business and regional macroeconomic resilience, linking production function parameters to various types of producer adaptations in emergencies, developing algorithms for recalibrating production functions to empirical or simulation data, and decomposing partial and general equilibrium responses. We illustrate some of these contributions in a case study of the sectoral and regional economic impacts of a disruption to the Portland Metropolitan Water System in the aftermath of a major earthquake. Copyright Blackwell Publishers, 2005 |
| [6] | . This article proposes a new modeling framework to investigate the consequences of natural disasters and the following reconstruction phase. Based on input-output tables, its originalities are (1) the taking into account of sector production capacities and of both forward and backward propagations within the economic system; and (2) the introduction of adaptive behaviors. The model is used to simulate the response of the economy of Louisiana to the landfall of Katrina. The model is found consistent with available data, and provides two important insights. First, economic processes exacerbate direct losses, and total costs are estimated at $149 billion, for direct losses equal to $107 billion. When exploring the impacts of other possible disasters, it is found that total losses due to a disaster affecting Louisiana increase nonlinearly with respect to direct losses when the latter exceed $50 billion. When direct losses exceed $200 billion, for instance, total losses are twice as large as direct losses. For risk management, therefore, direct losses are insufficient measures of disaster consequences. Second, positive and negative backward propagation mechanisms are essential for the assessment of disaster consequences, and the taking into account of production capacities is necessary to avoid overestimating the positive effects of reconstruction. A systematic sensitivity analysis shows that, among all parameters, the overproduction capacity in the construction sector and the adaptation characteristic time are the most important. |
| [7] | . Disaster loss estimates are helpful for managing post-disaster reconstruction and for designing disaster-risk mitigation strategies. However, most of these estimates in China merely consider direct losses, and only a few include indirect economic losses. As the most destructive earthquake since the founding of the People's Republic of China in 1949, the Wenchuan Earthquake that occurred in 2008 resulted in direct economic damages reached Chinese Yuan (CNY) 845 billion (US $124 billion). The aim of the study was to estimate indirect economic losses caused by the Wenchuan Earthquake in Sichuan Province through the Adaptive Regional Input-Output (ARIO) model, which can reflect disaster-related changes in production capacity, ripple effects within the economic system, and adaptive behaviors of economic actors. The results showed that indirect economic losses in the production and housing sectors were estimated at 40% of the direct economic losses, i.e., approximately CNY 300 billion; moreover, the model predicted an 8-year reconstruction period. Several factors contributed to these losses, including significant damages to key sectors, financial constraints on reconstruction, post-earthquake investment instability, and limits in reconstruction capacity. Active government support policies post-earthquake are a useful strategy to mitigate the adverse economic impact of an earthquake in developing countries. |
| [8] | . 基于区域投入产出模型(ARIO),以一个月为时间步长,模拟了汶川地震后四川省各部门产出和需求随重建进程的变化过程。模拟结果表明:汶川地震的完全恢复重建大致需要近9年的时间,灾后36个月时,四川省的当地总产出能力将超过灾前水平。在重建模拟的基础上,评估了灾后实施不同风险管理策略的潜在效益,若最大生产能力在灾后3个月内能够加速达到灾前的150%,则与无加速重建相比,恢复重建期至少可以缩短3年半,证明了灾后加大人力和物力投入对于缩短恢复重建期的作用。提出的重建期模拟方法可以为缩短重建期、合理分配抗灾救灾资源的灾害管理提供技术支撑。 . 基于区域投入产出模型(ARIO),以一个月为时间步长,模拟了汶川地震后四川省各部门产出和需求随重建进程的变化过程。模拟结果表明:汶川地震的完全恢复重建大致需要近9年的时间,灾后36个月时,四川省的当地总产出能力将超过灾前水平。在重建模拟的基础上,评估了灾后实施不同风险管理策略的潜在效益,若最大生产能力在灾后3个月内能够加速达到灾前的150%,则与无加速重建相比,恢复重建期至少可以缩短3年半,证明了灾后加大人力和物力投入对于缩短恢复重建期的作用。提出的重建期模拟方法可以为缩短重建期、合理分配抗灾救灾资源的灾害管理提供技术支撑。 |
| [9] | <p>灾害的损失受灾前经济发展水平、灾种差异、灾后恢复重建策略、灾害管理水平和灾害保险体系完善程度等复杂因素的影响,加上基础数据精度、获取难度和校验的不确定性,目前还没有有效的灾害间接经济损失评估方法。而已有间接经济损失评估方法存在不足:首先,评估对灾害间接经济损失的构成、时空维界定模糊;其次,评估模型假设太多往往偏离灾后实际经济状况;最后,模型对灾害扰动的动态影响机制考虑不足,往往忽视灾后经济系统的弹性和部门生产容量的动态变化特征。因此,在进行灾害损失评估时应注意灾害对经济影响的动态机理,结合不同灾害类型对经济影响的特点和当地的经济发展状况,合理设置相关参数,使模型更切合实际,从而更合理有效的评估灾害造成的间接损失。</p> . <p>灾害的损失受灾前经济发展水平、灾种差异、灾后恢复重建策略、灾害管理水平和灾害保险体系完善程度等复杂因素的影响,加上基础数据精度、获取难度和校验的不确定性,目前还没有有效的灾害间接经济损失评估方法。而已有间接经济损失评估方法存在不足:首先,评估对灾害间接经济损失的构成、时空维界定模糊;其次,评估模型假设太多往往偏离灾后实际经济状况;最后,模型对灾害扰动的动态影响机制考虑不足,往往忽视灾后经济系统的弹性和部门生产容量的动态变化特征。因此,在进行灾害损失评估时应注意灾害对经济影响的动态机理,结合不同灾害类型对经济影响的特点和当地的经济发展状况,合理设置相关参数,使模型更切合实际,从而更合理有效的评估灾害造成的间接损失。</p> |
| [10] | . 近年来,巨灾经济影响的全球性受到了社会各界越来越多的关注。通过构建混合国际投入产出模型,从需求端的角度定量评估了东日本大地震对世界各国各个生产部门的经济影响。结果表明:(1)东日本大地震对世界其他各国的经济产量影响非常显著,主要集中在金属制品业、交通运输设备制造业以及电子与光学设备制造业等;(2)在受影响的国家和地区中,以中国、美国、韩国、澳大利亚、德国等最为显著,且不同国家和地区受到影响的部门结构也各不相同。研究从区域间产业关联的角度揭示了巨灾影响的全球性问题,对于全球尺度上的巨灾风险管理具有参考价值。 . 近年来,巨灾经济影响的全球性受到了社会各界越来越多的关注。通过构建混合国际投入产出模型,从需求端的角度定量评估了东日本大地震对世界各国各个生产部门的经济影响。结果表明:(1)东日本大地震对世界其他各国的经济产量影响非常显著,主要集中在金属制品业、交通运输设备制造业以及电子与光学设备制造业等;(2)在受影响的国家和地区中,以中国、美国、韩国、澳大利亚、德国等最为显著,且不同国家和地区受到影响的部门结构也各不相同。研究从区域间产业关联的角度揭示了巨灾影响的全球性问题,对于全球尺度上的巨灾风险管理具有参考价值。 |
| [11] | . This paper investigates the impact of floods on the global economy through supply chains, and proposes measures for the related supply chain risk. The authors examine Thailand’s 2011 flood since it is a notable example of the impact of floods both on industries and the whole economy. The protracted floods affected the primary industrial sectors in Thailand, i.e., the automotive and electronics industries, with a devastating impact on the whole economy. The impact of natural hazards on the global supply chain is increasing. However, the impact on each firm that is exposed is different depending on how well they are prepared and how they respond to the risks. Designing supply chains in a more resilient way will ultimately reduce risks to the economy. Comparing different supply chains and industries’ structure in Thailand, this study identifies the factors in private investment decision-making, such as locations of facilities, alternate locations of production, the diversified sources of procurement, emergent assistance from other partner companies in the same supply chain, and degree of the recovery of customers and proposes a hypothesis and related questions for future research. |
| [12] | . Efficiently reducing natural hazard risks requires a thorough understanding of the costs of natural hazards. Current methods to assess these costs employ a variety of terminologies and approaches for different types of natural hazards and different impacted sectors. This may impede efforts to ascertain comprehensive and comparable cost figures. In order to strengthen the role of cost assessments in the development of integrated natural hazard management, a review of existing cost assessment approaches was undertaken. This review considers droughts, floods, coastal and Alpine hazards, and examines different cost types, namely direct tangible damages, losses due to business interruption, indirect damages, intangible effects, and the costs of risk mitigation. This paper provides an overview of the state-of-the-art cost assessment approaches and discusses key knowledge gaps. It shows that the application of cost assessments in practice is often incomplete and biased, as direct costs receive a relatively large amount of attention, while intangible and indirect effects are rarely considered. Furthermore, all parts of cost assessment entail considerable uncertainties due to insufficient or highly aggregated data sources, along with a lack of knowledge about the processes leading to damage and thus the appropriate models required. Recommendations are provided on how to reduce or handle these uncertainties by improving data sources and cost assessment methods. Further recommendations address how risk dynamics due to climate and socio-economic change can be better considered, how costs are distributed and risks transferred, and in what ways cost assessment can function as part of decision support. |
| [13] | |
| [14] | . This article proposes a theoretical framework to investigate economic robustness to exogenous shocks such as natural disasters. It is based on a dynamic model that represents a regional economy as a network of production units through the disaggregation of sectorscale Input-Output tables. Results suggest that disaster-related output losses depend on direct losses heterogeneity and on the economic network structure. Two aggregate indexes, concentration and clustering, appear as important drivers of economic robustness, offering opportunities for robustness-enhancing strategies. Modern industrial organization seems to reduce short-term robustness in a trade-off against higher efficiency in normal times. |
| [15] | . |
| [16] | . . |
| [17] | . Increasingly, scholars recognize the importance of understanding supply network disruptions . However, the literature still lacks a clear conceptualization of a network-level understanding of supply disruptions. Not having a network level understanding of supply disruptions prevents firms from fully mitigating the negative effects of a supply disruption. Graph theory helps to conceptualize a supply network and differentiate between disruptions at the node/arc level vs. network level. The structure of a supply network consists of a collection of nodes (facilities) and the connecting arcs (transportation). From this perspective, small events that disrupt a node or arc in the network can have major consequences for the network. A failure in a node or arc can potentially stop the flow of material across network. This study conceptualizes supply network disruption and resilience by examining the structural relationships among entities in the network. We compare four fundamental supply network structures to help understand supply network disruption and resilience. The analysis shows that node/arc-level disruptions do not necessarily lead to network-level disruptions, and demonstrates the importance of differentiating a node/arc disruption vs. a network disruption. The results also indicate that network structure significantly determines the likelihood of disruption. In general, different structural relationships among network entities have different levels of resilience. More specifically, resilience improves when the structural relationships in a network follow the power-law . This paper not only offers a new perspective of supply network disruption, but also suggests a useful analytical approach to assessing supply network structures for resilience. |
| [18] | . There are numerous examples of supply chain disruptions that have occurred which have had devastating impacts not only on a single firm but also on various other firms in the supply network. We utilize a Bayesian Network (BN) approach and develop a model of risk propagation in a supply network. The model takes into account the inter-dependencies among different risks, as well as the idiosyncrasies of a supply chain network structure. Specific risk measures are derived from this model and a simulation study is utilized to illustrate how these measures can be used in a supply chain setting. |
| [19] | [D]. . |
| [20] | . Abstract Two large disasters which occurred in 2011, the Great East Japan Earthquake and the Flood of Chao Phraya River in Thailand, reminded us of the risks of business termination and further impacts on national, regional and global economies through their supply chains. Business Continuity Planning (BCP), of some private enterprises, helped them survive these events to some extent. However, due mainly to disruption of essential resources such as energy, water, transportation and communications in the area of disasters, revealed finally that individual BCP was insufficient to continue their business or quickly recover. |
| [21] | |
| [22] | |
| [23] | . . |
| [24] | . <h2 class="secHeading" id="section_abstract">Abstract</h2><p id="">This paper presents several refinements in a hazard loss estimation methodology and applies it to measuring business interruption losses from utility lifeline disruptions following the Northridge Earthquake. The analysis indicates that losses are highly sensitive to business resiliency. The results are then compared with survey-based estimates in an attempt at model validation.</p> |
| [25] | . Firms are exposed to a variety of low-probability, high-impact risks that can disrupt their operations and supply chains. These risks are difficult to predict and quantify; therefore, they are difficult to manage. As a result, managers may suboptimally deploy countermeasures, leaving their firms exposed to some risks, while wasting resources to mitigate other risks that would not cause significant damage. In a three-year research engagement with Ford Motor Company, we addressed this practical need by developing a novel risk-exposure model that assesses the impact of a disruption originating anywhere in a firm supply chain. Our approach defers the need for a company to estimate the probability associated with any specific disruption risk until after it has learned the effect such a disruption will have on its operations. As a result, the company can make more informed decisions about where to focus its limited risk-management resources. We demonstrate how Ford applied this model to identify previously unrecognized risk exposures, evaluate predisruption risk-mitigation actions, and develop optimal postdisruption contingency plans, including circumstances in which the duration of the disruption is unknown. |
| [26] | . 2nd ed. [EB/OL]. , 2013-5-24. [EB/OL]. , 2013-5-24.] |
| [27] | . We conducted a questionnaire survey on damage of industrial facilities during the 2007 Niigataken Chuetsu-oki Earthquake to examine the relationship between seismic intensity and damage of facilities. We also investigated the cause of functional damage comparing a period of restoration of various damaged parts to those of functional cessation. The following conclusions are obtained. 1) In the JMA seismic intensity over 5.5, various damage were occurred in many parts of facilities. Some facilities have shut down for a week or more. 2) The factor related to functional cessation varied corresponding to requirements for performance of the facility. |
| [28] | [EB/OL]. , 2012-01-10. [EB/OL]. , 2012-01-10.] |
| [29] | . . |
| [30] | . This research aims to investigate a method for estimating the production capacity loss rate (PCLR) of industrial sectors damaged by a disaster, such as an earthquake, tsunami, or nuclear radiation, particularly the 2011 Great East Japan Earthquake. PCLR is fundamental information required to gain an understanding of economic losses caused by a disaster. In particular, this paper proposes a method of PCLR estimation that considers the two main causes of capacity losses as observed from past earthquake disasters, namely damage to production facilities and disruption of lifeline systems. To achieve the quantitative estimation of PCLR, functional fragility curves considering the relationship between production capacity and earthquake ground motion and lifeline resilience factors for capturing the impact of lifeline disruptions have been adopted, while actual recovery curves are considered mainly for damaged facilities. Through the application of this method to the case study of the 2011 Great East Japan Earthquake, the PCLR in various industrial sectors is estimated; the estimated PCLR in the manufacturing sectors are then compared to the corresponding index of industrial production. The results demonstrate that the estimated values are close to the actual production indices in the overall manufacturing sector and many of the individual sectors. |
| [31] | [EB/OL]. , 2013-03-18. [EB/OL]. , 2013-03-18.] |
| [32] | [EB/OL]. , 2013-02-01. [EB/OL]. , 2013-02-01.] |
| [33] | . The 2011 Tohoku Earthquake was huge damage to Japan, especially, along the coasts ofMiyagi, Iwate, and Fukushima. There was catastrophic damage by tsunami created by thisearthquake. Japan frequently has been affected by strong earthquake before Tohoku Earthquake.Much has been emphasized about the impacts of human and physical visible damages sincedisasters struck and there are a lot of studies about disaster in terms of seismology, meteorology,geology, structural mechanics, etc. But, the invisible damages, such as supply chain network,production system has been obstructed, not revealed. In spite of our experiences in huge disasters,we haven t tried to unveil these invisible damages. In fact, the automobile industries also suffereda great loss due to this disaster. Supplies of assemblies/products from Japan had stopped, andinterrupted other production activities in the world.In order to unveil invisible damages, this paper describes the affects to the supply chainnetwork, production system in Japanese automobile manufacturers by two disasters - the 2011Tohoku Earthquake and the 2007 Niigata Chuetsu-offshore Earthquake-. In addition, to unveilfundamental issues of their damages, there are the research questions; "Why did automobilemanufacturers immediately decide all assembly plants shutdown", "What s the difference of theimpacts by disaster and depression" and, "Is the limitation of the JIT really exists, or not". |
| [34] | . . |
| [35] | . . |
| [36] | [D]. . |
| [37] | [EB/OL]. , 2013-3-18. [EB/OL]. , 2013-3-18.] |
