 , 王岱
, 王岱Spatio-temporal variations and socio-economic driving forces of air quality in Chinese cities
LINXueqin, WANGDai通讯作者:
收稿日期:2016-03-2
修回日期:2016-06-1
网络出版日期:2016-08-25
版权声明:2016《地理学报》编辑部本文是开放获取期刊文献,在以下情况下可以自由使用:学术研究、学术交流、科研教学等,但不允许用于商业目的.
基金资助:
作者简介:
-->
展开
摘要
关键词:
Abstract
Keywords:
-->0
PDF (3146KB)元数据多维度评价相关文章收藏文章
本文引用格式导出EndNoteRisBibtex收藏本文-->
1 引言
改革开放以来,中国逐渐进入经济高速增长和城镇化快速推进时期。1978-2012年,中国国内生产总值由3645亿元增长至518942亿元,年均增速9.98%;城市化率由17.92%上升至52.57%,年均增速0.96%。经济发展和城镇化水平提升无疑推动了中国物质财富短时期内的快速积累和人民生活水平的大幅提高。同时,也造成在许多城镇化地区出现了严重的生态环境问题,尤其是大气污染、灰霾、光化学烟雾等复合型大气污染问题日益突出[1-2]。2011年秋冬中国东部及中部部分地区首次连续出现雾霾天气,2013年更是遭遇有观测记录以来最严重的污染天气[3],严重影响城市及区域的大气环境及公共健康[4-5],大气污染已经成为阻碍中国城市实现可持续发展的重要因素[6]。多尺度了解城市空气质量变化不仅有利于科学认知城市大气污染变化特征,还可以为区域性预防控制措施的制定实施提供参考借鉴。基于地理学视角的城市空气质量相关研究主要集中在两个方面:① 不同尺度及典型地区空气质量的变化特征解析。如对全国尺度[7-8]、西部工业城市[9-10]、北方典型城市[11-12]空气质量的年际变化特征,城市和乡村空气质量比较[13],以及重大节事活动期间空气质量变化特征分析[14]等。有研究认为,大气污染物浓度的地区差异主要是由于城镇化水平的不均衡发展造成的[15],在城镇化快速发展和人口密集地区,大气污染程度明显高于城镇化水平较低的区域,因此经济发达、人口密集的东部沿海地区,如京津冀、长三角、珠三角等成为研究的热点区域[16-22]。② 空气质量的影响因素研究。引起空气质量变化的因素比较复杂,已有研究大多集中在自然环境要素对空气质量变化的影响方面。如气象要素[23-24]、风场[25]、沙尘暴[26]、大雾天气[27]、城市热岛效应[28]等。一些研究关注了社会经济要素对大气环境质量的影响,如基于环境库兹涅兹曲线研究了经济增长与大气环境的非线性关系[29-30],还有****研究了城市化[31]、城市建成区、人口分布以及工业发展[32]、交通[33]、能源结构[34]以及油价变动[35]等对大气污染和空气质量的影响。在总结中国城市空气质量时空演化特征方面,现有研究已经涉及多个空间尺度和时间尺度,但缺乏对不同时空间尺度的比较分析;在对城市空气质量影响机制的阐释方面,现有成果涉及的自然—人文因素比较全面,而本文特别要关注的是社会经济要素对空气质量影响的动力机制在不同时空间尺度和不同地区的差异性。瞄准这一问题的理论意义是探索人地关系演进过程和内在机理,现实目的是为制定因地制宜的大气污染防控措施提供科学依据。
2 研究区域与研究方法
2.1 研究区域和数据来源
2012年中国颁布新的《环境空气质量标准》(GB3095-2012),空气质量监测数据由空气污染指数(Air Pollution Index, API)改为空气质量指数(Air Quality Index, AQI)。2013年京津冀、长三角、珠三角等重点区域以及直辖市和省会城市共74个城市按照新标准开始进行监测,2014年161个环境保护重点城市和国家环保模范城市开始实施新标准。本文以执行环境空气质量新标准的161个城市为研究区,采用2013-2014年月、天、小时AQI数据,运用统计分析和ArcGIS空间分析,对城市空气环境质量的时空变化特征进行分析。区域传播性和城市间输送是大气环境污染的一个重要特征,单体城市空气质量优劣受到相邻城市污染状况的影响[16, 36]。基于此,按照所属省份区位,结合经济发展水平和一体化发展特征,将研究城市划分为11个区域(表1)。鉴于海口、三亚、拉萨3市各时间尺度下AQI变化幅度较小,为规避在因素分析过程中对显著程度的平滑影响,不纳入区域划分。
Tab. 1
表1
表1中国11个区域划分及城市个数分布
Tab. 1Descriptions of the study area in China
| 区域名称 | 省(市、区) | 城市个数 | 区域名称 | 省(市、区) | 城市个数 |
|---|---|---|---|---|---|
| 京津冀地区 | 北京、天津、河北 | 13 | 长三角地区 | 上海、浙江、江苏 | 25 |
| 珠三角地区 | 广东 | 21 | 山东半岛地区 | 山东 | 17 |
| 东北地区 | 吉林、辽宁、黑龙江 | 16 | 长江中游地区 | 湖南、湖北、安徽、江西 | 14 |
| 黄河中游地区 | 山西、河南、陕西、内蒙古 | 22 | 海峡西岸地区 | 福建 | 3 |
| 长江上游地区 | 四川、重庆 | 9 | 南贵昆地区 | 贵州、云南、广西 | 9 |
| 西北地区 | 甘肃、青海、宁夏、新疆 | 9 |
新窗口打开
研究数据中,空气质量数据包括中国环境监测统计总站发布的2013-2014年74个城市每月空气质量综合指数(Air Quality Composite Index, AQCI),环境保护部数据中心发布的2014年1-12月161个城市每日空气质量指数(AQI),新浪微博号“中国城市空气污染排行”播报的74个城市2013-2014年每日及每小时空气质量数据。社会经济发展数据主要来自《2014年中国城市统计年鉴》、《2013年中国城市建设统计年鉴》、全国及各省(市、区)《第二次全国科学研究与试验发展(R&D)资源清查主要数据公报》,以及各省(市、区)2012年统计年鉴。
2.2 空气质量空间效应检验模型
2.2.1 全局自相关模型 采用全局自相关描述城市单元空气质量变化的整体分布状况,以判断城市空气质量变化在空间上是否存在集聚性,通常用的检验统计量有Global Moran's I指数[37-38],计算公式如下:式中:xi、xj分别为城市单元i和j的空气质量观测值;n为城市总数;Wij为空间权重,采用邻接标准来定义,即当i和j邻接时,Wij = 1,否则Wij = 0;i = 1, 2,…, n;j = 1, 2,…, m,
Global Moran's I取值范围介于-1~1之间,通过I值可以判断区域城市空气质量水平的集聚程度。I > 0时表示空间正相关,即区域城市空气质量呈集聚分布,I < 0时表示空间负相关,即区域城市空气质量呈扩散或均匀分布,当I = 0时表示空间不相关,即城市空气质量呈无规律的随机分布。显著性检验可使用标准化统计量Z检验来实现,计算公式如下:
当选用95%的置信水平时,|Z| > 1.96,表示空间自相关显著。
2.2.2 局域自相关模型 局域自相关分析可以用来度量局部空间单元相对于整体研究范围空间自相关的影响程度,即一个区域单元的空气质量与邻近单元上空气质量特征的相关程度,计算公式如下:
式中:xi、xj分别为城市i和j的空气质量观测值;n为城市个数;Wij为空间权重,i = 1, 2,…, n,j = 1, 2,…, m,m为与城市i地理上相邻接的城市个数。局域自相关空间关联模式划分为H-H、H-L、L-H和L-L 4种类型,其空间含义分别为:H-H(L-L)集聚型表示局部Moran's I为正值,表示城市空气质量与其相邻城市空气质量之间存在正的空间自相关,即高水平(或低水平)空气质量城市在空间上集聚;H-L(L-H)集聚型表示局部Moran's I为负值,表示城市与其相邻城市之间存在负的空间自相关,即高水平(或低水平)空气质量城市被低水平(或高水平)空气质量城市包围。
2.3 基于空间效应的城市空气质量驱动力模型
2.3.1 基本模型设定 根据已有理论和实证研究成果,选取人口密度(X1)、人均GDP(X2)、城市化水平(X3)、工业产值占GDP比重(X4)、能源消耗总量(X5)、民用汽车总量(X6)、环保投资额占GDP比重(X7)、R&D经费支出占GDP比重(X8),对应探究人口集聚、经济发展、城市化、工业化、能源消耗、社会发展、环境规制、技术进步等对城市空气质量变化的影响。从区域发展长时期的过程看,经济发展、城市化与生态环境之间存在非线性的倒“U”型曲线关系[29-30, 39]。本文根据当前中国的发展阶段,初步假设:在短时期内,人口集聚、经济发展、城市化、工业化、能源消耗、社会发展、环境规制、技术进步与城市空气质量存在线性相关关系。基于此,设定基本分析模型如下:式中:Y为空气质量指数;X1, …, X8依次分别为人口密度、人均GDP、城市化水平、工业增加值占GDP比重、能源消耗总量、民用汽车总量、环保投资额占GDP比重、R&D经费支出占GDP比重;α[α0, α1, …, α8]为待估计的模型参数;ε为模型的误差随机项,服从正态分布,N(0, σ2)。对空气质量指数、人口密度(X1)、人均GDP(X2)、能源消耗总量(X5)、民用汽车总量(X6)取自然对数,以减小异方差对模型估计的影响[40]。
2.3.2 空间效应模型设定 在现实生活中,城市空气质量并不是一个完全独立的观测值,其变化受到周边区域的影响,因此不能忽略空间效应。考虑空间效应的计量回归模型主要有空间滞后模型(SLM)和空间误差模型(SEM)两种[41]。在进行空间模型选择时,需要采用最小二乘法(OLS)估计考虑空间相关性的约束模型,通过比较拉格朗日乘数的显著性确定模型选择。若拉格朗日乘数LM(lag)比LM(error)在统计上显著,且R-LM(lag)比R-LM(error)显著,则选择空间滞后模型进行分析,基于基本模型的空间滞后模型表达式为:
式中:Y为空气质量指数;ρ为空间回归系数;W为n ×1阶的空间权值矩阵;X1, …, X8分别为8个自变量;α[α0, α1, …, α8]为待估计的模型参数;ε为误差随机项。
若拉格朗日乘数LM(error)比LM(lag)在统计上显著,且R-LM(error)比R-LM(lag)显著,则选择空间误差模型进行分析,基于基本模型的空间误差模型表达式为:
式中:Y为空气质量指数;λ为空间误差系数;W为n ×1阶的空间权值矩阵;X1, …, X8为8个自变量;α[α0, α1, …, α8]为待估计的模型参数;ε为误差随机项;μ为正态分布的随机误差向量。由于空间回归模型自变量的内生性,采用极大似然法对模型参数进行估计。空间距离权重计算和空间模型运行均在GeoDa软件中进行[41]。
3 结果分析
3.1 中国城市空气质量的时空演化特征
3.1.1 城市空气质量整体恶化,高污染区域恶化态势明显 比较2013年和2014年中国74个城市空气质量综合指数(AQCI),剖析城市空气质量的年度变化特征。从全国尺度看,2013年全国AQCI年度均值为4.46,2014年升至6.08;比较两年的月度均值,仅1月有小幅下降,其他月份明显上升,说明74个城市空气质量呈整体恶化趋势。两年AQCI月度变化轨迹基本相似,1月均值全年最高,之后持续下降,8-9月进入低谷,之后逐月上升。从区域层面看,11个区域2014年AQCI年度均值都高于2013年,其中珠三角、南贵昆、长江上游、海峡西岸4个地区2014年所有月度均值都大于2013年同期(图1)。各区域AQCI月度均值也基本遵循了“冬高夏低、春降秋升”的变化轨迹。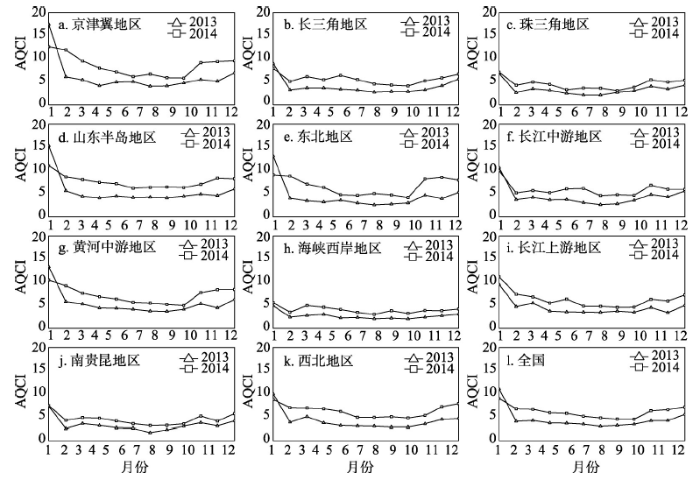 显示原图|下载原图ZIP|生成PPT
图12013年和2014年全国及各区域空气质量综合指数(AQCI)月际变化
-->Fig. 1Monthly variations in air quality comprehensive index (AQCI) in China in 2013 and 2014
-->
分地区比较AQCI年度均值,高值区包括京津冀、山东半岛、东北、黄河中游等地区,低值区包括珠三角、海峡西岸和南贵昆地区,北方地区空气质量显著较南方差。采用差异系数对11个区域AQCI年度均值变化强度进行度量,空气质量恶化幅度较大的依次为东北地区(0.6063)、西北地区(0.5221)、京津冀地区(0.4897)、海峡西岸地区(0.4882)、山东半岛地区(0.4615)、长三角地区(0.4333)和黄河中游地区(0.4040),基本集中在AQCI高值区。换言之,空气污染程度越严重的地区,恶化趋势越明显,已经呈现恶性循环之势。
3.1.2 城市空气质量达标天数比例提高,但空气污染程度加重 2013年中国城市平均达标天数比例为60.5%,轻度和中度污染占30.90%,重度及严重污染占8.6%。2014年中国城市平均达标天数比例为66.03%,与2013年相比上升5.53个百分点,轻度和中度污染占28.37%,重度及以上污染天数比例为5.6%。两年比较,各级别污染天数均有所下降,空气质量达标天数增多,达标天数比例提高。但2014年全国AQCI年度均值较2013年有所上升,这说明相应区间空气质量污染程度增强,重污染天气尚未得到有效遏制。
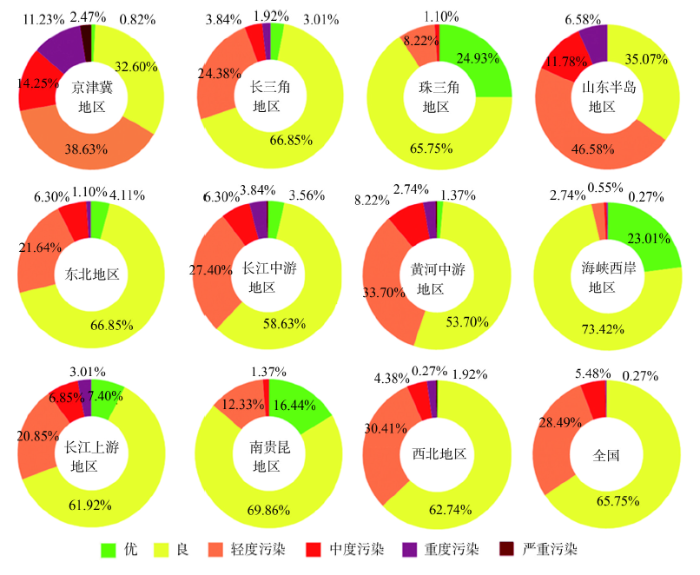
根据《环境空气质量指数(AQI)技术规定(试行)》(HJ633-2012),空气污染指数划分为6档,即0 < AQI < 50,空气质量为优;51 < AQI < 100,空气质量为良;101 < AQI < 150,空气质量为轻度污染;151 < AQI < 200,空气质量为中度污染;201 <AQI < 300,空气质量为重度污染;AQI > 300,空气质量为严重污染。分别统计2014年1-12月不同区域不同污染程度天数在全年的占比(图2),可以看出污染天数占全年天数比例由大到小依次为京津冀、山东半岛、黄河中游、长江中游、西北、长江上游、长三角、东北地区、南贵昆、珠三角和海峡西岸地区,占比分别为66.58%、64.93%、44.93%、38%、37%、31%、30.14%、29.04%、14%、9.32%和4%。京津冀地区各级别污染天数占比均远高于全国平均水平,为全国污染最严重的地区;其次是山东半岛地区,各级别污染天数占比仅比京津冀地区低2.47%。
 显示原图|下载原图ZIP|生成PPT
图22014年全国及各区域空气质量等级天数占比
-->Fig. 2The proportions of days with different air quality levels at national and regional scales in China in 2014
-->
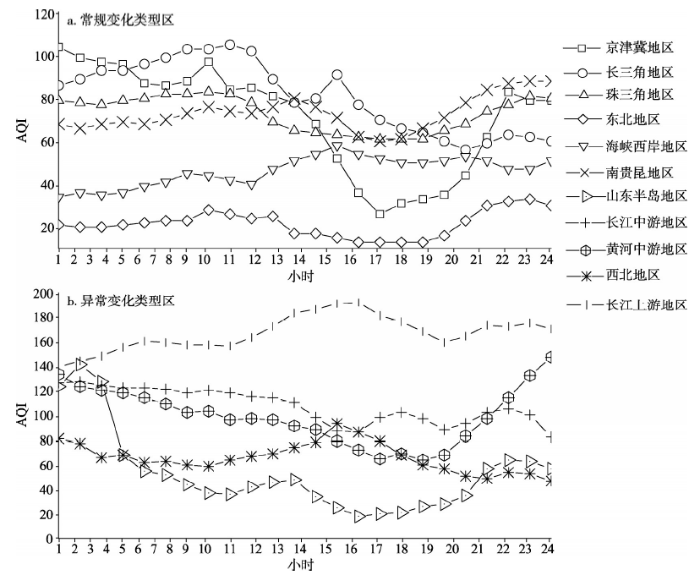
3.1.3 城市空气质量变化与地区社会经济活动表现出一定的时间耦合性 为了最大限度消除春季沙尘天气、夏季降水以及冬季北方供暖等影响,以2014年10月2日为例,对各地区城市空气质量24小时变化特征进行分析(图3)。根据全天AQI变化轨迹,可将11个地区划分为两种类型。一种为常规变化类型区,对应地区生产生活活动“日出而作、日落而息”的特征,城市空气质量基本表现为“日出趋差、日落趋优”。这类地区主要包括京津冀、长三角、珠三角、东北、海峡西岸和南贵昆地区。早晨6-8时和下午18-20时受上下班集中出行影响,城市AQI指数持续增大。京津冀、长三角、珠三角地区全天AQI峰值在早晨8-9点,海峡西岸地区全天AQI峰值在中午14点,东北和南贵昆地区全天AQI峰值在晚上23点。第二种为异常变化类型区,主要包括山东半岛、长江中游、黄河中游、西北和长江上游地区。这种类型区早晚出行高峰时段的AQI指数变化并不突出,绝大部分地区全天AQI峰值出现在深夜,如山东半岛、长江中游、黄河中游地区峰值出现在凌晨12-2时。排除西北地区时差的因素,应该关注地区产业结构对空气质量变化的影响。山东半岛、长江中游、黄河中游等地区是全国沿海、沿江重化工产业的重点集聚区,迫于减排压力,夜间工业生产活动频繁,工业排放加大等可能成为导致城市空气质量下降的因素。
 显示原图|下载原图ZIP|生成PPT
图32014年10月2日中国不同区域空气质量指数(AQI) 24小时变化
-->Fig. 3The hourly variations of AQI on 2nd October, 2014 in different regions
-->
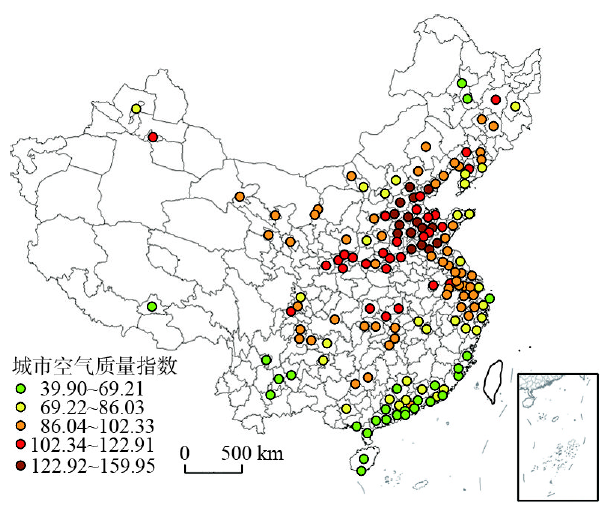
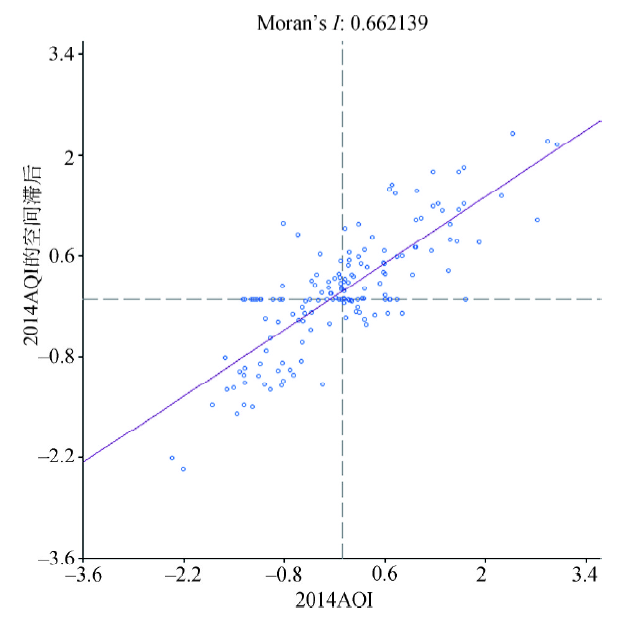
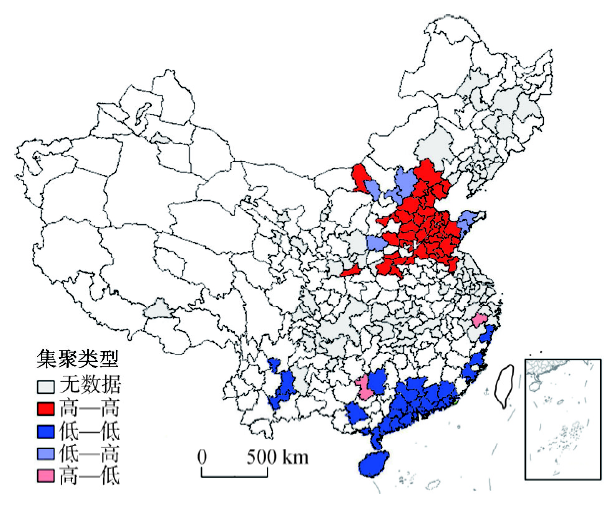
3.1.4 城市空气污染表现出“东重西轻、北重南轻”的空间格局,区域一体化态势明显 比对分析中国161个城市2014年AQI均值的空间分布,总体呈现由沿海向内陆、由北方到南方逐渐降低的态势,高值城市集聚分布在东部沿海和黄河沿线,京津冀地区城市总体最高(图4)。从污染较为严重的东部沿海地区内部看,靠近海洋的城市AQI指数较远离海洋的城市AQI指数低。如天津的AQI指数低于北京和石家庄,上海的AQI指数低于南京和杭州,珠海和深圳的AQI指数低于广州,说明临海性对城市空气质量具有重要影响。进行161个城市空气质量的全局空间自相关分析(图5),Moran's I指数为0.6621,通过0.05水平的显著性检验,表明全国城市空气质量呈现显著的正相关性,即AQI指数分布呈现显著的高值区和高值区邻近、低值区和低值区邻近的集聚态势。进一步进行空间局域自相关分析(图6),得出京津冀、山东半岛、辽东半岛、中原城市群等是AQI指数高—高“热点”的集中区域,珠三角、海峡西岸、海南等是低—低“冷点”的集中区域,被AQI高值区所包围的低值区(低—高“异质点”)较少,主要分布在京津冀、山东半岛周边,被AQI低值所包围的高值区(“高—低”异质点)主要分布在南贵昆和长三角地区。可以看出,当前中国城市大气污染区域一体化态势明显,大气污染治理的区域联防联控越发重要。
 显示原图|下载原图ZIP|生成PPT
图42014年中国城市空气质量指数(AQI)空间分异
-->Fig. 4Spatial patterns of AQI in Chinese cities in 2014
-->
 显示原图|下载原图ZIP|生成PPT
图52014年中国城市空气质量指数(AQI)全局自相关图
-->Fig. 5Global autocorrelation of AQI in Chinese cities in 2014
-->
 显示原图|下载原图ZIP|生成PPT
图62014年中国城市空气质量指数(AQI)局域自相关图
-->Fig. 6Local autocorrelations of AQI in Chinese cities in 2014
-->
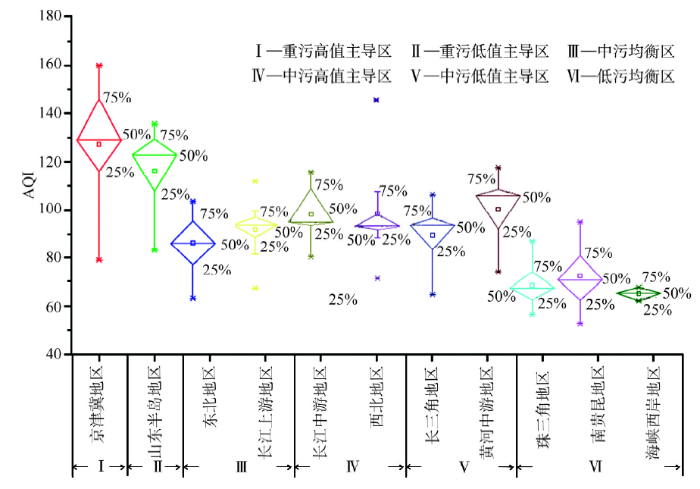
3.1.5 区域城市空气污染的总体程度和分布结构具备明显的分异特征 绘制2014年各地区城市AQI指数BOX分布图(图7),根据AQI指数散布范围和分布形态,将城市空气质量分布形态划分为6种类型。第一类是重污高值主导区,京津冀地区属于该类。这类地区AQI均值居11个地区之首,区域内AQI均值以上城市个数大于AQI均值以下个数,表明区域污染一体化态势明显。这类地区单一城市空气污染防控收效甚微,必须建立跨行政区的空气污染联防联控机制。第二类是重污低值主导区,山东半岛地区属于该类。这类地区AQI均值高,区域内AQI均值以上城市个数小于AQI均值以下个数。这类地区城市大气污染扩散效应显著,少数污染严重城市对区域空气污染加重和一体化影响显著。针对这类地区,除了要加强区域联防联控,还要突出重点城市的综合整治。第三类是中污均衡区,东北和长江上游地区属于该类。这类地区AQI均值较高,均值以上城市个数和均值以下城市个数基本持平,呈均衡分布态势。第四类是中污高值主导区,长江中游和西北地区属于该类。第五类是中污低值主导区,长三角和黄河中游地区属于该类。这3类地区整体的空气质量处于临界状态,污染防治应根据城市空气污染的分布形态,处理好整体推进和重点突破的关系,重点污染城市整治和污染扩散预警并重,及时控制区域空气质量的恶化。第六类是低污均衡区,包括珠三角、南贵昆和海峡西岸3个地区。这类地区大气污染程度较低,污染治理应坚持“预防为主,防治结合”的原则,推动区域大气环境质量的保持和持续改善。结合各类地区的发展阶段,初步判断区域空气污染形成和演化路径为:“重点城市污染加重—重点城市污染扩散—区域整体污染加重—重点城市引领治污—区域污染联防联控—区域整体污染减轻”。
 显示原图|下载原图ZIP|生成PPT
图72014年中国不同区域空气质量指数BOX分布
-->Fig. 7The statistical distributions of AQI in different regions in China in 2014
-->
3.2 中国城市空气质量演化的社会经济驱动力
3.2.1 城市空气质量演化的社会经济因素解析 采用2014年161个城市AQI指数和2013年各城市社会经济数据,根据前述公式设定,分析城市空气质量变化的社会经济驱动力。进行全局自相关检验,Moran's I指数为0.6621,呈显著空间相关性。在SPSS中分析各自变量之间的相关性,发现相关系数均小于0.8,然后采用最小二乘法(OLS)对模型进行估计,发现每个变量的方差膨胀因子(VIF)均小于3.5(远小于临界值10),表明模型不存在多重共线性的问题[40]。采用最小二乘法(OLS)估计考虑空间相关性的约束模型,发现拉格朗日乘数LM(lag)比LM(error)在统计上更显著,且稳健的R-LM(lag)比R-LM(error)更显著,故选择空间滞后模型进行分析,模型估计结果如表2所示。OLS估计中R2为0.284,空间滞后模型估计中R2为0.691,可见考虑空间相关性显著地提高了模型的拟合程度。从空间滞后模型结果可以看出,在综合考虑人口集聚、经济发展、城市化、工业化、能源消耗、社会发展、环境规制和技术进步等因素的前提下,人口密度、城市化、民用汽车拥有量和环保投资对中国城市空气质量变化没有显著的影响,能源消耗总量、工业增加值占GDP比重、R&D经费占GDP比重与城市AQI呈显著正相关,三者每提高1%,AQI上升0.265%和0.108%和0.104%。以煤炭资源为主的能源消耗是造成大气环境恶化的重要因素。技术进步表现出与大气环境恶化的协同增长效应,这一点在很多研究中已得到验证,即“回弹效应”[42]。人均GDP与AQI指数呈显著负相关,人均GDP每提高1%,AQI下降0.242%,城市空气质量好转,即经济发展促进城市大气环境改善。从西方发达国家经验来看,人均GDP达到6000~8000美元是环境质量变好的临界点。2013年中国城市人均GDP达到6880美元,进入环境质量正向转化的临界值范围。根据全国人均GDP与161个城市AQI指数的相关性分析判断,经济发展与大气环境演化的关系已通过环境库兹涅兹曲线顶点,但由于中国区域差距非常大,在不同发展阶段的区域,经济发展对空气质量的影响方向和强度应该存在较大差异。Tab. 2
表2
表22014年中国城市空气质量的社会经济影响因素解析
Tab. 2Estimation results of the socio-economic factors of AQI at the national level in China in 2014
| 自变量系数 | OLS模型 | 空间滞后模型 | |||
|---|---|---|---|---|---|
| 系数值 | T值 | 系数值 | Z值 | ||
| α0 | 0.001 | 0.012 | -0.055*** | -1.193 | |
| α1人口密度 | 0.062 | 0.767 | 0.038 | 0.691 | |
| α2人均GDP | -0.427*** | -4.155 | -0.242*** | -3.518 | |
| α3城市化 | -0.011 | -0.140 | -0.019 | -0.356 | |
| α4工业化 | 0.200** | 2.303 | 0.108* | 1.892 | |
| α5能源消耗 | 0.458*** | 3.711 | 0.265*** | 3.322 | |
| α6民用汽车 | 0.056 | 0.413 | 0.079 | 0.908 | |
| α7环保投资 | -0.107 | -1.363 | -0.066 | -1.306 | |
| α8R&D经费 | 0.199** | 2.035 | 0.104* | 1.645 | |
| ε | — | — | 0.657*** | 13.967 | |
| R2 | 0.284 | — | 0.691 | — | |
| 对数似然值 | — | — | -133.578 | — | |
新窗口打开
3.2.2 区域城市空气质量演化的社会经济因素分异 为了避免样本数较少带来的模型不稳定性,综合考虑污染程度、经济发展阶段以及区位分布等因素,选取京津冀、长三角、珠三角和山东半岛4个地区进行分析。自变量选择在全国层面显著的经济增长、能源消耗、工业化、技术进步4个指标。经检验,4个地区均适用空间滞后模型,模型估计结果如表3所示。
Tab. 3
表3
表32014年中国区域城市空气质量指数的社会经济影响因素
Tab. 3Estimation results of the socio-economic factors of AQI in different regions in China in 2014
| 自变量 系数 | M京津冀 | M长三角 | M珠三角 | M山东半岛 | 全国 | |||||||||
|---|---|---|---|---|---|---|---|---|---|---|---|---|---|---|
| 系数值 | Z值 | 系数值 | Z值 | 系数值 | Z值 | 系数值 | Z值 | 系数值 | Z值 | |||||
| α0 | -0.042 | -0.388 | -0.244* | -1.785 | -0.004 | -0.022 | -0.033 | -0.260 | -0.055 | -1.166 | ||||
| α2人均GDP | -0.416* | -1.893 | -0.994*** | -3.646 | 0.414 | 0.883 | -0.457** | -2.213 | -0.252*** | -3.814 | ||||
| α4工业化 | 1.255*** | 5.014 | 0.375*** | 2.580 | 0.179 | 0.854 | 0.237 | 1.430 | 0.104** | 2.097 | ||||
| α5能源消耗 | -0.195 | -0.832 | 0.404* | 1.792 | 0.545* | 1.705 | 0.217 | 1.353 | 0.330*** | 5.566 | ||||
| α8R&D经费 | 1.644*** | 5.595 | 0.953*** | 3.010 | -0.731* | -1.777 | 0.142 | 0.749 | 0.121** | 1.961 | ||||
| ε | 0.623*** | 3.667 | 0.312* | 1.742 | 0.082*** | 0.301 | 0.751*** | 5.395 | 0.658*** | 13.870 | ||||
| R2 | 0.850 | — | 0.549 | — | 0.279 | — | 0.711 | — | 0.682 | — | ||||
| 对数似然值 | -6.516 | — | -25.476 | — | -25.869 | — | -14.809 | — | -135.697 | — | ||||
新窗口打开
京津冀地区R&D经费占GDP比重、工业增加值占GDP比重与AQI呈显著正相关,即指标值增大,AQI增大,大气环境质量下降。两个指标每提高1%,城市AQI分别增大1.644%和1.255%。人均GDP与AQI呈负相关,即指标值增大,AQI减小,大气环境好转。人均GDP每提高1%,AQI下降0.416%。2013年京津冀地区人均GDP达到8548美元,城市化水平也处于全国城市发展的高值[43],可以初步判断经济发展和生态环境关系已通过库兹涅兹曲线拐点。长三角地区R&D经费占GDP比重、能源消耗、工业化与AQI呈正相关,这些指标每提高1%,AQI指数分别增大0.953%、0.404%、0.375%。人均GDP与AQI呈负相关,指标值每提高1%,AQI下降0.994%。2013年长三角地区人均GDP达13052美元,可以初步判断经济发展和生态环境关系已通过库兹涅兹曲线拐点。珠三角地区能源消耗与AQI呈显著正相关,能源消耗每增加1%,AQI指数增大0.545%;R&D经费占GDP比重与AQI呈显著负相关,指标值每增大1%,AQI减小0.731%。从技术进步的阶段性规律看,技术发展水平越高,全要素生产效率越高,资源利用效率越高,单位产出污染排放越低。广东是中国高新技术产业发展水平最高的地区之一[44],技术进步的资源环境改善效应显著。山东半岛地区人均GDP与AQI呈显著负相关,人均GDP每增加1%,AQI减小0.457%。
3.2.3 中国城市空气质量演化的社会经济驱动规律 综合以上认为,在全国层面,在同时考虑人口集聚、经济增长、城市哈、工业化、能源消耗、社会发展、环境规制、技术进步等要素前提下,经济发展、工业化、能源消耗和技术进步4个要素表现出与城市空气质量变化之间显著的相关性。其中,经济发展表现为对大气环境质量改善的正向效应,工业化、能源消耗和技术进步表现为对大气环境质量改善的负向效应。
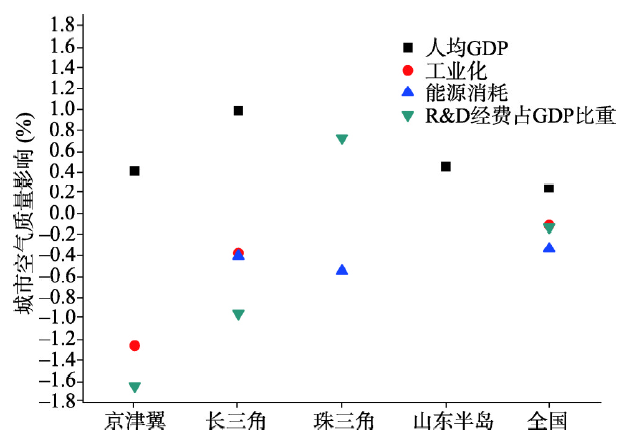
在区域层面,由于社会经济发展条件的差异,4个要素对城市空气质量影响的显著程度、影响方向和强度存在差异。经济发展表现出对城市空气质量改善的正向推动作用,并且人均GDP越高的地区,经济发展对城市空气质量改善的正向推动作用越大。工业化、能源消耗表现出对城市空气质量改善的负向效应,工业增加值占GDP比重越低,工业发展对空气质量的负向效应越大(图8)。
 显示原图|下载原图ZIP|生成PPT
图8中国不同区域城市空气质量的社会经济影响因素示意
注:正值表示对空气质量改善的正向效应,负值表示负向效应。
-->Fig. 8Socio-economic factors of air quality in different regions in China
-->
技术进步在不同发展阶段对空气质量改善的作用方向和作用强度差异明显。在京津冀、长三角和全国,R&D经费支出占GDP比重与城市空气质量呈显著负相关,并且负向影响程度依次减小。在珠三角地区,R&D经费支出占GDP比重与城市空气质量呈显著正相关。结合不同地区的技术发展水平可以判断:在经济发达地区,技术进步在推动资源利用效率提高的同时,导致地区生产活动规模扩大,资源能源需求增加,进而对大气环境产生负向影响。在经济不发达地区,技术进步推动经济发展方式由粗放向集约转化,对环境改善的负向效应较小。
4 结论与讨论
4.1 结论
(1)比较2013年和2014年各类空气质量指数显示,中国城市空气质量显著下降,空气质量差的区域恶化态势更明显;城市空气质量达标天数比例有所提高,但天气污染程度增强;城市空气质量变化与地区社会经济活动表现出一定的时间耦合性;城市空气污染表现出“东重西轻、北重南轻”的空间格局,区域一体化态势明显;区域城市空气污染的总体程度和分布结构具备明显的分异特征,区域空气污染形成和演化路径可基本归纳为:“重点城市污染加重—重点城市污染扩散—区域整体污染加重—重点城市引领治污—区域污染联防联控—区域整体污染减轻”。(2)解析中国城市空气质量变化的社会经济驱动力,从全国层面看,能源消耗、工业化和技术进步是推动城市空气质量恶化的重要因素,经济发展对城市空气质量改善具有显著的推动作用。受各地区资源环境基础和社会经济发展阶段影响,各类社会经济因素对城市空气质量改善的驱动方向和驱动强度有所不同。
(3)根据人均GDP与案例城市AQI指数的相关性分析判断,全国层面以及部分发达地区经济发展与大气环境演化的关系已通过环境库兹涅兹曲线顶点,人均GDP越高的地区,经济发展对城市空气质量改善的正向推动作用越大。在发达地区,技术进步对大气环境产生的负向影响明显;在不发达地区,技术进步对环境改善的负向影响较小。
4.2 讨论
社会经济发展是造成空气质量恶化的关键因素,这一点已经达成广泛共识,诸多研究也证实了这一点。但是从本研究的分析结果看,随着经济发展和城镇化水平的提高,社会经济因素对空气质量的影响与地区发展阶段相适应,呈现显著的阶段性特征,不同阶段各社会经济要素对大气环境的影响存在质和量的差异。即使在社会经济发展水平相近的地区,受地区资源环境基础等多重因素复杂机制的影响,社会经济要素对空气质量的影响方向和强度也存在显著差异。因此,讨论遏制空气质量恶化的手段,不等于要全面遏制经济发展和城镇化水平提升,需要在比较解析社会经济因素与空气质量相关性的基础上,立足区域发展现状特征和资源环境基础,遴选关键要素,确定整治重点和导向。中国经济发展和环境变化之间确实存在环境库兹涅兹倒“U”型曲线关系,且当前大部分地区仍未通过倒“U”型曲线的拐点。换言之,未来相当长的一段时期内,经济发展对生态环境的胁迫和阻滞作用都可能存在。因此如何在短时期内使大部分地区的发展水平跨过曲线拐点是化解经济发展与空气质量恶化矛盾的关键。在这一过程中,最大限度化解经济发展导致的负面影响,关键问题是彻底转变经济发展方式,依靠科技和创新驱动,尽快建立资源节约和环境友好型发展模式,实现经济发展与环境之间的相互促进和协调发展。
受样本数量限制,对中国城市空气质量变化的社会经济驱动规律的总结分析,仅基于全国和若干案例区的实证分析结果。全面验证社会经济发展对空气质量的影响是一个系统工程,需要长期稳定的数据积累和持续的方法创新。
The authors have declared that no competing interests exist.
参考文献 原文顺序
文献年度倒序
文中引用次数倒序
被引期刊影响因子
| [1] | . <h2 class="secHeading" id="section_abstract">Abstract</h2><p id="">Due to its rapidly expanding economic and industrial developments, China is currently considered to be the engine of the world's economic growth. China's economic growth has been accompanied by an expansion of the urban area population and the emergence of a number of mega cities since the 1990. This expansion has resulted in tremendous increases in energy consumption, emissions of air pollutants and the number of poor air quality days in mega cities and their immediate vicinities. Air pollution has become one of the top environmental concerns in China. Currently, Beijing, Shanghai, and the Pearl River Delta region including Guangzhou, Shenzhen and Hong Kong, and their immediate vicinities are the most economically vibrant regions in China. They accounted for about 20% of the total GDP in China in 2005. These are also areas where many air pollution studies have been conducted, especially over the last 6 years. Based on these previous studies, this review presents the current state of understanding of the air pollution problems in China's mega cities and identifies the immediate challenges to understanding and controlling air pollution in these densely populated areas.</p> |
| [2] | . This study was designed to assess the association between visibility and air quality, and to determine whether the variations in daily mortality were associated with fluctuations in visibility levels in Shanghai, China. Mortality data were extracted from the death certificates, provided by Shanghai Municipal Center of Disease Control and Prevention, and visibility data were obtained from Shanghai Municipal Bureau of Meteorology. Air quality data (PM(10), PM(2.5), PM(10-2.5), SO(2), NO(2) and O(3)) were obtained from Shanghai Environmental Monitoring Center. Generalized additive model (GAM) with penalized splines was used to analyze the mortality, visibility, air pollution, and covariate data. Among various pollutants, PM(2.5) showed strongest correlation with visibility. Visibility, together with humidity, was found appropriate in predicting PM(2.5) (R-squared: 0.64) and PM(10) (R-squared: 0.62). Decreased visibility was significantly associated with elevated death rates from all causes and from cardiovascular disease in Shanghai; one inter-quartile range (8 km) decrease in visibility corresponded to 2.17% (95%CI: 0.46%, 3.85%), 3.36% (95%CI: 0.96%, 5.70%), and 3.02% (95%CI: -1.32%, 7.17%) increase of total, cardiovascular and respiratory mortality, respectively. The effect estimates using predicted PM(2.5) and PM(10) concentrations were similar to those assessed using actual concentrations. This is the first study in Mainland China assessing the association between visibility and adverse health outcomes. Our findings suggest the possibility of using visibility as a surrogate of air quality in health research in developing countries where air pollution data might be scarce and not routinely monitored. |
| [3] | . Using size-resolved filter sampling and chemical characterization, high concentrations of water-soluble ions, carbonaceous species and heavy metals were found in both fine (PM 2.1 ) and coarse (PM 2.1–9 ) particles in Beijing during haze events in early 2013. Even on clear days, average mass concentration of submicron particles (PM 1.1 ) was several times higher than that previously measured in most of abroad urban areas. A high concentration of particulate matter on haze days weakens the incident solar radiation, which reduces the generation rate of secondary organic carbon in PM 1.1 . We show that the peak mass concentration of particles shifted from 0.43–0.6502μm on clear days to 0.65–1.102μm on lightly polluted days and to 1.1–2.102μm on heavily polluted days. The peak shifts were also found for the following species: organic carbon, elemental carbon, NH 4 + , SO 4 261 , NO 3 61 , K, Cu, Zn, Cd and Pb. Our findings demonstrate that secondary inorganic aerosols (36%) and organic matter (26%) dominated the fine particle mass on heavily polluted days, while their contribution reduced to 29% and 18%, respectively, on clear days. Besides fine particles, anthropogenic chemical species also substantially accumulated in the coarse mode, which suggests that particles with aerodynamic diameter larger than 2.102μm cannot be neglected during severe haze events. |
| [4] | . <h2 class="secHeading" id="section_abstract">Abstract</h2><p id="">Almost every home and office contains a portrayal of a scenic landscape whether on a calendar, postcard, photograph, or painting. The most sought after locations boast a scenic landscape right outside their window. No matter what the scene – mountains, skyscrapers, clouds, or pastureland – clarity and vividness are essential to the image. Air pollution can degrade scenic vistas, and in extreme cases, completely obscure them. Particulate matter suspended in the air is the main cause of visibility degradation. Particulate matter affects visibility in multiple ways: obscures distant objects, drains the contrast from a scene, and discolors the sky. Visibility is an environmental quality that is valued for aesthetic reasons that are difficult to express or quantify. Human psychology and physiology are sensitive to visual input. Visibility has been monitored throughout the world but there are few places where it is a protected resource. Existing health-based regulations are weak in terms of visibility protection. Various techniques, including human observation, light transmission measurements, digital photography, and satellite imaging, are used to monitor visibility. As with air pollution, trends in visibility vary spatially and temporally. Emissions from the developing world and large scale events such as dust storms and wildfires affect visibility around much of the globe.</p> |
| [5] | . |
| [6] | . This article analyzed the control progress and current status of air quality, identified the major air pollution issues and challenges in future, proposed the long-term air pollution control targets, and suggested the options for better air quality in China. With the continuing growth of economy in the next 10-15 years, China will face a more severe situation of energy consumption, electricity generation and vehicle population leading to increase in multiple pollutant emissions. Controlling regional air pollution especially fine particles and ozone, as well as lowering carbon emissions from fossil fuel consumption will be a big challenge for the country. To protect public health and the eco-system, the ambient air quality in all Chinese cities shall attain the national ambient air quality standards (NAAQS) and ambient air quality guideline values set by the World Health Organization (WHO). To achieve the air quality targets, the emissions of SO2, NOx, PM10, and volatile organic compounds (VOC) should decrease by 60%, 40%, 50%, and 40%, respectively, on the basis of that in 2005. A comprehensive control policy focusing on multiple pollutants and emission sources at both the local and regional levels was proposed to mitigate the regional air pollution issue in China. The options include development of clean energy resources, promotion of clean and efficient coal use, enhancement of vehicle pollution control, implementation of synchronous control of multiple pollutants including SO2, NOx, VOC, and PM emissions, joint prevention and control of regional air pollution, and application of climate friendly air pollution control measures. |
| [7] | . <p>大气霾污染因其对人体健康、生态环境和气候变化的影响而成为全球关注的严重环境问题,PM<sub>2.5</sub>是中国霾污染频繁的主要原因。过去对国家尺度上PM<sub>2.5</sub>时空分布的认识主要基于卫星观测,因其反演方法的局限性,卫星资料难以真实反映近地面PM<sub>2.5</sub>浓度的时空变化规律。本文基于中国2014年190个城市中的945个监测站的PM<sub>2.5</sub>浓度观测数据,采用空间数据统计模型,揭示了中国PM<sub>2.5</sub>的时空格局。结果显示,2014年中国城市PM<sub>2.5</sub>平均浓度61 μg/m<sup>3</sup>,具有显著的冬秋高、春夏低的“U”型逐月变化规律和周期性U-脉冲型逐日变化规律;中国城市PM<sub>2.5</sub>浓度呈现显著的空间分异与集聚规律,以及两次南北进退的空间循环周期;胡焕庸线和长江是中国PM<sub>2.5</sub>浓度高值区和低值区的东西和南北分界线,胡焕庸线以东和长江以北的环渤海城市群、中原城市群、长三角城市群、长江中游城市群和哈长城市群等地区是2014年PM<sub>2.5</sub>的高污染城市聚集地,京津冀城市群是全年污染核心区;以珠三角为核心的东南沿海地区是稳定的空气质量优良区。</p> . <p>大气霾污染因其对人体健康、生态环境和气候变化的影响而成为全球关注的严重环境问题,PM<sub>2.5</sub>是中国霾污染频繁的主要原因。过去对国家尺度上PM<sub>2.5</sub>时空分布的认识主要基于卫星观测,因其反演方法的局限性,卫星资料难以真实反映近地面PM<sub>2.5</sub>浓度的时空变化规律。本文基于中国2014年190个城市中的945个监测站的PM<sub>2.5</sub>浓度观测数据,采用空间数据统计模型,揭示了中国PM<sub>2.5</sub>的时空格局。结果显示,2014年中国城市PM<sub>2.5</sub>平均浓度61 μg/m<sup>3</sup>,具有显著的冬秋高、春夏低的“U”型逐月变化规律和周期性U-脉冲型逐日变化规律;中国城市PM<sub>2.5</sub>浓度呈现显著的空间分异与集聚规律,以及两次南北进退的空间循环周期;胡焕庸线和长江是中国PM<sub>2.5</sub>浓度高值区和低值区的东西和南北分界线,胡焕庸线以东和长江以北的环渤海城市群、中原城市群、长三角城市群、长江中游城市群和哈长城市群等地区是2014年PM<sub>2.5</sub>的高污染城市聚集地,京津冀城市群是全年污染核心区;以珠三角为核心的东南沿海地区是稳定的空气质量优良区。</p> |
| [8] | . Air pollution in the form of fine particulate matter, or PM 2.5 , can decrease human life expectancy and increase the overall mortality rate. Based on a time series of remotely sensed PM 2.5 concentrations, this study analyzed the spatiotemporal patterns of this crucial pollutant in China from 1999 to 2011 using trend analysis and standard deviation ellipse analysis, and carried out a health risk assessment of human exposure to PM 2.5 . The results showed that PM 2.5 concentrations increased significantly from 1999 to 2011 in China, especially in the central and eastern parts of the country. The proportion of areas with PM 2.5 concentrations higher than 3502μg/m 3 increased year by year, and the areas with PM 2.5 concentrations lower than the annual primary standard of 1502μg/m 3 decreased continuously. The areas most polluted by PM 2.5 were south of Hebei, north of Henan and west of Shandong provinces, with changes in the overall spatial distribution of the pollutant occurring faster along a south–north axis than along an east–west axis, and also faster along an east–south axis than along a west–north axis. Based on the PM 2.5 concentrations in China from 1999 to 2011, a two-tier standard (level-I and level-II) was proposed for delineated areas to assist in nationwide air pollution control. It was also found that the proportion of the population exposed to PM 2.5 concentrations greater than 3502μg/m 3 increased year by year, and increased faster than the proportion of population exposed to PM 2.5 concentrations in the range 15–3502μg/m 3 . The health risk in the central and eastern areas of the country was the highest. Based on these results, PM 2.5 pollution poses an increasingly serious risk to human health across China and there is an immediate need to implement its regional control. In addition, more attention should be paid at the national scale in terms of pollution risk, rather than focusing narrowly on a city scale. |
| [9] | . 对兰州市近10年逐日空气污染指数的时间序列采用一维连续Morlet小波进行小波变换分析,研究了该市大气污染时间序列的多尺度变化特征、主周期和影响因素.结果表明:兰州市近10年空气污染指数在不同时间尺度上具有不同的"高-低"交替演化规律,且以300d左右的变化为主周期,100d左右的变化为次周期;受地形条件的影响,大气污染呈现"冬重夏轻"的格局,且受河西走廊沙尘活动的影响,往往伴随春季污染次高峰的发生,春分和秋分前后是1年中大气污染轻重状况转换的拐点;兰州市近10年大气污染状况总体趋向好转,但局部时段污染加重的现象亦时有发生.小波变换分析对于研究空气污染指数时间序列的变化规律十分有效,也适用于其他污染物时间演变规律的研究. . 对兰州市近10年逐日空气污染指数的时间序列采用一维连续Morlet小波进行小波变换分析,研究了该市大气污染时间序列的多尺度变化特征、主周期和影响因素.结果表明:兰州市近10年空气污染指数在不同时间尺度上具有不同的"高-低"交替演化规律,且以300d左右的变化为主周期,100d左右的变化为次周期;受地形条件的影响,大气污染呈现"冬重夏轻"的格局,且受河西走廊沙尘活动的影响,往往伴随春季污染次高峰的发生,春分和秋分前后是1年中大气污染轻重状况转换的拐点;兰州市近10年大气污染状况总体趋向好转,但局部时段污染加重的现象亦时有发生.小波变换分析对于研究空气污染指数时间序列的变化规律十分有效,也适用于其他污染物时间演变规律的研究. |
| [10] | Air quality evaluation is important in order to inform the public about the risk level of air pollution to health. To better assess air quality, China released its new national ambient air quality standards (NAAQS-2012) and the new method to classify air quality level (AQL) in 2012. In this study, we examined the performance of China's NAAQS-2012 and AQL classification method through applying them, the World Health Organization (WHO) guidelines, and the US AQL classification method to evaluate air quality in Chengdu, the largest city in southwestern China. The results show that annual mean concentrations of PM6968, PM60.63, SO60, NO60, and O61 at the seven urban sites were in the ranges of 138-161, 87-98, 18-32, 54-70, and 42-57 μg/m(3), respectively, and the annual mean concentrations of CO were in the range of 1.09-1.28 mg/m(3). Chengdu is located in one of the four largest regions affected by haze in China, and PM6968 and PM60.63 were the top air pollutants, with annual concentrations over 2 times of their standards in NAAQS-2012 and over 7 times of the WHO guidelines. Annual mean concentrations of the pollutants were much lower at the background site (LYS) than at the urban sites, but the annual mean concentrations of PM6968 and PM60.63 at LYS were 3.5 and 5.7 times of the WHO guidelines, respectively. These suggest that severe air pollution in Chengdu was largely associated with local emissions but also related to regional air pollution. The compliance rates of PM6968 , PM1717.63, SO60, and O61 met China's NAAQS-2012 standards four times more frequently than they met the WHO guidelines, as NAAQS-2012 uses the loosest interim target (IT) standards of WHO for these four pollutants. Air pollution in Chengdu was estimated and stated to be less severe using China's classification than using the US classification, as China uses weaker concentration breakpoints and benign descriptions of AQL. Furthermore, China's AQL classification method does not capture the cumulative effects of multiple pollutants, and the risk assessment is mainly based on the exposure-response relationship between air pollutant and health quantified in the North America and West Europe; these can bring some uncertainties into evaluating the risk to health in China. In summary, although China greatly improved its NAAQS and AQL classification method in 2012, further improvements are still needed. |
| [11] | . 为评估北京西南方向城市群对北京大气污染的影响,于2009年夏秋季节(2009年7月16日~10月15日),利用自动在线大气环境观测仪器,对北京及太行山东侧河北省的3个城市涿州、保定和石家庄进行了大气污染物PM10、NOx和O3的联合观测研究.结果表明,夏秋季节4个城市的首要污染物均为可吸入颗粒物(PM10),平均质量浓度分别为(99±88)、(121±74)、(141±92)和(180±107)μg/m3,NOx平均质量浓度分别为(66±48)、(23±14)、(47±35)和(52±32)μg/m3;大气光化学污染物O3浓度小时最高平均值分别达到(107±60)、(128±55)、(164±61)和(120±54)μg/m3.受局地源影响,石家庄颗粒物造成的大气污染最为严重,依次为保定、涿州、北京;受大城市北京和石家庄的双重影响,保定地区大气二次污染物臭氧浓度最高,其次为涿州、石家庄,北京最低.对2009年7月出现的2次典型区域大气污染过程分析表明,太行山东侧河北城市群污染物排放及大气光化学污染对北京及华北区域空气质量有显著影响. . 为评估北京西南方向城市群对北京大气污染的影响,于2009年夏秋季节(2009年7月16日~10月15日),利用自动在线大气环境观测仪器,对北京及太行山东侧河北省的3个城市涿州、保定和石家庄进行了大气污染物PM10、NOx和O3的联合观测研究.结果表明,夏秋季节4个城市的首要污染物均为可吸入颗粒物(PM10),平均质量浓度分别为(99±88)、(121±74)、(141±92)和(180±107)μg/m3,NOx平均质量浓度分别为(66±48)、(23±14)、(47±35)和(52±32)μg/m3;大气光化学污染物O3浓度小时最高平均值分别达到(107±60)、(128±55)、(164±61)和(120±54)μg/m3.受局地源影响,石家庄颗粒物造成的大气污染最为严重,依次为保定、涿州、北京;受大城市北京和石家庄的双重影响,保定地区大气二次污染物臭氧浓度最高,其次为涿州、石家庄,北京最低.对2009年7月出现的2次典型区域大气污染过程分析表明,太行山东侧河北城市群污染物排放及大气光化学污染对北京及华北区域空气质量有显著影响. |
| [12] | . 根据中国北方9个典型城市(北京、哈尔滨、青岛、太原、沈阳、大连、呼和浩特、兰州、乌鲁木齐)2002年至2008年连续7年的空气污染指数(API)资料,对各月空气污染指数大于200的天数和首要污染物以PM10和SO2出现的天数进行了分析,结果表明冬季污染最为严重,PM10为我国北方9个典型城市(北京、哈尔滨、青岛、太原、沈阳、大连、呼和浩特、兰州、乌鲁木齐)首要污染物。本研究还结合北方典型城市空气污染指数的月均值,分析了各地污染的成因;并对环境因素:温度、降水、湿度与空气污染的相关性进行了研究,结果表明:温度、降水与空气污染指数呈负相关;大部分城市湿度与其呈负相关,而乌鲁木齐则为显著的正相关。此外,还以兰州市为例分析比较了不同类型降水对空气污染指数的影响。最后通过比较2006年3月份的一次强沙尘暴期间空气污染指数与2007年同期空气污染指数,讨论了沙尘暴对我国北方空气质量的影响。 . 根据中国北方9个典型城市(北京、哈尔滨、青岛、太原、沈阳、大连、呼和浩特、兰州、乌鲁木齐)2002年至2008年连续7年的空气污染指数(API)资料,对各月空气污染指数大于200的天数和首要污染物以PM10和SO2出现的天数进行了分析,结果表明冬季污染最为严重,PM10为我国北方9个典型城市(北京、哈尔滨、青岛、太原、沈阳、大连、呼和浩特、兰州、乌鲁木齐)首要污染物。本研究还结合北方典型城市空气污染指数的月均值,分析了各地污染的成因;并对环境因素:温度、降水、湿度与空气污染的相关性进行了研究,结果表明:温度、降水与空气污染指数呈负相关;大部分城市湿度与其呈负相关,而乌鲁木齐则为显著的正相关。此外,还以兰州市为例分析比较了不同类型降水对空气污染指数的影响。最后通过比较2006年3月份的一次强沙尘暴期间空气污染指数与2007年同期空气污染指数,讨论了沙尘暴对我国北方空气质量的影响。 |
| [13] | . |
| [14] | . An observational study on trace gases and PM2.5 was conducted at three sites in and around Beijing, during the Olympic season from 2007 to 2009. Air quality improved significantly during the Olympic Games due to the special emission control measures. However, concentrations of the primary pollutants and PM were found to have risen significantly after the Games. Although the major O-3 precursors (NOx and VOCs) were well controlled during the Olympic season, O-3 was still found to be the highest in 2008, based on the data of ground-based observation. All this information suggests that while control of regional emissions for the Beijing Olympic Games did improved the air quality in Beijing, more efforts will be needed for the continuous improvement of regional air quality, especially for significant reductions of O-3 and fine particulate pollution, and not only in Beijing, but also in the Beijing-Tianjin-Hebei region. |
| [15] | . A better understanding of the regional disparity and imbalance characteristics of China's urbanization development is the important premise for constituting correct policy and strategy and promoting the healthy and sustainable development of urbanization in the 21st century. The regional differences of China's urbanization level have close relations with natural conditions of landform and climate etc.,the urbanization level reduces with the eleva-tion of topography and decrease of precipitation. According to the statistical data set of ur-banization in 1950鈥2006,the temporal change course of inter-provincial disparity of Chinese urbanization level since the founding of New China in 1949 was studied,and then the inter-regional and intra-regional disparities of urbanization development were analyzed by the Theil index and its nested decomposition method,to grasp the dynamic change of spatial disparities of China's urbanization level on the whole. Using the imbalance index model,the imbalance status of urban population distribution relative to total population,grain output,total agricultural output value,gross output value of industry,tertiary industrial output value as well as gross regional product was discussed,to hold the balance characteristics of urbanization development relative to the regional development conditions from the macroscopic scales. |
| [16] | . 以2002年源排放清单、气象资料和空气质量观测资料为基础,利用CALPUFF模拟系统,通过数值模拟及对排放源现状分析,揭示了珠江三角洲内城市之间污染物相互输送的特点和规律,分析了不同城市空气污染影响因素的差异,定量给出了珠江三角洲城市间空气污染的相互影响和相互贡献.结果表明,珠江三角洲城市间污染相互作用显著,其中广州是最典型的与周边发生显著相互作用的城市之一. . 以2002年源排放清单、气象资料和空气质量观测资料为基础,利用CALPUFF模拟系统,通过数值模拟及对排放源现状分析,揭示了珠江三角洲内城市之间污染物相互输送的特点和规律,分析了不同城市空气污染影响因素的差异,定量给出了珠江三角洲城市间空气污染的相互影响和相互贡献.结果表明,珠江三角洲城市间污染相互作用显著,其中广州是最典型的与周边发生显著相互作用的城市之一. |
| [17] | . Newly available data from non-urban locations in China along with regional model simulations suggest that ground-level ozone may be sufficiently high to affect China's winter wheat production. As non-urban ozone increases with industrialization, its effects on crops could hinder efforts to meet increasing food demands in the coming decades, in China. |
| [18] | . Typical processes of ozone (O3) pollution in the lower atmosphere in Shanghai are studied in the winter, summer, and autumn of 1994. Relationships between O3-NOx (nitrogen oxide) concentrations and meteorological parameters are analyzed in order to find meteorological indices corresponding to high O3 concentration days. Meteorological conditions favorable for high O3 concentrations usually appear when Shanghai is dominated by a high-pressure system in the lower atmosphere, while a northwestern current prevails over this area in the upper atmosphere. High O3 concentrations can occur when the wind speed is relatively high. O3 could increase rapidly on fog days. Temperatures influencing O3 concentrations are not as obvious in summer as in winter. Some possible mechanisms for the measurement results are suggested in this paper. |
| [19] | . Air quality data gathered from five nonurban sites in China over a 12-month period from August 1994 to August 1995, along with meteorological observations from the same region and period, are used to identify and characterize a nonurban ozone (O 3 ) pollution episode in China. Because of the influence of the Asian Monsoonal Circulation, high O 3 concentrations were not observed at the nonurban sites during the summer months. However, enhanced O 3 concentrations were observed during the other seasons, especially the fall and early winter. A more detailed inspection of the O 3 data during the period from October 15, 1994, to January 15, 1995, indicated the occurrence of a multipleday episode in late October/early November when high O 3 concentrations were observed at all four monitoring sites located in eastern China. Meteorological conditions during the episode were characterized by the presence of a strong and stationary high-pressure ridge over eastern China; synoptic conditions quite similar to those observed during regional O 3 pollution episodes over the United States, Canada, and Europe. An updated version of the Regional Acid Deposition Model (RADM) driven by meteorological fields derived from the Regional Climate Model (RegCM) and spatially disaggregated anthropogenic emissions prepared by the Chinese Academy of Meteorological Sciences is used to simulate 3 months of the observed O 3 data from China. Comparisons between observations and model calculations indicate that the model is able to reproduce some of the key features of the O 3 distribution and its relationship to the concentration of one primary pollutant (i.e., sulfur dioxide) provided the comparison is made using averaging times of several days or more. However, simulation of day-to-day variations in O 3 at a given site was poorly correlated with observations. Model simulations suggest that peak O 3 concentrations during this episode would respond to changes in NO x and VOC emissions in a spatially inhomogeneous manner. In general, rural areas in southern China tend to be NO x -limited, but rural areas in northern China tend to be VOC-limited. The Yangtze Delta region, where the highest O 3 concentrations were observed and predicted to occur, was found to be transitional between VOC and NO x limitation. |
| [20] | . We present a summary of the latest measurements of ozone (O) and primary air pollutants at a rural/agricultural site in the fast developing Yangtze Delta region of China. The results of this study show elevated levels of primary pollutants (CO, SOand NO), which are about 1-5 times of those typically found in rural areas of North America and Europe. Opollution events are frequently observed. CO and SOlevels are particularly high, resulting from the unique energy-use pattern in China. Oshows strong positive correlation with NOand CO during periods of high photochemical activity. The O-NOslope is comparable to the result from rural North America, but the O-CO slope is substantially smaller for the Chinese site. With the anticipation of rapid changes of atmospheric composition in China, long-term measurements of key air pollutants will be necessary for documenting their trends and for studying their environmental impacts. |
| [21] | . 以迅速发展的城市群落-北京及周边区域为样本,利用2003年冬季(2月)、夏季(8月)北京城市大气环境现场科学试验(BECAPEX,BeijingCityAirPollutionObservationExperiment)建筑群边界层大气污染动力-化学过程观测资料以及相关的气象要素、卫星反演气溶胶光学厚度等综合资料,进行“点-面”空间结构动力-统计合成分析,剖析北京大城市及周边区域大气污染影响域的空间结构及多尺度特征.结果表明,冬、夏季不同污染排放源对大气污染成分特征的贡献率具有显著差异,统计模型主成分分析结果亦表明,冬季气溶胶颗粒物成分结构以SO2和NOx影响为主;夏季粒子成分结构则以CO,NOx影响为主.冬、夏季北京城区不同方位测点近地层大气动力、热力结构及建筑群上边界各类污染物种均具有“同位相”变化及其“影响域”空间尺度特征.功率谱分析发现冬、夏季颗粒物浓度和大气风场动力结构的周期谱相吻合,冬季以长周期为主,夏季则多为短周期,揭示出冬、夏季大气环流季节性尺度特征对大气污染变化周期特征的影响效应.分析城市区域热力非均匀性特征,可发现北京地区热岛多尺度效应与高层建筑群面积非均匀扩展特征存在相关关系.城市大气动力、热力特征空间结构中城市边界层群筑群湍流尺度特征对城市大气污染多尺度特征具有重要影响.晴空、稳定天气条件下MODIS气溶胶变分订正分析场和污染源追踪相关合成风矢场综合分析模型均表明,冬季北京大气污染气溶胶颗粒物的排放源可远距离追溯到北京南部周边的河北、山东及天津等地更大尺度空间范围,气溶胶指数高值区与北京及周边地区居民户数高值区(采暖面源)空间分布存在关联.冬、夏季空气质点后向轨迹特征呈类似上述多尺度特征,且描述出不同季节污染源空间分布的尺度特征差异,城区大气污染周边源轨迹路径主体来自城市近郊固定工业面源或采暖面源,且冬季周边污染源扩散输送距离较夏季呈更远的空间尺度,上述结论描述出城市区域大气污染源影响和大气动力结构引起的多尺度空间影响域及季节性特征.冬季TOMS气溶胶光学厚度高值区域位于北京地区并向南延伸,且呈南北向带状分布,可描述出周边地形分布对区域尺度大气污染源扩散的动力影响效应.研究分析表明:北京周边大地形“谷地”内冬季污染程度与南部周边地区的污染排放源密切相关;北京及周边地区冬季的气溶胶光学厚度和日照时数的“反位相”变化特征显著,冬季云量、雾日数与气溶胶呈区域尺度相关特征,反映了该区域尺度气溶胶影响的局地气候效应.另外,流域面尺度的大气干、湿沉降分布对密云水库区域尺度空间水体的影响分析亦反映了夏季水、土、气多圈层污染源影响多尺度空间结构对密云水库水质影响的可能性. . 以迅速发展的城市群落-北京及周边区域为样本,利用2003年冬季(2月)、夏季(8月)北京城市大气环境现场科学试验(BECAPEX,BeijingCityAirPollutionObservationExperiment)建筑群边界层大气污染动力-化学过程观测资料以及相关的气象要素、卫星反演气溶胶光学厚度等综合资料,进行“点-面”空间结构动力-统计合成分析,剖析北京大城市及周边区域大气污染影响域的空间结构及多尺度特征.结果表明,冬、夏季不同污染排放源对大气污染成分特征的贡献率具有显著差异,统计模型主成分分析结果亦表明,冬季气溶胶颗粒物成分结构以SO2和NOx影响为主;夏季粒子成分结构则以CO,NOx影响为主.冬、夏季北京城区不同方位测点近地层大气动力、热力结构及建筑群上边界各类污染物种均具有“同位相”变化及其“影响域”空间尺度特征.功率谱分析发现冬、夏季颗粒物浓度和大气风场动力结构的周期谱相吻合,冬季以长周期为主,夏季则多为短周期,揭示出冬、夏季大气环流季节性尺度特征对大气污染变化周期特征的影响效应.分析城市区域热力非均匀性特征,可发现北京地区热岛多尺度效应与高层建筑群面积非均匀扩展特征存在相关关系.城市大气动力、热力特征空间结构中城市边界层群筑群湍流尺度特征对城市大气污染多尺度特征具有重要影响.晴空、稳定天气条件下MODIS气溶胶变分订正分析场和污染源追踪相关合成风矢场综合分析模型均表明,冬季北京大气污染气溶胶颗粒物的排放源可远距离追溯到北京南部周边的河北、山东及天津等地更大尺度空间范围,气溶胶指数高值区与北京及周边地区居民户数高值区(采暖面源)空间分布存在关联.冬、夏季空气质点后向轨迹特征呈类似上述多尺度特征,且描述出不同季节污染源空间分布的尺度特征差异,城区大气污染周边源轨迹路径主体来自城市近郊固定工业面源或采暖面源,且冬季周边污染源扩散输送距离较夏季呈更远的空间尺度,上述结论描述出城市区域大气污染源影响和大气动力结构引起的多尺度空间影响域及季节性特征.冬季TOMS气溶胶光学厚度高值区域位于北京地区并向南延伸,且呈南北向带状分布,可描述出周边地形分布对区域尺度大气污染源扩散的动力影响效应.研究分析表明:北京周边大地形“谷地”内冬季污染程度与南部周边地区的污染排放源密切相关;北京及周边地区冬季的气溶胶光学厚度和日照时数的“反位相”变化特征显著,冬季云量、雾日数与气溶胶呈区域尺度相关特征,反映了该区域尺度气溶胶影响的局地气候效应.另外,流域面尺度的大气干、湿沉降分布对密云水库区域尺度空间水体的影响分析亦反映了夏季水、土、气多圈层污染源影响多尺度空间结构对密云水库水质影响的可能性. |
| [22] | . 文章以长三角10个主要城市2004~2012年空气污染指数数 据为依据,研究了长三角地区近几年的空气环境质量、主要污染物、空气污染的年际变化、季节变化和空间分布特征。结果表明,以《环境空气质量标准》 (GB3095—1996)为依据,长三角地区空气环境质量在2004年~2012年间逐步好转,主要污染物为可吸入颗粒物,春季和冬季污染较为严重。但 是以《环境空气质量标准》(GB3095—2012)为依据,由于标准变严,使得长三角区域的空气质量面临这更多的挑战。从空间分布上看,南京为长三角地 区空气污染较为严重的城市,其空气环境状况不容乐观。 . 文章以长三角10个主要城市2004~2012年空气污染指数数 据为依据,研究了长三角地区近几年的空气环境质量、主要污染物、空气污染的年际变化、季节变化和空间分布特征。结果表明,以《环境空气质量标准》 (GB3095—1996)为依据,长三角地区空气环境质量在2004年~2012年间逐步好转,主要污染物为可吸入颗粒物,春季和冬季污染较为严重。但 是以《环境空气质量标准》(GB3095—2012)为依据,由于标准变严,使得长三角区域的空气质量面临这更多的挑战。从空间分布上看,南京为长三角地 区空气污染较为严重的城市,其空气环境状况不容乐观。 |
| [23] | . 依据2001年-2010年的空气污染指数(API)日报数据和相应时段的地面气象要素数据,从季节平均和月平均、空气污染等级和空气污染过程3个角度出发,分别研究北京、天津和石家庄3市的空气污染指数(API)与气象要素之间的相关关系,统计分析结果表明:①北京、天津、石家庄3市的空气污染状况在2001年-2010年期间逐步改善,夏季空气质量最好;北京春季受沙尘的影响、天津和石家庄冬季受取暖的影响导致对应季节的空气质量最差;②气象要素对空气污染的影响存在较大时空差异,北京、天津和石家庄3市的月均尺度的API与气温(平均、最高和最低)、最高气压、水汽压和最大风速4类气象要素存在一致的相关关系,大部分相关系数的绝对值天津>石家庄>北京;季均值尺度下,北京、天津和石家庄3市的API与气象要素的关系差异性较大,但3市的API与水汽压存在一致的相关关系;和季节与月份均值处理分析的相关性相比,基于空气污染不同级别分析的相关系数明显偏低,可能与较大的样本量和气象要素对空气污染影响机制的复杂性有关;基于空气污染过程的相关系数的绝对值介于均值和级别分析结果的中间,但是3个城市气象要素对空气污染的影响相关系数仍显不足;③根据不同风向上污染日数的分布统计分析,北京、天津和石家庄分别主要受西南和南西南、北西北和北以及东南和东东南方向上极大风速和最大风速的影响。为了使研究结果更具机理性和普适性,更好的服务于空气污染未来预报,仍需进一步开展包括上述多种方式的联合与深入研究。 . 依据2001年-2010年的空气污染指数(API)日报数据和相应时段的地面气象要素数据,从季节平均和月平均、空气污染等级和空气污染过程3个角度出发,分别研究北京、天津和石家庄3市的空气污染指数(API)与气象要素之间的相关关系,统计分析结果表明:①北京、天津、石家庄3市的空气污染状况在2001年-2010年期间逐步改善,夏季空气质量最好;北京春季受沙尘的影响、天津和石家庄冬季受取暖的影响导致对应季节的空气质量最差;②气象要素对空气污染的影响存在较大时空差异,北京、天津和石家庄3市的月均尺度的API与气温(平均、最高和最低)、最高气压、水汽压和最大风速4类气象要素存在一致的相关关系,大部分相关系数的绝对值天津>石家庄>北京;季均值尺度下,北京、天津和石家庄3市的API与气象要素的关系差异性较大,但3市的API与水汽压存在一致的相关关系;和季节与月份均值处理分析的相关性相比,基于空气污染不同级别分析的相关系数明显偏低,可能与较大的样本量和气象要素对空气污染影响机制的复杂性有关;基于空气污染过程的相关系数的绝对值介于均值和级别分析结果的中间,但是3个城市气象要素对空气污染的影响相关系数仍显不足;③根据不同风向上污染日数的分布统计分析,北京、天津和石家庄分别主要受西南和南西南、北西北和北以及东南和东东南方向上极大风速和最大风速的影响。为了使研究结果更具机理性和普适性,更好的服务于空气污染未来预报,仍需进一步开展包括上述多种方式的联合与深入研究。 |
| [24] | . <h2 class="secHeading" id="section_abstract">Abstract</h2><p id="abspara0010">We applied a multiple linear regression (MLR) model to study the correlations of total PM<sub>2.5</sub> and its components with meteorological variables using an 11-year (1998–2008) observational record over the contiguous US. The data were deseasonalized and detrended to focus on synoptic-scale correlations. We find that daily variation in meteorology as described by the MLR can explain up to 50% of PM<sub>2.5</sub> variability with temperature, relative humidity (RH), precipitation, and circulation all being important predictors. Temperature is positively correlated with sulfate, organic carbon (OC) and elemental carbon (EC) almost everywhere. The correlation of nitrate with temperature is negative in the Southeast but positive in California and the Great Plains. RH is positively correlated with sulfate and nitrate, but negatively with OC and EC. Precipitation is strongly negatively correlated with all PM<sub>2.5</sub> components. We find that PM<sub>2.5</sub> concentrations are on average 2.6 μg m<sup>−3</sup> higher on stagnant vs. non-stagnant days. Our observed correlations provide a test for chemical transport models used to simulate the sensitivity of PM<sub>2.5</sub> to climate change. They point to the importance of adequately representing the temperature dependence of agricultural, biogenic and wildfire emissions in these models.</p> |
| [25] | . 利用2006-2008年珠江三角洲11个地面气象站逐日14:00风场资料与粤港珠三角区域空气监控网11个监测子站的区域空气质量指数(RAQI)数据,分析研究风场对空气质量的影响。结果表明: 珠江三角洲无论干湿季,北部、东部空气质量比南部、西部好,中部是空气质量较差的地区。区域污染输送对珠江三角洲空气质量有重要影响:区域平均风速大于2.6 m/s时不会出现区域性空气污染,区域平均风速大于3.2 m/s时空气非常清洁;区域平均风速小于1.8 m/s时区域空气污染严重;风速介于1.8~2.6 m/s时空气质量变化比较复杂。 . 利用2006-2008年珠江三角洲11个地面气象站逐日14:00风场资料与粤港珠三角区域空气监控网11个监测子站的区域空气质量指数(RAQI)数据,分析研究风场对空气质量的影响。结果表明: 珠江三角洲无论干湿季,北部、东部空气质量比南部、西部好,中部是空气质量较差的地区。区域污染输送对珠江三角洲空气质量有重要影响:区域平均风速大于2.6 m/s时不会出现区域性空气污染,区域平均风速大于3.2 m/s时空气非常清洁;区域平均风速小于1.8 m/s时区域空气污染严重;风速介于1.8~2.6 m/s时空气质量变化比较复杂。 |
| [26] | . In an effort to improve our understanding of aerosol impacts on climate, we implement a desert dust module within a regional climate model (RegCM). The dust module includes emission, transport, gravitational settling, wet and dry removal and calculations of dust optical properties. The coupled RegCM-dust model is used to simulate two dust episodes observed over the Sahara region (a northeastern Africa dust outbreak, and a west Africa-Atlantic dust outbreak observed during the SHADE "Saharan Dust Experiment"), as well as a three month simulation over an extended domain covering the Africa-Europe sector. Comparisons with satellite and local aerosol optical depth measurements shows that the model captures the main spatial (both horizontal and vertical) and temporal features of the dust distribution. The main model deficiency occurs in the representation of certain dynamical patterns observed during the SHADE case which is associated with an active easterly wave that contributed to the generation of the dust outbreak. The model appears suitable to conduct long term simulations of the effects of Saharan dust on African and European climate. |
| [27] | . The uptake of SO2 onto Saharan mineral dust from the Cape Verde Islands was investigated using a coated wall flow tube coupled to a mass spectrometer. The rate of loss of SO2 to the dust coating was measured and uptake coefficients were determined using the measured BET surface area of the sample. The uptake of SO2, with an initial concentration between (2–40)×1010 molecule cm-3 (0.62–12 μTorr), was found to be strongly time dependent over the first few hundred seconds of an experiment, with an initial uptake γ0,BET of (6.6±0.8)×10-5 (298 K), declining at longer times. The amount of SO2 adsorbed on the dust samples was measured over a range of SO2 concentrations and mineral dust loadings. The uptake of SO2 was found to be up to 98% irreversible over the timescale of these investigations. Experiments were also performed at 258 K, at a relative humidity of 27% and at 298 K in the presence of ozone. The initial uptake and the amount of SO2 taken up per unit area of BET dust surface was the same within error, irrespective of the conditions used; however the presence of ozone reduced the amount of SO2 released back into the gas-phase per unit area once exposure of the surface ended. Multiple uptakes to the same surface revealed a loss of surface reactivity, which did not return if the samples were exposed to gas-phase water, or left under vacuum overnight. A mechanism which accounts for the observed uptake behaviour is proposed and numerically modelled, allowing quantitative estimates of the rate and amount of SO2 removal in the atmosphere to be estimated. Removal of SO2 by mineral dust is predicted to be significant at high dust loadings. |
| [28] | . <h2 class="secHeading" id="section_abstract">Abstract</h2><p id="">The purpose of this work is to study the impact of an urban land cover on local meteorology and spatial distribution of atmospheric pollutants over the Paris region. One anticyclonic episode from the ESQUIF campaign was simulated using the meso-scale meteorological and chemical Meso-NHC model coupled to the town energy balance (TEB) urban canopy model. A control simulation was also performed without implementing TEB in order to quantify the effect of the urban parameterization. Both meteorological and chemical model outputs were evaluated against the data collected during the experiment and most of the results are improved when TEB is applied. The simulation indicates the formation of an urban heat island (UHI) over Paris which is stronger at night than during day. The structure of the atmospheric boundary layer is also strongly influenced by the city. The present study shows that both nocturnal and diurnal urban effects have an important impact on the primary and secondary regional pollutants, more specifically the ozone and the nitrogen oxide (NO<em><sub>x</sub></em>). The spatial distribution and the availability of pollutants are significantly modified by the urbanized area mainly due to enhanced turbulence.</p> |
| [29] | |
| [30] | . The reduced-form approach to the incomeenvironment relationship and to explore its determinants as a step towards a better understanding of this relationship and its potential as a policy tool. The role of the rate of economic growth and population density is also explored. A main finding is that at least in the case of ambient SO2 levels, policies and institutions can significantly reduce environmental degradation at low income levels and speed up improvements at higher income levels, thereby flattening the EKC and reducing the environmental price of economic growth. |
| [31] | . We examined and compared PM 2.5 concentrations in urban and the surrounding regions, and further investigated the impact of urbanization on urban PM 2.5 concentrations at the Chinese prefectures. Annual PM 2.5 concentrations in most prefectures were greater than 10μg/m 3 , the air quality guideline of the World Health Organization. Those prefectures were mainly distributed along the east coast and southeast of Sichuan province; The urban PM 2.5 concentrations ( UrbanPM 2.5 Urban PM 2.5 mathContainer Loading Mathjax ) in 85 cities were greater than (>10μg/m 3 ) those in the surrounding area. Those cities were mainly located in the Beijing–Sichuan and Shanghai–Guangxi belts. In addition, Urban P M 2.5 Urban P M 2.5 mathContainer Loading Mathjax was less than (<0μg/m 3 ) that in surrounding areas in only 41 prefectures, which were located in western China or nearby mega cities; Significant positive correlations were found between UrbanPM 2.5 Urban PM 2.5 mathContainer Loading Mathjax and urban population ( R 2 =0.99, P <0.05), and between UrbanPM 2.5 Urban PM 2.5 mathContainer Loading Mathjax and urban second industry fraction ( R 2 =0.71, P <0.05), suggesting that urbanization had considerable impact on PM 2.5 concentrations. |
| [32] | . Socio-economic factors have significant influences on air quality and are commonly used to guide environmental planning and management. Based on data from 85 long-term daily monitoring cities in China, air quality as evaluated by AOFDAQ-A (Annual Occurrence Frequency of Daily Air Quality above Level III), was correlated to socio-economic variable groups of urbanization, pollution and environmental treatment by variation partitioning and hierarchical partitioning methods. We found: (1) the three groups explained 43.5% of the variance in AOFDAQ-A; (2) the contribution of "environmental investment" to AOFDAQ-A shown a time lag effect; (3) "population in mining sector" and "coverage of green space in built-up area" were respectively the most significant negative and positive explanatory socio-economic variables; (4) using eight largest contributing individual factors, a linear model to predict variance in AOFDAQ-A was constructed. Results from our study provide a valuable reference for the management and control of air quality in Chinese cities. |
| [33] | . Relatively few studies have characterized differences in intra- and inter-neighborhood traffic-related air pollutant (TRAP) concentrations and distance-decay gradients in neighborhoods along an urban highway for the purposes of exposure assessment. The goal of this work was to determine the extent to which intra- and inter-neighborhood differences in TRAP concentrations can be explained by traffic and meteorology in three pairs of neighborhoods along Interstate 93 (I-93) in the metropolitan Boston area (USA). We measured distance-decay gradients of seven TRAPs (PNC, pPAH, NO, NOx, BC, CO, PM2.5) in near-highway (<400 m) and background areas (>1 km) in Somerville, Dorchester/South Boston, Chinatown and Malden to determine whether (1) spatial patterns in concentrations and inter-pollutant correlations differ between neighborhoods, and (2) variation within and between neighborhoods can be explained by traffic and meteorology. The neighborhoods ranged in area from 0.5 to 23 km(2). Mobile monitoring was performed over the course of one year in each pair of neighborhoods (one pair of neighborhoods per year in three successive years; 35-47 days of monitoring in each neighborhood). Pollutant levels generally increased with highway proximity, consistent with 1-93 being a major source of TRAP; however, the slope and extent of the distance-decay gradients varied by neighborhood as well as by pollutant, season and time of day. Spearman correlations among pollutants differed between neighborhoods (e.g., rho = 0.35-0.80 between PNC and NOx and rho = 0.11-0.60 between PNC and BC) and were generally lower in Dorchester/South Boston than in the other neighborhoods. We found that the generalizability of near-road gradients and near-highway/urban background contrasts was limited for near-highway neighborhoods in a metropolitan area with substantial local street traffic. Our findings illustrate the importance of measuring gradients of multiple pollutants under different ambient conditions in individual near-highway neighborhoods for health studies involving inter-neighborhood comparisons. (C) 2014 Elsevier Ltd. All rights reserved. |
| [34] | . 本文运用空间计量方法,探讨中国31个省份本地与异地之间雾霾污染的交互影响问题以及经济变动、能源结构影响。全局空间相关性分析显示雾霾污染存在显著的空间正相关性;局域空间相关性分析显示污染的高聚集区分布在京津冀、长三角以及与这两大经济增长极相连接的中部地区,本文认为产业转移是其重要原因,产业转移加深了地区间经济与污染的空间联动性,污染的空间溢出效应进一步显现。建立空间环境库兹涅茨曲线回归模型,发现污染水平与能源结构以及产业结构变动息息相关。此外,雾霾污染与经济发展的倒"U"型关系并不存在或还未出现,即随人均GDP的持续增长,污染水平不断上升。综合实证分析得到,邻近地区的产业转移所换取的环境质量改善仅仅是短期的。由于污染溢出的存在,环境规制更严格的地区,如北京、天津等地不能获得其规制的全部利益。治理雾霾,区域间联防联控势在必行。长期看,改变能源消费结构以及优化产业结构是治理雾霾的关键,而短期看,减少劣质煤的使用是较为有效的途径。 . 本文运用空间计量方法,探讨中国31个省份本地与异地之间雾霾污染的交互影响问题以及经济变动、能源结构影响。全局空间相关性分析显示雾霾污染存在显著的空间正相关性;局域空间相关性分析显示污染的高聚集区分布在京津冀、长三角以及与这两大经济增长极相连接的中部地区,本文认为产业转移是其重要原因,产业转移加深了地区间经济与污染的空间联动性,污染的空间溢出效应进一步显现。建立空间环境库兹涅茨曲线回归模型,发现污染水平与能源结构以及产业结构变动息息相关。此外,雾霾污染与经济发展的倒"U"型关系并不存在或还未出现,即随人均GDP的持续增长,污染水平不断上升。综合实证分析得到,邻近地区的产业转移所换取的环境质量改善仅仅是短期的。由于污染溢出的存在,环境规制更严格的地区,如北京、天津等地不能获得其规制的全部利益。治理雾霾,区域间联防联控势在必行。长期看,改变能源消费结构以及优化产业结构是治理雾霾的关键,而短期看,减少劣质煤的使用是较为有效的途径。 |
| [35] | . 机动车尾气排放逐渐成为中国空气污染的主要来源,本文利用2005—2013年中国城市日度数据,实证分析了油价对汽车使用和空气污染的影响效应。实证结果表明油价的提高无法改变一个地区的整体空气质量,这主要是因其对私人汽车、公共汽车以及摩托车无显著效应,而仅通过非私人汽车和出租车的使用变化来影响空气质量。在使用API年度汇总数据、考虑油价对机动车购买影响、选择油价工具变量进行2SLS回归以及删除限行或地铁城市样本后,这一结果仍具有稳健性;在安慰剂检验中,油价对工业污染排放无显著影响,表明其并未通过其他非机动车渠道影响空气质量。据此,本文认为不同的油价污染效应在于各类机动车沉淀成本不同,这一解释得到了基于收入效应和替代效应的分析的证实。本文为成品油消费税的节能减排目标提供了一定的启示:在私人汽车快速增长的背景下,政府不应简单依赖税费调节燃油消费,应通过财政补贴等方式鼓励清洁能源的发展。 . 机动车尾气排放逐渐成为中国空气污染的主要来源,本文利用2005—2013年中国城市日度数据,实证分析了油价对汽车使用和空气污染的影响效应。实证结果表明油价的提高无法改变一个地区的整体空气质量,这主要是因其对私人汽车、公共汽车以及摩托车无显著效应,而仅通过非私人汽车和出租车的使用变化来影响空气质量。在使用API年度汇总数据、考虑油价对机动车购买影响、选择油价工具变量进行2SLS回归以及删除限行或地铁城市样本后,这一结果仍具有稳健性;在安慰剂检验中,油价对工业污染排放无显著影响,表明其并未通过其他非机动车渠道影响空气质量。据此,本文认为不同的油价污染效应在于各类机动车沉淀成本不同,这一解释得到了基于收入效应和替代效应的分析的证实。本文为成品油消费税的节能减排目标提供了一定的启示:在私人汽车快速增长的背景下,政府不应简单依赖税费调节燃油消费,应通过财政补贴等方式鼓励清洁能源的发展。 |
| [36] | . 采用NCEP全球再分析资料运行MM5获得研究区域2004年代表月份的气象场模拟结果,运用HYSPLIT4.8模式,计算代表城市的后向及前向气流轨迹.结果表明,不同季节,气流轨迹的分布差异明显,影响范围各不相同.影响长三角地区低层大气的输送气流主要来源于蒙古、华北或东北地区,途径黄海海域或东部沿海的山东、江苏或上海等地抵达长三角地区.受夏季西南季风的影响,西南方向也是比较重要的输送途径.长江三角洲地区对外界的中尺度污染传输主要受东亚季风活动的影响,其中冬季季风是长三角污染物向华南和西太平洋地区传输的一个主要机制;影响长三角污染物输送的重要系统还包括春夏控制我国东部沿海地区的西太平洋副热带反气旋环流,该系统主要向西影响我国内陆地区. . 采用NCEP全球再分析资料运行MM5获得研究区域2004年代表月份的气象场模拟结果,运用HYSPLIT4.8模式,计算代表城市的后向及前向气流轨迹.结果表明,不同季节,气流轨迹的分布差异明显,影响范围各不相同.影响长三角地区低层大气的输送气流主要来源于蒙古、华北或东北地区,途径黄海海域或东部沿海的山东、江苏或上海等地抵达长三角地区.受夏季西南季风的影响,西南方向也是比较重要的输送途径.长江三角洲地区对外界的中尺度污染传输主要受东亚季风活动的影响,其中冬季季风是长三角污染物向华南和西太平洋地区传输的一个主要机制;影响长三角污染物输送的重要系统还包括春夏控制我国东部沿海地区的西太平洋副热带反气旋环流,该系统主要向西影响我国内陆地区. |
| [37] | . ABSTRACT Statistical data are ”spatial” when they are compiled according to a topographical classification or simply consist of a pattern of points, or are otherwise associated with maps or locations. The authors’ earlier ”Spatial autocorrelation.” Academic Press (1973) addressed hypothesis testing for the correlation and trend in a spatially-observed variable. The new book is enlarged to cover extensive recent work on models and analysis of spatial patterns. Compared to B. D. Ripley’s book ”Spatial statistics.” (1981; Zbl 0583.62087)] the present book contains more evaluation of the statistical performance of proposed methods upon case studies (mainly demographic), and less exposition of mathematical aspects of model-building or image analysis. Features are the discussions of scale and of model identification, caveats on the use of statistical methods based on independence, and analysis of regression residuals. Correlograms (but not spectral analysis) are prominent. The book is addressed to a mixed audience and supplies 258 references. |
| [38] | . |
| [39] | . <p>本文分析了城市化与生态环境的交互耦合机制,采用代数学和几何学两种方法对环境库兹涅茨(KUZNETS)曲线和城市化对数曲线进行逻辑复合,推导出城市化与生态环境交互耦合的数理函数和几何曲线,揭示出区域生态环境随城市化的发展存在先指数衰退、后指数改善的耦合规律。交互耦合的过程分为低水平协调、拮抗、磨合和高水平协调四个阶段。文章最后对浙江省进行了实证分析</p> . <p>本文分析了城市化与生态环境的交互耦合机制,采用代数学和几何学两种方法对环境库兹涅茨(KUZNETS)曲线和城市化对数曲线进行逻辑复合,推导出城市化与生态环境交互耦合的数理函数和几何曲线,揭示出区域生态环境随城市化的发展存在先指数衰退、后指数改善的耦合规律。交互耦合的过程分为低水平协调、拮抗、磨合和高水平协调四个阶段。文章最后对浙江省进行了实证分析</p> |
| [40] | . |
| [41] | . Spatial econometrics : methods and models by Luc Anselin (Studies in operational regional science, 4) Kluwer Academic Publishers, c1988 : pbk |
| [42] | . |
| [43] | . 城市化质量是经济城市化质量、社会城市化质量和空间城市化质量的有机统一,城市化发展质量的提升是加快推进我国城市化进程健康发展的关键。本文借助象限图法,通过对城市化质量、速度与城市化水平互动协调关系的分析,从经济、社会、空间三方面提出了由三类指标、12项具体指标组成的城市化发展质量综合测度的三维指标球及判别标准值,引进阿特金森模型,构建了城市化发展质量的分要素测度模型和分段测度模型,进而对中国城市化发展质量及其空间分异特征做了总体评价。研究表明,1980~2008年中国城市化发展质量总体处于中等水平,并正在缓慢提升,但提质速度慢于提速速度;分类城市化质量呈现出经济城市化质量< 社会城市化质量< 空间城市化质量的态势;全国分省城市化发展质量都在不同程度的提升,并呈现出"内陆→沿海→内陆→沿海→整体提高"的时空差异性,东部地区城市化质量总体高于中部地区,中部地区高于西部地区;城市化发展质量与城市规模不存在对应关系,并不是城市规模越大城市化质量越好,人口城市化水平并不能反映城市化发展质量的高低。 . 城市化质量是经济城市化质量、社会城市化质量和空间城市化质量的有机统一,城市化发展质量的提升是加快推进我国城市化进程健康发展的关键。本文借助象限图法,通过对城市化质量、速度与城市化水平互动协调关系的分析,从经济、社会、空间三方面提出了由三类指标、12项具体指标组成的城市化发展质量综合测度的三维指标球及判别标准值,引进阿特金森模型,构建了城市化发展质量的分要素测度模型和分段测度模型,进而对中国城市化发展质量及其空间分异特征做了总体评价。研究表明,1980~2008年中国城市化发展质量总体处于中等水平,并正在缓慢提升,但提质速度慢于提速速度;分类城市化质量呈现出经济城市化质量< 社会城市化质量< 空间城市化质量的态势;全国分省城市化发展质量都在不同程度的提升,并呈现出"内陆→沿海→内陆→沿海→整体提高"的时空差异性,东部地区城市化质量总体高于中部地区,中部地区高于西部地区;城市化发展质量与城市规模不存在对应关系,并不是城市规模越大城市化质量越好,人口城市化水平并不能反映城市化发展质量的高低。 |
| [44] | . <p>运用AHP熵权法、马尔科夫链和ESDA方法,在GIS技术支持下,基于中国高新技术产业31个空间单元2000、2005和2010年3个时间断面的数据,分析了高新技术产业发展水平的时空格局演变及其影响因素。研究结果表明:(1)高新技术产业发展水平的时序演变中各省区高新技术产业的发展差距在2000~2005与2005~2010年两时期中均不断扩大,尤以前一时期更甚,数据说明高水平的省份发展速度快于低水平省份,高水平省份才是我国高技术产业发展的主动力。省区间高新技术产业发展水平虽然整体上均在不断发展,但是区域间的差异不断扩大,出现强者愈强,弱者恒弱的“马太效应”;(2)发展水平指数处于高水平、较高水平省区集中在东部沿海地区,低水平省区向中西部除陕西以外的省区集聚的趋势增强,地域范围不断扩大,空间相关性较强,存在“俱乐部趋同”现象;(3)基础、经济、政策等传统因子在初期对高新技术产业发展的促进作用明显,随着产业逐步向更高层次发展,及政策环境的完善,传统因素的影响逐渐扁平化,而集聚、人力资本等新兴因素对高新技术产业的影响不断加强,区位因素的作用一直很明显,与高新技术产业的发展特征相吻合</p> . <p>运用AHP熵权法、马尔科夫链和ESDA方法,在GIS技术支持下,基于中国高新技术产业31个空间单元2000、2005和2010年3个时间断面的数据,分析了高新技术产业发展水平的时空格局演变及其影响因素。研究结果表明:(1)高新技术产业发展水平的时序演变中各省区高新技术产业的发展差距在2000~2005与2005~2010年两时期中均不断扩大,尤以前一时期更甚,数据说明高水平的省份发展速度快于低水平省份,高水平省份才是我国高技术产业发展的主动力。省区间高新技术产业发展水平虽然整体上均在不断发展,但是区域间的差异不断扩大,出现强者愈强,弱者恒弱的“马太效应”;(2)发展水平指数处于高水平、较高水平省区集中在东部沿海地区,低水平省区向中西部除陕西以外的省区集聚的趋势增强,地域范围不断扩大,空间相关性较强,存在“俱乐部趋同”现象;(3)基础、经济、政策等传统因子在初期对高新技术产业发展的促进作用明显,随着产业逐步向更高层次发展,及政策环境的完善,传统因素的影响逐渐扁平化,而集聚、人力资本等新兴因素对高新技术产业的影响不断加强,区位因素的作用一直很明显,与高新技术产业的发展特征相吻合</p> |
