 , 张蕾
, 张蕾Changes in population exposure to high temperature under a future scenario in China and its influencing factors
HUANGDapeng, ZHANGLei收稿日期:2015-10-25
修回日期:2016-05-25
网络出版日期:2016-07-25
版权声明:2016《地理学报》编辑部本文是开放获取期刊文献,在以下情况下可以自由使用:学术研究、学术交流、科研教学等,但不允许用于商业目的.
基金资助:
作者简介:
-->
展开
摘要
关键词:
Abstract
Keywords:
-->0
PDF (3724KB)元数据多维度评价相关文章收藏文章
本文引用格式导出EndNoteRisBibtex收藏本文-->
1 引言
联合国政府间气候变化专门委员会(IPCC)于2014发布的第五次评估报告显示,1880-2012年,全球地表温度升高了0.85 ℃ [1]。气温的升高已经导致人类热相关疾病和死亡风险的增加[2]。极端高温期间,城市脆弱人口以及城乡户外工作者发病和意外死亡的风险已经被IPCC第五次评估报告确定为气候变化的关键风险之一[3]。近年来,极端高温天气及高温灾害在全球频繁发生。2003年的高温热浪席卷了欧洲,造成至少3.5万人死亡[4]。2010年夏季高温热浪袭击北半球多国,俄罗斯遭受了40年来最严重的高温干旱[5]。2013年夏季中国南方地区遭遇1951年以来最强的高温热浪袭击,中暑、呼吸道疾病和心脑血管疾病发病人数和死亡率激增[6]。2014年印度新德里47.8 ℃高温创62年来纪录,澳大利亚年初经历罕见高温,超过150项气候纪录被打破[7]。2015年高温热浪席卷巴基斯坦卡拉奇,超过1200人死亡[8]。2016年5月19日,印度拉贾斯坦邦的小城珀洛迪最高气温达51 ℃,刷新印度近60年来的最高气温纪录[9]。高温灾害对人体健康、生命安全构成严重威胁,对人们的日常生活以及社会经济发展造成不利影响,高温灾害研究已引起政府部门和科学界的普遍关注,成为了气候变化研究的热点。目前,高温灾害的研究主要集中在高温本身的时空特征(包括高温强度、发生频率、持续时间等)[10-13]、高温的天气成因与环流背景[14-17]、高温的气候特征[17-20]、高温的灾害影响[21-28]等方面。近年来,高温灾害的风险评价在国内开始出现,取得了重要进展。谢盼等[29]构建了基于“高温胁迫—社会脆弱性—人口暴露”的高温灾害人群健康风险评价框架,实现了中国县域尺度的高温灾害人群健康风险评价,为高温灾害风险定量化研究做出了有益探索。但此风险评估针对过去已发生的高温事实,使用的社会经济数据为过去的静态统计资料,未考虑未来高温的变化及社会经济的发展;高温胁迫和人口暴露的表达均采用县域的均质化表达,不能精细化的表达高温的人口暴露度。尹占娥等[30]基于历史高温观测数据,利用概率分布方法计算不同重现期的高温情景,以土地利用表达高温灾害的暴露度,最终实现不同重现期下的高温危险性评估,但这种情景分析仍然是基于过去的高温事实。贺山峰等[31]基于单模式的气候情景数据综合高温日数和热浪日数对中国高温灾害危险性的时空格局进行预估,未涉及暴露度的研究;董思言等[32]基于全球气候模式的情景数据和社会经济情景数据对中国未来高温灾害风险进行了评估,该评估采用专家打分赋权方法综合人口、GDP和耕地评估高温暴露度,未针对人口暴露度进行深入分析。本文基于NASA最新发布的高分辨率全球气候预测数据集和奥地利国际应用系统分析研究所(IIASA)的GGI人口情景数据,以网格为基本分析单元分析未来不同时期中国人口对不同强度高温暴露度的动态变化,并深入研究全国范围和气象地理分区的高温和强危害性高温人口暴露度变化的影响因素。本文的研究成果可以为未来不同时期高温的人口暴露度的热点区域识别及高温灾害风险防范提供科学参考。
2 数据来源与研究方法
2.1 数据来源
本文所用的气候数据集是美国国家航空航天局(NASA)发布的地球交换计划(NASA Earth Exchange)最新产品(NEX-GDDP数据集),将全球实际观测数据(1950-2005年)与CMIP 5气候模拟资料(2006-2100年)相结合,包括21个全球气候模式(表1)的逐日最高气温数据,空间分辨率均为0.25o×0.25o。该气候数据集包括RCP 4.5和RCP 8.5两种情景,本文选用RCP8.5排放情景,该情景代表温室气体的高排放情景[33]。中国人口情景数据来自奥地利国际应用系统分析研究所(IIASA)的GGI情景数据库。该数据库包含A2r、B2和B1三种基准的社会经济和技术发展情景。A2r情景是在SRES A2情景基础上修改的新情景,该情景考虑了长期人口展望的最新观点,即未来世界人口的增速将减缓[34]。考虑到RCP8.5情景中有关人口和社会经济发展趋势以及技术发展的假定来源于A2r情景[33],本文选用A2r情景下的人口数据,以与RCP 8.5情景保持一致。GGI人口情景数据的时间分辨率为10年,空间分辨率为0.5o× 0.5o。为保持人口数据与日最高气温数据在空间尺度上的一致性,将人口数据采用平均值计算方法插值到0.25o× 0.25o的网格上。
Tab. 1
表1
表1NEX-GDDP中21个全球气候模式信息
Tab. 1Information of 21 global climatic models in NEX-GDDP dataset
| 气候模式名称/所属国家 | ||
|---|---|---|
| ACCESS1-0 /澳大利亚 | CSIRO-MK3-6-0 /澳大利亚 | MIROC-ESM /日本 |
| BCC-CSM1-1 /中国 | GFDL-CM3 /美国 | MIROC-ESM-CHEM /日本 |
| BNU-ESM /中国 | GFDL-ESM2G /美国 | MIROC5 /日本 |
| CanESM2 /加拿大 | GFDL-ESM2M /美国 | MPI-ESM-LR /德国 |
| CCSM4 /美国 | INMCM4 /俄罗斯 | MPI-ESM-MR /德国 |
| CESM1-BGC /美国 | IPSL-CM5A-LR /法国 | MRI-CGCM3 /日本 |
| CNRM-CM5 /法国 | IPSL-CM5A-MR /法国 | NorESM1-M /挪威 |
新窗口打开
2.2 高温的人口暴露度构建
根据中国气候和环境特点,将日最高气温≥ 35 ℃定义为高温,日最高气温≥ 40 ℃定义为强危害性高温[35]。将高温的人口暴露度定义为年均高温日数与暴露于高温下的人口数量的乘积[36]。本文中高温的人口暴露度的具体计算方法为:将RCP 8.5情景下21个全球气候模式集合平均得到的年均高温日数和年均强危害性高温日数分别与A2r社会经济情景下的人口数据相乘,得到高温的人口暴露度和强危害性高温的人口暴露度。为了研究未来高温的人口暴露度变化,本文分别计算了1981-2010年(基准时段)、2021-2040年、2041-2060年、2061-2080年和2081-2100年共5个时段的中国高温的人口暴露度。2.3 高温的人口暴露度变化的影响因素分析
高温的人口暴露度变化受高温日数和人口数量及分布变化的影响,可以分解为气候因子(高温日数变化,人口数量不变)影响、人口因子(高温日数不变,人口数量变化)影响、人口和气候因子(高温日数和人口数量均变化)共同影响。高温的人口暴露度变化可表示为:
式中:x、y分别为高温日数和人口数量;
高温的人口暴露度变化中不同影响因素的贡献率计算方法如下:
气候因子的贡献率:
人口因子的贡献率:
人口和气候因子共同的贡献率:
3 结果分析
3.1 中国高温和强危害性高温的人口暴露度
从中国高温的人口暴露度来看,未来情景下中国高温和强危害性高温的人口暴露度从21世纪20年代开始明显增加(图1)。基准时段1981-2010年,中国高温的人口暴露度为58.41亿人?d;2021-2040年、2041-2060年、2061-2080年和2081-2100年,中国高温的人口暴露度分别增加到134.33亿人?d、177.23亿人?d、267.87亿人?d和402.49亿人?d,相比基准时段分别增加了1.3、2.0、3.6和5.9倍。基准时段(1981-2010年),中国强危害性高温的人口暴露度为1.33亿人?d;2021-2040年、2041-2060年、2061-2080年和2081-2100年,中国强危害性高温的人口暴露度分别增加到3.97亿人?d、12.43亿人?d、33.61亿人?d和111.65亿人?d,相比基准时段分别增加了2.0、8.3、24.2和82.7倍。21世纪后期中国强危害性高温的人口暴露度增幅显著,需要特别关注强危害性高温对人体健康的不利影响,重点加强对强危害性高温的预警和防范工作。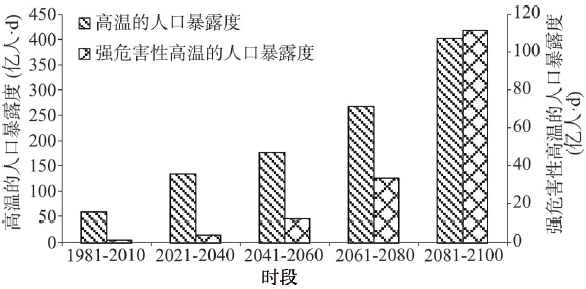 显示原图|下载原图ZIP|生成PPT
图1基准时段和未来情景下中国人口对高温和强危害性高温的暴露度
-->Fig. 1Population exposure to high temperature and extremely high temperature for the 1981-2010 base period and projected exposures under RCP8.5 climate scenario and A2r population scenario for future periods in China
-->
3.2 中国高温的人口暴露度分布
基准时段1981-2010年,北京东南部、天津中东部、河北中南部、山东西部、河南东北部、湖北东北部、江西中北部、湖南东部及重庆西南部等地的高温的人口暴露度为4×10⁶人?d~10×106人?d,其余大部分地区不足1×10⁶人?d(图2)。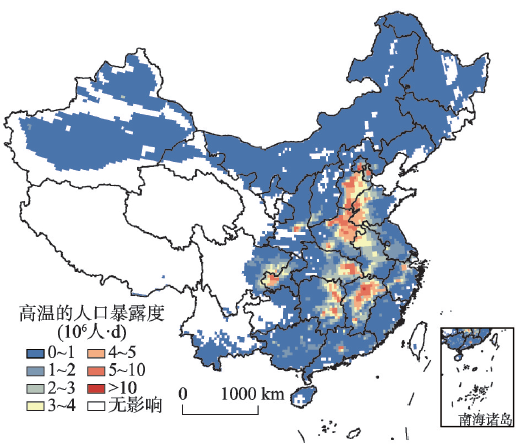 显示原图|下载原图ZIP|生成PPT
图2基准时段1981-2010年中国高温的人口暴露度
-->Fig. 2Population exposure to high temperature for the 1981-2010 base period in China
-->
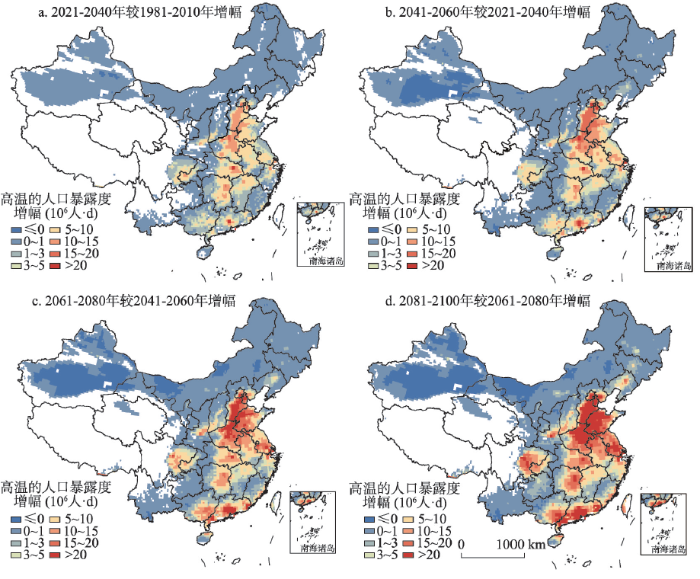
未来情景下,除甘肃大部、青海、西藏、四川中西部及云南北部外,中国大部地区人口受到高温的影响,且从2021-2040年开始高温的人口暴露度明显增加。与基准时段相比,2021-2040年,中国大部地区高温的人口暴露度明显增加,其中北京东南部、河北中南部、山东西部、河南东北部以及天津东部、湖北东部、湖南东部、广东中部等地的部分地区增幅为10×106人?d~20×106人?d(图3a);2041-2060年,除新疆东南部外,大部地区高温的人口暴露度继续增加,北京东南部、天津、河北中南部、山东西部、河南东北部、安徽北部、江苏南部以及湖北东部、湖南东部、广东中部等地的部分地区高温的人口暴露度增加10×106人?d~20×106人?d,其中北京东南部以及天津、河南、湖北、上海和广东的局部地区增幅超过20×106人?d(图3b);2061-2080年,北京东南部、天津、河北中南部、山东中西部、河南中东部、安徽北部、江苏南部、广东中南部、广西东南部以及湖北东部、湖南中东部、四川盆地、陕西关中等地的部分地区高温的人口暴露度增加10×106人?d~20×106人?d,其中北京东南部、天津中部、河北中南部、山东西部、河南东北部、广东中部以及江苏、上海、湖北等地的局部地区增幅超过20×106人?d(图3c);2081-2100年,北京大部、天津、河北中南部、山东中西部、河南东北部、江苏南部、广东南部以及上海、浙江、湖北、湖南、广西、四川盆地、陕西关中等地局部地区高温的人口暴露度增幅超过20×106人?d(图3d)。
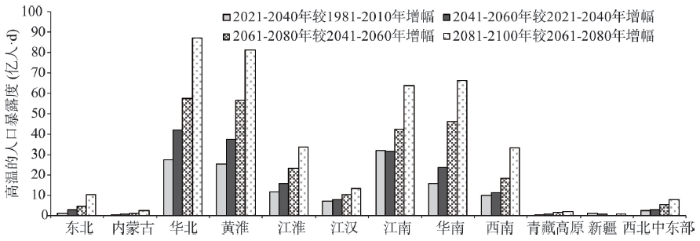
从中国气象地理区划的分区[37]来看,未来不同时段高温的人口暴露度在华北、黄淮、华南、江南、江淮、西南和江汉等区域增加较为明显(图4)。与基准时段1981-2010年相比,2021-2040年,江南、华北、黄淮、华南、江淮、西南和江汉等区域高温的人口暴露度增幅在7.00亿人?d以上,其中江南、华北和黄淮的增幅超过25.28亿人?d;与2021-2040年相比,2041-2060年,华北、黄淮、江南、华南、江淮、西南和江汉等区域高温的人口暴露度增幅在7.73亿人?d以上,其中华北、黄淮和江南的增幅超过31.77亿人?d;与2041-2060年相比,2061-2080年,华北、黄淮、华南、江南、江淮、西南和江汉的高温的人口暴露度增幅在10.29亿人?d以上,其中华北、黄淮、华南和江南的增幅达42.46亿人?d以上,华北和黄淮的增幅超过56.82亿人?d;与2061-2080年相比,2081-2100年,华北、黄淮、华南、江南、江淮、西南高温的人口暴露度增幅在33.36亿人?d以上,其中华南和江南的增幅达63.96亿人?d以上,华北和黄淮的增幅超过81.45亿人?d。
 显示原图|下载原图ZIP|生成PPT
图3未来情景下各时段中国高温的人口暴露度变化
-->Fig. 3Projected changes in population exposure to high temperature for future periods under RCP8.5 climate scenario and A2r population scenario in China
-->
 显示原图|下载原图ZIP|生成PPT
图4未来情景下中国不同区域的高温的人口暴露度变化
-->Fig. 4Projected changes in regional population exposure to high temperature for future periods under RCP8.5 climate scenario and A2r population scenario in different meteorological geographical divisions of China
-->
3.3 中国强危害性高温的人口暴露度分布
基准时段1981-2010年,新疆南疆和北疆中部、陕西关中、山西西南部、内蒙古东北部部分地区、北京东北部、天津、河北中东部、山东西部大部、河南中东部、安徽中部、湖北东部、江西大部、湖南东北部及重庆西部等地的人口遭受强危害性高温的危害,强危害性高温的人口暴露度一般不足0.1×10⁶人?d,北京东南部、河北中南部、河南东北部及江西中北部部分地区强危害性高温的人口暴露度为0.1×10⁶人?d~0.2×10⁶人?d,其中北京东南部部分地区达0.3×10⁶人?d~0.5×10⁶人?d(图5)。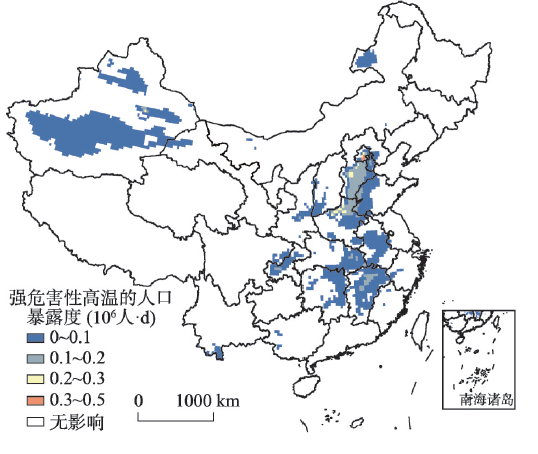 显示原图|下载原图ZIP|生成PPT
图5基准时段1981-2010年中国强危害性高温的人口暴露度
-->Fig. 5Population exposure to extremely high temperature for the 1981-2010 base period in China
-->
未来情景下,随着年代的增长,强危害性高温的人口暴露度在范围和强度上均有明显增加。与基准时段相比,2021-2040年上述大部地区强危害性高温的人口暴露度有所增加,其中北京东南部、天津中东部、河北中南部、河南东北部、湖北东部、江西中北部、湖南东部增加了0.6×10⁶人?d~1.2×10⁶人?d(图6a);与2021-2040年相比,2041-2060年人口受强危害性高温影响的范围和强度均明显增加,北京东南部、天津大部、河北中南部、山东西北部、河南东北部、湖北东部、江西中北部、湖南东北部等地强危害性高温的人口暴露度增幅超过1.2×10⁶人?d(图6b);2061-2080年中国中东部大部地区人口均受到强危害性高温的影响,与2041-2060年相比,北京东部、天津、河北中南部、山东中西部、河南中东部、安徽中北部、江苏西部和南部、浙江北部、江西北部、湖南东部、湖北东部、重庆西南部、四川盆地东南部、陕西关中及山西西南部等地强危害性高温的人口暴露度增幅超过1.2×10⁶人?d(图6c);与2061-2080年相比,2081-2100年中国中东部大部、重庆西部及四川盆地等地强危害性高温的人口暴露度增幅超过1.2×106人?d(图6d)。
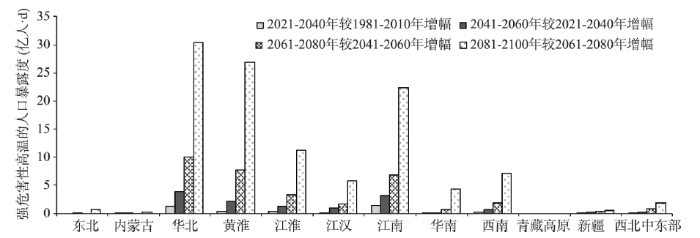
从中国气象地理区划的分区来看,未来不同时段强危害性高温的人口暴露度在华北、黄淮、江南、江淮、西南和江汉等区域增加较为明显(图7)。与基准时段1981-2010年相比,2021-2040年江南、华北、江淮、黄淮等区域强危害性高温的人口暴露度增幅在0.39亿人?d以上;与2021-2040年相比,2041-2060年华北、江南、黄淮、江淮、江汉和西南等区域强危害性高温的人口暴露度增幅在0.62亿人?d以上,其中华北和江南的增幅超过3.16亿人?d;与2041-2060年相比,2061-2080年华北、黄淮、江南、江淮、西南、江汉、西北中东部、华南和新疆的强危害性高温的人口暴露度增幅在0.34亿人?d以上,其中华北、黄淮、江南和江淮的增幅达3.29亿人?d以上,华北、黄淮和江南的增幅超过6.88亿人?d;与2061-2080年相比,2081-2100年,除东北、内蒙古、青藏高原和新疆外,其余区域强危害性高温的人口暴露度增幅均高于1.82亿人?d,其中华北、黄淮、江南、江淮、西南、江汉和华南的增幅达4.37亿人?d以上,华北和黄淮的增幅超过26.94亿人?d。
 显示原图|下载原图ZIP|生成PPT
图6未来情景下各时段中国强危害性高温的人口暴露度变化
-->Fig. 6Projected changes in population exposure to extremely high temperature for future periods under RCP8.5 climate scenario and A2r population scenario in China
-->
 显示原图|下载原图ZIP|生成PPT
图7未来情景下中国不同区域强危害性高温的人口暴露度变化
-->Fig. 7Projected changes in regional population exposure to extremely high temperature for future periods under RCP8.5 climate scenario and A2r population scenario in different meteorological geographical divisions of China
-->
3.4 未来情景下高温和强危害性高温的人口暴露度变化的影响因素分析
高温和强危害性高温的人口暴露度变化不仅取决于气候因子(高温日数)的变化,也取决于人口数量及其空间分布的变化。从全国尺度来看,未来不同时段高温和强危害性高温的人口暴露度变化主要由气候因子(高温日数变化,人口数量不变)主导,且气候因子的影响在未来不同时段逐渐减弱;人口因子(高温日数不变,人口数量变化)在未来不同时段人口暴露度变化中的影响很小,人口因子影响最强的时段反映在2021-2040年相较于1981-2010年的变化中,对高温的人口暴露度变化的贡献率达13.1%,对强危害性高温的人口暴露度变化的贡献率达7.7%,其它时段的贡献率均不足3.0%;人口和气候因子的共同影响(高温日数和人口数量均变化)在未来不同时段逐渐增强,贡献率由20.0%左右逐渐增加到40.0%左右(表2)。Tab. 2
表2
表2中国高温和强危害性高温的人口暴露度变化的影响因素分析
Tab. 2Analysis of factors affecting changes in population exposure to high temperature and extremely high temperature in China
| 暴露度变化 | 高温(≥ 35℃) | 强危害性高温(≥ 40℃) | |||||
|---|---|---|---|---|---|---|---|
| 人口因子(%) | 气候因子(%) | 人口和气候因子(%) | 人口因子(%) | 气候因子(%) | 人口和气候因子(%) | ||
| 2021-2040年较1981-2010年 | 13.1 | 67.6 | 19.4 | 7.7 | 68.9 | 23.4 | |
| 2041-2060年较2021-2040年 | 2.9 | 67.6 | 29.5 | 0.9 | 67.1 | 32.1 | |
| 2061-2080年较2041-2060年 | 1.5 | 66.3 | 32.2 | 0.3 | 65.4 | 34.4 | |
| 2081-2100年较2061-2080年 | 1.8 | 58.4 | 39.9 | 0.1 | 59.9 | 40.0 | |
新窗口打开
考虑到中国高温和强危害性高温的人口暴露度变化主要发生在华北、黄淮、江淮、江汉、江南、华南和西南地区,仅对这些区域人口暴露度变化的影响因素进行分析(表3)。除华北地区在2041-2060年、2061-2080年、2081-2100年高温和强危害性高温的人口暴露度的增加主要受人口和气候因子共同影响(高温日数和人口数量均变化)外,其它区域未来不同时段人口暴露度的变化主要受气候因子(高温日数变化,人口数量不变)影响,其次受人口和气候因子(高温日数和人口数量均变化)的共同影响;各区域不同时段人口暴露度的变化受人口因子(高温日数不变,人口数量变化)的影响较小,贡献率一般低于9.0%,仅在华北、黄淮、江淮2021-2040年高温的人口暴露度变化中、黄淮2061-2080年高温的人口暴露度变化中以及华北2021-2040年强危害性高温的人口暴露度变化中高于9.0%。西南地区在高温的人口暴露度变化中,气候因子占绝对的主导地位,贡献率达90.0%以上,西南和华南地区在强危害性高温的人口暴露度变化中,气候因子同样的占绝对的主导地位。
Tab. 3
表3
表3中国不同气象地理分区高温和强危害性高温的人口暴露度变化的影响因素分析
Tab. 3Analysis of factors affecting changes in population exposure to high temperature and extremely high temperature in different meteorological geographical divisions of China
| 暴露度变化 | 气象地理分区 | 高温(≥ 35℃) | 强危害性高温(≥ 40℃) | |||||
|---|---|---|---|---|---|---|---|---|
| 人口因子(%) | 气候因子 (%) | 人口和气候 因子(%) | 人口因子 (%) | 气候因子 (%) | 人口和气候因子(%) | |||
| 2021-2040年较1981-2010年增幅 | 华北 | 30.1 | 40.0 | 29.9 | 19.0 | 45.6 | 35.5 | |
| 黄淮 | 13.5 | 63.4 | 23.1 | 8.6 | 66.9 | 24.5 | ||
| 江淮 | 11.1 | 68.3 | 20.6 | 3.4 | 75.7 | 20.9 | ||
| 江汉 | 9.0 | 72.1 | 18.9 | 2.4 | 77.8 | 19.8 | ||
| 江南 | 9.7 | 74.6 | 15.7 | 1.9 | 78.6 | 19.5 | ||
| 华南 | 3.9 | 78.9 | 17.2 | -12.7 | 152.6 | -39.9 | ||
| 西南 | 2.5 | 92.9 | 4.6 | 0.3 | 96.4 | 0.3 | ||
| 2041-2060年较2021-2040年增幅 | 华北 | 8.7 | 39.7 | 51.7 | 2.6 | 43.5 | 53.9 | |
| 黄淮 | 2.8 | 62.3 | 34.9 | 0.5 | 65.8 | 33.7 | ||
| 江淮 | 2.0 | 67.9 | 30.1 | 0.3 | 71.7 | 28.0 | ||
| 江汉 | 1.7 | 73.0 | 25.3 | 0.1 | 74.0 | 25.9 | ||
| 江南 | 1.3 | 77.7 | 21.1 | 0.1 | 76.0 | 23.9 | ||
| 华南 | 0.3 | 76.2 | 23.5 | -0.4 | 125.1 | -24.7 | ||
| 西南 | -2.5 | 106.5 | -4.0 | -0.4 | 107.6 | -7.1 | ||
| 2061-2080年较2041-2060年增幅 | 华北 | 4.7 | 36.6 | 58.7 | 0.7 | 40.0 | 59.2 | |
| 黄淮 | 14.6 | 58.8 | 39.8 | 0.1 | 63.2 | 36.6 | ||
| 江淮 | 1.1 | 64.3 | 34.6 | 0.1 | 67.6 | 32.3 | ||
| 江汉 | 1.1 | 71.3 | 27.6 | 0.0 | 71.2 | 28.8 | ||
| 江南 | 1.0 | 77.2 | 21.8 | 0.1 | 75.4 | 24.6 | ||
| 华南 | 0.2 | 71.7 | 28.1 | 0.0 | 92.8 | 7.2 | ||
| 西南 | -0.9 | 108.0 | -7.0 | -0.1 | 106.7 | -6.6 | ||
| 2081-2100年较2061-2080年增幅 | 华北 | 3.6 | 31.8 | 64.6 | 0.3 | 35.3 | 64.4 | |
| 黄淮 | 1.7 | 48.7 | 49.6 | 0.1 | 56.2 | 43.7 | ||
| 江淮 | 1.5 | 54.3 | 44.2 | 0.1 | 61.3 | 38.6 | ||
| 江汉 | 2.0 | 61.2 | 36.9 | 0.0 | 65.5 | 34.5 | ||
| 江南 | 2.1 | 66.4 | 31.5 | 0.1 | 69.0 | 30.9 | ||
| 华南 | 0.4 | 62.1 | 37.6 | 0.0 | 80.9 | 19.1 | ||
| 西南 | 0.4 | 99.9 | -0.3 | 0.0 | 100.6 | -0.6 | ||
新窗口打开
4 结论与讨论
基于最新的全球高分辨率多模式RCP 8.5气候情景数据和A2r人口情景数据,对未来情景下中国高温和强危害性高温的人口暴露度变化及其影响因素进行研究,主要结论为:(1)从全国范围来看,相比于基准时段1981-2010年,未来情景下中国高温的人口暴露度逐渐增加,2021-2040年、2041-2060年、2061-2080年和2081-2100年分别增加1.3、2.0、3.6和5.9倍,强危害性高温的人口暴露度增加更加明显,分别增加2.0、8.3、24.2和82.7倍。
(2)未来情景下,除甘肃大部、青海、西藏、四川中西部及云南北部外,中国大部地区人群受到高温影响,且从2021-2040年开始高温的人口暴露度明显增加。至2081-2100年,北京大部、天津、河北中南部、山东中西部、河南中东部、江苏、安徽中北部、湖北东部、湖南东部、广东南部、广西东南部及四川盆地高温的人口暴露度增幅最为明显。强危害性高温的人口暴露度从基准时段只出现在中国中部和新疆发展至中国北方和中东部大部地区。
(3)从中国气象地理区划的分区来看,未来不同时段高温的人口暴露度在华北、黄淮、华南、江南、江淮、西南和江汉等区域增加较为明显,其中华北、黄淮、华南和江南最为显著。未来不同时段强危害性高温的人口暴露度在华北、黄淮、江南、江淮、西南和江汉等区域增加较为明显,其中华北、黄淮、江南和江淮最为显著。
(4)从全国尺度来看,在未来不同时段高温和强危害性高温的人口暴露度变化中气候因子占主导,其次为人口和气候因子的共同影响。气候因子的影响在未来不同时段逐渐减弱,在高温的人口暴露度变化中,其贡献率由67.6%逐渐减至58.4%;在强危害性高温的人口暴露度变化中,其贡献率由68.9%逐渐减至59.9%。人口和气候因子的共同影响在未来不同时段逐渐增强,贡献率由20.0%左右逐渐增至40.0%左右。
(5)从中国气象地理区划的分区来看,华北地区在2041-2060年、2061-2080年、2081-2100年高温和强危害性高温的人口暴露度的增加主要受人口和气候因子的共同作用,其次为气候因子的影响;黄淮、江淮、江汉、江南、华南和西南地区人口暴露度的变化主要受气候因子的影响,其次受人口和气候因子的共同作用;各区域不同时段人口暴露度的变化受人口因子的影响较小。西南地区在高温的人口暴露度变化中,气候因子占绝对的主导地位,西南和华南地区在强危害性高温的人口暴露度变化中,气候因子同样的占绝对的主导地位。
总体上来说,未来情景下中国中东部大部高温的人口暴露度明显增加,强危害性高温的人口暴露度增幅更为明显,因此要重点加强对强危害性高温的预警与防范。未来情景下高温的人口暴露度变化主要受气候因子的影响,其次受人口和气候因子的共同作用,单独人口因子的影响很小。
本文采用多模式集合平均方法对未来高温情景进行了预估,该方法是气候变化预估的一种常用方法,但多模式对于未来高温模拟的不确定性仍需要进一步研究。本文基于网格单元,以高温日数和高温对应网格单元的人口情景数据作为直接衡量高温的人口暴露度指标,精细化的揭示了高温的人口暴露度变化。分区域研究人口暴露度的变化规律及其影响因素,识别人口暴露度变化的热点区域,为更加有效的开展高温预警和高温灾害风险的防范工作提供了科学指导。高温灾害风险除了受高温的人口暴露度影响之外,还与不同人群的高温适应能力、不同区域的高温防御水平等因素有关,年龄、性别、职业、疾病状况、医疗资源、经济水平等均会在一定程度上影响人群对高温的反应,因此,有必要在本文的基础上,进一步研究未来情景下高温灾害脆弱性的时空演变,提升高温灾害的风险管理水平。
The authors have declared that no competing interests exist.
参考文献 原文顺序
文献年度倒序
文中引用次数倒序
被引期刊影响因子
| [1] | CiteSeerX - Scientific documents that cite the following paper: Climate change 2007: Synthesis report. Contribution of Working Groups I |
| [2] | IPCC第五次评估报告(AR5)第二工作组(WGⅡ)报告评估了气候变化对人类健康、人类安全、生计与贫困的影响,指出气候变化已经对人类健康和安全造成了负面影响,气候变化、气候变率和极端气候事件给城市和农村的贫困人口增添了额外的负担,与气候变化相关的风险增大.21世纪的气候变化,将继续加剧现有健康问题,增加人类的迁徙,放大冲突的驱动因素的影响,对许多国家的关键基础设施造成不利影响,给小岛国和有很长海岸线国家的领土完整带来风险;整个21世纪,气候变化将减缓经济增长,进一步威胁粮食安全,使减贫更为困难,贫困问题更加突出. . IPCC第五次评估报告(AR5)第二工作组(WGⅡ)报告评估了气候变化对人类健康、人类安全、生计与贫困的影响,指出气候变化已经对人类健康和安全造成了负面影响,气候变化、气候变率和极端气候事件给城市和农村的贫困人口增添了额外的负担,与气候变化相关的风险增大.21世纪的气候变化,将继续加剧现有健康问题,增加人类的迁徙,放大冲突的驱动因素的影响,对许多国家的关键基础设施造成不利影响,给小岛国和有很长海岸线国家的领土完整带来风险;整个21世纪,气候变化将减缓经济增长,进一步威胁粮食安全,使减贫更为困难,贫困问题更加突出. |
| [3] | IPCC第五次评估报告第二工作组报告在气候变化风险及风险管理 方面聚焦于气候变化对领域和区域的不利影响.在综合分析与气候变化相关危害、暴露度和脆弱性的基础上,提出了气候变化风险的评估框架.风险不仅来自气候变 化本身,同时也来自人类社会发展和治理过程.报告首次提出了新生风险,归纳总结了气候变化带来的关键风险,评估了不同温升下气候变化5个“关注理由”的风 险水平.在风险管理过程中,由于适应和减缓的局限性,剩余风险是不可避免的.未来,若全球平均温度升高4℃(较工业革命以前)将加剧人类和社会生态系统广 泛的、严重的和不可逆影响的风险. . IPCC第五次评估报告第二工作组报告在气候变化风险及风险管理 方面聚焦于气候变化对领域和区域的不利影响.在综合分析与气候变化相关危害、暴露度和脆弱性的基础上,提出了气候变化风险的评估框架.风险不仅来自气候变 化本身,同时也来自人类社会发展和治理过程.报告首次提出了新生风险,归纳总结了气候变化带来的关键风险,评估了不同温升下气候变化5个“关注理由”的风 险水平.在风险管理过程中,由于适应和减缓的局限性,剩余风险是不可避免的.未来,若全球平均温度升高4℃(较工业革命以前)将加剧人类和社会生态系统广 泛的、严重的和不可逆影响的风险. |
| [4] | |
| [5] | |
| [6] | |
| [7] | |
| [8] | |
| [9] | |
| [10] | Abstract Top of page Abstract 1.Introduction 2.Data and methods 3.Spatial patterns of hot weather events 4.Temporal variations and trends 5.Relationships with rainfall and atmospheric circulation 6.Conclusion and discussion Acknowledgements References Based on the daily maximum temperature (DMT) records at 512 stations during 1961–2007, the geographical patterns and temporal variations of hot days (HDs) and heat waves (HWs, including those persisting for 3–5 days and longer) over mainland China were studied. The HD (and hence HW) was defined in two ways, one by an absolute criterion, DMT > 35 °C, as applied in the nationwide meteorological agencies and another in a relative sense, DMT > the 90th percentile threshold of a local daily temperature distribution around the day. Two centers of high frequencies (over 5 days per year) of the absolute HDs during June–September were found in the regions of Xinjiang and the mid-lower reaches of the Yangtze River. The highest frequencies of the absolute HWs were about 1.5 times per year in the Xinjiang region and to the south of the mid-lower reaches of the Yangtze River. The frequencies of the relative HWs were about 1–1.5 times per year in most of China. The HDs and HWs increased significantly during the studied period in most of China, especially over the southeastern coast and northern China (by over 4 days per decade for relative HDs and 0.4 times per decade for relative HWs), but decreased significantly at some stations in the lower reaches of the Yellow River. Over most of China except northwestern China, the frequency of HDs was high during the 1960s–1970s, low in the 1980s, and high afterwards, with strong interannual variations. A remarkable increasing trend of HDs occurred after the 1990s in all regions. The changes in HDs and HWs were closely related to those in rain days and atmospheric circulation patterns at the interannual and interdecadal scales. Copyright 08 2009 Royal Meteorological Society |
| [11] | 利用全国753个站1961-2010年夏季逐日最高气温资料和 基于死亡率明显增加而制定的高温热浪指标的已有研究成果,统计分析了我国高温热浪频次、日数和强度的时空分布特征.结果表明:我国的高温热浪频次、日数、 强度高值区基本相同,均在江淮、江南大部和四川盆地东部等地,其中江西北部、浙江北部高温热浪频次最高,高温日数最多;浙江北部高温强度尤为突出.近50 年来我国夏季高温热浪的频次、日数和强度总体呈增多、增强趋势,但也呈现明显的阶段性变化特征,20世纪60-80年代前期高温热浪频次和强度呈减少 (弱)趋势,80年代后期以来,高温热浪频次和强度呈增多(强)趋势.区域变化特征明显,华北北部和西部、西北中北部、华南中部、长江三角洲及四川盆地南 部呈显著增多(强)趋势;而黄淮西部、江汉地区呈显著减少趋势.自20世纪90年代以来,我国高温热浪的范围明显增大. . 利用全国753个站1961-2010年夏季逐日最高气温资料和 基于死亡率明显增加而制定的高温热浪指标的已有研究成果,统计分析了我国高温热浪频次、日数和强度的时空分布特征.结果表明:我国的高温热浪频次、日数、 强度高值区基本相同,均在江淮、江南大部和四川盆地东部等地,其中江西北部、浙江北部高温热浪频次最高,高温日数最多;浙江北部高温强度尤为突出.近50 年来我国夏季高温热浪的频次、日数和强度总体呈增多、增强趋势,但也呈现明显的阶段性变化特征,20世纪60-80年代前期高温热浪频次和强度呈减少 (弱)趋势,80年代后期以来,高温热浪频次和强度呈增多(强)趋势.区域变化特征明显,华北北部和西部、西北中北部、华南中部、长江三角洲及四川盆地南 部呈显著增多(强)趋势;而黄淮西部、江汉地区呈显著减少趋势.自20世纪90年代以来,我国高温热浪的范围明显增大. |
| [12] | 基于1960-2013年京津冀及周边地区34个气象站逐日最高气温和相对湿度资料,利用高温热浪模型,辅以趋势分析、突变检验及相关分析等方法,研究近54年京津冀地区热浪时空变化特征,探讨城市化对热浪变化的影响,并尝试寻找对热浪异常具有稳定指示意义的环流因子.结果表明1960-2013年京津冀地区热浪变化具有明显的阶段性,以20世纪70年代中期为转折,热浪呈先减少后增加趋势;京津冀地区热浪空间格局变化整体呈南减北增,东南平原区热浪呈下降趋势,北部生态涵养区呈现增加趋势;在区域尺度上,城市化或迁站影响并未改变北京极端热浪变化趋势,主要影响以轻度和中度热浪变化为主;西太平洋副热带高压和青藏高原反气旋环流与京津冀地区热浪异常关系最为显著,对热浪异常是一种稳定且强烈的指示信号.当青藏高原高空反气旋环流异常偏强,西太平洋副热带高压明显偏北,京津冀地区发生超级热浪可能性较大. . 基于1960-2013年京津冀及周边地区34个气象站逐日最高气温和相对湿度资料,利用高温热浪模型,辅以趋势分析、突变检验及相关分析等方法,研究近54年京津冀地区热浪时空变化特征,探讨城市化对热浪变化的影响,并尝试寻找对热浪异常具有稳定指示意义的环流因子.结果表明1960-2013年京津冀地区热浪变化具有明显的阶段性,以20世纪70年代中期为转折,热浪呈先减少后增加趋势;京津冀地区热浪空间格局变化整体呈南减北增,东南平原区热浪呈下降趋势,北部生态涵养区呈现增加趋势;在区域尺度上,城市化或迁站影响并未改变北京极端热浪变化趋势,主要影响以轻度和中度热浪变化为主;西太平洋副热带高压和青藏高原反气旋环流与京津冀地区热浪异常关系最为显著,对热浪异常是一种稳定且强烈的指示信号.当青藏高原高空反气旋环流异常偏强,西太平洋副热带高压明显偏北,京津冀地区发生超级热浪可能性较大. |
| [13] | 随着全球变暖,应对高温热浪事件是未来现代化城市面临的难题之一。本文利用全球模式—Had AM3p提供的3组不同边界场和初始场驱动区域气候模式系统PRECIS的输出结果,模拟未来情景下中国区域性高温热浪事件发生频率、强度及持续时间的变化趋势。结果表明:全球PRECIS对基准时段(1961—1990年)的高温热浪事件的发生的频率、强度和持续时间及对应的大气环流特征具有较强的模拟能力。相对于基准时段,未来情景下未来时段(2071—2100年)中国各地区的高温热浪事件的强度增加,发生频率增幅超过100%,且持续时间增加30%以上。此外,观测资料和模拟结果均表明武汉和哈尔滨地区的高温热浪与500 h Pa高度场的正距平密切相关。而未来情景下,武汉和哈尔滨地区500 h Pa高度场的正距平呈增加的趋势,表明这些地区未来可能出现危害更严重的高温热浪事件。 . 随着全球变暖,应对高温热浪事件是未来现代化城市面临的难题之一。本文利用全球模式—Had AM3p提供的3组不同边界场和初始场驱动区域气候模式系统PRECIS的输出结果,模拟未来情景下中国区域性高温热浪事件发生频率、强度及持续时间的变化趋势。结果表明:全球PRECIS对基准时段(1961—1990年)的高温热浪事件的发生的频率、强度和持续时间及对应的大气环流特征具有较强的模拟能力。相对于基准时段,未来情景下未来时段(2071—2100年)中国各地区的高温热浪事件的强度增加,发生频率增幅超过100%,且持续时间增加30%以上。此外,观测资料和模拟结果均表明武汉和哈尔滨地区的高温热浪与500 h Pa高度场的正距平密切相关。而未来情景下,武汉和哈尔滨地区500 h Pa高度场的正距平呈增加的趋势,表明这些地区未来可能出现危害更严重的高温热浪事件。 |
| [14] | 2003年我国和世界范围内,部分地区出现了盛夏异常高温天气。本文主要从环流特征和南京近百年气温资料,以江苏为主的长江中下游地区出现的异常高温成因,作了天气和气候的分析。经研究分析,造成2003年异常高温时段的副热带高压形势是符合历史同期出现高温天气的环流特征的。唯2003年高温时段的副热带高压的强度较历史同期显著偏强。从气候方面分析,2003年盛夏南京地区出现的高温天气仍未突破近百年来出现高温年的历史纪录。就南京地区而言,无论是7月下旬~8月上旬的持续高温,还是8月中旬紧接而来的低温冷夏天气,都显示出大气环流的演变特征和历史同期的气候特征。 . 2003年我国和世界范围内,部分地区出现了盛夏异常高温天气。本文主要从环流特征和南京近百年气温资料,以江苏为主的长江中下游地区出现的异常高温成因,作了天气和气候的分析。经研究分析,造成2003年异常高温时段的副热带高压形势是符合历史同期出现高温天气的环流特征的。唯2003年高温时段的副热带高压的强度较历史同期显著偏强。从气候方面分析,2003年盛夏南京地区出现的高温天气仍未突破近百年来出现高温年的历史纪录。就南京地区而言,无论是7月下旬~8月上旬的持续高温,还是8月中旬紧接而来的低温冷夏天气,都显示出大气环流的演变特征和历史同期的气候特征。 |
| [15] | Based on daily maximum and minimum surface air temperature and precipitation records at 303 meteorological stations in China, the spatial and temporal distributions of indices of climate extremes are analyzed during 1961-2003. Twelve indices of extreme temperature and six of extreme precipitation are studied. Temperature extremes have high correlations with the annual mean temperature, which shows a significant warming of 0.2700°C/decade, indicating that changes in temperature extremes reflect the consistent warming. Stations in northeastern, northern, northwestern China have larger trend magnitudes, which are accordance with the more rapid mean warming in these regions. Countrywide, the mean trends for cold days and cold nights have decreased by 0903’0.47 and 0903’2.06 days/decade respectively, and warm days and warm nights have increased by 0.62 and 1.75 days/decade, respectively. Over the same period, the number of frost days shows a statistically significant decreasing trend of 0903’3.37 days/decade. The length of the growing season and the number of summer days exhibit significant increasing trends at rates of 3.04 and 1.18 days/decade, respectively. The diurnal temperature range has decreased by 0903’0.1800°C/decade. Both the annual extreme lowest and highest temperatures exhibit significant warming trends, the former warming faster than the latter. For precipitation indices, regional annual total precipitation shows an increasing trend and most other precipitation indices are strongly correlated with annual total precipitation. Average wet day precipitation, maximum 1-day and 5-day precipitation, and heavy precipitation days show increasing trends, but only the last is statistically significant. A decreasing trend is found for consecutive dry days. For all precipitation indices, stations in the Yangtze River basin, southeastern and northwestern China have the largest positive trend magnitudes, while stations in the Yellow River basin and in northern China have the largest negative magnitudes. This is inconsistent with changes of water vapor flux calculated from NCEP/NCAR reanalysis. Large scale atmospheric circulation changes derived from NCEP/NCAR reanalysis grids show that a strengthening anticyclonic circulation, increasing geopotential height and rapid warming over the Eurasian continent have contributed to the changes in climate extremes in China. |
| [16] | A global perspective is developed on a number of high impact climate extremes in 2010 through diagnostic studies of the anomalies, diabatic heating, and global energy and water cycles that demonstrate relationships among variables and across events. Natural variability, especially ENSO, and global warming from human influences together resulted in very high sea surface temperatures (SSTs) in several places that played a vital role in subsequent developments. Record high SSTs in the Northern Indian Ocean in May 2010, the Gulf of Mexico in August 2010, the Caribbean in September 2010, and north of Australia in December 2010 provided a source of unusually abundant atmospheric moisture for nearby monsoon rains and flooding in Pakistan, Colombia, and Queensland. The resulting anomalous diabatic heating in the northern Indian and tropical Atlantic Oceans altered the atmospheric circulation by forcing quasi-stationary Rossby waves and altering monsoons. The anomalous monsoonal circulations had direct links to higher latitudes: from Southeast Asia to southern Russia, and from Colombia to Brazil. Strong convection in the tropical Atlantic in northern summer 2010 was associated with a Rossby wave train that extended into Europe creating anomalous cyclonic conditions over the Mediterranean area while normal anticyclonic conditions shifted downstream where they likely interacted with an anomalously strong monsoon circulation, helping to support the persistent atmospheric anticyclonic regime over Russia. This set the stage for the "blocking" anticyclone and associated Russian heat wave and wild fires. Attribution is limited by shortcomings in models in replicating monsoons, teleconnections and blocking. |
| [17] | 利用1957~2004年全国181个气象台站观测逐日最高气温,分析了我国年平均极端高温事件(Ex-treme Hot Events,EHE)日数、强度、最早发生日期(EHE Onset Date,EHE-OD)和最迟发生日期(EHETermination Date,EHE-TD)的气候态及年代际变化的时空特征。气候态分析结果显示,EHE的主要高发区位于我国东南部和新疆地区,其年际变率的较大区主要位于我国东部,新疆地区相对较小。我国EHE在过去48年中存在明显的年代际变化特征,其中发生日数与强度变化一致,EHE-OD和EHE-TD的变化相类似。按照EHE的时空变化特征,可将我国分为南部、中部、北方东部和北方西部4个区。南部地区EHE的多发期主要集中在20世纪60和80年代,中部地区为60和90年代,北方地区为90年代。进而对造成这4个区域EHE发生异常的年际和年代际大气环流因子进行分析,结果表明影响其年际和年代际变化的大气环流型是一致的。对北方地区而言,影响因子主要是对流层中高层的位势高度异常;而影响我国中部和南部地区的因子,除了其上空中高层的位势高度异常外,低层冷暖平流输送的作用也非常重要,这两个因子的共同作用造成该地EHE的异常。 . 利用1957~2004年全国181个气象台站观测逐日最高气温,分析了我国年平均极端高温事件(Ex-treme Hot Events,EHE)日数、强度、最早发生日期(EHE Onset Date,EHE-OD)和最迟发生日期(EHETermination Date,EHE-TD)的气候态及年代际变化的时空特征。气候态分析结果显示,EHE的主要高发区位于我国东南部和新疆地区,其年际变率的较大区主要位于我国东部,新疆地区相对较小。我国EHE在过去48年中存在明显的年代际变化特征,其中发生日数与强度变化一致,EHE-OD和EHE-TD的变化相类似。按照EHE的时空变化特征,可将我国分为南部、中部、北方东部和北方西部4个区。南部地区EHE的多发期主要集中在20世纪60和80年代,中部地区为60和90年代,北方地区为90年代。进而对造成这4个区域EHE发生异常的年际和年代际大气环流因子进行分析,结果表明影响其年际和年代际变化的大气环流型是一致的。对北方地区而言,影响因子主要是对流层中高层的位势高度异常;而影响我国中部和南部地区的因子,除了其上空中高层的位势高度异常外,低层冷暖平流输送的作用也非常重要,这两个因子的共同作用造成该地EHE的异常。 |
| [18] | 利用中国近50年逐日最高、最低气温和降水资料,计算分析北方极端高温、极端低温和极端强降水事件的频率变化趋势.研究结果表明,中国北方夜间温度极端偏低的日数显著趋于变少;白天温度偏高的日数则趋于增多,只有华北南部例外.同时我国北方日最低气温小于0℃的日数显著减少,这使得我国北方,尤其是东部地区无霜期明显加长.从降水来看,华北地区强降水事件趋于减少,但西北地区强降水事件趋于增多. . 利用中国近50年逐日最高、最低气温和降水资料,计算分析北方极端高温、极端低温和极端强降水事件的频率变化趋势.研究结果表明,中国北方夜间温度极端偏低的日数显著趋于变少;白天温度偏高的日数则趋于增多,只有华北南部例外.同时我国北方日最低气温小于0℃的日数显著减少,这使得我国北方,尤其是东部地区无霜期明显加长.从降水来看,华北地区强降水事件趋于减少,但西北地区强降水事件趋于增多. |
| [19] | |
| [20] | 基于华东气象站点1961-2005年逐日最高地面气温资料,分 析了华东高温日数和高温日平均最高气温的时空动态变化特征.结果表明:过去45年间,华东年均高温日数为15.1天.高温日平均最高气温为36.3℃,高 温以12~15年为显著振荡周期,在20世纪80年代为弱负距平,而在其他时期都为正距平.华东高温日数呈北少南多的空间分布,高温日平均最高气温以安 徽、浙江和江西较高.高温过程数是东北部少,西南部多.高温日数和高温过程数是以7月最多,高温日平均最高气温也是以7月最高.在21世纪最初5年,站点 高温日数和高温日平均最高气温增加,4-10月高温都为正距平,各级高温过程数总体最多,各级高温过程日平均最高气温也最高. . 基于华东气象站点1961-2005年逐日最高地面气温资料,分 析了华东高温日数和高温日平均最高气温的时空动态变化特征.结果表明:过去45年间,华东年均高温日数为15.1天.高温日平均最高气温为36.3℃,高 温以12~15年为显著振荡周期,在20世纪80年代为弱负距平,而在其他时期都为正距平.华东高温日数呈北少南多的空间分布,高温日平均最高气温以安 徽、浙江和江西较高.高温过程数是东北部少,西南部多.高温日数和高温过程数是以7月最多,高温日平均最高气温也是以7月最高.在21世纪最初5年,站点 高温日数和高温日平均最高气温增加,4-10月高温都为正距平,各级高温过程数总体最多,各级高温过程日平均最高气温也最高. |
| [21] | 由于全球气候变暖和城市热岛效应的影响,热浪已成为世界范围内夏季频繁发生的极端天气灾害事 件,加之其对人类健康的显著影响,因此得到了越来越多的组织和机构的关注,同时也取得了许多研究成果。通过对国内外研究现状的概述,介绍了高温热浪对人体 健康的影响,并根据相关因子,分单因子、双因子和多因子介绍了热浪对人体健康影响的主要研究方法,指出了目前热浪研究中的一些不足,并对如何降低热浪影响 提出了相应的建议。 . 由于全球气候变暖和城市热岛效应的影响,热浪已成为世界范围内夏季频繁发生的极端天气灾害事 件,加之其对人类健康的显著影响,因此得到了越来越多的组织和机构的关注,同时也取得了许多研究成果。通过对国内外研究现状的概述,介绍了高温热浪对人体 健康的影响,并根据相关因子,分单因子、双因子和多因子介绍了热浪对人体健康影响的主要研究方法,指出了目前热浪研究中的一些不足,并对如何降低热浪影响 提出了相应的建议。 |
| [22] | |
| [23] | 综述了高温热浪与干热风气象灾害在危害特点、类型与指标、气候特征、形成原因、对全球气候变暖的响应、防御技术与应对策略等6个方面的内容.并对两者进行了比较,高温热浪和干热风既有共同点又有区别和联系,两者均是一种较短时间尺度的重大天气灾害,高温低湿是两者主要的基本天气特征;在形成原因--主要是环流特征异常和对全球气候的响应等方面两者基本上是一致的;在同一地域同一时间两者也可能同时发生;在干旱季节有利于这两种灾害的发生发展和加重危害.在危害特点、类型与指标、气候特征、防御技术与应对策略等方面有所不同,高温热浪是一种综合性的气象灾害;而干热风是一种农业气象灾害. . 综述了高温热浪与干热风气象灾害在危害特点、类型与指标、气候特征、形成原因、对全球气候变暖的响应、防御技术与应对策略等6个方面的内容.并对两者进行了比较,高温热浪和干热风既有共同点又有区别和联系,两者均是一种较短时间尺度的重大天气灾害,高温低湿是两者主要的基本天气特征;在形成原因--主要是环流特征异常和对全球气候的响应等方面两者基本上是一致的;在同一地域同一时间两者也可能同时发生;在干旱季节有利于这两种灾害的发生发展和加重危害.在危害特点、类型与指标、气候特征、防御技术与应对策略等方面有所不同,高温热浪是一种综合性的气象灾害;而干热风是一种农业气象灾害. |
| [24] | 高温热浪是我国大部分地方的灾 害性天气,特别是近几年,高温强度有所增强,对人类生活和生产均有不同程度的影响。该文选取高温日数、高温热浪频次、极端高温等指标,对河北地区 1956-2009年高温热浪的时空特征进行了分析。结果表明:河北地区高温热浪由北向南逐渐增强,形成以南宫为中心的高温热浪中南部中心;近20年高温 热浪发展较快,重度热浪尤为活跃,且河北地区高温热浪多发生在6月、7月,8月较少。在此基础上讨论了高温热浪对城市供电供水、工业生产和交通的影响,并 提出了该区工业、电力及社会综合应对高温热浪的对策。 . 高温热浪是我国大部分地方的灾 害性天气,特别是近几年,高温强度有所增强,对人类生活和生产均有不同程度的影响。该文选取高温日数、高温热浪频次、极端高温等指标,对河北地区 1956-2009年高温热浪的时空特征进行了分析。结果表明:河北地区高温热浪由北向南逐渐增强,形成以南宫为中心的高温热浪中南部中心;近20年高温 热浪发展较快,重度热浪尤为活跃,且河北地区高温热浪多发生在6月、7月,8月较少。在此基础上讨论了高温热浪对城市供电供水、工业生产和交通的影响,并 提出了该区工业、电力及社会综合应对高温热浪的对策。 |
| [25] | This paper summarizes the hazards of high temperature extremes in the built environment and considers the challenges of managing risk with uncertainty of prediction of the magnitude and frequency of events. The application of extreme value statistics on a typical time series of temperature data has provided some insight into the observed and predicted variability. Using a long temperature time series as an example it is shown that return periods and the increased risk associated with climate change can be interpolated from the analysis. Considering the chaotic nature of cities, their rapid growth and a warming climate, it is suggested that cities could be made more resilient to heat waves if governments were be better able to appropriately allocate resources to manage the hazard. |
| [26] | Few studies have explored the added effect of heat waves, especially in China. Moreover, no prior studies have assessed whether the choice of heat wave definitions affected this added effect. This study compared the associations between heat waves defined by different heat wave definitions (HWs) and cause-specific mortality in warm season in Nanjing, China.A distributed lag model was applied to evaluate the differences in daily mortality during heat-wave days (defined using 15 HWs) compared with non-heat-wave days in Nanjing, during 2007 to 2013. For different HWs, model fits were examined by the Akaike Information Criterion for quasi-Poisson and effects were compared by stratified analysis and bootstrapping. In addition, we explored the effect modifications by individual characteristics under different HWs.Different HWs resulted in considerable differences in associations between heat waves and mortality. Heat waves defined as 鈮4 consecutive days with daily average temperature >98th percentile had the best model fit and were associated with an increase of 24.6% (95% CI: 15.6%, 34.3%) total mortality, 46.9% (95% CI: 33.0%, 62.3%) cardiovascular mortality, 32.0% (95% CI: 8.5%, 60.5%) respiratory mortality, 51.3% (95% CI: 23.4%, 85.6%) stroke mortality, 63.4% (95% CI: 41.5%, 88.8%) ischemic heart disease mortality, and 47.6% (95% CI: 14.5%, 90.3%) chronic obstructive pulmonary disease mortality at lag day 2. Under different HWs, added effects of heat waves on mortality were higher for females versus males, the elderly versus young residents, and people with low education versus those with high education. Results were less sensitive to the inclusion of air pollutants.Heat wave definition plays a critical role in the relationship between heat waves and mortality. Selecting an appropriate definition of heat waves is therefore important to design local heat warning systems and to reduce the burden of disease during heat waves. |
| [27] | Heat waves have significant impacts on both ecosystems and human beings. This is compounded by future climate scenarios which indicate more frequent and severe heat waves in certain locations. There are members of communities that are more vulnerable to the effects of heat waves such as the elderly and infants and this presents particular challenges for the future. Hence it is timely to undertake a critical and systematic review of the effects of heat waves and mechanisms to mitigate their effects. There are significant implications associated with heat waves such as extra power consumption, community health, water consumption and quality, and additional costs within the natural and built environments. One of the critical issues is peak electricity demand which is closely linked with factors such as building occupant health and costs to consumers. Utilization of renewable and sustainable energy helps to mitigate this specific issue. Common policy instruments to deal with risks associated with heat waves include heat impact assessment and heat warning system. Similarly, building design should take impacts of heat waves into consideration such as dwelling adaptation. This review provides useful inputs to both policy making and industry practice on improving the resilience of urban and regional areas in the event of extreme weather conditions such as heat waves in the future. |
| [28] | 为了分析海南省不同人群对高温热浪及其影响与适应的感知程度,抽 取海南省18周岁以上居民1 448名作为调查对象进行问卷调查.结果显示,调查对象对高温天气相关知识熟悉程度较低,仅有4.2%的居民非常熟悉,但对高温产生原因和未来变化趋势都 有较为正确的认识.高温天气对海南省居民健康有较大的不利影响,九成以上的调查对象都曾在高温天气中出现不适,部分人群因此前往医院就诊.高温预警后,约 77%的调查对象都能采取有效措施进行防御,但60岁以上的人群采取有效防护措施的比重相对较低,因此在高温天气中该类人群应加强高温防护. . 为了分析海南省不同人群对高温热浪及其影响与适应的感知程度,抽 取海南省18周岁以上居民1 448名作为调查对象进行问卷调查.结果显示,调查对象对高温天气相关知识熟悉程度较低,仅有4.2%的居民非常熟悉,但对高温产生原因和未来变化趋势都 有较为正确的认识.高温天气对海南省居民健康有较大的不利影响,九成以上的调查对象都曾在高温天气中出现不适,部分人群因此前往医院就诊.高温预警后,约 77%的调查对象都能采取有效措施进行防御,但60岁以上的人群采取有效防护措施的比重相对较低,因此在高温天气中该类人群应加强高温防护. |
| [29] | 本研究通过综合考虑高温胁迫、社会脆弱性和人口暴露,提出基于社会脆弱性的高温灾害风险评价框架,结合气象数据、遥感数据、社会经济数据构建多元数据融合的评价指标体系,开展全国分县高温灾害风险评价.研究结果表明,高温灾害脆弱性热点区域主要集中在中国新疆西部、豫西皖北交界处、四川盆地、洞庭湖流域、广西境内珠江流域;而华中地区湖北江汉平原和湖南洞庭湖流域、西南地区四川省和重庆市交界处的四川盆地、华东地区江浙沪一带、华南珠江流域,则是中国突出的高温灾害风险热点区.高温灾害脆弱性热点区和高温灾害风险热点区的分布出现比较明显的差异,高温灾害脆弱性热点区主要分布于高温胁迫较高或社会经济较差的不发达地区,区域人群由于经济上的适应能力较差而受到高温威胁的概率较大;而高温灾害风险则强调灾害一旦发生时的可能损失,其热点区域主要分布于人口聚集、经济较为发达的大城市区域.就主导因子分区来说,高温胁迫主导区域主要为平原、盆地以及大江大河流域,社会脆弱性主导区域主要位于经济欠发达地区以及脆弱性人群聚集区;人口暴露主导区域则主要集中在人口密集的中心城市和沿海地区. . 本研究通过综合考虑高温胁迫、社会脆弱性和人口暴露,提出基于社会脆弱性的高温灾害风险评价框架,结合气象数据、遥感数据、社会经济数据构建多元数据融合的评价指标体系,开展全国分县高温灾害风险评价.研究结果表明,高温灾害脆弱性热点区域主要集中在中国新疆西部、豫西皖北交界处、四川盆地、洞庭湖流域、广西境内珠江流域;而华中地区湖北江汉平原和湖南洞庭湖流域、西南地区四川省和重庆市交界处的四川盆地、华东地区江浙沪一带、华南珠江流域,则是中国突出的高温灾害风险热点区.高温灾害脆弱性热点区和高温灾害风险热点区的分布出现比较明显的差异,高温灾害脆弱性热点区主要分布于高温胁迫较高或社会经济较差的不发达地区,区域人群由于经济上的适应能力较差而受到高温威胁的概率较大;而高温灾害风险则强调灾害一旦发生时的可能损失,其热点区域主要分布于人口聚集、经济较为发达的大城市区域.就主导因子分区来说,高温胁迫主导区域主要为平原、盆地以及大江大河流域,社会脆弱性主导区域主要位于经济欠发达地区以及脆弱性人群聚集区;人口暴露主导区域则主要集中在人口密集的中心城市和沿海地区. |
| [30] | <p>China is physically and socio-economically susceptible to global warming-derived high temperature extremes because of its vast area and high urban population density. This article presents a scenario-based analysis method for high temperature extremes aimed at illustrating the latter’s hazardous potential and exposure across China. Based on probability analysis, high temperature extreme scenarios with return periods of 5, 10, 20, and 50 years were designed, with a high temperature hazard index calculated by integrating two differentially-weighted extreme temperature indices (maximum temperature and high temperature days). To perform the exposure analysis, a land use map was employed to determine the spatial distribution of susceptible human activities under the different scenarios. The results indicate that there are two heat-prone regions and a sub-hotspot occupying a relatively small land area. However, the societal and economic consequences of such an environmental impact upon the North China Plain and middle/lower Yangtze River Basin would be substantial due to the concentration of human activities in these areas.</p> |
| [31] | 应用PRECIS模式模拟的气候情景数据,选取高温日数和热浪日数两个指标,对IPCC SRESB2情景下未来我国高温致灾危险性时空格局进行了预估。结果表明:在近期(2011-2040)、中期(2041-2070)和远期(2071-2100),全国年均高温日数从基准时段(1961-1990)的10.2d将分别增加到17.3d,22.6d和28.4d,年均热浪日数从基准时段的11.5d分别增加到22.6d,30.6d和39.0d;除了青藏高原,全国大部分地区的高温致灾危险性等级均有不同程度的提高,其中高温致灾危险性等级高于4级(包括4级)的地区在基准时段仅占全国总面积的3.8%,在近期、中期和远期将分别扩展到全国总面积的29.9%,51.3%和63.0%。 . 应用PRECIS模式模拟的气候情景数据,选取高温日数和热浪日数两个指标,对IPCC SRESB2情景下未来我国高温致灾危险性时空格局进行了预估。结果表明:在近期(2011-2040)、中期(2041-2070)和远期(2071-2100),全国年均高温日数从基准时段(1961-1990)的10.2d将分别增加到17.3d,22.6d和28.4d,年均热浪日数从基准时段的11.5d分别增加到22.6d,30.6d和39.0d;除了青藏高原,全国大部分地区的高温致灾危险性等级均有不同程度的提高,其中高温致灾危险性等级高于4级(包括4级)的地区在基准时段仅占全国总面积的3.8%,在近期、中期和远期将分别扩展到全国总面积的29.9%,51.3%和63.0%。 |
| [32] | 本文利用CMIP5中22个全球气候模式模拟结果和相关社会经济数据,对RCP8.5情景下中国未来近期(2016—2035年)、中期(2046—2065年)、远期(2080—2099年)3个时段高温灾害风险的变化趋势进行了定量预估。结果表明:中国未来不同时期高温致灾危险度可能逐步增加;未来不同时期高温风险也趋干升高。Ⅲ级及以上的高温灾害风险等级范围将增大,特别是东北三省、内蒙古、陕西、宁夏、贵州、福建等省(区)处于高风险等级的面积明显增大,山东、河北、河南、安徽在近期将出现Ⅴ级高温灾害风险,中期和远期V级高温灾害风险将扩展到江苏、湖南、湖北、江西、四川、广西和广东等省(区)。 . 本文利用CMIP5中22个全球气候模式模拟结果和相关社会经济数据,对RCP8.5情景下中国未来近期(2016—2035年)、中期(2046—2065年)、远期(2080—2099年)3个时段高温灾害风险的变化趋势进行了定量预估。结果表明:中国未来不同时期高温致灾危险度可能逐步增加;未来不同时期高温风险也趋干升高。Ⅲ级及以上的高温灾害风险等级范围将增大,特别是东北三省、内蒙古、陕西、宁夏、贵州、福建等省(区)处于高风险等级的面积明显增大,山东、河北、河南、安徽在近期将出现Ⅴ级高温灾害风险,中期和远期V级高温灾害风险将扩展到江苏、湖南、湖北、江西、四川、广西和广东等省(区)。 |
| [33] | ABSTRACT This paper summarizes the main characteristics of the RCP8.5 scenario. The RCP8.5 combines assumptions about high population and relatively slow income growth with modest rates of technological change and energy intensity improvements, leading in the long term to high energy demand and GHG emissions in absence of climate change policies. Compared to the total set of Representative Concentration Pathways (RCPs), RCP8.5 thus corresponds to the pathway with the highest greenhouse gas emissions. Using the IIASA Integrated Assessment Framework and the MESSAGE model for the development of the RCP8.5, we focus in this paper on two important extensions compared to earlier scenarios: 1) the development of spatially explicit air pollution projections, and 2) enhancements in the land-use and land-cover change projections. In addition, we explore scenario variants that use RCP8.5 as a baseline, and assume different degrees of greenhouse gas mitigation policies to reduce radiative forcing. Based on our modeling framework, we find it technically possible to limit forcing from RCP8.5 to lower levels comparable to the other RCPs (2.6 to 6W/m2). Our scenario analysis further indicates that climate policy-induced changes of global energy supply and demand may lead to significant co-benefits for other policy priorities, such as local air pollution. |
| [34] | This paper presents an overview of the greenhouse gas (GHG) emissions scenarios that form the analytical backbone for other contributions to this Special Issue. We first describe the motivation behind this scenario exercise and introduce the main scenario features and characteristics, in both qualitative and quantitative terms. Altogether, we analyze three 鈥榖aseline鈥 scenarios of different socio-economic and technological developments that are assumed not to include any explicit climate policies. We then impose a range of climate stabilization targets on these baseline scenarios and analyze in detail the feasibility, costs and uncertainties of meeting a range of different climate stabilization targets in accordance with Article 2 of the United Nations Framework Convention on Climate Change. The scenarios were developed by the IIASA Integrated Assessment Modeling Framework that encompasses detailed representations of the principal GHG-emitting sectors鈥攅nergy, industry, agriculture, and forestry. The main analytical findings from our analysis focus on the implications of salient uncertainties (associated with scenario baselines and stabilization targets), on feasibility and costs of climate stabilization efforts, and on the choice of appropriate portfolios of emissions abatement measures. We further analyze individual technological options with regards to their aggregated cumulative contribution toward emissions mitigation during the 21st century as well as their deployment over time. Our results illustrate that the energy sector will remain by far the largest source of GHG emissions and hence remain the prime target of emissions reduction. Ultimately, this may lead to a complete restructuring of the global energy system. Climate mitigation could also significantly change the relative economics of traditional versus new, more climate friendly products and services. This is especially the case within the energy system, which accounts for the largest share of emissions reductions, but it is also the case in the agriculture and forestry sectors, where emissions reduction and sink enhancement measures are relatively more modest. |
| [35] | . |
| [36] | Extreme heat events are likely to become more frequent in the coming decades owing to climate change. Exposure to extreme heat depends not only on changing climate, but also on changes in the size and spatial distribution of the human population. Here we provide a new projection of population exposure to extreme heat for the continental United States that takes into account both of these factors. Using projections from a suite of regional climate models driven by global climate models and forced with the SRES A2 scenario and a spatially explicit population projection consistent with the socioeconomic assumptions of that scenario, we project changes in exposure into the latter half of the twenty-first century. We find that US population exposure to extreme heat increases four- to sixfold over observed levels in the late twentieth century, and that changes in population are as important as changes in climate in driving this outcome. Aggregate population growth, as well as redistribution of the population across larger US regions, strongly affects outcomes whereas smaller-scale spatial patterns of population change have smaller effects. The relative importance of population and climate as drivers of exposure varies across regions of the country. |
| [37] |
