 ,1,2, 王平3
Climate changes over the Arctic land during 1979-2017
CHEN Xiaolong,1,2, WANG Ping3收稿日期:2020-09-1修回日期:2020-11-17
| 基金资助: |
Received:2020-09-1Revised:2020-11-17
作者简介 About authors
陈晓龙,男,陕西蒲城人,副研究员,主要从事气候模拟和预估研究。E-mail:

摘要
关键词:
Abstract
Keywords:
PDF (29475KB)元数据多维度评价相关文章导出EndNote|Ris|Bibtex收藏本文
本文引用格式
陈晓龙, 王平. 1979—2017年北极陆地气候变化趋势. 资源科学[J], 2021, 43(6): 1260-1274 doi:10.18402/resci.2021.06.16
CHEN Xiaolong, WANG Ping.
1 引言
北极冰雪圈是气候系统的重要组成部分,在维持地球能量收支平衡中起重要作用。随着全球变暖的加剧,过去几十年内北极的气候环境发生了剧烈的变化,且呈愈演愈烈之势。极地气温的快速升高和海冰、冰川的快速融化是最突出的现象,例如2016年北极海冰面积处于历史最低值的时间长达4个月。温度上升和冰雪融化之间的正反馈关系使新裸露地表的温度比有冰雪覆盖时增加了4~5 ℃[1],从而升温速率在北极地区被放大至全球平均的2~3倍[2],产生升温“极地放大”现象[3,4]。近年来,北极点附近的气温在极夜期间出现比气候均值高出20~30 ℃以上、接近甚至超过0 ℃的极端事件越来越频繁[5]。从不利的方面看,这些变化不仅改变了北极局地的气象要素和地貌特征,而且能够通过扰动大气波活动调整北半球中纬度地区的环流系统,诱发极端天气和气候事件,严重影响人口稠密的北美和欧亚大陆地区的社会经济生活[6,7]。格陵兰冰盖的消融带来的海平面上升也越来越成为需要人类社会认真面对的问题。从有利的方面看,北极地区温度上升扩大了适于人类活动的范围,海冰面积的减少使得北极航道适航时间和距离延长,有利于发展贸易,开发该地区丰富的矿产、渔业和旅游资源[8,9,10,11]。降水和气温作为反映水热资源的基本气象要素,是刻画北极气候变化的指标性变量。1980—2019年北极陆地(60°N以北)平均地表气温的升温速率约为0.56 ℃/10 a,是全球变暖最为显著的地区之一[9];极端暖事件的频率和强度显著增加,冷事件则减少[12]。2000年以来,北极地区的永久冻土层升温速率为0.4~0.9 ℃/10 a[13]。北极陆地的升温趋势是非常明确的信号,但对于降水而言,因观测稀疏,其变化趋势有很大的不确定性[14],并且随区域而异[15]。西伯利亚环北极流域正在变暖变湿,不同流域的差异可能与下垫面状况有关[16],同时地表径流在冬季呈现比较明显的增加趋势[17];极端降水增加,而干旱事件可能减少[18,19]。大气分析资料显示近几十年北极降水总体呈增加趋势[20,21],但不同资料之间的不确定性很大[22]。本文注意到降水分析资料中所使用的北极地区台站数量自1990年苏联解体以来逐渐减少,特别在2008年金融危机后急剧下降,这给观测资料所反映的气候变化信息的可靠性带来很大的挑战。由于变化趋势的计算受起止两端数据的影响很大,近几十年可用观测数据的减少可能是上述不确定性的一个重要来源。因此需要进行多套资料以及与再分析资料的对比分析,考察因台站数量减少给北极地区气温和降水变化研究带来的影响。
当前对北极气候变化关注最多的是北极海冰的快速减少及其升温的北极放大现象[23,24],但对北极温度、降水趋势的季节差异特征探讨较少。关于极区温度和降水变化的关系以及平均态和极端事件变化异同的研究也较少。2018年《中国的北极政策》白皮书中已明确了未来共同开发北极、参与北极治理的基本方向。因此,充分认识当前北极的气候变化趋势,对于参与国际合作、拓展国际贸易、争取北极问题话语权也具有重要意义[25,26]。本文通过比较多套观测和再分析资料,对北极陆地气温和降水的长期趋势进行分析,阐述其变化的季节特征,综合探讨降水和气温变化的关系,并比较极区气候态变化与极端气候事件变化的异同,以期为未来在极区日益增多的人类活动提供科学支撑。
2 数据和方法
2.1 数据来源
研究使用多套基于观测的温度和降水分析格点数据和一套大气再分析数据。温度资料包括:①英国东安格利亚大学气候研究中心的CRU TS数据集v4.04的月平均气温,空间分辨率0.5°×0.5°[27];②美国国家大气海洋局(NOAA)提供的基于全球历史气候网络和气候异常监测系统(GHCN-CAMS)的月平均地表气温数据,空间分辨率0.5°×0.5°[28];③特拉华大学(University of Delaware)的月平均气温分析数据UDel v5.01,空间分辨率0.5°×0.5°[29];④伯克利地球组织(Berkeley Earth)的格点月平均气温分析数据,空间分辨率1°×1°(http://berkeleyearth.org/archive/data/)。降水资料包括:①CRU TS v4.04的月平均降水,空间分辨率0.5°×0.5°[27];②基于全球降水气候中心(GPCC)的月平均分析数据GPCC v2018,空间分辨率0.5°×0.5°[30];③UDel v5.01的月平均降水分析数据,空间分辨率0.5°×0.5°[29];④基于器测的陆地降水重建月平均分析数据(PREC/L),空间分辨率1°×1°[31]。再分析数据为欧洲中期天气预报中心(ECMWF)提供的ERA-Interim,包含月平均和日平均的气温和降水资料,空间分辨率0.75°×0.75°[32]。除GPCC v2018数据截至2016年外,其余数据均可覆盖1979—2017年。利用双线性插值将所有数据统一到ERA-Interim的网格分辨率上。2.2 分析方法
由于北极大多数地区缺乏长期可靠的日平均温度和降水观测数据,这里首先利用多套基于观测的月平均温度和降水分析资料对比评估ERA-Interim再分析数据,然后基于ERA-Interim的日平均数据考察极端气温和降水的长期趋势。气温日较差定义为同一天日最高气温与日最低气温之差。气温年较差定义为一年内月平均最高和最低气温之差。极端气温指标采用季节内日最高温度最大值(Warmest Daily Temperature Max, TXx)、日最高温度最小值(Coldest Daily Temperature Min, TXn)、日最低温度最大值(Warmest Daily Temperature Max, TNx)和日最低温度最小值(Coldest Daily Temperature Min, TNn)。极端气温年较差定义为一年内TXx与TNn之差。极端降水指标采用季节内最大连续5天降水量(Wettest Consecutive Five Days, RX5d)。气温和降水变化的参照值为1981—2010年气候态。冬季指12月—次年2月,春季指3—5月,夏季指6—8月,秋季指9—11月。
研究采用线性趋势分析和相关分析。将气象变量与时间(年份)进行最小二乘回归,回归系数即为线性趋势;相关系数采用Pearson相关。线性趋势和相关系数的显著性检验为t分布检验。
3 结果与分析
3.1 不同观测资料中北极气候变化趋势的异同
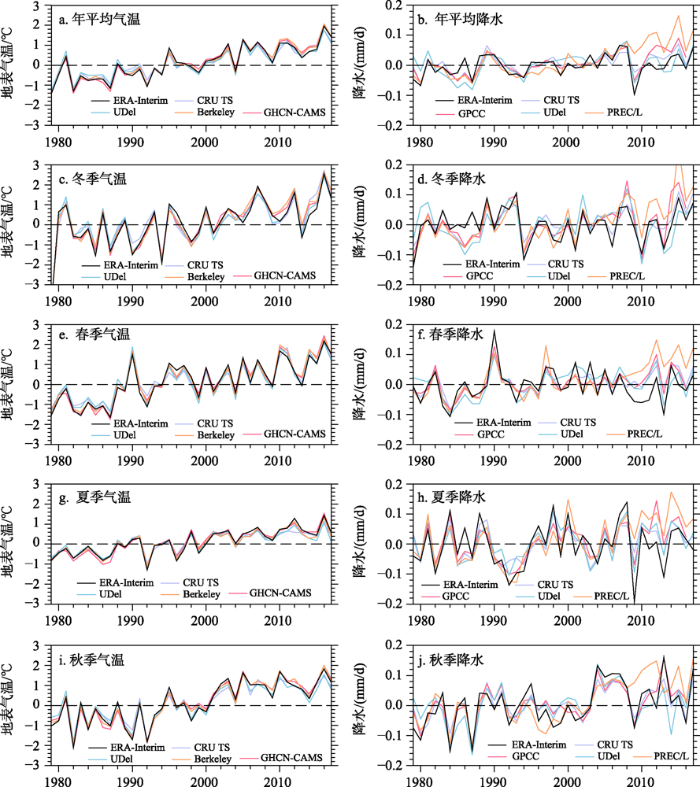
为了说明ERA-Interim再分析数据在北极陆地的适用性,图1和表1比较了其与多套观测分析资料中1979—2017年北极陆地(60°N以北)区域平均地表气温和降水相对于1981—2010年气候态的异常时间序列。对于气温而言,无论是年平均(图1a)还是各季节平均(图1c、1e、1g和1i),不同观测分析数据均表现出一致的升温趋势,彼此间差异很小;春、秋、冬季趋势强,而夏季趋势较弱(表1);ERA-Interim中气温的时间演变几乎与各观测分析重合(图1左列),相关系数接近1(表1);ERA-Interim年平均温度变化速率约0.57 ℃/10 a,而多套观测平均结果为0.55 ℃/10 a,两者非常一致,因此ERA-Interim的温度变化具有很高的可信度。图1
 新窗口打开|下载原图ZIP|生成PPT
图11979—2017年北极陆地(60°N以北)区域平均地表气温和降水相对于1981—2010年气候态的异常时间序列
Figure 1Time series of near-surface air temperature and precipitation anomalies relative to the 1981-2010 climatology averaged over the Arctic land (60°N north) (a, b. Annual mean; c, d. Winter; e, f. Spring; g, h. Summer; i, j. Autumn)
Table 1
表1
表14套观测分析资料和ERA-Interim再分析资料中1979—2017年北极陆地(60°N以北)地表气温的线性趋势
Table 1
| 年平均 | 冬季 | 春季 | 夏季 | 秋季 | |
|---|---|---|---|---|---|
| CRU TS | 0.52±0.06 (0.98) | 0.59±0.13 (0.96) | 0.58±0.09 (0.97) | 0.34±0.04 (0.97) | 0.60±0.08 (0.97) |
| GHCN-CAMS | 0.63±0.06 (0.99) | 0.66±0.13 (0.98) | 0.71±0.10 (0.98) | 0.44±0.05 (0.98) | 0.73±0.09 (0.97) |
| UDel | 0.47±0.07 (0.99) | 0.52±0.14 (0.98) | 0.56±0.10 (0.97) | 0.30±0.05 (0.98) | 0.52±0.09 (0.99) |
| Berkeley | 0.60±0.07 (0.99) | 0.70±0.13 (0.97) | 0.69±0.10 (0.99) | 0.37±0.05 (0.99) | 0.69±0.09 (0.99) |
| 观测平均 | 0.55±0.06 | 0.62±0.13 | 0.64±0.10 | 0.36±0.05 | 0.63±0.09 |
| ERA-Interim | 0.57±0.07 | 0.58±0.14 | 0.67±0.10 | 0.42±0.06 | 0.66±0.10 |
新窗口打开|下载CSV
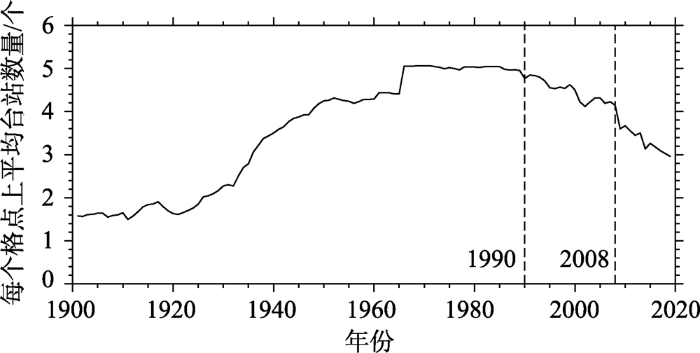
相对于温度,不同资料间降水变化的差异更大,特别是2008年以后差异更加明显(图1右列),这可能是近10多年来由于各种经济和政治原因[33],特别是全球金融危机造成可用台站数量锐减所导致(图2)。尽管如此,各观测分析资料均显示北极陆地年平均降水呈增加趋势,其中秋季增加趋势最明显(表2)。4套观测资料中PRCE/L的趋势最强,UDel的趋势最弱,仅为前者的约1/5~1/2。ERA-Interim的年平均和季节平均降水与各观测分析数据的相关系数均超过了1%的统计显著性(表2),与CRU TS和GPCC的相关系数最高,均在0.70以上,表现出较好的观测再现能力。从年平均降水的趋势看,ERA-Interim与CRU TS和UDel最接近;除秋季外,其他季节ERA-Interim降水的正趋势不显著,而各观测分析资料降水趋势明显大于ERA-Interim。由于这里给出的是整个北极陆地的区域平均,整体趋势不显著可能是不同区域正负趋势相抵的结果,因此下一小节将进一步分析趋势的空间特征。鉴于ERA-Interim降水的年际变化和长期趋势在2008年前(可用观测台站较为充足的时期)与各观测分析均非常吻合,因此,2008年后台站数目减少可能使观测分析资料高估了北极陆地降水的增加趋势。由于ERA-Interim由同一套系统输出,具有很好的时间一致性和变量间的自洽性,因此下文主要基于这一数据作进一步分析。
图2
 新窗口打开|下载原图ZIP|生成PPT
图2CRU TS数据集1900—2020年北极陆地地区(60°N以北)平均每个格点上的台站数量的变化
Figure 2The number of stations for each grid in the CRU TS dataset in the Arctic land (60°N north), 1900-2020
Table 2
表2
表24套观测分析资料和ERA-Interim再分析资料中1979—2017年北极陆地(60°N以北)降水的线性趋势
Table 2
| 年平均 | 冬季 | 春季 | 夏季 | 秋季 | |
|---|---|---|---|---|---|
| CRU TS | 0.15±0.04 (0.75) | 0.13±0.07 (0.81) | 0.14±0.05 (0.74) | 0.13±0.08 (0.73) | 0.22±0.07 (0.88) |
| GPCC | 0.20±0.04 (0.71) | 0.19±0.09 (0.78) | 0.14±0.06 (0.75) | 0.19±0.08 (0.76) | 0.26±0.08 (0.89) |
| UDel | 0.13±0.05 (0.66) | 0.07±0.09 (0.67) | 0.11±0.06 (0.67) | 0.14±0.08 (0.76) | 0.19±0.09 (0.77) |
| PREC/L | 0.37±0.05 (0.52) | 0.38±0.08 (0.71) | 0.33±0.07 (0.47) | 0.35±0.09 (0.61) | 0.42±0.08 (0.69) |
| 观测平均 | 0.21±0.04 | 0.20±0.07 | 0.19±0.05 | 0.20±0.08 | 0.28±0.07 |
| ERA-Interim | 0.10±0.05 | 0.05±0.08 | 0.02±0.08 | 0.06±0.11 | 0.30±0.09 |
新窗口打开|下载CSV
3.2 不同季节气温和降水的变化趋势的空间特征
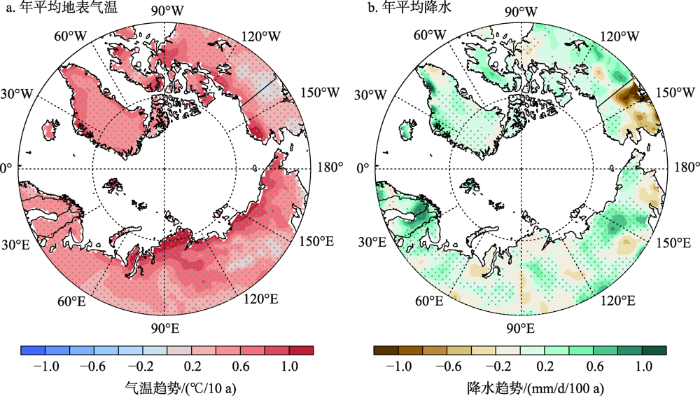
基于ERA-Interim再分析资料,1979年以来,北极大部分陆地年平均地表气温呈显著增加趋势,其中北冰洋沿岸地区升温速率最大,包括俄罗斯北部、加拿大北部、格陵兰岛东部和西部,局地可超过1.0 ℃/10 a(图3a)。欧洲(0°E—60°E)、西伯利亚(60°E—180°E)、阿拉斯加和加拿大北部(170°W—60°W)、格陵兰岛(60°W—20°W)平均升温速率分别约为0.55、0.62、0.52和0.57 ℃/10 a。图3
 新窗口打开|下载原图ZIP|生成PPT
图31980—2017年北极陆地(60°N以北)年平均(a)地表气温和(b)降水的线性趋势
注:阴影表示4套观测分析资料中至少有3套与ERA-Interim的趋势同号。
Figure 3Linear trends of annual mean (a) surface air temperature and (b) precipitation over the Arctic land (60°N north) during 1979-2017 based on ERA-Interim (Dotted shadings denote that at least 3 out of the 4 observational analysis datasets agree with the sign of trend in ERA-Interim)
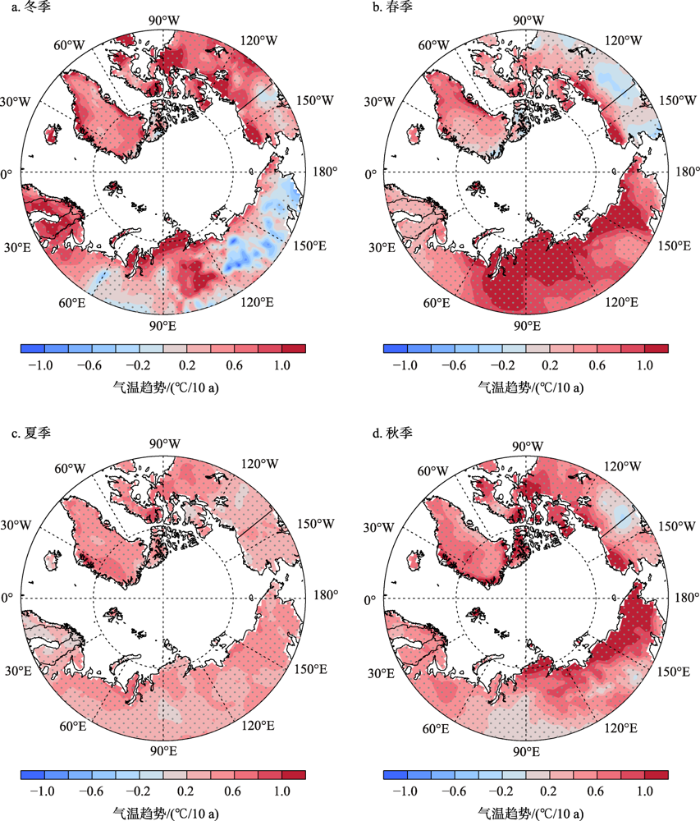
从季节变化上看,北欧(0°E—40°E)冬季升温速率最快(图4a),平均可达1.0 ℃/10 a;其次为春、秋两季(图4b、4d);夏季升温最慢(图4c)。西伯利亚春季升温最快,几乎覆盖整个区域(图4b),可达1.1 ℃/10 a;其次为秋季,最大值位于北部和东部(图4d);冬季升温最大值局限在中部,东部甚至出现降温趋势,但并不显著(图4a)。阿拉斯加和加拿大北部升温在冬季和秋季最大,均约为0.70 ℃/10 a,且空间分布相似(图4a、4d)。格陵兰岛4个季节升温速率接近,最大值出现在秋季,约为0.67 ℃/10 a。整个北极地区夏季升温速率最小,原因是更多的热量用于融化海冰以及储存在海水中[34];夏季升温的空间分布也较其他季节更为均匀,这与夏季对流层南北温度梯度较小,西风带槽脊活动较弱有关[6]。
图4
 新窗口打开|下载原图ZIP|生成PPT
图41979—2017年ERA-Interim中北极陆地四季平均地表气温的线性趋势
注:阴影表示4套观测分析资料中至少有3套与ERA-Interim的趋势同号。
Figure 4Linear trends of seasonal surface air temperature over the Arctic land during 1979-2017 based on ERA-Interim (a. Winter; b. Spring; c. Summer; d. Autumn. Dotted shadings denote that at least 3 out of the 4 observational analysis datasets agree with the sign of trend in ERA-Interim)
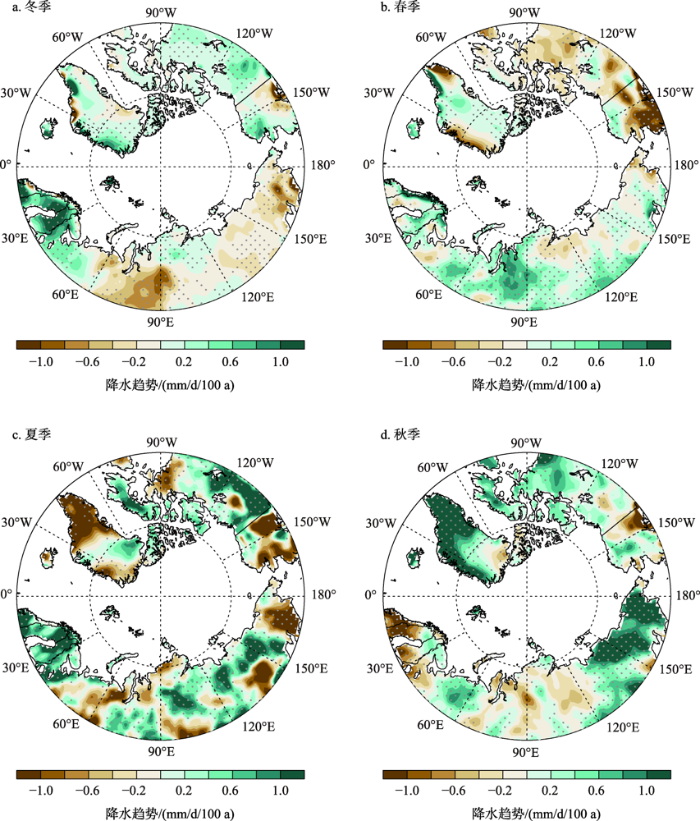
随着温度上升,大气中水汽含量增加,1979—2017年北极陆地年平均降水整体上也呈上升趋势,但空间分布与温度趋势相比更加不均匀,局部地区甚至出现降水减少趋势;降水极大值出现在北欧北部、西伯利亚东部和格陵兰岛东部沿岸;各观测分析资料与ERA-Interim结果有较好一致性(图3b)。
从季节变化上看,北欧地区冬、夏两季降水明显增加(图5a、5c),变化速率分别约为0.67和0.87 mm/d/100 a,在秋季其南部呈显著的减少趋势(图5d)。北欧冬季降水与增暖中心有很好的对应关系,换算为局地温度升高1 K的降水变化,降水的增加速率相当于3.87%/K。西伯利亚降水整体增加的趋势主要发生在春、秋两季(图5b、5d),中心分别位于东部和西部,变化速率分别约为0.42和0.81 mm/d/100 a,将其与升温趋势的空间分布对比(图4b、4d),可以看到降水增加与升温中心也一致,换算为局地温度升高1 K的降水变化,这一趋势分别相当于8.11%和2.88%/K。秋季西伯利亚东部降水增加速率接近克劳修斯-克拉贝龙方程的热力学约束(北极地区约(7.5%~8%)/K[35]),说明大气水汽的增多对这一地区降水增加起主要作用;冬季北欧和春季西伯利亚西部降水增加速率小于理论值,可能是由环流减弱造成的[36]。夏季西伯利亚中部降水也呈显著增加趋势,但同时东部和西部降水出现减少趋势,整体趋势不显著(图5c)。
图5
 新窗口打开|下载原图ZIP|生成PPT
图51979—2017年ERA-Interim中北极陆地四季平均降水的线性趋势
注:阴影表示4套观测分析资料中至少有3套与ERA-Interim的趋势同号。
Figure 5Linear trends of seasonal precipitation (mm/d/100 a) over the Arctic land during 1979-2017 based on ERA-Interim (a. Winter; b. Spring; c. Summer; d. Autumn. Dotted shadings denote that at least 3 out of the 4 observational analysis datasets agree with the sign of trend in ERA-Interim)
加拿大北部降水在夏季有显著增加趋势(图5c),冬、秋季降水也有明显增加(图5a、5d),但春季出现较弱的减少趋势(图5b)。阿拉斯加春、夏两季降水有明显的减少趋势,其中春季的减少趋势在各资料间一致性较好,但夏季趋势的一致性较差(图5b、5c);冬、秋两季则表现为北部增加、南部减少(图5a、5d)。格陵兰岛年平均降水整体呈增加趋势(图3b),但不同季节和区域会出现正负趋势相抵的情况,特别是夏、秋两季,主要表现为格陵兰岛南部夏季降水显著减少,而秋季显著增加(图5c、5d)。其他区域,降水增加通常对应温度升高带来水汽的增多,但考虑到夏、秋两季格陵兰岛升温速率和空间分布相近(图4c、4d),因此降水出现截然相反的趋势很可能是环流变化引起的。夏季降水显著的减少趋势与格陵兰阻塞高压增强和北大西洋涛动的减弱趋势有关[37]。
3.3 气温日较差的变化趋势
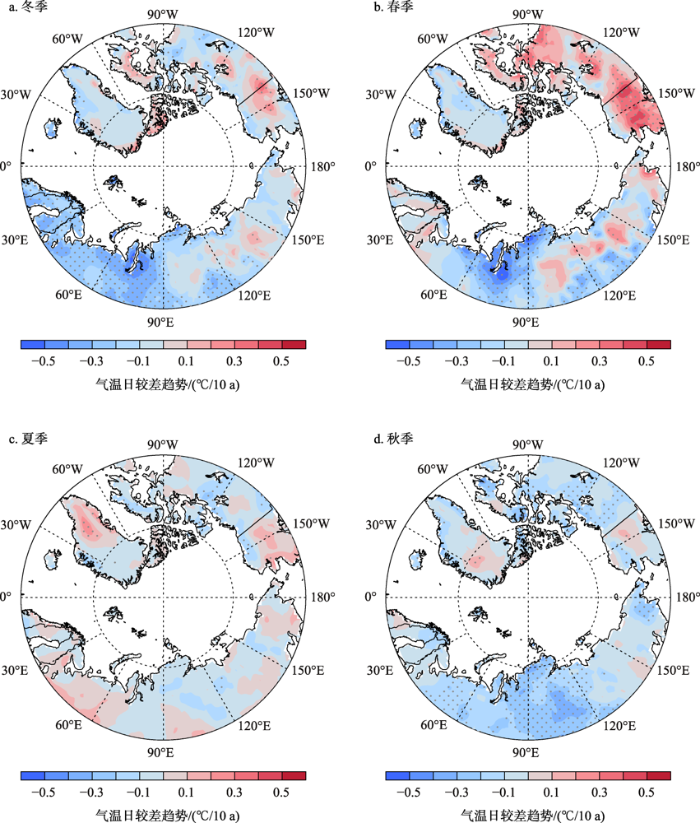
气温日较差是一天中最高温度和最低温度的差值,反映日尺度内温度变化的剧烈程度,是影响作物生长的关键因子之一。图6显示,1979—2017年气温日较差长期趋势存在明显的季节和区域特征。由于变暖背景下,日最高(白天)和最低(夜间)温度均呈增加趋势,若日较差增大,则表明白天最高温度升高趋势大于夜晚最低温度的升高趋势,反之亦然。冬季欧洲地区气温日较差呈显著减小趋势,约-0.26 ℃/10 a(图6a)。西伯利亚西部在冬、春、秋三季的气温日较差均呈显著减小趋势(图6a、6b、6d),其中冬春两季变化速率约-0.30 ℃/10 a,秋季约-0.21 ℃/10 a;冬、春两季西伯利亚中部地区局地可能出现气温日较差增大的现象(图6a、6b)。春季阿拉斯加和加拿大北部地区的气温日较差呈显著增大趋势(图6b),区域平均的变化速率约为0.11 ℃/10 a,局地可超过0.40 ℃/10 a。夏季整个北极陆地的气温日较差没有显著的变化趋势(图6c)。图6
 新窗口打开|下载原图ZIP|生成PPT
图61979—2017年ERA-Interim中北极陆地四季平均气温日较差的线性趋势
注:阴影表示通过t检验5%的显著性水平。
Figure 6Linear trends of diurnal temperature range over the Arctic land during 1979-2017 based on ERA-Interim (a. Winter; b. Spring; c. Summer; d. Autumn. Dotted shadings indicate values exceeding the 5% significance level)
3.4 气温年较差的变化趋势
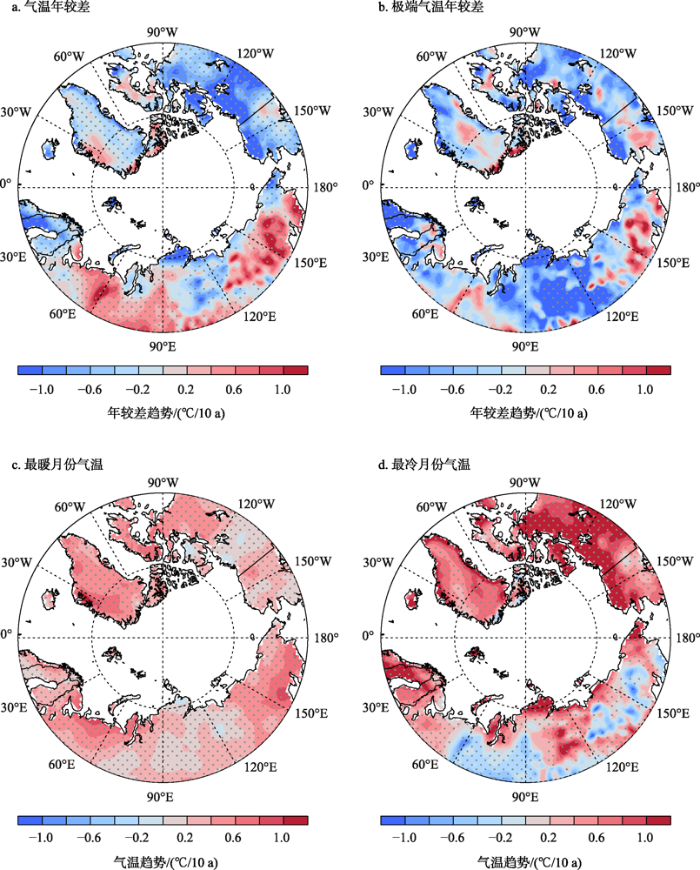
气温年较差对农作物和植被的跨季节生长以及农业活动的安排有重要影响[38]。图7中,ERA-Interim中气温年较差的趋势与4套观测分析资料呈现很好的一致性。气温年较差在北欧、阿拉斯加和加拿大北部呈减小趋势,变化速率分别约为-0.69和-0.78 ℃/10 a;在西伯利亚西部和东部呈增加趋势(图7a),变化速率分别约为0.29和0.21 ℃/10 a。最暖月份的温度变化趋势(图7c)与夏季平均温度的趋势相近(图4c),而最冷月份的温度变化趋势(图7d)明显强于冬季平均温度的趋势(图4a),特别是西伯利亚西部的变冷和阿拉斯加、加拿大北部的变暖。由于最暖月份的升温趋势的空间分布较均匀(图7c),气温年较差的趋势主要由最冷月份的温度趋势决定(图7d)。图7
 新窗口打开|下载原图ZIP|生成PPT
图71979—2017年ERA-Interim中北极陆地(a)气温年较差、(b)极端气温年较差、(c)最暖月份气温和(d)最冷月份气温的线性趋势
注:a、c、d中阴影表示4套观测分析资料中至少有3个与ERA-Interim的趋势同号;b中阴影表示通过t检验5%的显著性水平。
Figure 7Linear trends of (a) annual temperature range, (b) extreme annual temperature range, surface air temperature in (c) warmest and (d) coldest month over the Arctic land during 1979-2017 based on ERA-Interim (In a, c, d, dotted shadings denote that at least 3 out of the 4 observational analysis datasets agree with the sign of trend in ERA-Interim; while in b they mean values exceeding the 5% significance level)
日最高温度最大值(TXx)与日最低温度的最小值(TNn)之差反映了气温年较差的最大范围。这一极端值的趋势特征(图7b)与基于月平均指标的结果(图7a)在北欧、阿拉斯加和加拿大北部较为相似,但在西伯利亚中西部有明显区别,主要是因为TNn在这一区域出现显著的升温(图8)。
图8
 新窗口打开|下载原图ZIP|生成PPT
图81979—2017年ERA-Interim中北极陆地地表气温极端指标的线性趋势
注:阴影表示通过t检验5%的显著性水平,下同。
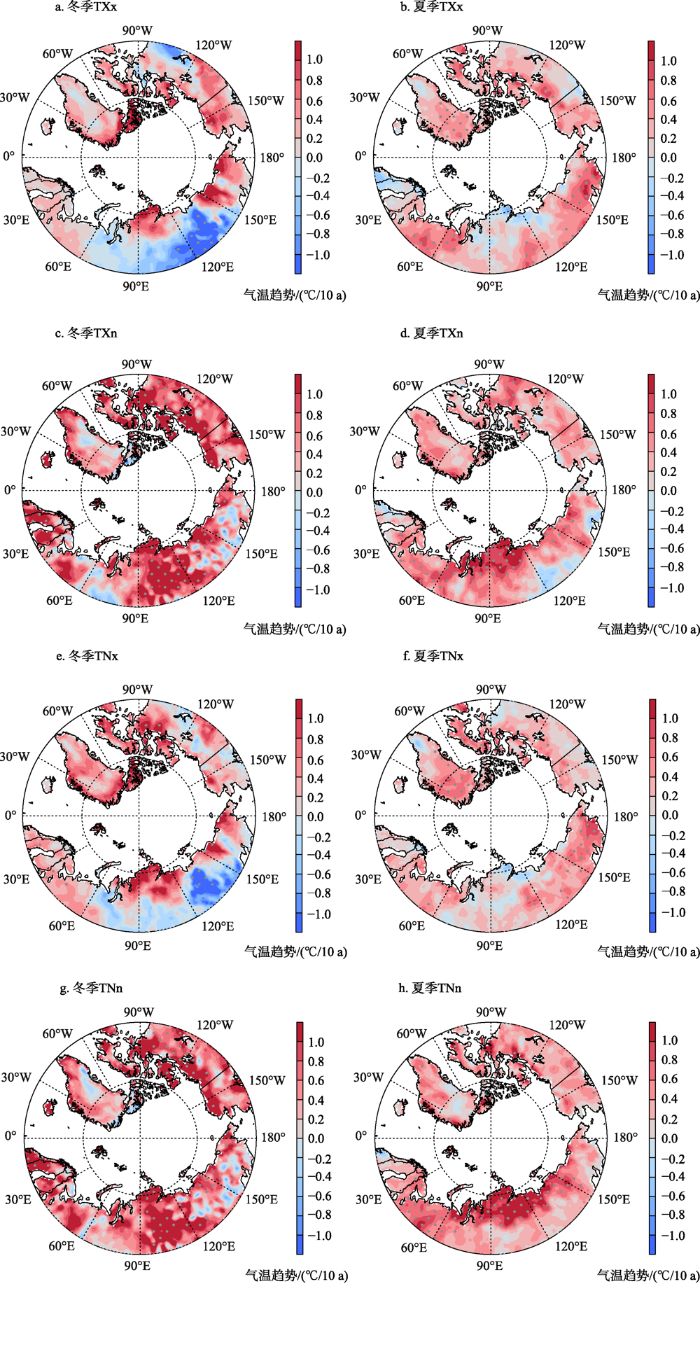
Figure 8Linear trends of extreme temperature indices in (left column) winter and (right column) summer over the Arctic land during 1979-2017 based on ERA-Interim (a, b. Maximum of daily maximum temperature (TXx); c, d. Minimum of daily maximum temperature (TXn); e, f. Maximum of daily minimum temperature (TNx); g, h. Minimum of daily minimum temperature (TNn). Dotted shadings indicate values exceeding the 5% significance level, the same below)
3.5 极端气候指标的变化趋势
图8为1979—2017年北极陆地地区冬、夏两季日最高气温的极端高值(TXx)、最高气温的极端低值(TXn)、日最低气温的极端高值(TNx)和日最低气温的极端低值(TNn)的线性趋势。无论冬季还是夏季,TXn和TNn(图8c、8d、8g、8h)的升温趋势比TXx和TNx(图8a、8b、8e、8f)更大;冬季TXn和TNn(图8c、8g)的升温趋势比夏季更大(图8d、8h)。冬季西伯利亚中部(110°E—140°E)TXx出现减小趋势(图8a),变化速率约-0.64 ℃/10 a,比平均温度的变化趋势更显著(图4a)。这一变冷趋势可能与巴伦支-喀拉海区域的海冰快速减少有关,其通过扰动大气环流使乌拉尔山高压脊和东亚大槽增强,导致西伯利亚地区寒潮爆发更加频繁[39]。而TXn、TNn则相反(90°E—120°E;图8c、8g),平均升温速率约1.17 ℃/10 a。升温速率的区域差异可能是由不同的环流变化导致的,因此环流对极端高值的影响比对极端低值更加明显。
夏季东欧、西伯利亚东部、加拿大北部和格陵兰岛北部的TXx和TNx均呈显著增加趋势(图8b、8f);东欧、西伯利亚北部的TXn和TNn也呈增加趋势(图8d、8h)。东欧夏季TXx和TXn双双增加意味着热浪事件强度会越来越大,频率也会相应增加。
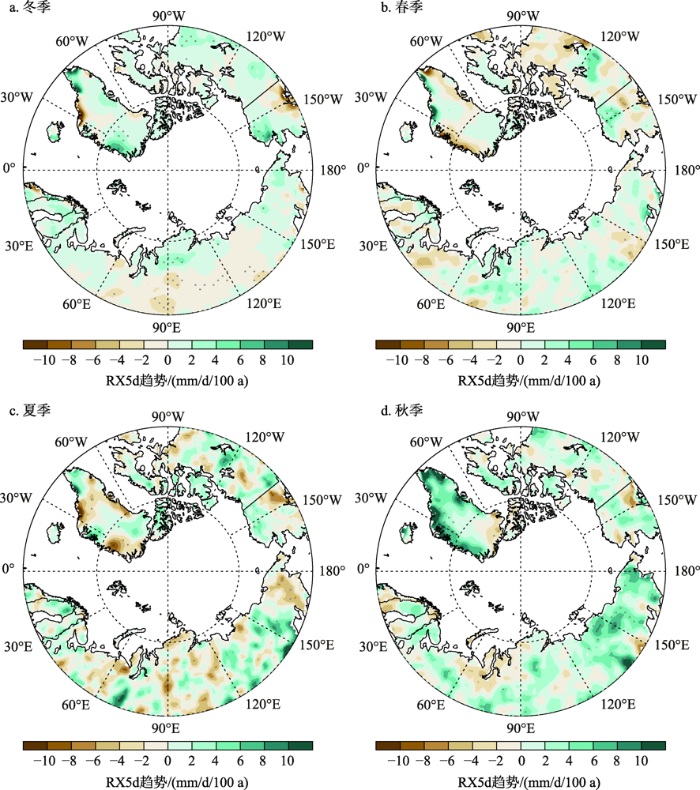
各个季节极端降水变化趋势的空间分布(图9)与季节平均降水(图5)相似,但由于缺乏可靠观测资料的检验,在许多地区无法确定ERA-Interim中极端降水变化的显著性。冬季极端降水在西伯利亚中西部有减少趋势(图9a);秋季极端降水在西伯利亚东部出现显著增加趋势,其变化速率可达3.58 mm/d/100 a,相当于7.91 %/K(图9d),与平均降水的增长率相当,符合克劳修斯-克拉贝龙方程的热力学约束。
图9
 新窗口打开|下载原图ZIP|生成PPT
图91979—2017年ERA-Interim中北极陆地四季最大连续5天降水(RX5d)的线性趋势
Figure 9Linear trends of maximum 5-d precipitation (RX5d) over the Arctic land during 1979-2017 based on ERA-Interim (a. Winter; b. Spring; c. Summer; d. Autumn)
4 结论与讨论
4.1 结论
本文研究利用ERA-Interim再分析数据,与4套基于台站观测的气温和降水月平均分析资料进行对比,分析了1979—2017年北极陆地地区的气候变化趋势,探讨了趋势季节特征以及气温和降水变化之间的关系,进一步利用ERA-Interim的日平均数据分析了极端气候指标变化的季节和区域差异性。主要结论如下:(1)不同观测分析资料中北极陆地近40年升温趋势一致,差异较小,变化速率约0.57 ℃/10 a;降水也呈一致的增加趋势,但主要受2008年以后台站数目锐减的影响,线性趋势的具体数值在不同资料间差异较大。ERA-Interim能够较好地再现各观测分析资料中气温和降水的年际变化和长期趋势。各套资料均显示北极陆地春、秋、冬季升温趋势强,而夏季升温趋势较弱;秋季降水的增加趋势最大。除秋季外,观测分析资料较ERA-Interim中降水的趋势偏大,可能高估了2008年以后降水的增加。
(2)1979—2017年北极大部分陆地年平均地表气温呈显著增加趋势,其中北冰洋沿岸地区升温速率最大,平均约0.7 ℃/10 a,局地超过1.0 ℃/10 a。整个北极地区夏季升温速率最低;北欧冬季升温最快,西伯利亚春季升温最快,阿拉斯加和加拿大北部冬、春升温最快,格陵兰岛秋季升温最快。
(3)与升温趋势相比,降水趋势的空间分布更加不均匀。北欧地区冬、夏两季降水增加趋势显著,西伯利亚降水整体增加的趋势主要发生在春、秋两季,与局地地表气温变化有很好的对应关系,其中秋季西伯利亚东部降水的增加趋势可达到热力学约束的8 %/K。受环流变化影响,格陵兰岛南部秋季和夏季降水趋势出现很强的正负相抵现象。
(4)冬季欧洲气温日较差减小趋势最为显著,西伯利亚西部气温日较差减小主要发生在冬、春、秋三季,变化速率为-0.2 ~ -0.3 ℃/10 a。春季阿拉斯加和加拿大北部地区的气温日较差呈显著的增大趋势。夏季气温日较差没有显著的变化趋势。气温年较差在北欧、阿拉斯加和加拿大北部呈减小趋势,速率约为-0.73 ℃/10 a;在西伯利亚西部和东部呈增加趋势,速率约0.22 ℃/10 a。
(5)无论冬季还是夏季,极端气温最小值(日最高和日最低)的升温趋势比最大值(日最高和日最低)更显著;冬季极端气温最小值的升温趋势比夏季更显著。冬季西伯利亚中部日最高温度最大值出现减小趋势,东欧地区夏季日最高温度最大值和日最高温度最小值均呈增加趋势,大大增加了热浪发生的风险。因缺乏可靠的观测资料,北极陆地极端降水的长期趋势信度较低。秋季西伯利亚东部极端降水有显著的增加趋势,与地表温度变化有较好的对应关系,可达8 %/K。
4.2 讨论
北极陆地升温也存在随纬度增加而增大的现象,这可能与北冰洋海冰的融化有关。北极增暖放大会减小极地和低纬度的温度梯度,可能减弱中纬度的西风急流,出现更多弯曲的槽脊结构[1,40],使沿急流传播的天气系统移动速度减慢,这可能导致中纬度出现更多持续时间更长的高低压系统,引发极端温度和降水事件[41]。北极增暖下海冰面积的减少(蒸发出更多水汽)可能增加从北极输送到欧亚大陆的水汽,从而使大陆秋季的降雪增多[42,43]。不同观测分析资料和ERA-Interim再分析资料中气候变化趋势的一致性表明,ERA-Interim再分析结果在北极陆地区域表现出较好的性能。鉴于台站缺少等原因可能造成观测分析资料较大的不确定性,ERA-Interim再分析变量齐全、时空分辨率高的优点有助于进一步阐释北极地区更加精细尺度上的气候变化及其机理。
参考文献 原文顺序
文献年度倒序
文中引用次数倒序
被引期刊影响因子
[J].
URL [本文引用: 2]
[J].
URL [本文引用: 1]
[J].
[本文引用: 1]
[J].
[本文引用: 1]
[J].
URL [本文引用: 1]
[J].
URL [本文引用: 1]
[J].
DOI:10.1038/s41467-018-05256-8PMID:30127423 [本文引用: 2]

Accelerated warming in the Arctic, as compared to the rest of the globe, might have profound impacts on mid-latitude weather. Most studies analyzing Arctic links to mid-latitude weather focused on winter, yet recent summers have seen strong reductions in sea-ice extent and snow cover, a weakened equator-to-pole thermal gradient and associated weakening of the mid-latitude circulation. We review the scientific evidence behind three leading hypotheses on the influence of Arctic changes on mid-latitude summer weather: Weakened storm tracks, shifted jet streams, and amplified quasi-stationary waves. We show that interactions between Arctic teleconnections and other remote and regional feedback processes could lead to more persistent hot-dry extremes in the mid-latitudes. The exact nature of these non-linear interactions is not well quantified but they provide potential high-impact risks for society.
[J].
[本文引用: 1]
[J].
[本文引用: 1]
[本文引用: 1]
[本文引用: 2]
[J].
[本文引用: 1]
[J].
[本文引用: 1]
[J].
[本文引用: 1]
[J].
[本文引用: 1]
[J].
[本文引用: 1]
[J].
URL [本文引用: 1]
[J].
DOI:10.1016/j.jhydrol.2013.08.052URL [本文引用: 1]
[J].
DOI:10.1175/JCLI-D-14-00697.1URL [本文引用: 1]
[J].
[本文引用: 1]
[J].
[本文引用: 1]
[J].
[本文引用: 1]
[J].
[本文引用: 1]
[J].
DOI:10.3103/S1068373919030014 [本文引用: 1]
The study considers the problem of constructing a scenario forecast of changing climatic characteristics of air temperature extremes which are important for the current economy needs. Based on the numerous ensemble experiments with a high-resolution system of models, the probabilistic estimates of future changes in the applied indices of rare temperature extremes over Russia are obtained. Particular attention is given to the quantitative characteristics of uncertainty of the estimates obtained in the middle and the end of the 21st century. The important seasonal and regional features of changes in the analyzed extreme parameters are identified; they should be taken into account when adapting to climate changes at the regional level.
[J].
DOI:10.3103/S106837391907001X [本文引用: 1]
The study considers the problem of detailing climate projections with respect to changes in the precipitation regime over the territory of Russia by the middle of the 21st century. Numerous ensemble calculations with the high-resolution regional climate model are used to obtain the projections of climatic changes concerning the duration of dry and wet spells as well as in the related extremes of the amount and daily intensity of precipitation. The estimates of the trend in the analyzed precipitation characteristics derived from standard meteorological observations are presented for 1966-2015. Important seasonal and regional features of changes in the analyzed parameters of extremity are revealed. It is reasonable to consider these features when adapting to climate change at the regional level.
[J].
DOI:10.1002/2015JG003120URL [本文引用: 1]
[J].
DOI:10.1002/jgrg.v121.3URL [本文引用: 1]
[J].
DOI:10.1175/JCLI-D-13-00014.1URL [本文引用: 1]
[J].
[本文引用: 1]
[J].
[本文引用: 1]
[J].
DOI:10.1016/j.accre.2020.03.002URL [本文引用: 1]
[J].
[本文引用: 1]
[J].
[本文引用: 1]
[J].
[本文引用: 1]
[J].
[本文引用: 1]
[J].
DOI:10.1038/s41597-020-0453-3PMID:32246091 [本文引用: 2]
CRU TS (Climatic Research Unit gridded Time Series) is a widely used climate dataset on a 0.5° latitude by 0.5° longitude grid over all land domains of the world except Antarctica. It is derived by the interpolation of monthly climate anomalies from extensive networks of weather station observations. Here we describe the construction of a major new version, CRU TS v4. It is updated to span 1901-2018 by the inclusion of additional station observations, and it will be updated annually. The interpolation process has been changed to use angular-distance weighting (ADW), and the production of secondary variables has been revised to better suit this approach. This implementation of ADW provides improved traceability between each gridded value and the input observations, and allows more informative diagnostics that dataset users can utilise to assess how dataset quality might vary geographically.
[J].
URL [本文引用: 1]
[DB/OL]. (
URL [本文引用: 2]
[J].
[本文引用: 1]
[J].
DOI:10.1175/1525-7541(2002)003<0249:GLPAYM>2.0.CO;2URL [本文引用: 1]
[J].
DOI:10.1002/qj.v137.656URL [本文引用: 1]
[J].
DOI:10.1002/rog.v56.1URL [本文引用: 1]
[J].
DOI:10.1038/nature09051URL [本文引用: 1]
[J].
DOI:10.1175/2008JCLI2144.1URL [本文引用: 1]
[J].
DOI:10.1038/nclimate3287URL [本文引用: 1]
[J].
DOI:10.1002/joc.2015.35.issue-9URL [本文引用: 1]
[J].
[本文引用: 1]
[J].
[本文引用: 1]
[J].
URL [本文引用: 1]
[J].
[本文引用: 1]
[J].
[本文引用: 1]
[J].
[本文引用: 1]
[J].
DOI:10.1038/ngeo2234URL [本文引用: 1]
[J].
DOI:10.1002/jgrd.v121.13URL [本文引用: 1]
