 ,1, ���2, ��˼Դ2, ����1, ���﷼3, ��˼��1, �ڵ���,1
Clean energy power generation potential and value in Qinghai Province
MAO Aihan,1, LI Faxiang2, YANG Siyuan2, HUANG Ting1, HAO Ruifang3, LI Sihan1, YU Deyong,1ͨѶ����:
�ո�����:2020-07-17������:2020-12-18�����������:2021-01-25
| ��������: |
Received:2020-07-17Revised:2020-12-18Online:2021-01-25
����� About authors
ë����,Ů,���ɹų����,˶ʿ��,�о�����Ϊ��Դ��̬����Ȼ��Դ������E-mail:

ժҪ
�ؼ��ʣ�
Abstract
Keywords��
PDF (10773KB)Ԫ������ά�����������������EndNote|Ris|Bibtex�ղر���
�������ø�ʽ
ë����, ���, ��˼Դ, ����, ���﷼, ��˼��, �ڵ���. �ຣʡ�����Դ����DZ������ֵ����. ��Դ��ѧ[J], 2021, 43(1): 104-121 doi:10.18402/resci.2021.01.09
MAO Aihan, LI Faxiang, YANG Siyuan, HUANG Ting, HAO Ruifang, LI Sihan, YU Deyong.
1 ����
����2019�꡶BP������Դͳ�������[1],�ܾ��÷�չ���Ƽ��������˿�����Ӱ��,����һ����Դ��������������,ȫ��һ����Դ������2017��ﵽ135.11��t�͵���,����2018��������2.9%,����2/3�����������й���������ӡ��3��,��2010��������������١�����������Դ��Ϣ��Ԥ����,�ڵ�ǰ��Դ��չ�龰��,�����������Դ���Ѳ���,2040����ǰȫ����Դ������ƽ������Ϊ1.3%[2]�������������,��ú��ʯ�͡���Ȼ���ȴ�ͳ��ԴΪ����һ����Դ�����ٶ�ȱ�Ϳݽߵķ��ա����ͳ��Դ���û��ͷ�CO2���������嵽������,����2014��4����ʽ������IPCC������������棨AR5�����������飨WGIII������,��2000��2010���,��Ϊ���������ŷ���������100��t CO2����,����47%������Դ��Ӧ����[3]�����������ŷŵ�����,�Ӿ���ȫ������仯,������ȫ���ů�Ľ��̡�Ϊ�˻�����Դ���źͶ���ȫ�������ů����,������Ѱ���µ���Դ���������ˮ�����ܡ�̫���ܡ����ܡ������ܡ��������ܡ���ϫ�ܵ�������Դ��������DZ��������Ⱦ�١���������ǿ���ص�,�����ܵ�����Ĺ㷺��ע[4]�����ݹ�����Դ�ַ����ġ��л�������Դ������������壩��,�����Դ����Ϊ�������á�ʹ�ù����л�����Ⱦ���CO2�������������ŷŻ��ߵ��ŷŵ���Դ[5]�����,���������ԴDZ��,����������Դ����Դ�����еı����ǽ��ܼ��š�����ȫ��ѹ������Ҫ;��֮һ[6]������****���ͨ��ģ��ģ��Ϳռ�����ȷ����������ԴDZ�������о�������ˮ����Դ,����****���ò�ͬ��ˮ��ģ��,��ARIMA[7]��SWAT[8]��ˮ��ģ����GIS������������[9,10]��ˮ��Դ�̲������ر��������Ȳ������й���,�Ӷ�����ˮ����ԴDZ��������̫������Դ,****�Ǽ�����һЩ�� ��[11,12]��̫���ܷ���DZ����̫����̼����DZ��[13],������Ҫ����ң������[14],���õ�����Ϣϵͳ��GIS����ع���[15]��̫���ܵ���Դ���Ϳռ�ֲ��������������ڷ�����Դ,�о���ͨ�����ݷ������ݵ�ͳ������[16,17,18],�ڴ˻����ϸ�����Դ�����Ρ������;��ÿ�������,����GIS���߽��з���DZ���о�[19]��������������Դ,��Բ�ͬ���ҵ��������̲����[20,21],�о�����Ҫ���Ѿ�������õ���������Դ��ʣ���������DZ���������������,����֮���������̼���������������о�[22]�����ڵ�������Դ,������������λ�ò�ͬ,�������й��Ҷ����е�����,�������о���Ҫ��Բ�ͬ�����ĵ��������͵�����ֲ����[23,24],�Ե�����DZ�������������������о��������ڲ�ͬ�����Դ��DZ���о��������漰,������****���о��ɹ������Ե�һ����������Դ�����о�,������Բ�ͬ���ҵ������Դ��չ��������о�,�о��߶ȴ����Ϊ����,�����������߶ȵ��о�,�������Դ�������Բ�ǿ�������ز���ȫ������⡣
����****���������Դ��DZ��Ҳչ�����ڶ��о�������ˮ�����ܷ���DZ��,�о�����Ҫ��Բ�ͬ����,���ֶ��غ�����[25]�������[26]��,������ˮ��Դ�����̲�����ˮ����Դ����DZ��,ͨ������������ˮ��Դ�����̶ȵıȽ�֤���й�ˮ����ԴDZ����[27]������̫���ܷ���DZ��,�о����ںܶ�ռ�߶��Ͻ������о�,��ȫ����Χ[28]���ƺ�����[29]��ǭ������[30]�����ϵ���[31]��,��Щ�о�����GIS�ȹ���,��Ҫ��̫���������ļ���[32]��ʱ�շֲ�����[33,34]����������DZ��[35,36]�ȷ�������̫����Ӧ��DZ�������ڷ��ܷ���DZ��,�о���Ա���ѡȡ�繦���ܶȡ����ܿ���ʱ���Ȳ���,�ӷ�����Դ�ķḻ�ȡ��ȶ��ȡ��������˶ȵȷ���[37]�Բ�ͬ�����ķ���DZ����������,�����ص���[38]�������ܱߵ���[39]�������������ܷ���DZ��,���о������������ij����Դ������չ���о�,������[40]���˹�ʪ��ֲ��[41]��,�����о��ߴӲ�ͬ�߶ȵ������ʿռ�ֲ����̲����ȷ��濪չ����������Ӧ��DZ���о�,��ȫ��[42]��������[43]��ǭ������[44]�ȡ����ڵ�������Դ,�й�****��Ҫ��Բ�ͬ���͵�����Դ,��dz������ܡ�ˮ���͵�����Դ�����ҵ�����Դ������DZ������[45],��������˵�����Դ�ķֲ�������������״��ǰ��[46,47,48]������****�������ԴDZ��������о���Ҫ�����������Դ���̲����Ϳ����̶�,����Դ����ͨ���Ƚϵ�һ,�������������Դ�Ķ������ۺϷ�����Խ���,�������о��������������ԴDZ����ֵ��
��������������Դ��ֵ���о�ͨ������Դ�������������ؽ����һ����з���,�������Դ��̼�۸�ĵ���[49],�����Դ�����ƶ���̼�ŷŽ���[50],�����Դ�������Ʊ�г��;��������Ĺ�ϵ[51]�������Դ̼���ż�ֵ�ܵ�Խ��Խ��Ĺ�ע,��Ҫԭ�����������Դ�����ܹ���Ч����CO2����Ⱦ����ŷ�[52]�����ܺܶ��о����漰�����Դ�ļ�ֵ��̼���ż�ֵ,��������****�����߽�ϴӶ����ǶȺ��������ԴDZ���ľ��ü�ֵ��
�ຣʡ����ظ�ԭ����Ҫ��ɲ���,���й���Ҫ����̬��ȫ���ϡ�ս����Դ��������,��̬������ȫ����ȫ����ʮ����Ҫ��ս�Ե�λ��2018���ຣʡίʮ�����Ĵ�ȫ�������˼����̬��������,�ƶ���������չ,�����Ʒ������,����һ�����ߡ���ս�Բ����ຣʡ��Ϊ�й�����������Դ�ḻ��ʡ��֮һ,�ڷ�չ�����Դ������е���������������������صĵ���λ�ú���������,�ຣʡ���зḻ��ˮ��Դ��̫������Դ��������Դ��������Դ����ֲ����Դ��,�о�Ŀ�������DZ�����ڱ����ຣʡ��̬�����Ļ�����,��ֿ���������̬DZ�����ຣʡʵʩ����ɳ�����չս�Ե���Ҫ֧����
�������о������Ͻ��ຣʡ��5�������Դ�����ۺ��о�,���ຣʡ2000��2018��̫���ܡ����ܡ�ˮ�����ܡ������ܡ��������ܽ��ж�������,������̫���ܡ����ܡ�ˮ��������Դ��ʱ�շֲ����ӻ�,�������Դ����DZ����ֵ��̼���ż�ֵ��������,����ֱ��ȫ����˽��ຣʡ�����ԴDZ���ſ�,Ϊ���Һ��ຣʡ�����Դ����������ʩ���ּ�������������ƶ��ṩ��ѧ֧��,ҲΪͬ���о��ṩ�����ϵIJο���
2 �о����ſ����о�������������Դ
2.1 �о����ſ�
�ຣʡ�������귶ΧΪ89��35��E��103��04��E,31��36��N��39��19��N֮�䡣�й��ߴ����������ȫ������Ϊ���������������������С����ϡ����ϡ�����,�ຣʡλ���ߴ������������������,�����½,Զ�뺣��,�ش���ظ�ԭ,���ڸ�ԭ��½�������ຣʡ������������߶���,�ϱ����в��͵�̬��,�������θ߾�,����б,�������½�,��������Ϊ��ظ�ԭ�������ԭ���ɵش�,���θ���,��ò�������ຣʡ�dz������ƺӡ���������Ҫˮϵ�ķ�Դ��,��ˮ�϶�,ˮϵ����,�����ܼ�,�����Ƚ���,���ڶຣ��5000�����ϵĸߴ�ɽ��,ɽ�������ѩ,�㲼����,�γ�������Ȼ������ˮ�⡣�ຣʡ���Ƹߡ�����ϡ������������,̫��������������ľ���Ϻ��ε͵ĵ�����,������������������յIJ���Ҳ����,����������ķ������������,���й�̫�����������ĵ���֮һ����ظ�ԭ���ƿ���,���νϸ�,�Է���赲С,�������ϲ�ʢ��ƫ�Ϸ�,��������Ϊ������,������Դ�ḻ���ຣʡλ��ŷ�ǰ��Ľ��ӵ���,�ؿ��˶���Ƶ��,Ƶ������ɽ�˶�ʹ�û�Ծ�ؿǵ����˶�Ƶ��,������Դ�ḻ���ຣʡ�̲طḻ��ˮ�ܡ�̫���ܡ����ܵȿ�������Դ,���й�����Դ��Դ������ʡ,�Ҿ߱����ģ��������,�ǹ�����Ҫ�������Դ���ء�
2.2 �����ԴDZ����������
2.2.1 ˮ����ԴDZ����������CLM��Community Land Model��½�����ģʽ�ǹ��Ҵ����о����ģ�National Center of Atmospheric Research, NCAR����չ�ƹ��½�����ģʽ��CLM���ۺ���LSM��Land Surface Model����IAP94��Institute of Atmospheric Physics Land Surface model���Լ�BATS��Biosphere-Atmosphere Transfer Scheme����½��ģʽ�ŵ�Ļ�����,�Ľ���һЩ�������̲���������,���Ҽ�����ˮ�ġ��������ѧ�Լ���ֲ̬���ȹ���,��Ŀǰ�����Ϸ�չ��Ϊ���ƶ���Ҳ����߷�չDZ����½�����ģʽ֮һ�����,���IJ������·�����CLM5.0[53],ʹ����߶�����Ӧ��������ģ�ͣ�MOSART��,ͨ���˶��������Ժӵ���������ʱ��仯�ĺӵ������ٶȡ�ˮ���Լ��ӵ��ر�ˮ��������ģ��,�����õ��ຣʡ�ر�������,�ɵر����������ܲ��������ˮ��������Ϊˮ�翪������DZ�����������ݡ����ĸ���ˮ��Դ����ˮλ��̣߳�����ˮ�����������̲���,���㷽���繫ʽ��1����ʾ��
ʽ�У�
����,����ArcGISˮ�ķ�������,�����ຣʡ90 m���ָ߳�ģ�ͣ�DEM������,�Ե���ĵر�����ΪȨ�ؼ����ຣʡ�����ۻ��ֲ�,�����ɼ�ˮ���ֲ�ͼ��ˮ��Դֻ�дﵽһ���㼯���ž��з����������ο������о�[54],ȷ���û㼯��Ϊ1.28��106 m3,���ﵽ������ֵ��߱�����ˮ��ʹˮ����ת��Ϊ���ܵ�����������,���ڵ����ɿ���ˮ�缼�����������Լ�ˮ�ܲ�����ȫת��Ϊ����,����һ����ʧ,��������ܹ������õ�ˮ����ԴΪ�ɿ���ˮ������Դ��ȫ�������ɿ���ˮ����Դ��ռȫ��ˮ�������̲�����40.67%[50],�Դ˱��������ຣʡˮ�����ܷ��������侭�ü�ֵ��
��������CLMģ���������ݼ�����1��ʾ,ˮ������DZ�������Ŀռ�ֱ���Ϊ1 km,ʱ��Ϊ2000��2018�ꡣ
Table 1
��1
��1����CLMģ������Ļ������ݼ���Դ
Table 1
| ���� | ���� | ʱ�շֱ��� | ʱ�䷶Χ | ��Դ |
|---|---|---|---|---|
| �������� | CLDAS������������������ٷ������ݼ� | 0.0625��/hour | 2008��2018�� | ����������Ϣ����[55] |
| �й�����ǿ�����ݼ� | 5 km/3hour | 2000��2010�� | Li��[56],Huang��[57] | |
| �µ������� | ��������/���ظ������� | 30 m | 2000��2005��2010��2015�� | �й�������������̬��ѧ��������[58] |
| �й�ֲ������������ | 1 km | �� | �й���ѧԺ�������������빤���о���[59] | |
| ȫ��������ݣ�GLDBv.2�� | 1 km | �� | Kourzeneva��[60],Choulga��[61] | |
| DEM | 90 m | �� | �����ռ�������[62] | |
| CLASS Ҷ���ָ�� | 1 km/8day | 2000��2018�� | ���ҵ���ϵͳ��ѧ��������[63] | |
| �ӵ����� | ȫ��ӵ�ģ�����ݼ� | 0.125�� | �� | Li��[64] |
�´��ڴ�|����CSV
Ŀǰû��ͳһ�Ļ��ֱ���ȷ��ˮ������DZ���ĸߵ�,�ο��л�����ˮ�������ġ�ˮ��ˮ�繤�̵ȼ����ּ���ˮ������SL252-2017��[65]����ˮ�����繤�̵��ʿ���淶����GB50287-2016��[66],�����⽫ˮ������DZ������Ϊ4���ȼ�,����2��
Table 2
��2
��2ˮ��������ԴDZ���ּ�
Table 2
| ָ�� �ȼ� | ����װ��������MW�� | ˮ�����ܷ����� ����kW��h/km2�� | DZ�� �ּ� |
|---|---|---|---|
| 1 | ��50.0 | ��0.0010 | ƶ�� |
| 2 | 50.1~300.0 | 0.0011~0.0030 | һ�� |
| 3 | 300.1~1200.0 | 0.0031~0.0050 | �ḻ |
| 4 | >1200.0 | >0.0050 | ���ḻ |
�´��ڴ�|����CSV
2.2.2 ̫���ܷ���DZ����������
������̫����������Ϊ��������̫���ܷ���DZ��,����̫���������Ч����Сʱ��������װ�����������۷����������ຣʡ̫���ܷ���DZ�����ڼ����ຣʡ̫����ˮƽ���ܷ��䡢ɢ�����Ļ�����,���ݹ�ʽ��2��������б������ƽ��̫��������[67]��
ʽ�У�
��1�����Ч̫��������Сʱ��
���Ч̫��������Сʱ����ʾ�����վ���������ն���������������Сʱ��,�ǵ�վѡַ����Ҫ����[57]�����İ��չ̶�ʽб��̫���ܽ�������,���ݹ̶�б���ܷ���������,�������Ч����Сʱ��,���㷽���繫ʽ��3����ʾ��
ʽ�У�
��2��̫��������װ����
�ڿ��ǵ��ε�ò��̫���ܷ���װ����Լ����,����һ������̫���ܵ�վ�Ŀ�װ����,���㷽���繫ʽ��4����ʾ��
ʽ�У�
Table 3
��3
��3��ͬ�����¶��µ�����������
Table 3
| �������� | �¶� | ���������� |
|---|---|---|
| 315��~45�� | [0,10�� | 1.0 |
| 315��~45�� | [10,90�� | 0.0 |
| 45��~135��,135��~225��,225��~315�� | [0,10�� | 1.0 |
| 45��~135��,135��~225��,225��~315�� | [10,20�� | 0.8 |
| 45��~135��,135��~225��,225��~315�� | [20,30�� | 0.6 |
| 45��~135��,135��~225��,225��~315�� | [30,90�� | 0.0 |
�´��ڴ�|����CSV
Table 4
��4
��4��ͬ�����������͵�������
Table 4
| ������������ | ���������� |
|---|---|
| ʪ�ء�ɭ�֡�ˮ��� | 0.00 |
| ���ء�����ر� | 0.05 |
| ��ľ | 0.10 |
| �ݵ� | 0.20 |
| ��� | 1.00 |
�´��ڴ�|����CSV
��3���ຣʡ̫���ܷ���DZ�����㷽��
̫���ܷ���DZ��,�����۷�����,��ʾ�ڵ�λ�����,���ǵ��ε�ò���������õ�Լ������,�������Ч����Сʱ��������װ��������õ������ܷ�����,���㷽���繫ʽ��5����ʾ��
ʽ�У�
����2000��2007��̲��������������й���½�ر�ǿ�ȳ������ݼ�,2008��2018������CLDAS������������������ٷ������ݼ�����1����
�����Թ��������ѧ�о�Ժ���ܷ���ķּ���[70]��̫�����ܷ���DZ�����л���,�ɸߵ��ͷ�Ϊ4��;��������ʱ��������Ч���������Ļ���,�������̫���ܹ�����������ƶ��ķּ���,�ɸߵ��ͷ�Ϊ4��[71];�ڴ˻�����,Ϊ��һ�������й�̫������Դ���˷ḻ���ķֲ���Χ,�Ը�����ָ����ߵȼ���������һ���ķ�λ����Ϊ�ָ���ֵ,����ߵȼ����ٷ�Ϊ����,��ÿ��ָ���ܹ���5��[72]����5�����ּ���ֵ֮��,�����������ӷ�ֵ���,��ƽ��ֵ��Ϊ����̫������Դ����DZ���ܷ�ֵ,���㷽���繫ʽ��6����
Table 5
��5
��5̫������ԴDZ���ּ�
Table 5
| ָ��ȼ� | ��ֵ | ���ܷ��䣨MJ/m2�� | ������ʱ�� | ����Ч�������� | DZ���ּ� |
|---|---|---|---|---|---|
| 1 | 20 | ��4200.0 | ��1600.0 | ��210.0 | ƶ�� |
| 2 | 40 | 4200.1~5200.0 | 1600.1~2000.0 | 210.1~270.0 | һ�� |
| 3 | 60 | 5200.1~6200.0 | 2000.1~2400.0 | 270.1~330.0 | �Ϸḻ |
| 4 | 80 | 6200.1~7000.0 | 2400.1~3200.0 | 330.1~350.0 | �ḻ |
| 5 | 100 | >7000.0 | >3200.0 | >350.0 | ���ḻ |
�´��ڴ�|����CSV
ʽ�У�
2.2.3 ���ܷ�����ԴDZ����������
������Դ�����Ĺؼ�����֮һΪ�繦���ܶȡ��繦���ܶ�ָ���������ڵ�λʱ���ﴹֱͨ����λ������ķ繦��[73],������һ������������ԴDZ������Ҫ����[74]�����ĸ��ݹ��ұ���GB/T18170-2002������糡������Դ��������������繦���ܶ�,�繫ʽ��7����ʾ��
ʽ�У�
ʽ�У�
ʽ�У�
2000��2007����١���ѹ���������������й���½�ر�ǿ�ȳ������ݼ�,2008��2018�����Ե�������ظ�ԭ��ѧ�������������еĶ�����������������ٷ������ݼ�����1����
���ұ�����糡������Դ������������GB/T18710-2002���Է�����Դ�ķ繦���ܶȵȼ������˻��֡�ֻҪ������Դ�ﵽ3�������Ͼ��������粢�������ģ�����Ļ���Ҫ��,��2��������Դ������Ŀǰֻ���ڷ�չ��С�ͻ������ͷ�硣�ڽ��з�����Դ����DZ������ʱ,��Ҫ���ǵ�ǰ�й����ģ����������Ҫ,ҲҪ�������ż���ˮƽ������ڷ�����Դ�ȼ��ϵ͵���½������չС������������Ҫ��
���ĵķ�����Դ�����ο���������������Դʵ���ң�NREL���ķ���,�Ӽ��������ü����Һ͵ط����߽Ƕ��ۺϿ���,�й�½�ط�����Դ���ɿ���������Ҫ����,���θ߶ȡ�3500 m�ĵ���,GIS�¶�>4%�ĵ���,�Լ�ˮ�塢ʪ�ء�����صȡ���˸�����ƽ�����١������������������,��������ԴDZ������Ϊ4���ȼ�����6����
Table 6
��6
��6������ԴDZ���ּ�
Table 6
| ָ�� �ȼ� | ��ƽ������ �ο�ֵ/��m/s�� | Ӧ���ڲ������� �������� | DZ�� �ּ� |
|---|---|---|---|
| 1 | 5.1 | ���� | ƶ�� |
| 2 | 5.6 | �Ϻ� | һ�� |
| 3 | 6.0 | �� | �ḻ |
| 4 | 6.4 | �ܺ� | ���ḻ |
�´��ڴ�|����CSV
2.2.4 �������ܷ���DZ����������
�����ຣʡͳ������,�������������̲���,��������Դ�����ຣʡ�����ʷ�Ϊ5��,�ֱ��ǽո���Դ�����ݷ�㡢н����ľ�������������ˮ��
��1���������̲���
��ũ����ոѣ���Ҫ������ʳ���������������������������5����[75]������;�㷺,��������Ϊ��ҵԭ�Ϻ�����������,ʣ�ಿ�ֶ�������Ϊȼ��ʹ�á����ڽոѲ���δ��������йز��ŵ�ͳ�Ʒ�Χ,�����ͨ������ũ����IJ���������á����㷽���繫ʽ��10����ʾ��
ʽ�У�
Table 7
��7
��7��ͬũ����Ȳݱ�ϵ��
Table 7
| �ո���Դ���� | �ݹȱ�ϵ�� |
|---|---|
| �� | 1.1 |
| ���� | 1.6 |
| ���� | 1.0 |
| �Ͳ��� | 3.0 |
| ���� | 2.0 |
�´��ڴ�|����CSV
�����ݷ�㣺��һ����Ҫ����������Դ�����ݷ�㾭�����ֱ��ȼ�չ�Ӧ����,���������������ɲ�������ͷ��ϡ����ݸ�������ÿ�շ������������ݵ��������ڿ��Թ������ݷ���ŷ���,���㷽���繫ʽ��11����ʾ��
ʽ�У�
Table 8
��8
��8��λ�����������ڵķ����й��
Table 8
| �������� | �������ڵķ����й��/kg |
|---|---|
| ���� | 1050.0 |
| ������ | 1460.0 |
| ţ | 8200.0 |
| �� | 632.0 |
| �� | 5237.0 |
| ���� | 4.5 |
| ���� | 55.0 |
�´��ڴ�|����CSV
����ľ�����ʣ�����ͨ��н̿��,��ҵ��������ʣ�����Լ���ľ�֡����ֵ�������ľ��������Դ������[80]�����ĸ����ຣʡͳ��������ݼ�������ҵ�����ɷ�ʣ�����ľ�����䷥������������ֲ��3����ľ��������Դ�����㷽����ʽ��12����ʾ��
ʽ�У�F��ʾ��ľ��������Դʵ������t��;
Table 9
��9
��9��ľ�������ܼ������[81]
Table 9
| ���� | bj | ���� |
|---|---|---|
| �ɷ�ʣ���� | 40% | 1.17 t/m3 |
| �������� | 8 m/hm2 | 0.90 t/m3 |
| ������ | 100% | 2.00 kg/�� |
�´��ڴ�|����CSV
�ܳ���������ͨ���ຣʡͳ�������ÿ��ij��������������õ���
�ݳ�����ˮ������������������,��Ϊ��ҵ��ˮ�������ˮ������,���㷽���繫ʽ��13����ʾ��
ʽ�У�
��2���������۱���Դ��
�������ϸ�������������Դ��ʵ����,����Ӧ���۱�ϵ��,�Ϳ��Եõ���ͬ�������������ۺϳɱ���Դ������������,�ڽո���Դ�����Ļ����������۱�ϵ��
ʽ�У�ESΪũ����ոѵ��۱���Դ����;
���ݷ����Դ��ԴDZ����ET,��ľ��Դ��ԴDZ����
Table 10
��10
��10��ͬ������������Դ���۱�ϵ��[82,83,84]
Table 10
| ���������� | �۱���Դϵ�� |
|---|---|
| ��ѡ������ | 0.500 |
| ������ | 0.050 |
| ����� | 0.486 |
| ���ϸ� | 0.529 |
| � | 0.571 |
| ţ�� | 0.429 |
| ���� | 0.471 |
| ������¿����� | 0.529 |
| ���� | 0.643 |
| �������� | 0.143 |
| ��ҵ�� | 0.857 |
| ũҵ�� | 0.714 |
�´��ڴ�|����CSV
������ʹ�õ�ũ����ոѲ�����������ֳ���ݡ���ľ���ݡ�����������������������ˮ���ݡ���ˮ��CODƽ������,����2000��2018�꡶�ຣʡͳ���������2000��2018�꡶�й�ͳ���������2000��2018�꡶�й�����ͳ���걨����
2.2.5 �����ܷ���DZ����������
�й����ʿ�ѧԺˮ�ĵ��ʻ��������о������ຣʡ��չ�ġ��ຣʡ������Դ�������ۡ����������ˮ�ĵ��ʵ��顱��Ŀ������ຣʡ������Դ��״��������������[85]���������ݻ�ȡ�ľ�����,����2000��2018������ܷ���DZ�����ݸ��о�̽����2012��2014�������Դ��ƽ��ֵ���档
2.3 �����Դ��ֵ�о�����
2.3.1 �����Դ�����ֵΪ�˱��ڱȽ�,�����Դ��ֵ����ο�2018��ļ�ֵָ�������ݹ�����Դ�ַ�����2018���ȫ�������۸�������ͨ����[86],ˮ�����ƽ���������Ϊ267.19Ԫ/ǧkW��h,�������ƽ���������Ϊ859.79Ԫ/ǧkW��h,������ƽ���������Ϊ529.01Ԫ/ǧkW��h,�����ʷ���ƽ���������Ϊ677.99Ԫ/ǧkW��h,���ڵ�����Ŀǰû��ͳһ�ļ۸��,�ʽ�����������ı�ú��ȫȼ���ͷŵ�������Ϊ���۷�����,��2018��ȼú����ƽ���������Ϊ370.52Ԫ/ǧkW��h�Ե�����DZ����ֵ��������,���㷽���繫ʽ��15����ʾ��
ʽ�У�
2.3.2 �����Դ̼���ż�ֵ
����2006��IPCC�ƶ��ġ��������������嵥ָ�ϡ����ṩ�IJο�����,CO2�ŷ������Ը��ݸ�����Դ���ѵ��µ�CO2�ŷŹ������Ӻ͵õ�[87]�������л�������̬�����������ġ�2006��2017��ȼ�����Ŀ���й�������������ŷ����ӡ���֪,�ຣʡ���������������,�����ļ��е��ŷ����Ӽ��㷽����ԭ��,ȡ2006��2017��ƽ��ֵ��Ϊ�ຣʡCO2�ŷ�ϵ��,��1.0012��tCO2/MW��h��������������Դ�������������Դ̼��������,������������,��ͬ�����Դ���緽ʽ1 kW��h�ķ�����ƽ��������CO2��[88],������������Դ����ֵ�Ĵ�ͳ��Դ���õ�̼�ŷ��п۳������Եõ������Դ̼��������
Ϊ�˱��ڱȽ�,�����Դ̼���ż�ֵ�������2018��ļ�ֵָ�����м��㡣���ݡ�2018���й�̼�۵��顷�е��Ե�̼�۷�Χ[89]������ƾ���ѧ��ɫ���ڹ����о�Ժ������2018���Ե�̼�г��۸�õ�2018���й��Ե�̼�г���ȳɽ�����Ϊ23.445 Ԫ/tCO2�����ݴ˶������Դ��̼���ż�ֵ���м���,�繫ʽ��16����
ʽ�У�
3 ��������
3.1 �����Դ����DZ��
3.1.1 ˮ����ԴDZ��2000��2018���ຣʡˮ������DZ�����������ƣ�n=19, R2=0.49��,��2016��֮��,ˮ������DZ�������Ͽ�,��ƽ������Ϊ52.157��kW��h,���ռ�ֲ����δ�������Ա仯,��ֵ����Ҫ�ֲ����ຣʡ�ϲ��ͱ�����������
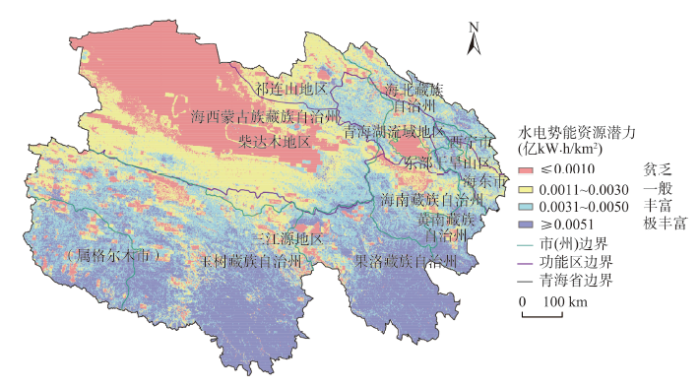
2000��2018���ຣʡƽ��ˮ������DZ���Ŀռ�ֲ���ͼ1��ʾ����ȫʡ����ռ�ֲ��������,ˮ��������ԴDZ���ڿռ��ϳʲ����ȷֲ�,ˮ�����ܸ�ֵ���ֲ����ຣʡ�ϲ�������,��ֵ���ֲ���������,�ɶ����������ݼ������ݣ��У��߶�����,�����ݺͺ�������ˮ������DZ���ĸ�ֵ��,����ƽ��ˮ������DZ�����ֵ�ֱ�ﵽ896��kW��h/�ꡢ645��kW��h/��,��ռȫʡˮ������DZ��������66%;�����ݡ������ݡ�������Ϊˮ������DZ������ֵ��,��ռȫʡˮ������DZ��������27%;�����ݡ������С�������Ϊˮ������DZ���ĵ�ֵ��������̬�������߶�����,����Դ������ˮ������DZ���ĸ�ֵ��,����ƽ��ˮ������DZ�����ֵ��2502.96��kW��h/��,ռȫʡˮ������DZ��������74%;�����ɺ�ɽ��Ϊˮ������DZ������ֵ��,ռȫʡˮ������DZ��������13%;���ľ�������ຣ�����������ɽ����Ϊˮ������DZ���ĵ�ֵ����
ͼ1
 �´��ڴ�|����ԭͼZIP|����PPT
ͼ12000��2018���ຣʡ����ƽ��ˮ������DZ���Ŀռ�ֲ�
Figure 1Spatial distribution of the average hydropower potential energy in Qinghai Province, 2000-2018
ˮ������DZ����ʱ���ϳ���������,��������ʽ�ˮ������������,ʹ�õر�ˮ��Դ������,����Ӱ��ˮ�����ܱ仯;�������ȫ�������ů�Ĵ���,��Ȼ������������,��ͬʱ��ʹ����������ˮ������,�Ӷ�ʹҺ̬ˮ��Դ������һ��ʱ��������[90]��ˮ������DZ���ڿռ�ֲ��ϳ��ֶ��ϸ������͵ĸ�֡������ǽ�ˮ�Ŀռ�ֲ�����,������������λ��,�ຣʡ���ϲ��������ɽ��,�ϱ�����ĺ��ɽ����������ϼ���,�����ϼ�����غӹ�̧��,���ຣ�ϲ��γɽ�ˮ,��ˮ�ֲ���־����˾����Ĵ���仯����,�γɶ��ϵ���ˮ��������ԴDZ���ϴ�Ŀռ���;����,�ر��������¶���ˮλ��Ҳ����ҪӰ������,�ຣʡ��������Ϊ��ظ�ԭ�������ԭ���ɵش�,���θ���,�����Ƚ���,�Ӷ��γɶ��ϸ������͵�ˮ������DZ���ֲ���
3.1.2 ̫���ܷ���DZ��
2000��2018���̫���ܷ���DZ��������ϣ�n=19, R2=0.89��,�������,2000��2005��̫���ܷ���DZ�����ּ�������,2005��2015�������������,2015��2018��ʼ�������,��2000��2018���������������,�ռ�ֲ���ֱ仯����,��̫���ܷ���DZ�����ȶ���
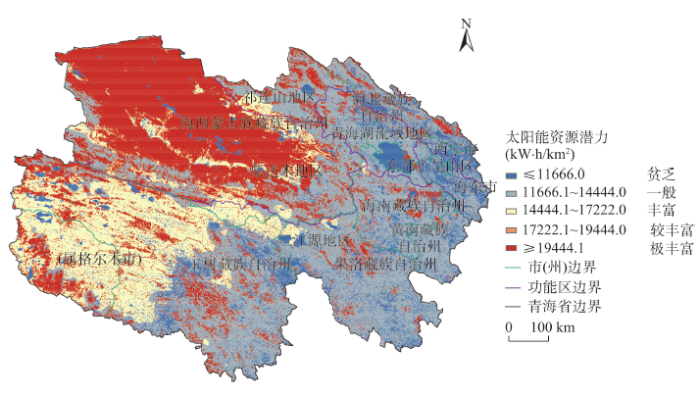
2000��2018���ຣʡƽ��̫���ܷ���DZ���Ŀռ�ֲ���ͼ2��ʾ����ȫʡ����ռ�ֲ�����,̫������Դ�ڿռ��ϳ��ֲ����ȷֲ�,�����������ϳʵݼ����ơ����ݣ��У��߶�����,��������̫���ܷ���DZ���ĸ�ֵ��,����ƽ����߷���DZ����150.66��kW��h/��,ռȫʡ̫���ܷ���DZ�������ĵ�65%;��������̫���ܷ���DZ������ֵ��,ռȫʡ̫���ܷ���DZ��������22%;�����ݡ������ݡ������ݡ������ݡ������С���������̫���ܷ���DZ���ĵ�ֵ��������̬�������߶��������ľ������̫���ܷ���DZ���ĸ�ֵ��,����ƽ����߷���DZ����123.52��kW��h/��,ռȫʡ̫���ܷ���DZ��������53%;����Դ������̫���ܷ���DZ������ֵ��,ռȫʡ̫���ܷ���DZ��������39%;����ɽ�������ຣ���������ɺ�ɽ����̫���ܷ���DZ���ĵ�ֵ����
ͼ2
 �´��ڴ�|����ԭͼZIP|����PPT
ͼ22000��2018���ຣʡ����ƽ��̫���ܷ���DZ���Ŀռ�ֲ�
Figure 2Spatial distribution of the average solar power generation potential in Qinghai Province, 2000-2018
̫���ܷ���DZ����ʱ���ϳ������ӵ�������Ҫ���������״��Ӱ��,���Ч����Сʱ������,��������̫���ܷ���DZ�����������ơ�̫���ܷ���DZ���ڿռ�ֲ��ϳ��������߶��ϵͷֲ��ĸ����Ҫ��γ��λ��Ӱ��,�ຣʡ�ش��и�γ�ش�,̫������ǿ�ȴ�,����ʱ�䳤;������ܺ��θ߶�Ӱ��,�ຣʡ���θ�,����ϡ��,������̫��������赲������,��������̫������ǿ�������ܵ��κ�������������Ӱ��,�ຣʡ�����ظ�ԭ����½�ɺ���ء�������ԭ���ֵ��ε�ò,���κ�������������Ӱ��̫����װ�����,�����γ�̫���ܷ���DZ���������߶��ϵ͵Ŀռ��֡�
3.1.3 ���ܷ���DZ��
2000��2018���ຣʡ���ܷ���DZ�����½����ƣ�n=19, R2=0.449��,ƽ��ÿ���½�Լ0.384��kW��h,���ռ�ֲ���ֱ仯��С��
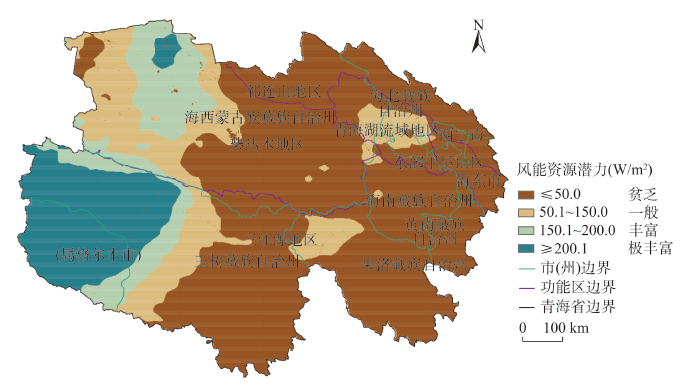
2000��2018���ຣʡƽ�����ܷ���DZ���Ŀռ�ֲ���ͼ3��ʾ����ȫʡ�ռ�ֲ�����,���ܷ���DZ���ڿռ��ϳʲ����ȷֲ�,������Ϊ������,�����͡����ݣ��У��߶�����,�������Ƿ��ܷ���DZ���ĸ�ֵ��,���ÿ���1.82��106 W/m2,ռȫʡ���ܷ���DZ��������48%;�������Ƿ��ܷ���DZ������ֵ��,ռȫʡ���ܷ���DZ��������30%;�����ݡ������ݡ������ݡ������ݡ������С��������Ƿ��ܷ���DZ���ĵ�ֵ��������̬�������߶�����,����Դ����ʼ�մ��ڷ��ܷ���DZ���ĸ�ֵ��,����ƽ����߷���DZ����1.77��106 W/m2 ,ռȫʡ���ܷ���DZ��������56%;���ľ�����Ƿ��ܷ���DZ������ֵ��,ռȫʡ���ܷ���DZ��������32%;����ɽ�������ຣ���������ɺ�ɽ���Ƿ��ܷ���DZ���ĵ�ֵ����
ͼ3
 �´��ڴ�|����ԭͼZIP|����PPT
ͼ32000��2018���ຣʡ����ƽ�����ܷ���DZ���Ŀռ�ֲ�
Figure 3Spatial distribution of the average wind power generation potential in Qinghai Province, 2000-2018
���ܷ���DZ���ڿռ��ϳ������߶��͵ĸ��,��Ҫ�ܵ��ε����ص�Ӱ��,�ຣʡ�������νϸ�,���ڵ��ε�̧�������γɴ��,��˺��������������������������ľ����������Դ�ḻ���ຣ�������桢���������ɽ��,����ͨ�����������������ʱ���������ЧӦ�����·�������,ͬʱ���ڶ��϶˵��ƽϸ�,�������ڴ˲����ѻ����ö�����,�����������������⻬�ĺ���ʱҲ�����,����ຣ���ܱߵ�������DZ���ϴ�
3.1.4 �������ܷ���DZ��
2000��2018���ຣʡ��������Դ�ۺϱ�ú��Դ��������11��ʾ��
Table 11
��11
��112000��2018���ຣʡ��������Դ�ۺϱ�ú����
Table 11
| ��� | �ո�/��t | ���ݷ��/��t | ��ľ/��t | ��������/��t | ��ˮ/��t | �ܺ�/��t |
|---|---|---|---|---|---|---|
| 2000 | 89.74 | 2157.24 | 2876.32 | 13.69 | 2.51 | 5139.50 |
| 2001 | 77.77 | 2535.06 | 3380.08 | 10.84 | 2.54 | 6006.30 |
| 2002 | 71.86 | 2578.78 | 3438.37 | 11.30 | 2.51 | 6102.82 |
| 2003 | 74.23 | 2500.90 | 3334.53 | 7.99 | 2.48 | 5920.13 |
| 2004 | 80.91 | 2717.14 | 3622.85 | 8.25 | 3.03 | 6432.18 |
| 2005 | 90.47 | 2755.69 | 3674.26 | 7.78 | 5.60 | 6533.80 |
| 2006 | 70.45 | 2787.66 | 3716.88 | 8.55 | 5.75 | 6589.30 |
| 2007 | 86.55 | 2897.62 | 3863.49 | 9.25 | 5.91 | 6862.81 |
| 2008 | 92.84 | 2478.19 | 3304.26 | 9.09 | 5.80 | 5890.19 |
| 2009 | 98.31 | 2969.49 | 3959.31 | 12.50 | 5.92 | 7045.53 |
| 2010 | 96.41 | 3006.90 | 4009.20 | 11.88 | 8.01 | 7132.39 |
| 2011 | 92.62 | 3067.77 | 4090.36 | 11.88 | 8.01 | 7270.65 |
| 2012 | 90.49 | 2964.33 | 3952.44 | 9.48 | 8.07 | 7024.82 |
| 2013 | 89.60 | 2924.25 | 3899.00 | 10.60 | 8.04 | 6931.48 |
| 2014 | 87.27 | 3025.99 | 4034.65 | 11.10 | 8.16 | 7167.17 |
| 2015 | 84.69 | 3172.70 | 4230.27 | 11.75 | 8.11 | 7507.52 |
| 2016 | 84.20 | 3279.38 | 4372.50 | 11.73 | 5.46 | 7753.27 |
| 2017 | 82.44 | 3357.87 | 4477.17 | 11.11 | 4.47 | 7933.06 |
| 2018 | 87.95 | 3138.24 | 4184.32 | 16.23 | 4.47 | 7431.21 |
�´��ڴ�|����CSV
2000��2018����ຣʡ��������Դ���������ƣ�n=19, R2=0.807��,��ľ��Դ�����ݷ����Դ����ռ�Ƚϸ�,����ǽո���Դ��������������ˮ��Ӱ����������Դ�������кܶ�,�������ϡ���Ȼ������������ֲ����ȡ���������Դ�������������˿��������������й�ϵ,2000��2018���ຣʡ��ס�˿�������503��������603.23��,�����˿���������,����������������ˮ��ҵ��ˮ���ŷ�������,������ֲ������������ˮƽҲ�������,ʹ��������Դ��Ϊ�ຣʡ���нϴ�չDZ���ĵ������Դ֮һ[84]��
3.1.5 ��������ԴDZ��
�ຣʡ������Դ�ܴ���Ϊ1.43��1020 J,�ۺϱ�úΪ8.10��109 t;�ɿ��ɵ�����Դ����Ϊ1.40��1017 J/��,�ۺϱ�úΪ7.98�� 106 t/��[85]���ຣʡ������Դ������Ҫ��Ϊ¡������ͺͳ�������͡�¡������͵�����Դ,���ֲ�������ܱ�ɽ���ش�,������Ȫ��ʽ�ض��Ѵ���й�ڵر�,�����¶ȸߡ��ֲ����С���ص�,��Ҫ�ֲ������������Եҩˮ̲�������������ˮ�����������˺�����Ȫ���������ƹ���ɽ����Ȫ�������ȡ��ຣʡ��������͵�����Դ��Ҫ�ֲ����ຣ������������¡����͵������,�õ���������Դ�ḻ,�������ü�ֵ�ϸ�,ͬʱ�����о��̶Ƚϸߡ��ຣʡ������Դ����Դ������ײ��ҽ����ʷ�������������,�����ҹ���ظ�ԭ��������ǿ�ҵĹ����˶�,����������,��ŷ�ǰ���ӡ������ļ�ѹ,��ظ�ԭ��¡��,�ֲ����ҽ����ֵĴ���,�ʲ������������������Դ��¡������͵�����Դ[91]�������ຣʡ������Դ�㷺�ֲ�����״,δ�������ߴ�ʩ������,�ܸ��õ��ƶ�������Դ��������,Ϊ�й����ȷ���ս�Բ����������ס�
3.2 �����Դ��ֵ
2000��2018���ຣʡ5�������Դ��ֵ��������12��ʾ��Table 12
��12
��122000��2018���ຣʡ�����Դ��ֵ/��Ԫ
Table 12
| ��� | ˮ������ | ̫���� | ���� | �������� | ������ | �ܼ�ֵ | |||||||||
|---|---|---|---|---|---|---|---|---|---|---|---|---|---|---|---|
| ���� | ̼���� | ���� | ̼���� | ���� | ̼���� | ���� | ̼���� | ���� | ̼���� | ||||||
| 2000 | 685.26 | 45.59 | 184.00 | 4.48 | 16.33 | 0.71 | 411.97 | 29.63 | 221.37 | 4.67 | 1604.00 | ||||
| 2001 | 657.25 | 43.71 | 182.46 | 4.44 | 17.00 | 0.74 | 481.45 | 34.63 | 221.37 | 4.67 | 1647.72 | ||||
| 2002 | 706.91 | 47.02 | 180.55 | 4.39 | 16.80 | 1.07 | 489.18 | 35.18 | 221.37 | 4.67 | 1707.14 | ||||
| 2003 | 739.99 | 49.22 | 180.74 | 4.40 | 20.92 | 0.91 | 474.54 | 34.13 | 221.37 | 4.67 | 1730.89 | ||||
| 2004 | 722.07 | 48.03 | 183.67 | 4.47 | 20.30 | 0.89 | 515.58 | 37.08 | 221.37 | 4.67 | 1758.11 | ||||
| 2005 | 838.46 | 55.78 | 179.41 | 4.36 | 17.43 | 0.76 | 523.73 | 37.67 | 221.37 | 4.67 | 1883.63 | ||||
| 2006 | 626.18 | 41.65 | 176.31 | 4.29 | 17.94 | 0.78 | 528.18 | 37.99 | 221.37 | 4.67 | 1659.36 | ||||
| 2007 | 831.34 | 55.30 | 181.30 | 4.41 | 17.12 | 0.75 | 550.10 | 39.56 | 221.37 | 4.67 | 1905.91 | ||||
| 2008 | 813.57 | 54.11 | 188.13 | 4.58 | 15.41 | 0.67 | 472.14 | 33.96 | 221.37 | 4.67 | 1808.61 | ||||
| 2009 | 887.52 | 59.03 | 185.39 | 4.51 | 15.95 | 0.70 | 564.75 | 40.62 | 221.37 | 4.67 | 1984.50 | ||||
| 2010 | 813.71 | 54.12 | 190.46 | 4.63 | 16.46 | 0.72 | 571.71 | 41.12 | 221.37 | 4.67 | 1918.97 | ||||
| 2011 | 844.55 | 56.17 | 193.72 | 4.71 | 16.56 | 0.72 | 582.79 | 41.91 | 221.37 | 4.67 | 1967.17 | ||||
| 2012 | 853.20 | 56.75 | 192.46 | 4.68 | 16.67 | 0.73 | 563.09 | 40.50 | 221.37 | 4.67 | 1954.12 | ||||
| 2013 | 749.83 | 49.88 | 198.47 | 4.83 | 15.26 | 0.67 | 555.61 | 39.96 | 221.37 | 4.67 | 1840.54 | ||||
| 2014 | 860.02 | 57.21 | 198.06 | 4.82 | 15.22 | 0.66 | 574.50 | 41.32 | 221.37 | 4.67 | 1977.85 | ||||
| 2015 | 653.91 | 43.49 | 190.47 | 4.63 | 15.90 | 0.69 | 601.78 | 43.28 | 221.37 | 4.67 | 1780.20 | ||||
| 2016 | 956.05 | 63.59 | 195.06 | 4.74 | 14.55 | 0.63 | 621.48 | 44.70 | 221.37 | 4.67 | 2126.85 | ||||
| 2017 | 1107.23 | 73.65 | 179.82 | 4.37 | 14.77 | 0.64 | 635.89 | 45.73 | 221.37 | 4.67 | 2288.15 | ||||
| 2018 | 1189.14 | 79.10 | 171.18 | 4.16 | 14.77 | 0.64 | 595.66 | 42.84 | 221.37 | 4.67 | 2323.53 | ||||
�´��ڴ�|����CSV
�����ԴDZ���ܼ�ֵ�ɱ�����ֵ������е�̼���ż�ֵ���������,���Ķ�5�������Դ�ı�����ֵ��̼���ż�ֵ������������,�ó����½����
��1�����ܼ�ֵ�ı仯��������,2000��2018��,�����Դ��ֵ���������ƣ�n=19,R2=0.69��,ƽ������Ϊ29.61��Ԫ/�ꡣ����,ˮ�����ܡ�̫���ܡ��������ܼ�ֵ����������,ƽ�������ֱ�Ϊ19.47��Ԫ/�ꡢ0.44��Ԫ/�ꡢ9.91��Ԫ/��,���ܳʼ�������,ƽ������Ϊ0.21��Ԫ/�ꡣ�����Դ�ļ�ֵ�����̼�����г���̼�����۹�ϵ����,����̼�г���չѸ���Ҽ۸��ϴ��й�����̼���ײ�ҵ������Ͷ�,ֻ����Ϊ�г��IJμ��ߺ����ִ���߽���̼�г�����[92]�����δ�������ԴDZ���ļ�ֵ�仯ȡ����δ���й���̼�����г���չ���,����̼�����г���ϵ,��ǿ�������Դ��չ���ƣ�Clean Development Mechanism,CDM����Ŀ�������о����ƶ�ͳһ���ױ���,���й�̼�����г������ƾ�����Ҫ���塣
��2�� ����Դ�ṹ����,2000��2018��ˮ������ƽ����ֵռ�����Դ�ܼ�ֵ�ı������46.20%��,������������ܣ�30.82%���������ܣ�11.97%����̫���ܣ�10.09%���ͷ��ܣ�0.92%��;����Դ��ֵ��������,�����Դ�����ֵռ�ܼ�ֵ��95%,̼���ż�ֵռ�ܼ�ֵ��5%�����ݡ��ຣ�����Դ��չ��Ƥ��2019��[93],����2018���,�ຣʡ�����Դװ����ģ�Ѵ�2420��kW,ռȫʡ��Դ��װ����86.5%,����,ˮ������ռ�ຣʡ��Դ�ṹ��42.6%,̫���ܷ���ռ34.4%,��������ռ9.5%���ɱ��Ķ������Դ��ʱ�շֲ�����������Կ����ຣʡ�������Դ���о�DZ��,���������Դ����Դ�����еı���,�ܹ���ø��ߵķ����ֵ��̼���ż�ֵ��
��3�������ຣʡ�����ġ��ຣ��Դ��չ���棨2018����[94],2018�������Դ��ʵ���������ֱ�Ϊ��ˮ��������Ϊ517��kW��h,ͬ������56.6%;����������Ϊ37.6��kW��h ,ͬ������108.9%,������1.6%;̫���ܷ�����Ϊ131.1��kW��h,ͬ������15.6%,������4.75%�����ݱ��ĵ��о����,�ຣʡˮ�硢̫���ܷ��硢���������ʵ��Ӧ��Լռ������ԴDZ����26%,������������������д���������,���,�ຣʡδ���������Դ����Ӧ��DZ����
4 ����������
4.1 ����
���Ļ���ģ��ģ��Ϳռ�����ȷ���,���ຣʡˮ�����ܡ�̫���ܡ����ܡ��������ܡ�������5����Ҫ�����Դ�ķ���DZ������ֵ��������,�õ����ຣʡ��Ҫ�����Դ����DZ����ʱ�շֲ���ֺ�����ͳ����������Ҫ�����У���1���ຣʡ�����Դ�̲����ḻ,��������DZ����,����ʱ��Ϳռ�仯������2000��2018���ຣʡ�����ԴDZ��������������ӵ�����,����ˮ�����ܡ�̫���ܡ��������ܳ���������,���ܳʼ�������;�ڿռ���,�ຣʡ���������ԴDZ����Խϸ�,�����ϵ�,�������зḻ��̫���ܺͷ���,�������зḻ��ˮ�����ܡ���Դ�����͵�λ�����Դ����Ч��������ȫһ��,�������Դ����ʱӦ�ۺϿ��Dz�ͬ��������̬������״����Դ����Ч�ʡ���Դ�̲�����������,���ѳ��ڴ��������ԴDZ���ĸ�ֵ����Ϊ���ȿ�����,����������������̫���������,�ڶ�����������ˮ�����ܵȡ�
��2���������Դ�ṹ����,�ຣʡˮ����ԴDZ����Ϊ�ḻ,������������ܡ������ܡ�̫���ܺͷ��ܡ����ſ�ѧ�����Ľ���,�ຣʡˮ��վ�������վ�����վ��װ����������������,��������Դ��ʹ����Ҳ�ڲ������,���ǵ�����������Ȼ���ڳ�����,�������������١���������Դ������״,Ӧ��ֿ��������Դ���̲����Ϳ�������,�ں���������̬������ǰ����,�����˵�����һ������ˮ������վ��̫���ܷ���վ����������վ,�����������Դ������Ч��,�Կ����ڷ���ĵ�����Դ���п�̽�Ϳ�����
��3���������Դ��ֵ����,2000��2018�������Դ��ֵ����������,ˮ������ƽ����ֵռ�����Դ�ܼ�ֵ�ı������,������������ܡ������ܡ�̫���ܺͷ��ܡ��������ͳ�������뱾���о�����ȽϺ���,ȫʡ�����Դʵ��Ӧ�ó̶���������Ӧ��DZ�����нϴ���,δ���ຣʡ�����Դ����ˮƽ���ڽϴ������ռ䡣��δ�������Դ�������ù�����Ӧ�����ԴDZ����������ͬ��������Դ����Ч������Դ����,�����������Դ��������Ӧ�IJ�ҵ��ϵ��������ϵ,�Ӵ��ƹ������Դ�������õ����ȡ�
4.2 ����
���������Ķ���Ϊ�ຣʡ�����Դ����DZ����DZ�ڼ�ֵ,��˶���������Ϳ������������Դ������չ�����ۣ���1�����Ŀ������ຣʡ����ֲ����ˮ�ġ����ε�ò����������Ȼ����Ҫ��ʱ�շ�������,ͨ����2000��2018���ຣʡ�����Դ����������,��һ��֤ʵ�ຣʡ������ֵ����̬��һ��ѧ�жϡ�����,ˮ�����ܡ�̫���ܡ����ܷ���DZ��Ӱ�������ڶ�,��������ֲ�������صı仯ʹ��ʱ�շֲ����ж�̬�仯������һ���IJ�ȷ����,����Ҫ��һ���ij��ڸ����о���
��2�����ĸ���ģ��ģ�������ͳ�ƽ��������2000��2018���ຣʡ�����Դ����DZ����̼����DZ���������ԴDZ����ֵ����ƽ��������۽��к���,̼����DZ����ֵ�����й��Ե�̼�г���ȳɽ����۽��к���,������пɿ���,Ϊͬ���о��ṩ�˷����ϵIJο����ɱ��ĺ�����̿�֪,�����Դ�ļ�ֵ���й���������ۺ���̼�����г���̼�����۹�ϵ����,�����δ����չ��,ȷ�������Ĺ���������ۡ��ƶ�ͳһ���й�̼���ױ��ȴ�ʩ�Կ��������Դ��������۾��á����������������л���Ӱ�졣
��3�����ݱ��ĺ�����,�ຣʡˮ�����硢̫���ܷ��硢���������ʵ��Ӧ��Լռ������ԴDZ����26%,������������������д���������,ӡ֤���ຣʡ�����Դ���о�Ŀ���DZ�������,�������ˮ�ܡ����ܡ�̫���ܡ��������ܡ����ȵ������Դ,�������Ʋ��Ż��ຣʡ����ȫ������Դ���ѽṹ;�ƶ������������������Դ������������,���ո����ʱ�,���������Դ���������÷����Ͷ��,����ȷ���й�����Դ��ȫ,����������Ⱦ����,���衰�����й�������ʵ��̬�������趼����ʮ����Ҫ��ս�����塣
�ο����� ԭ��˳��
������ȵ���
������������
�����ڿ�Ӱ������
[R/OL]. (
URL [��������: 1]
[R/OL]. (
URL [��������: 1]
[��������: 1]
[J].
[��������: 1]
[EB/OL]. (
URL [��������: 1]
[EB/OL]. (
URL [��������: 1]
[J].
[��������: 1]
[J].
[��������: 1]
[J].
[��������: 1]
[J].
DOI:10.1007/s11269-015-0975-1URL [��������: 1]
[J].
DOI:10.3178/hrl.11.6URL [��������: 1]
[J].
DOI:10.1080/00908310490451385URL [��������: 1]
[J].
[��������: 1]
[J].
DOI:10.1007/s40808-015-0041-2URLPMID:26870835 [��������: 1]

0.97). This makes the model suitable for the application on sites, where the information on soil temperature is discontinuous or scarce.]]>
[J].
[��������: 1]
[J].
DOI:10.1016/j.energy.2010.03.025URL [��������: 1]
AbstractThe objects of the article are to determine the profits for solar energy integrating remote sensing data: the optimal locations of photovoltaic and the base price of electricity resulting from solar energy. An illustrated experiment with five European countries data sets is taken. Results indicate that Germany is the only optimal region to set up photovoltaic so as to satisfy the electricity demand of the five considered. Results also show that solar energy is a promising energy source since the highest base price of electricity resulting from solar energy is only 0.35 $/kWh. The base electricity price for Germany is the lowest whereas the base electricity price for Italy is the highest. Moreover, the results further indicate that the photovoltaic module price plays a key role in determining the best appropriate region(s) to install photovoltaic and the base electricity price.]]>
[J].
[��������: 1]
[J].
[��������: 1]
[J].
DOI:10.1080/15435070902784947URL [��������: 1]
[J].
[��������: 1]
[J].
DOI:10.1016/S0960-1481(00)00169-5URL [��������: 1]
[J].
DOI:10.1016/j.renene.2017.02.008URL [��������: 1]
[J].
DOI:10.1016/S0961-9534(00)00004-0URL [��������: 1]
[J].
DOI:10.1016/j.biombioe.2013.05.004URL [��������: 1]
[J].
[��������: 1]
[J].
DOI:10.1016/j.renene.2014.01.044URL [��������: 1]
[J].
[��������: 1]
[J].
[��������: 1]
[J].
[��������: 1]
[J].
[��������: 1]
[J].
[��������: 1]
[J].
[��������: 1]
[J].
DOI:10.11820/dlkxjz.2010.09.004URL [��������: 1]
����Դ�ḻ�ȡ��ȶ��Ⱥͱ��϶�3�����棬�ֱ�ѡȡ�˽��д����Ե�̫���ܷ��䡢����ʱ������Ч��������3���������ӣ����ö�ָ�����ַ����й�½��̫������Դ����DZ���������ۺ����ۺͷ������������:���й���ظ�ԭ����һ������½�����������������������̫������Դ��Ϊ�ḻ�������ڽ��д��ģ��翪��;����һ���в����½����ຣ�������ϲ������ɹ��ж����������������ӱ������ı������Ĵ�������̫������Դ�ȽϷḻ��Ҳ���ڹ�ģ����̫���ܷ���;�۶��������ͱ���������ƽԭ���������ϸ�ԭ����ظ�ԭ����Ե�����ϴ����ݰ뵺�ͺ��ϵ����Լ��½�������̫���ܿ�С��ģ���Կ�������;���������̫������Դ�Ƚ�ƶ������ģ�Կ���DZ���͡�
[J].
DOI:10.11820/dlkxjz.2010.09.004URL [��������: 1]
With rapid population growing and dramatic industrial economy developing, the world faces the dual challenges of massive energy requirements and environmental issuescaused by extensive fossil fuel depletion. One of the main candidates for faxing these challenges are renewable sources of energy (including solar, wind, biomass, geothermal, hydro��wave and tidal energies). Among these sources, solar energy comes at the top of the list due to its abundance, and more even distribution in nature than any other renewable energy types. However, analyses of China's solar energy potential so far have generally relied onclimatological empirical formula which is hard to spread and undeveloped drawing technique. Therefore, based on general solar radiation observations taken from 99 China's radiation stations and sunshine duration observations taken from 387 of China's 752 meteorological stations, this textcpunted average annual solar total radiation as the factor of abundance, sunshine duration as the factor of stabilization and available sunshine days(≥3 hours) as the factor of guarantee from the years 1995-2004. Using ArcGIS cartography software and the aforementioned data, the following text depicted a series of maps of mainland China's solar energy distribution. Then these maps were overlaid to present a more accurate picture of mainland China's solar energy potential. An analysis of these maps leads to the following conclusions. The greatest solar energy potential is in the Qingzang Plateau, Northern Gansu, Eastern Xinjiang and Mid-Western Inner Mongolia, where are the best locations for extensive solar energy utilization; solar energy potential in Xinjiang, Eastern Inner Mongolia, western part of Northeast Plain, Northern Hebei and Ningxia, Southeast Qinghai and Western Sichuan, is the second best, also perfect for solar energy development. In the areas of the northeast part of Northeast Plain, most parts of Loess Plateau, Yunnan and Hainan, Northern Huabei Plain, and Northern Xinjiang, solar energy potential is at average level. The other areas of mainland China have small solar energy potentials due to the lack of solar radiation.
[J].
URL [��������: 1]
�������÷Dz���ͳ�Ƽ��鷽����Mann��Kendall���������˻ƺ�����77������վ1958�ꡫ2001������ʱ�����еij��ڱ仯���ƣ����ò������鷨���������������֤������������ƺ�����1958�ꡫ2001����ꡢ����������ʱ�����о����´���һ�����½����ƣ���������ѡ77��վ����53�����ֳ��½����ƣ�ֻ��24�����ֳ�һ�����������ƣ��������壨�ܾ�����裩��34��վ���У�28��վ����ֳ��½����ƣ�6����ʾ���������ơ�Ϊ�˽�һ����������ʱ�����ڱ仯���Ƶ�ʱ�շֲ��ص㣬�����о����������ص㣬���ƺ������Ϊ5��������������������,��͢������ʱ������ֳ������Ե��½����ƣ�����һ��������������͢����ֲ������ԡ���һ���˵���ڹ�ȥ��40�굽50���ڼ䣬�ƺ����������ʱ�������ϳ��½����ƣ���һ�����ڻƺ����������ε����������ԡ��ڴ˻����ϣ�ѡ��1�¡�4�¡�7�º�10����Ϊһ���ļ��Ĵ���ʱ�Σ�������ʱ����ʱ��ֲ��ص�����˷�����������������������ʱ���½����ƹ��������·���1�¡�6�¡�10�º�12�£�����ʱ���ij��ڱ仯���Ƽȴ���һ����ʱ����죬Ҳ������һ���ĵ������졣
[J].
URL [��������: 1]
The Mann��Kendall statistic test is a rank��based non��parametric method, which has been widely used to detect trends in hydro��meteorological time series such as streamflow, temperature, precipitation and sunlight radiation hours, etc. Sunlight radiation duration is one of the portant climatic factors. The possible trend of annual and monthly sunlight radiation duration in the Yellow River basin was detected by using the ann��Kendall test in this paper. The data used in this study were observed at 77 meteorological stations in the Yellow River basin. The Mann��Kendall test was applied to annual and monthly time series from 1958 to 2001. At the same time, a parametric test was also applied to make the trend analysis. The results shown that there is an obvious downward trend in the annual and monthly sunlight radiation durations in the subregion of ��,��, and ��, but subregion of �� and �� did not exhibit significant long��term trend. The results from 53 stations shown a decreasing trend and only 24 stations exhibited an increasing trend. 34 stations rejected the hypothesis, among which 28 stations shown significant decreasing trend, and only 6 stations shown significant increasing trend. In other words, most area of the middle�� and downstream of the Yellow River basin exhibited downward trend of sunlight radiation duration, but the upstream did not show obvious long��term trend. This demonstrated that decrea sing trend dominated the long��term trend of the sunlight radiation duration in the study area during the past fifty years. On the basis of above analysis, January, April, July, and October were selected as typical months to represent four seasons of the year, and the corresponding long��term trend for these representative months were further investigated. The results shown that in January, June, October and December there is a greater long��term trend and a greater contribution made by annual sunlight radiation duration. The temporal and spatial distribution of the long��term trend for the sunlight radiation duration in the study area shows that there is a difference for the trend of sunlight radiation duration over different area during different periods in the Yellow River basin from 1958 to 2001.
[J].
[��������: 1]
[J].
[��������: 1]
[J].
[��������: 1]
[J].
[��������: 1]
[J].
[��������: 1]
[J].
[��������: 1]
[J].
[��������: 1]
[J].
[��������: 1]
[J].
[��������: 1]
[J].
[��������: 1]
[J].
[��������: 1]
[J].
[��������: 1]
[J].
[��������: 1]
[J].
[��������: 1]
[J].
URL [��������: 1]
���Ĵӷ�����Դ�ķḻ�ȡ��ȶ��ȡ����Ļ����Է�����Դ�������˶Ⱥ���Ȼ�������˶ȵ��ĸ����棬�ֱ�ѡȡ�˽��д����Ե���Ч�����ܶȡ����ܿ���ʱ�����˿��ܶȡ�ɭ�����ն���������ָ�꣬�����ۺ�ָ�������ҹ�½��10m�߶ȷ�����Դ����DZ���������ۺ����ۺͷ�����������������ɹ��в����������������ȡ���ظ�ԭ�б���������ƽԭ�ϲ���ɽ�����ɶ��뵺���Լ����ա��㽭�������ͺ��ϵ��غ��ش���������Դ��Խ��������������С���Ƿ��ܹ�ģ����DZ����ߵĵ���;���ɹ����ֹ��ո�ԭ�����ױ�����ԭ���½�����������������������������ƽԭ���ӱ������Ͷ����غ�(�������DZ������)Ϊ�θ�DZ����;���˰��롢ɽ�������������ϱ��������մ������в����½������Ͷ��ϲ������������������϶������м�����DZ����;���������������Դƶ�����������ƴ��ܿ���DZ���ϵ͡�
[J].
URL [��������: 1]
With rapid population growing and industrial economy development, the world facesdual challenges of massive energy requirement and environmental issues caused by extensive fossilfuel depletion. One of possible measures for addressing such issues is exploitation and utilizationof renewable sources of energy, e.g., solar, wind, biomass, geothermal, combustible ice and oceantidal energy. Compared to other renewable energy, development of wind power has become apriority all over the globe today due to its mature technology, relatively low cost and fewenvironmental problems. However, analyses of China��s wind power potential have rarelyconsidered social or physical factors limiting actual wind utilization. Based on wind speedobservations (10 meters above the surface) taken from 387 of China's 752 meteorological stations,and using the American Renewable Resources Laboratory wind energy evaluation methods, theauthors analyzed in detail meteorological observations of mean annual wind power density (as thefactor of abundance) and mean available time of wind utilization (as the factor of stabilization)from 1995-2004. In the meanwhile, we took the population density and forest canopy density as thesocial and physical limiting environmental factors of wind power potential. Using ArcGIStechniques and the aforementioned data, the authors made a series of maps of wind power density,available time of wind utilization, population density and forest canopy density distribution inmainland China. Furthermore, overlapping analysis was performed to derive more reasonablespatial representation of wind power potential over mainland China. It was concluded that thegreatest potential is in roughly the mid-western Inner Mongolia, Hexi Corridor, northwesternQinghai, Shandong and Liaodong Peninsula, foreland of Fujian, Zhejiang, Jiangsu and Hainan, andpart of the Northeast Plain, which have great wind power with few limitations. The Xilinguole andHulunbeier Plateau in Inner Mongolia, Northeast Plain, eastern and northwest Xinjiang show thesecond largest wind power potential. Areas with great natural wind power but whose wind potentialis significantly constrained by large population densities are along the Pacific coast (except thegreatest potential areas) and northwestern Shandong. The range of Daxingan and Xiaoxingan innortheastern China are limited most by forested land. The wind power potential in northern Henan,most part of Jiangsu, center Anhui, northern and southeast Xinjiang, western Tibet, and easternYunnan either limited by poor wind resources or environmental factors is at an average level. Theother areas of mainland China have small potential to exploit wind power energy.
[J].
[��������: 1]
[J].
[��������: 1]
[J].
[��������: 1]
[J].
[��������: 1]
[J].
[��������: 1]
[J].
[��������: 1]
[J].
[��������: 1]
[J].
[��������: 1]
[J].
[��������: 1]
[J].
[��������: 1]
[J].
[��������: 1]
[J].
[��������: 1]
[J].
[��������: 1]
[J].
[��������: 1]
[J].
[��������: 1]
[J].
[��������: 1]
[J].
[��������: 1]
[J].
[��������: 1]
[J].
[��������: 1]
[J].
[��������: 1]
[J].
[��������: 1]
[J].
DOI:10.1108/IJCCSM-03-2018-0024URLPMID:33408756 [��������: 1]
Purpose: Productivity and production risks affect the use of agricultural production practices and inputs, particularly in developing countries. This paper aims to investigate the effects of adopting drought-tolerant maize varieties (DTMVs) on farm productivity, yield variance and downside risk exposure of maize growing households of Zambia. Design/methodology/approach: The study uses household survey data collected from 11 maize producing districts of Eastern, Southern and Copperbelt provinces of Zambia using a structured questionnaire. The Antle's flexible moment-based approach was used in specifying, estimating and testing a stochastic production function. The study further applied an endogenous switching regression model to control for both observable and unobservable sources of bias. Findings: The study revealed that DTMV adoption increases maize yield by 15 per cent and reduces the risk of crop failure: reducing yield variance by 38 per cent and exposure to downside risk by 36 per cent. Originality/value: This study establishes the benefits of DTMV adoption in Zambia with regards to productivity, yield stability and downside risk in the face of climate change. Results from this study underscore the need for more concerted efforts to scale-out DTMVs for both maize productivity enhancement and for risk mitigation against weather shocks.
[J].
DOI:10.1016/j.jclepro.2017.05.123URL [��������: 2]
[J].
DOI:10.1016/j.renene.2005.08.034URLPMID:32288364 [��������: 1]
Water is in short supply with countries vying for access to river heads. Hong Kong (HK) is no different. It relies on supply from Mainland China with other cities rivalling access. Yet there is still no great impetus for water conservation. This paper reports on progress in setting up a pilot biological wastewater treatment plant and a PV-powered UV-LED disinfection system plus a feasibility study carried out in conjunction with a local developer investigating the application of the treated water for irrigation. The objective is to incorporate the systems within a small-scale community for its contribution to water and energy conservation as well as establish the parameters for replication in other countries with potential up-scaling for urban application.
[J].
DOI:10.1016/j.jclepro.2017.01.034URL [��������: 1]
[J].
DOI:10.1029/2019MS001689URLPMID:32999700 [��������: 1]
In the atmosphere, microphysics refers to the microscale processes that affect cloud and precipitation particles and is a key linkage among the various components of Earth's atmospheric water and energy cycles. The representation of microphysical processes in models continues to pose a major challenge leading to uncertainty in numerical weather forecasts and climate simulations. In this paper, the problem of treating microphysics in models is divided into two parts: (i) how to represent the population of cloud and precipitation particles, given the impossibility of simulating all particles individually within a cloud, and (ii) uncertainties in the microphysical process rates owing to fundamental gaps in knowledge of cloud physics. The recently developed Lagrangian particle-based method is advocated as a way to address several conceptual and practical challenges of representing particle populations using traditional bulk and bin microphysics parameterization schemes. For addressing critical gaps in cloud physics knowledge, sustained investment for observational advances from laboratory experiments, new probe development, and next-generation instruments in space is needed. Greater emphasis on laboratory work, which has apparently declined over the past several decades relative to other areas of cloud physics research, is argued to be an essential ingredient for improving process-level understanding. More systematic use of natural cloud and precipitation observations to constrain microphysics schemes is also advocated. Because it is generally difficult to quantify individual microphysical process rates from these observations directly, this presents an inverse problem that can be viewed from the standpoint of Bayesian statistics. Following this idea, a probabilistic framework is proposed that combines elements from statistical and physical modeling. Besides providing rigorous constraint of schemes, there is an added benefit of quantifying uncertainty systematically. Finally, a broader hierarchical approach is proposed to accelerate improvements in microphysics schemes, leveraging the advances described in this paper related to process modeling (using Lagrangian particle-based schemes), laboratory experimentation, cloud and precipitation observations, and statistical methods.
[��������: 1]
[��������: 1]
[DB/OL]. (
URL [��������: 1]
[DB/OL]. (
URL [��������: 1]
[J].
DOI:10.1007/s00376-014-3190-8URL [��������: 1]
The proposed approach is applied to observations collected at approximately 700 stations over mainland China. The generated forcing fields are compared with the corresponding components of the National Centers for Environmental Prediction (NCEP) Climate Forecast System Reanalysis dataset and the Princeton meteorological forcing dataset. The comparison shows that, both within the station network and within the resolutions of the two gridded datasets, the interpolation errors of the proposed approach are markedly smaller than the two gridded datasets.]]>
[J].
DOI:10.1016/j.jhydrol.2013.11.022URL [��������: 2]
[DB/OL]. (2018-12) [
URL [��������: 1]
[DB/OL]. (2018-12) [
URL [��������: 1]
[DB/OL]. (
URL [��������: 1]
[DB/OL]. (
URL [��������: 1]
[J].
[��������: 1]
[J].
[��������: 1]
[DB/OL]. (
URL [��������: 1]
[DB/OL]. (
URL [��������: 1]
[DB/OL]. (
URL [��������: 1]
[DB/OL]. (
URL [��������: 1]
[J].
DOI:10.1175/JHM-D-14-0079.1URL [��������: 1]
[EB/OL]. (
URL [��������: 1]
[EB/OL]. (
URL [��������: 1]
[EB/OL]. (
URL [��������: 1]
[EB/OL]. (
URL [��������: 1]
[J].
DOI:10.1115/1.3266201URL [��������: 1]
[J].
[��������: 1]
[J].
[��������: 1]
[J].
[��������: 1]
[J].
[��������: 1]
[J].
[��������: 1]
[J].
[��������: 1]
[J].
[��������: 1]
[J].
[��������: 1]
[J].
DOI:10.11820/dlkxjz.2010.09.004URL [��������: 1]
����Դ�ḻ�ȡ��ȶ��Ⱥͱ��϶�3�����棬�ֱ�ѡȡ�˽��д����Ե�̫���ܷ��䡢����ʱ������Ч��������3���������ӣ����ö�ָ�����ַ����й�½��̫������Դ����DZ���������ۺ����ۺͷ������������:���й���ظ�ԭ����һ������½�����������������������̫������Դ��Ϊ�ḻ�������ڽ��д��ģ��翪��;����һ���в����½����ຣ�������ϲ������ɹ��ж����������������ӱ������ı������Ĵ�������̫������Դ�ȽϷḻ��Ҳ���ڹ�ģ����̫���ܷ���;�۶��������ͱ���������ƽԭ���������ϸ�ԭ����ظ�ԭ����Ե�����ϴ����ݰ뵺�ͺ��ϵ����Լ��½�������̫���ܿ�С��ģ���Կ�������;���������̫������Դ�Ƚ�ƶ������ģ�Կ���DZ���͡�
[J].
DOI:10.11820/dlkxjz.2010.09.004URL [��������: 1]
With rapid population growing and dramatic industrial economy developing, the world faces the dual challenges of massive energy requirements and environmental issuescaused by extensive fossil fuel depletion. One of the main candidates for faxing these challenges are renewable sources of energy (including solar, wind, biomass, geothermal, hydro��wave and tidal energies). Among these sources, solar energy comes at the top of the list due to its abundance, and more even distribution in nature than any other renewable energy types. However, analyses of China's solar energy potential so far have generally relied onclimatological empirical formula which is hard to spread and undeveloped drawing technique. Therefore, based on general solar radiation observations taken from 99 China's radiation stations and sunshine duration observations taken from 387 of China's 752 meteorological stations, this textcpunted average annual solar total radiation as the factor of abundance, sunshine duration as the factor of stabilization and available sunshine days(≥3 hours) as the factor of guarantee from the years 1995-2004. Using ArcGIS cartography software and the aforementioned data, the following text depicted a series of maps of mainland China's solar energy distribution. Then these maps were overlaid to present a more accurate picture of mainland China's solar energy potential. An analysis of these maps leads to the following conclusions. The greatest solar energy potential is in the Qingzang Plateau, Northern Gansu, Eastern Xinjiang and Mid-Western Inner Mongolia, where are the best locations for extensive solar energy utilization; solar energy potential in Xinjiang, Eastern Inner Mongolia, western part of Northeast Plain, Northern Hebei and Ningxia, Southeast Qinghai and Western Sichuan, is the second best, also perfect for solar energy development. In the areas of the northeast part of Northeast Plain, most parts of Loess Plateau, Yunnan and Hainan, Northern Huabei Plain, and Northern Xinjiang, solar energy potential is at average level. The other areas of mainland China have small solar energy potentials due to the lack of solar radiation.
[J].
URL [��������: 1]
����ģ��20���ͽ��ز���ٱ仯Ч���Ϻõ�3��ȫ������ģʽ��3����������ģʽԤ����21�����й�������ز�繦���ܶȱ仯���õ����½��ۣ�����������ģʽCMM5Ԥ��21���ͳ����й��ļ�ƽ���繦���ܶȱ�20����С����ȫ������ģʽԤ��21���������й���Ͷ�����ƽ���繦���ܶ���С��20���ͣ��İ���繦���ܶȱ仯�������Էֱ棻����������ģʽ��RegCM3��PRECIS����ȫ������ģʽһ��Ԥ��21���ͺ����й���Ͷ�����ƽ���繦���ܶȱ�20����С���ҿ��ŶȽϴ����İ��꣬ȫ������ģʽԤ����������������ģʽԤ�����۲�һ�£���ȷ���Խϴ����ڵ�ǰ��ѧˮƽ�����ƣ�������ȫ������ģʽ������������ģʽ��������߶�δ������仯��Ԥ���������Žϴ�IJ�ȷ���ԣ��������ڷ��ٺͷ繦���ܶȵ�Ԥ�����棬�Ÿոտ�ʼ������Ҫ�������ͳ�ʱ����о����飬���ܵõ����ɿ��Ľ��ۡ�
[J].
URL [��������: 1]
th century, with the rapid growth of the world economy, energy demand has multiplied and energy industries have been in the process of massive development of wind resources. Wind energy, with the characteristics of being clean, renewable and abundant, can offer pollution-free electricity that could be widely utilized. Wind power projects in China, particularly the wind power generation network are recently experiencing a rapid development. It is expected that the wind power capacity will increase to over 100,000 MW installed capacity by 2030 or 2040, and become the third largest source of energy in the country after thermal power and hydropower. As China��s wind power industries are developing unprecedentedly, the issue on sustainable use of wind energy resources has been a major focus in the context of global and Asia warming. There have been a series of studies on future characteristics of the surface wind and wind resources over the ocean and some other countries but little work has been done in China so far. Therefore, there is an urgent need to investigate characteristics of future wind energy in China. In the present work, three global climate models and three regional climate models which have certain capabilities to simulate changes in wind speed during the 20th century, were used to project changes in wind power density in China for the 21th century. The following conclusions are given. First, the summer mean wind power density in China for the early 21th century decreases slightly, which was projected by the regional climate model CMM5. Second, changes in annual and winter mean wind power density in China for the mid-21th century were projected to be decreasing slightly than that for the 20th century. It was also found that trends in summer mean wind power density for the mid-21th century was difficult to be detected by the models. Third, regional climate models (RegCM3 and PRECIS) and global climate models generated similar results, showing that the annual and winter mean wind power density in China for the late 21th century would decrease slightly and the results were more reliable than that for summer. It is worthwhile to note that due to current limitations in projection capability, both the global climate models and the regional climate models would result in large uncertainties in projections of regional climate changes, particularly in the projection of wind power density. The study on variation trends in wind velocity for the 21st century in China provides meaningful information and reference for further studies.]]>
[J].
[��������: 1]
[J].
[��������: 1]
[J].
URL [��������: 1]
����ո���ũ��������ϵͳ��һ����Ҫ����������Դ���й��������Ͻո���Դ��Ϊ�ḻ�Ĺ���֮һ��������ϸ�������й�ũ����ոѵ���Դ���ͷֲ�������������Ϊ��ҵ��ֽԭ�ϡ��������ϡ���ʻ����Լ�ũ��������Դ��������״�ͽո��ۺ������¼�����
[J].
URL [��������: 1]
Straw is an important biological resource in agriculture, and China is one of the most abundant countries for straw production in the world. This paper introduces the output and distribution of straw in China and discusses its utilization as the raw material in industry, livestock forage in animal husbandry, fertilizer and energy on farms and households in rural areas. This paper also indicates that great progress was made in integrated utilization based on a number of new technologies, marketing, and support from the Chinese government.
[J].
URL [��������: 1]
���Ĵ���Դ�ĽǶȣ����ݸ�����ոѵľ���ϵ�������ҹ�����ũ����ո�����ȫ��Ĺ��㣬�������ҹ�����ո���Դ�ķ�չ���ƺͷֲ��ص㡣�о����������Ŀǰ�ҹ��ո���Դ�����ﵽ79454.4��104t��ˮƽ����ÿ����1251.2��104t���ٶ��Ȳ��������ҹ�����ո���Դ�ֲ����ڵ������ص㣬����ũ�����ҹ�����ո���Դ����Ҫ�ֲ��������������ӱ���ɽ�������պ��Ĵ�������ո���Դ�ļ��зֲ��������ҹ�����ո���Դ������״������Ϊ��ÿ����95%��������ո���Դͨ����ͬ������;��ת������������ʽ������ɢ����Դ�˷����ء��������ո���Դ�����д��ڵ����������һЩ���߽��顣
[J].
URL [��������: 1]
[J].
[��������: 1]
[J].
URL [��������: 1]
������ֳ�����ķ���ѳ�Ϊ�ҹ�ũ����Դ��Ⱦ����Ҫ��Դ��������ݷ����ŷ���ҲԽ��Խ�������ǵ����ӡ�ͨ����������������ֳҵ���е��飬��Ϲ������й��о���ȷ�����������ݷ�����ŷ������㷽�����ֹ����������2001��Ϊ�����������������Ҫ����(����ţ���������á����ݵ�)������ŷ����ͷ����жԻ���������Ⱦ����Ҫ������(�л��ʡ������ס���)���Ա�����������ݷ����Ⱦ��һ����������ʶ��������Ϊ������2001�����ݷ����ŷ�7421��t�������л���Ϊ806��t����42.5��t����21.48��t����44.98��t�����о������Ϊ�����й�ũҵ�������ֺͻ�����Ⱦ�����ṩ�������ݡ�
[J].
[��������: 1]
[J].
URL [��������: 1]
�����ҹ�������ֳҵ��Ѹ�ٷ�չ,���ݷ���ŷŲ������ӡ�2002��,�ҹ����ݷ���������27.5�ڶ�,���ݷ��ũ�õص�ƽ������Ϊ4.19��/����,���ݷ��ÿ����ʧ��ˮ����ܵ������ס�BOD��COD�ֱ�Ϊ87��֡�34.5��֡�600��ֺ�647��֡�������������ʾ,������ҹ���ʡũ�õ������ݷ����Ⱦ�ķ��շ�Ϊ4��;�Ϻ�����Ⱦ�ķ��յȼ����,����Ǻ��ϡ�����ɽ��,���������ա��ӱ������պͺ����ٴ�֮,����22��ʡ��ũ�õ�����Ⱦ�ķ�����Խ�С����ǿ���ݷ��Ĺ�������Դ�������ǽ�����ݷ����Ⱦ����Ҫ�ֶΡ�
[J].
[��������: 1]
[J].
[��������: 1]
[J].
[��������: 1]
[J].
[��������: 1]
[��������: 2]
[��������: 1]
[��������: 1]
[J].
DOI:10.11849/zrzyxb.2007.01.002URL [��������: 2]
8t,��Ҫ�ֲ��ں��ϡ�ɽ���������������֡��Ĵ���ʡ;���39.26×108t,��Ҫ�ֲ��ں��ϡ�ɽ�����Ĵ����ӱ������ϵ�ʡ;��ľ������21.75×108t,��Ҫ�ֲ������ء��Ĵ������ϡ������������ɹŵ�ʡ��;��������1.55×10⁸t,��Ҫ�ֲ��ڹ㶫��ɽ���������������������յ�ʡ;��ˮ482.4×10⁸t,��Ҫ�ֲ��ڹ㶫�����ա��㽭��ɽ�������ϵ�ʡ;��2004���й���������ʵ�����̲�DZ��Ϊ35.11×10⁸tce,ǰ��λ����Ϊ�Ĵ������ϡ������������Ϻ����ɹ�;�������ۿɻ����Ϊ4.6×10⁸tce,ǰ��λΪ�Ĵ��������������ϡ����غ����ɹš��ɻ�����нոѡ�н��������ռ�����ֱ��38.9%��36.0%��22.14%;���й��������ֲܷ�����,ʡ�ʲ���ϴ�ũ���˿ڼ���,�˾����ۿɻ��������������������������14.17tce,��С���㽭ʡ��0.15tce�������������̲�DZ���ֲ���һ���̶����볣��һ����Դ�̲�DZ���ֲ����ֻ���״̬,�����ͻ������һ����Դ�̲����ϵ͵ĵ������������������ܵľ�DZ����]]>
[J].
DOI:10.11849/zrzyxb.2007.01.002URL [��������: 2]
8t,distributed mainly in Henan,Shandong, Heilongjiang,Jilin and Sichuan provincesXdung39.26×108t,distributed mainly in Henan,Shandong, Sichuan,Hebei and Hunan provincesXforest and wood biomass 21.75×10⁸t,distributed mainly in T ibet,Sichuan,Yunnan,Heilongjiang and Inner Mongolia provincesXcity rubbish1.55×108t,distributed mainly in Guangdong,Shandong,Heilongjiang,Hubei and Jiangsu provincesXwastewater482.4×108t, distributed mainly in Guangdong,Jiangsu,Zhejiang,Shandong and Henan provinces.(2)The potential quantity of all the biomass energy in China in 2004 is 35.11×10⁸tce,and the acquirable quantity is 4.6×10⁸tce with the top five provinces of Sichuan,Heilongjiang,Yunan,Tibet and Inner Mongolia.The respective proportion of crop residues,firwood and dung in the acquirable quantity is 38.9%,36.0% and 22.14%,respectively.(3)Biomass energy distribution varies from province to province in China.If computed by the rural population,the biomass energy density varies from the biggest 14.17tce per capita in Tibet Autonomous Region to the smallest 0.15tce per capita in Zhejiang province.And the relation between biomass energy proportion and primary energy proportion of each province in China shows great potential to explore biomass energy especially in the region where there is a shortage of primary energy.]]>
[EB/OL]. (
URL [��������: 2]
[EB/OL]. (
URL [��������: 2]
[EB/OL]. (
URL [��������: 1]
[EB/OL]. (
URL [��������: 1]
[��������: 1]
[EB/OL]. (
URL [��������: 1]
[C].
[��������: 1]
[C].
[��������: 1]
[J].
[��������: 1]
[J].
[��������: 1]
[J].
[��������: 1]
[J].
[��������: 1]
[J].
URL [��������: 1]
�й�������ڶ������������ŷŹ�,��ȫ�����֤������(CERs)һ���г������Ӧ��,����̼��������ȴ��������̼���ײ�ҵ������Ͷ�,ֻ��̼�����г��IJμ���,̼�����г������ִ����.�й�Ϊȫ��̼�����г�����ľ����������������Եͼ۹����,��װ�������ɼ۸���ߵĽ��ڲ�Ʒ�ڹ�����н���.��Ϊ�����������ŷ�Ȩ��Ӧ��֮һ,�й�û��һ����ŷ�������Ĺ���̼�����г�,����������̼���Ķ���Ȩ.���ľ�������˹�����Ҫ��̼�����г��Ľ������塢�������͡���������������ȷ�չ״��,ͨ���������ɳ��ֽι���̼�����г����ص�,���Դ�Ϊ����������̼�����г�����̼�����г����бȽϵó��й�̼�����г��ֽδ��ڵ�ȱ��,��Ӧ������������й�̼�����г�����ʾ,������̼�����г����ƶȽ���,����̼������ϵ,��ǿ��CDM��Ŀ�������о�,�������ڻ�������̼����������,ͳһ����̼�ŷű�.
[J].
[��������: 1]
[EB/OL]. (
URL [��������: 1]
[EB/OL]. (
URL [��������: 1]
[EB/OL]. (
URL [��������: 1]
[EB/OL]. (
URL [��������: 1]
