 ,1, 谢苗苗,1,2, 刘琦1, 李汉廷1, 郭强1, 李新宇3
Spatial variability of causative factors of heat islands from the perspective of metropolitan functional blocks
WU Rongrong,1, XIE Miaomiao,1,2, LIU Qi1, LI Hanting1, GUO Qiang1, LI Xinyu3通讯作者:
收稿日期:2019-10-16修回日期:2020-01-3网络出版日期:2020-12-25
| 基金资助: |
Received:2019-10-16Revised:2020-01-3Online:2020-12-25
作者简介 About authors
武蓉蓉,女,山西临汾人,硕士研究生,主要从事综合景观生态与土地利用研究。E-mail:

摘要
关键词:
Abstract
Keywords:
PDF (10380KB)元数据多维度评价相关文章导出EndNote|Ris|Bibtex收藏本文
本文引用格式
武蓉蓉, 谢苗苗, 刘琦, 李汉廷, 郭强, 李新宇. 大都市功能区块视角下的热岛影响因素空间分异. 资源科学[J], 2020, 42(12): 2463-2474 doi:10.18402/resci.2020.12.16
WU Rongrong, XIE Miaomiao, LIU Qi, LI Hanting, GUO Qiang, LI Xinyu.
1 引言
城市区域内不同尺度下要素之间的联动作用显著,且相互依存组成了复杂的系统,在大数据和新技术的支撑下,进一步理解复杂系统内部不同区域要素的综合作用规律尤为重要[1]。作为城市地域人地耦合系统中典型的生态环境问题之一,热岛效应加剧了空气污染和能源消耗,威胁居民健康[2,3,4],也影响了城市的可持续健康发展,其影响因素和驱动机制研究成为城市地域内各地理要素联动作用的研究热点与前沿[5]。现阶段城市热岛驱动机制研究达到一定共识,多数研究表明地表组分构成与配置、城市发展与规模是影响城市热岛效应的关键因素[6,7,8]。从研究方法上看,一方面,侧重于采用线性回归模型构建地表温度与生物物理参数、社会经济因子的定量关系[9,10,11,12,13],主要集中于全局线性回归模型,是针对于研究区整体水平的拟合,较少关注不同区域热环境因子作用的空间异质性[14];另一方面,忽略了因子作用的非线性动力学机制,缺乏多种因子交互作用的综合研究[15,16]。虽然有****试图运用新方法进行研究,例如王佳等[17]为研究不同空间位置因子作用的变化,采用地理加权回归模型研究京津唐城市群土地覆盖与地表温度的关系,得出太行山林区的降温能力优于东南平原地区林地。但总体上,缺乏对城市系统内部热环境因子作用空间分异的分析,影响了城市内部不同区域热岛效应缓解策略实施的针对性。
合理划分城市内部的不同区域成为研究热岛效应影响因素空间分异的关键,诸如土地覆被类型[18]、街区[19]、行政界线[20]等传统研究单元依照自然或人文要素划分难以刻画城市内部的实体特征。而已有研究表明城市热岛效应主要受人类活动影响[21,22,23],不同人类活动强度和类型导致景观与社会经济组分驱动热岛效应贡献率存在空间差异。大数据的发展,为城市内部分区划分提供了新思路,兴趣点(Point of Interest,POI)数据量大、覆盖面广,具有地理实体的空间位置和属性信息,能够较为准确、细致地刻画人类社会经济活动[24,25]。可采用POI数据确定用地功能区块以区分城市景观和社会经济格局的空间异质性。
热岛影响因子作用的非线性动力学机制和多因子交互作用研究是深入理解城市区域生态环境效应影响机理的关键,采用传统统计方法难以获得,地理探测器模型作为衡量地理现象空间分异性及其驱动力的有力工具,解决了传统统计学方法重线性关系、轻非线性关系,重单因子影响、轻多因子联动影响的缺陷,可以在没有线性假设的前提下探测其影响程度及方式[26],被广泛应用于自然、社会等领域[27,28,29],并开始在城市热岛影响因素研究中有所应用[16]。本文引入地理探测器研究各功能区块内部因子作用的空间规律,更有助于理解不同人类活动强度下区域内生态环境影响因素作用的空间分异。
本文以大都市区北京市为例,以POI数据为基础,划分承载不同人类活动的用地功能区块,通过地理探测器探究不同尺度下(市域整体和用地功能区块)植被、水体、不透水面和社会经济要素等多维因素的单因子作用、多因子交互作用以及识别高温风险区,以期得到不同用地功能区块各因子作用方式及程度,深入研究热岛综合驱动因素,为城市规划以及缓解城市热风险提供科学借鉴。
2 研究区概况
北京位于华北平原北部,地处东经115.7°—117.4°,北纬39.4°—41.6°,总面积约为16410.5 km2,是全国的政治、文化中心。21世纪以来,北京市不仅在政治、经济、文化上飞速发展,人口和城市扩张也处于前列[30],截至2018年,北京市城镇化水平达到86.5%,在全国处于高位。作为典型的大都市之一,高度聚集的城市化及不透水面的极速扩张侵占了大量林地、耕地,人类活动极度频繁导致北京市城市生态环境形势日益严峻,出现典型的热岛效应、空气污染等问题[31,32],在夏季高温天气下,热岛效应的出现影响了城市居民的热舒适度[33]。选取北京市作为研究区,既能通过划分功能区块描述复杂城市地域的内部差异,又可通过分析夏季典型的热岛效应厘清不同功能区生态环境效应的影响机理。3 数据处理与研究方法
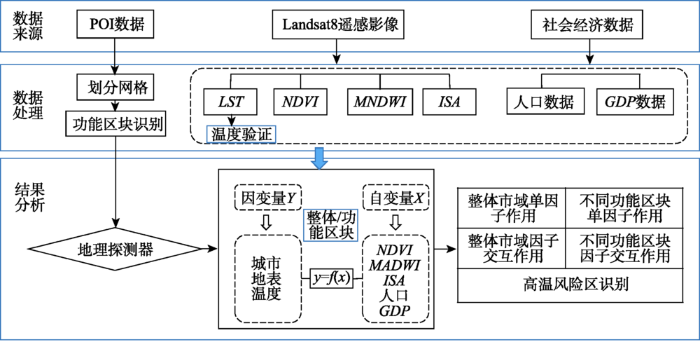
本文采用地理探测器模型来衡量不同用地功能区块因子作用的空间分异,包括基础数据处理获取地表温度及热岛影响因素的空间分布、识别城市用地功能区块、利用地理探测器进行影响因素的单因子作用、交互作用的空间异质性探测和高温风险区探测(图1)。图1
 新窗口打开|下载原图ZIP|生成PPT
图1技术路线与研究方法
Figure 1Technical roadmap and research methods
3.1 数据来源与处理
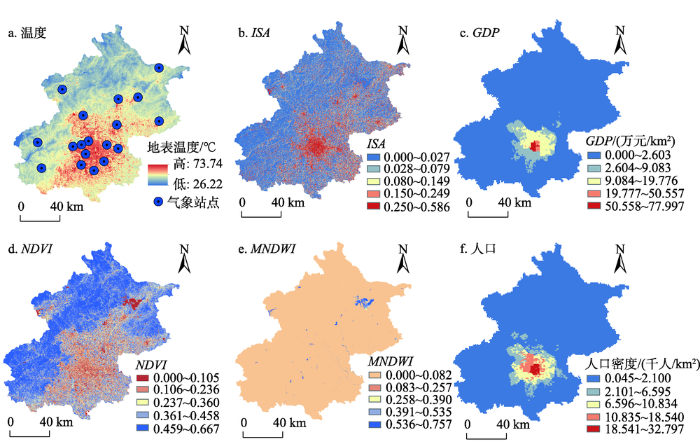
热岛效应采用Landsat8遥感影像数据反演得到的地表温度进行表征(2017年7月10日,卫星轨道行列号为123-033,123-032,过境时间约为北京时间10:53),采用单通道算法[34]反演北京市地表温度,为验证温度数据的代表性,选取2017年7月15日上午11:00北京市18个气象站点与同位置地表温度数据进行比对,结果显示反演的地表温度与气象站点的空气温度呈正相关,Pearson相关系数为0.53(R2=0.28,P<0.05),表明地表温度所呈现的空间分异能代表气温的空间分异。国内外大量研究证明地表景观变化和城市化间接产生的人为热对热岛效应具有驱动作用[8],本文参考国内外****对城市热岛影响因素的研究,结合北京市社会经济发展实际情况,选取反映地表景观变化的主要生物物理参数和表征城市化水平的社会经济因子进行分析(图2)。生物物理参数包括:表征植被覆盖状况的归一化植被指数(Normalized Difference Vegetation Index,NDVI)、表征水体覆盖状况的改进归一化差异水体指数(Modified Normalized Difference Water Index,MNDWI)以及表征不透水覆盖状况的不透水面比例(Impervious Surface Area,ISA),均以2017年7月10日Landsat 8影像为数据源,分别采用波段比值[35,36]和改进型线性光谱混合分解方法[37]进行计算;社会经济因子包括GDP[38]、人口密度[39],数据来源于中国科学院资源环境科学数据中心,均为空间化数据。为便利各因子与地表温度进行关联分析,本文将全部数据重采样至1.5 km网格单元。
图2
 新窗口打开|下载原图ZIP|生成PPT
图2基础数据
Figure 2Basic data of the research
3.2 POI划分用地功能区块
POI数据爬取自2018年6月百度地图开放平台,包括住宅、购物服务、科教文化、工厂等15大类。按照城市用地分类与规划建设用地标准[40]将数据清洗重分类,消除各类型之间的交叉重复问题,最终分为居住、商业服务业、工业、公共管理服务、交通道路5个用地类型。所有POI数据统一到WGS-84坐标系,导入Google Earth进行随机抽样确认POI采样点无偏。由于城市单一用地功能区并不多见,而是多与其他用地功能混合分布,因此总体上分为3大类,分别为单一功能区、混合功能区、其他功能区,依据各类型比例确定其区块功能[41]。用地功能区块的确定按照各种类型POI数据的比例在1.5 km网格单元上进行判别和归并,单一功能区为网格单元内某一种类型的比例达到50%或以上,用地性质由该POI类型确定,例如公共管理服务(公管)、商业服务(商服)、交通道路(交通)等;混合功能区为网格内所有类型POI比例均小于50%,用地性质则取决于POI比例排名前两位的类型,两两混合,例如公共管理与商业服务区块混合(公-商)、公共管理与交通道路区块混合(公-交)等;其他功能区为单元网格内不包含POI数据的区域。
3.3 地理探测器原理与应用
地理探测器作为一种空间统计学方法,可以探测空间分异性及揭示其背后驱动力,其核心思想是若某自变量对其因变量有重要的影响,则两者有相似的空间分布[26,42],主要用于研究各种现象的驱动力以及各因子组合的交互作用。本文利用地理探测器的因子探测、交互作用探测和风险探测模块。(1)使用因子探测模块分析某单因子
式中:
(2)使用交互作用探测模块研究因子
Table 1
表1
表1因子交互作用类型
Table 1
| 判据 | 交互作用 |
|---|---|
| 非线性减弱 | |
| 单因子非线性减弱 | |
| 双因子增强 | |
| 独立 | |
| 非线性增强 |
新窗口打开|下载CSV
(3)利用风险探测模块分析地表热环境空间分布特征,判断各因子层间地表温度的属性均值是否具有显著性差异(置信水平95%),识别出各区块城市热环境高风险区域特性,并对识别出来的高温风险区域进行等级划分(表2)。一级风险区是各高温风险区特征因素共同作用的交集,二级风险区是各高温风险区任意特征因素(与地表温度呈正相关的人口、ISA、GDP)的交集,三级风险区是各高温风险区任意特征因素(与地表温度呈正相关的人口、ISA、GDP)的并集。
Table 2
表2
表2高温风险区等级划分
Table 2
| 风险区等级 | 划分原则 |
|---|---|
| 一级风险区 | |
| 二级风险区 | |
| 三级风险区 |
新窗口打开|下载CSV
模型在使用时自变量须为类型量,故需要对各自变量进行分级,参照Cao等[43]提出的数据离散化方法采用自然间断点法分级,分类的效果根据地理探测器的
4 结果与分析
4.1 用地功能区块识别
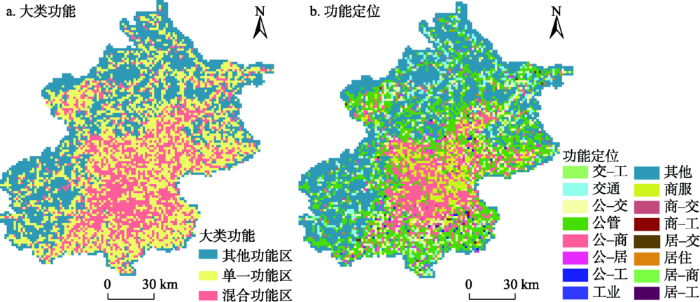
利用POI识别出5类单一功能区块、8类混合用地功能区块及其他用地功能区块(图3)。单一功能区块为某种POI类型比例达到50%及以上的区块,主要分为商服、公管、居住、工业和交通5类,其中公管和商服比例较高,各占26.62%、6.97%,零散分布在混合功能区块与其他区块之间。混合功能区块主要包括公共管理与工业区块混合(公-工)、商业与交通道路区块混合(商-交)、公共管理与居住区块混合(公-居)、交通道路与工业区块混合(交-工)、居住与交通道路区块混合(居-交)、居住与商服区块混合(居-商)、公-商、公-交8类混合区块,主要以公-商、公-交、公-居为主,分别占总区块数量的13.27%、7.94%、1.37%,多分布在市中心;其他功能区块是单元内各类POI数据均为空的区块,多分布在城市外围,大多位于山区地带,所占比例为35.89%。图3
 新窗口打开|下载原图ZIP|生成PPT
图3用地功能区块图
Figure 3Functional blocks of Beijing Municipality
4.2 单因子作用探测
4.2.1 整体水平单因子作用因子探测结果显示,从整体研究区来看,各影响因素对地表温度的影响程度(q值):NDVI(0.723)>人口(0.525)>GDP(0.520)>ISA(0.290),MNDWI未通过显著性检验。表明植被、经济水平和人口是影响整体市域城市地表温度变化的主导因子。
4.2.2 不同用地功能区块单因子作用
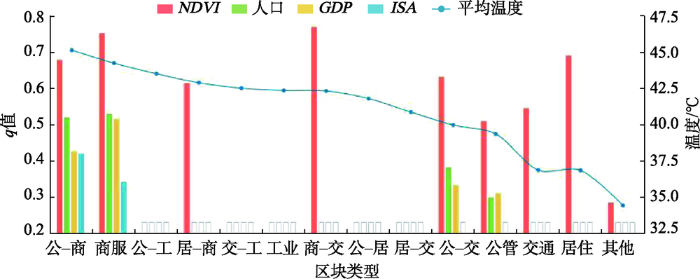
不同功能区块各因子探测结果表明各功能区块内部热岛效应的影响特性存在差异(图4)。各单因素在公-工、交-工、工业、公-居、居-交区块未通过显著性检验,说明在这些区块各指标与地表温度可能并非存在线性关联,有待进一步论证。其他区块存在典型的因子影响差异,NDVI虽是这些区块的主导影响因素,但不同区块内部NDVI作用程度不一,商-交区块的NDVI(77.2%)影响最大,其次为商服区块(75.5%)和居住区块(69.3%)。在公-商、商服、公-交、公管等人类活动较为频繁的区块,人口、GDP对地表温度的影响逐渐凸显,且各区块影响程度不一。
图4
 新窗口打开|下载原图ZIP|生成PPT
图4不同功能区块单因子解释力
注:灰色框为q值未通过显著性检验(p<0.05)。
Figure 4Explanatory power of individual factors in different functional blocks
从各用地区块温度变化来看,随着温度逐渐升高,各影响因子对其贡献程度也在变强,影响因素更为复杂,同时生物物理参数的代表(NDVI)总是比社会经济因素的代表(人口)对温度的影响程度大。
4.3 因子交互作用探测
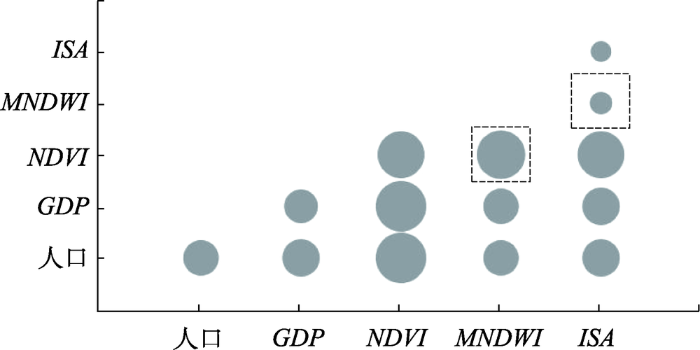
4.3.1 整体水平因子交互作用从整个研究区来看(图5),因子交互作用远比单一因子对温度的影响程度要强。NDVI和人口的交互作用是影响热岛最为主导的因子,其对温度的影响高达78.9%。NDVI和GDP(77.4%)的交互作用对温度的影响程度次之。MNDWI与NDVI、MNDWI与ISA的交互影响程度分别为74.3%、31.3%,且作用方式与其他交互作用方式不同,表现为非线性增强。
图5
 新窗口打开|下载原图ZIP|生成PPT
图5整体水平因子交互作用解释力
注:气泡大小表示其影响程度,虚线框表示非线性增强,其余均为双因子线性增强。
Figure 5Explanatory power of two interactive factors at the overall level
4.3.2 不同用地功能区块因子交互作用
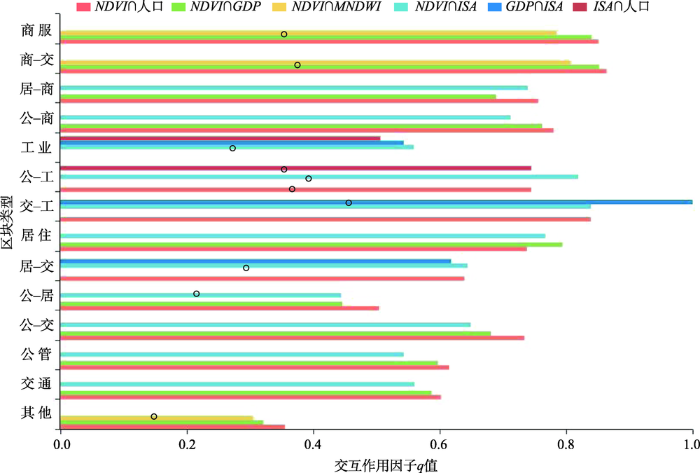
不同用地功能区块因素组合类型较多,为使研究结果更加明晰,选择了解释力度排在前三位的交互作用因子进行统计。影响因子交互作用对地表温度的解释程度远远大于单一因子的作用效果,且在各用地区块作用方式、影响因素类型、程度各异(图6)。
图6
 新窗口打开|下载原图ZIP|生成PPT
图6不同功能区块因子交互作用解释力
注: ○均表示作用方式为非线性增强,其余为双因子线性增强。
Figure 6Explanatory power of two interactive factors in different functional blocks
从作用方式上看,交互作用方式主要包括非线性增强和线性增强,50%的区块内部因子交互作用存在非线性增强现象,其中在单因子作用未通过显著性检验的区块(公-工、交-工、工业、居-交、公-居),其因子交互作用方式均存在非线性增强。
从影响因素作用类型上看,影响因素交互作用分为6大类,其中NDVI与人口、GDP、ISA分别组合影响最为广泛,对10类区块(q>0.6)的热岛效应影响均较强(图6)。其次为NDVI与MNDWI、GDP与ISA、ISA与人口的组合,NDVI与MNDWI二者交互作用主要影响了商业区块、商-交区块和其他功能区块,GDP与ISA主要影响了交-工区块、工业区块、居-交区块,而ISA与人口主要对工业区块、公-工区块有影响。
从作用程度上看:首先,在包含商服的区块(商服、商-交、居-商、公-商)与包含公管的区块(公-居、公-交、公管),因子交互作用解释力主要为NDVI叠加人口最强、NDVI叠加GDP次之。其次,在包含工业的区块(交-工、公-工、工业),ISA与GDP、NDVI交互作用突出。例如:交-工区块,GDP和ISA二者交互作用对温度的影响最高,达到了100%,可能是因为在交-工区块,工业总产值水平GDP较高,间接表征了工业耗能导致的热排放,同时周围交通发达,路网密集,二者交互作用所产生的对温度的影响远大于其他因素;在公-工区块,NDVI和ISA交互作用高达81.9%,NDVI和人口、ISA和人口作用程度相同(74.5%);工业区块中贡献率最高的三个影响因素组合均包含ISA。最后,在居住区块内部,NDVI和GDP交互作用最高(79.4%),NDVI和ISA次之(76.7%),NDVI和人口最低(73.8%);相较于居-交区块NDVI和ISA(64.4%)、NDVI和人口(63.9%)、GDP和ISA(61.8%),产生差异的原因是单一居住区主要为新型大型居住区,居住环境较好、小区绿化程度高、植被配置较合理,对比而言居-交区块是居住用地和交通道路用地混合,绿地较少、植被配置单一、斑块较为破碎、不透水面积居多。
4.4 热岛高风险区识别
风险区探测模块可分析地表温度的空间分布特征,识别出城市热岛的高风险区域(表3)。不同功能区块内部热岛高风险区域特征差异明显,在包含商服的区块与包含公管的区块其高温风险区主要为人口分布较密集、经济水平较高、植被覆盖度较低、且不透水面比例较大的区域;在包含工业的区块其高温风险区主要为人口分布较少、工业产能较低、植被覆盖水平较低的区域。Table 3
表3
表3不同功能区块高温风险区影响因素取值范围及等级组合特征
Table 3
| 区块 | 人口密度/(千人/km2) | GDP/(万元/km2) | ISA | NDVI | MNDWI |
|---|---|---|---|---|---|
| 商服 | 18.541~32.797 | 50.558~77.997 | 0.250~0.586 | 0.106~0.236 | 0.000~0.082 |
| 商-交 | 10.835~18.540 | 19.777~50.557 | 0.250~0.586 | 0.106~0.236 | — |
| 居-商 | 2.101~6.595 | 0.011~2.603 | 0.080~0.149 | 0.106~0.236 | — |
| 公-商 | 18.541~32.797 | 50.558~77.997 | 0.250~0.586 | 0.000~0.105 | — |
| 工业 | 0.045~2.100 | 0.011~2.603 | 0.000~0.027 | 0.237~0.360 | — |
| 公-工 | 6.596~10.834 | 2.604~9.083 | 0.000~0.027 | 0.106~0.236 | — |
| 交-工 | 0.045~2.100 | 0.011~2.603 | 0.000~0.027 | 0.237~0.360 | — |
| 居住 | 2.101~6.595 | 2.604~9.083 | 0.080~0.149 | 0.237~0.360 | — |
| 居-交 | 2.101~6.595 | 0.011~2.603 | 0.000~0.027 | 0.106~0.236 | — |
| 公-居 | 6.596~10.834 | 2.604~9.083 | 0.028~0.079 | 0.106~0.236 | — |
| 公-交 | 10.835~18.540 | 2.604~9.083 | 0.150~0.249 | 0.106~0.236 | 0.000~0.082 |
| 公-管 | 18.541~32.797 | 50.558~77.997 | 0.250~0.586 | 0.106~0.236 | — |
| 交通 | 2.101~6.595 | 2.604~9.083 | 0.150~0.249 | 0.106~0.236 | — |
| 其他 | 6.596~10.834 | 2.604~9.083 | 0.250~0.586 | 0.237~0.360 | 0.391~0.535 |
新窗口打开|下载CSV
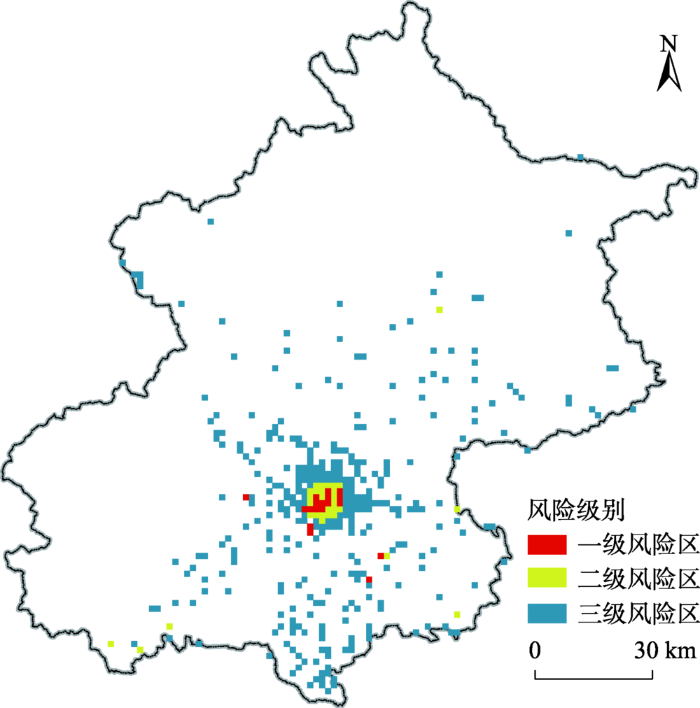
根据高温风险区等级划分原则以及各功能区块高温风险区特征,得到高温风险区块等级分布(图7)。一级风险区主要集中在东城区和西城区核心地带,大兴区、丰台区、石景山区有少量零星分布,平均温度为51.03℃。一级风险区的区块类型主要为商服区块,面积约为18 km2,占一级风险区面积的44.44%。二级风险区主要分布于东城区和西城区的非核心地带,平均温度为50.49℃。二级风险区中公-商区块面积占比最高,占比为45.83%。三级风险区包括石景山区东部、海淀区东南部、朝阳区西南部、大兴区东南部以及东北部地带等零散分布区域,平均温度为46.1℃。三级风险区内部,公-商区块面积占比最高,为23.40%。
图7
 新窗口打开|下载原图ZIP|生成PPT
图7热岛风险类型图
Figure 7Risk zoning of heat islands
5 讨论与结论
5.1 讨论
本文发现就市域尺度单因子作用而言,植被覆盖、人口是影响地表热环境的主导因子,这与已有大尺度下开展的城市热岛研究结果类似[48,49]。此外,各因子交互作用线性或非线性增加了对温度的解释力度,这也印证了城市热岛其复杂性导致影响因子往往不是单独起作用的。热岛效应缓解策略是城市适应气候变化的重要措施之一[50],缓解策略的制定往往基于研究区温度与影响因素的整体回归拟合结果,无法反映各因素由于地理位置及人类活动差异在空间上作用程度的不同,在缓解城市热岛效应上可操作性和效果均不理想[14]。本文利用不同用地功能区块进行划分,可更好地与实际规划管理相结合,单因子作用、交互作用研究可以有针对性地为不同区域热岛效应缓解提供参考。在含商区块、含公区块增加植被覆盖的同时,适当控制人口密度;含工区块减少人工下垫面扩张,探索用地高效集约利用;居住相关功能区块可以通过提高植被覆盖度、优化植被配置等措施达到更好的降温效果。此外,风险探测揭示了不同用地功能区块内热风险较大区域,在制定政策或划分热环境重点整治区时,可以有针对性地选取治理区域。
对比整体市域和不同用地功能区块分析结果发现,整体市域上的全局模型存在一定局限性,而不同用地功能区块的局部模型可以揭示不同区域因子影响在空间上的差异,全局模型会高估或低估各因素的实际作用,难以衡量由于人类活动差异而导致的区块内部因子作用分异。相对于景观异质性较强的研究区域,不同用地功能区块的局部模型更能较好地反映各因素对地表温度的影响。
本文在对地表温度各类因素探讨中,由于数据获取受限只考虑了POI点分布,未考虑POI点实体面积对功能的影响,此后可通过更多的开放数据来刻画其功能区块。同时热岛效应影响因素作用规律也存在季节性变化,在后续研究中,应进一步考虑不同时间尺度(年份、季节、昼夜)等多时项分析结果差异。
5.2 结论
本文基于POI数据划分城市用地功能区块,将其划分为单一功能区块、混合功能区块(公-商、居-交等)、其他功能区块,使用地理探测器方法探究主导影响因子及因子交互类型、作用程度及方式,并识别出城市热风险区域。基于整体市域水平的全局模型分析存在一定局限性,会高估或低估各因子在不同空间位置的作用,基于各用地功能区块的影响因素分析能较好地解释地表温度的空间分异,主要结论如下:(1)单因子作用结果表明,在城市整体水平和各功能区块上,植被是影响温度分异最大因子,但各区块内部植被作用程度差异明显。随着各区块地表温度的升高,植被对温度的影响增加;且在人类活动较为频繁的区块,人口、GDP的作用逐渐凸显。
(2)因子交互作用结果表明,热岛效应影响因素间的交互作用远大于单一因子的影响,并且在不同的用地区块因子的作用程度及方式各异。50%的区块内部因子交互作用存在非线性增强情况,在含商、含公区块主要是植被与人口交互作用,在含工区块不透水面积与GDP、植被因子交互作用突出。用地功能区块的划分较好地区分了区域内部景观和社会经济格局的空间异质性,可以更好地刻画各因子在不同区域对地表温度的实际影响程度。
(3)风险探测表明了各功能区块内城市热岛的高风险区域特征,明确了不同功能区块高温风险的重点治理区域。一级风险区主要分布在东城区和西城区的商服区块,在所有风险区中热风险最高。二级风险区主要为东城、西城区非核心地带的公-商区块,三级风险区主要为东城、西城区以外其他区的公-商区块。
参考文献 原文顺序
文献年度倒序
文中引用次数倒序
被引期刊影响因子
[J].
[本文引用: 1]
[J].
[本文引用: 1]
[J].
DOI:10.1016/S0038-092X(00)00089-XURL [本文引用: 1]
[J].
URLPMID:18258902 [本文引用: 1]
[J].
DOI:10.1007/s10980-015-0284-3URL [本文引用: 1]
[J].
[本文引用: 1]
[J].
DOI:10.1016/j.jenvman.2018.05.024URL [本文引用: 1]
[J].
URLPMID:30701108 [本文引用: 1]
[J].
DOI:10.5846/stxb201610202142URL [本文引用: 2]

景观格局的改变被视为城市热岛形成的直接原因,但景观格局指标与热岛效应的关联机理仍未厘清。城市规模、景观组分、空间构型作为景观格局的重要表征指标,对热岛效应的影响体现了从整体到局部、从数量到空间的递进关系。其中,城市规模与热岛效应的关联存在地带性规律;景观组分与热岛效应的相关性受昼夜、季节控制;显著驱动热岛效应的关键空间构型指标仍有待遴选。景观格局与热岛效应的非线性关联可能存在拐点,拐点前后对应不一致的因子驱动强度。科学界定城市规模、景观组分、空间构型等景观格局要素显著影响热岛效应的阈值区间,有助于明晰缓解城市热岛效应的关键景观生态途径。
[J].
[本文引用: 2]
[J].
DOI:10.3390/rs10121968URLPMID:30701108 [本文引用: 1]
Due to its worldwide coverage and high revisit time, satellite-based remote sensing provides the ability to monitor in-season crop state variables and yields globally. In this study, we presented a novel approach to training agronomic satellite retrieval algorithms by utilizing collocated crop growth model simulations and solar-reflective satellite measurements. Specifically, we showed that bidirectional long short-term memory networks (BLSTMs) can be trained to predict the in-season state variables and yields of Agricultural Production Systems sIMulator (APSIM) maize crop growth model simulations from collocated Moderate Resolution Imaging Spectroradiometer (MODIS) 500-m satellite measurements over the United States Corn Belt at a regional scale. We evaluated the performance of the BLSTMs through both k-fold cross validation and comparison to regional scale ground-truth yields and phenology. Using k-fold cross validation, we showed that three distinct in-season maize state variables (leaf area index, aboveground biomass, and specific leaf area) can be retrieved with cross-validated R(2) values ranging from 0.4 to 0.8 for significant portions of the season. Several other plant, soil, and phenological in-season state variables were also evaluated in the study for their retrievability via k-fold cross validation. In addition, by comparing to survey-based United State Department of Agriculture (USDA) ground truth data, we showed that the BLSTMs are able to predict actual county-level yields with R(2) values between 0.45 and 0.6 and actual state-level phenological dates (emergence, silking, and maturity) with R(2) values between 0.75 and 0.85. We believe that a potential application of this methodology is to develop satellite products to monitor in-season field-scale crop growth on a global scale by reproducing the methodology with field-scale crop growth model simulations (utilizing farmer-recorded field-scale agromanagement data) and collocated high-resolution satellite data (fused with moderate-resolution satellite data).
[J].
DOI:10.11820/dlkxjz.2011.01.004URL [本文引用: 1]
城市地表温度热岛是城市生态环境效应研究的热点之一,其影响因素研究为缓解城市热岛带来的负效应、促进城市可持续发展提供依据。本文系统回顾了国内外关于城市地表温度热岛影响因素的研究进展。首先结合热岛效应表征的地表能量过程,基于景观生态学格局-过程理论,从地表能量吸收释放、转换及传输3种过程中归纳热岛效应的影响机理,分别对应地表覆盖、人为活动和景观格局特征3方面影响因素;其次,从影响因素的3个方面分析了近年来的研究进展,并比较了国内外地表温度热岛综合影响因素研究领域的异同;最后探讨了研究进展与热岛效应影响机理研究的差距,提出利用多源数据深化城市热岛效应的机理性与综合影响因素研究,以期为制定热岛效应缓解策略有所启示。
[J].
[本文引用: 1]
[J].
DOI:10.1007/s11252-014-0387-7URL [本文引用: 1]
[J].
[本文引用: 1]
[J].
DOI:10.1016/j.rse.2018.06.010URL [本文引用: 1]
[J].
URLPMID:30701108 [本文引用: 2]
[J].
DOI:10.1080/00139157.1995.9930945URLPMID:12320385 [本文引用: 1]
[J].
DOI:10.18402/resci.2019.06.14URL [本文引用: 2]
探究影响城市热岛空间格局的因子,及科学分析各因子的作用机制,对揭示城市热岛效应的机理有着重要意义。本文以粤港澳大湾区为研究区,综合利用数据空间化表达、空间叠置、地理探测器等方法,对影响城市热岛空间格局的因子开展研究,并构建地表温度与影响因子间的多元关系模型。结果表明,粤港澳大湾区的城市热岛强度等级呈现中间高四周低的空间分布格局,并在珠江入海口两岸形成半环状城市热岛带。本文选取的5种影响因子对城市热岛的空间格局皆具有较高的解释力,平均解释力排序为:单元人口密度(0.668)>建设用地面积占比(0.577)>单元路网密度(0.573)>植被面积占比(0.538)>水体面积占比(0.428)。所构建的多元关系模型,能较准确地反映城市热岛区域地表温度的分布状况,所拟合的地表温度结果与实际地表温度平均值的误差为0.34℃。
[J].
[本文引用: 2]
[J].
[本文引用: 1]
[J].
[本文引用: 1]
[J].
DOI:10.3390/rs10121968URLPMID:30701108 [本文引用: 1]
Due to its worldwide coverage and high revisit time, satellite-based remote sensing provides the ability to monitor in-season crop state variables and yields globally. In this study, we presented a novel approach to training agronomic satellite retrieval algorithms by utilizing collocated crop growth model simulations and solar-reflective satellite measurements. Specifically, we showed that bidirectional long short-term memory networks (BLSTMs) can be trained to predict the in-season state variables and yields of Agricultural Production Systems sIMulator (APSIM) maize crop growth model simulations from collocated Moderate Resolution Imaging Spectroradiometer (MODIS) 500-m satellite measurements over the United States Corn Belt at a regional scale. We evaluated the performance of the BLSTMs through both k-fold cross validation and comparison to regional scale ground-truth yields and phenology. Using k-fold cross validation, we showed that three distinct in-season maize state variables (leaf area index, aboveground biomass, and specific leaf area) can be retrieved with cross-validated R(2) values ranging from 0.4 to 0.8 for significant portions of the season. Several other plant, soil, and phenological in-season state variables were also evaluated in the study for their retrievability via k-fold cross validation. In addition, by comparing to survey-based United State Department of Agriculture (USDA) ground truth data, we showed that the BLSTMs are able to predict actual county-level yields with R(2) values between 0.45 and 0.6 and actual state-level phenological dates (emergence, silking, and maturity) with R(2) values between 0.75 and 0.85. We believe that a potential application of this methodology is to develop satellite products to monitor in-season field-scale crop growth on a global scale by reproducing the methodology with field-scale crop growth model simulations (utilizing farmer-recorded field-scale agromanagement data) and collocated high-resolution satellite data (fused with moderate-resolution satellite data).
[J].
DOI:10.1007/s10980-016-0437-zURL [本文引用: 1]
[C].
[本文引用: 1]
[J].
DOI:10.12082/dqxxkx.2018.180242URL [本文引用: 1]
深入研究粤港澳大湾区建设用地扩张与城市热岛扩张的耦合态势,对改善大湾区生态环境、实现城市化的健康发展,具有重要的意义和科学价值。本文以粤港澳大湾区为研究区域,选取2000、2008和2016年的遥感影像数据和地表温度数据,提取大湾区的建设用地、划分城市热岛强度等级、识别城市热岛区域;在此基础上,使用总体耦合态势和空间耦合特征两种模型揭示大湾区在不同时期建设用地扩张和城市热岛扩张的耦合关系。结果表明:① 2000-2016年,粤港澳大湾区的建设用地扩张和城市热岛扩张趋势具有同步性;② 城市热岛区域面积不断增加,在珠江口两岸逐步形成了连接中山-佛山-广州-东莞-深圳-香港,大范围分布的倒“U”形城市热岛条带;③ 大湾区建设用地与城市热岛的总体耦合态势处于不断加强的过程,至2016年,两类指标的重心距离达到研究期内的最小距离,此时的总体耦合态势最强;④ 研究期内,大湾区未出现建设用地扩张和城市热岛扩张严重失调情况,建设用地扩张和城市热岛扩张耦合类型以耦合型、基本耦合型以及轻度不耦合型为主,空间耦合程度高。
[J].
[本文引用: 1]
[J].
DOI:10.1007/s11442-012-0957-7URL [本文引用: 1]
Using ASTER (Advanced Spaceborne Thermal Emission and Reflection Radiometer) infrared remote sensing data we inversed the parameters of urban surface heat fluxes applying the PCACA model and theoretical position algorithm, and then we analyzed the influence of different land use types on the surface heat fluxes and energy balance. In this study, Kumagaya, a city in Saitama Prefecture, Japan, was selected as the experimental area. The result shows that the PCACA model is feasible for the surface heat fluxes estimation in urban areas because this model requires less parameters in the procedure of heat fluxes estimation in urban areas with complicated surface structure and can decrease the uncertainty. And we found that different land-use types have indicated the height heterogeneity on the surface heat fluxes significantly. The magnitudes of Bowen ratio in descending order are industrial, residential, transportation, institutional, dry farmland, green space, and water body. Under the same meteorological condition, there are distinct characteristics and regional differences in Bowen ratios among different surface covers, indicating higher sensible heat flux and lower latent heat flux in the urban construction land, while lower sensible heat flux and higher latent heat flux in the vegetation-covered area, the outskirt of the urban area. The increase of urban impervious surface area caused by the urban sprawl can enlarge the sensible heat flux and the Bowen ratio, so that it causes the increasing of urban surface temperature and air temperature, which is the mechanism of the so-called heat island effect.
[J].
DOI:10.5846/stxb201611182342URL [本文引用: 1]
全球范围的城市扩张和能源消耗,导致人为热在不同时间和空间尺度上影响地表热环境,人为热排放与城市热岛的关系受到广泛关注。通过国内外文献总结源清单法、数值模拟法和能量平衡方程等3种人为热估算方法的优缺点,评价人为热研究在城市、区域和全球尺度的主要进展和区别,归纳出现有研究在城市尺度多关注人为热的时间动态变化,区域和全球尺度研究则更关注人为热的空间差异,以及人为热对于全球变暖的贡献和人类的适应对策。从中发现人为热研究中存在的问题和不足,包括研究尺度和研究方法匹配性、研究结果的验证和比较、人为热排放与景观功能的联系、人为热排放强度和周期对气温的影响机制等。根据现存问题提出多学科集成、人为热与景观功能耦合、时空尺度选择、数据获取等4个方面的建议,有助于在理论和方法方面深化和拓展城市人为热研究。
[J].
[本文引用: 1]
[J].
DOI:10.11821/dlyj201604009URL [本文引用: 1]
G*指数统计特征的热点区域主要分布在越秀区和天河区,广州市零售业发展的双核心空间格局已经形成。③ 不同的零售业态对商业集聚的区位选择具有显著差异性,百货商店、超市、便利店等零售经营形态的空间集聚特征与该业态的市场定位、经营模式及选址策略基本吻合。总体来看,基于POI数据的广州零售业集聚空间分析结果能够反映实体零售企业行为与广州商业经济分布的相关性,有助于提高政府部门商业规划和零售商选址前期研究的客观性和科学性。]]>
[J].
[本文引用: 1]
[J].
DOI:10.1016/j.ecolind.2019.05.032URL [本文引用: 1]
[J].
DOI:10.11821/dlxb201701010URL [本文引用: 3]
q统计量,可用以度量空间分异性、探测解释因子、分析变量之间交互关系,已经在自然和社会科学多领域应用。本文阐述地理探测器的原理,并对其特点及应用进行了归纳总结,以利于读者方便灵活地使用地理探测器来认识、挖掘和利用空间分异性。]]>
[J].
[本文引用: 3]
[J].
[本文引用: 1]
[J].
DOI:10.3390/ijerph110303407URLPMID:24662999 [本文引用: 1]
Hand, foot and mouth disease (HFMD) is a common infectious disease, causing thousands of deaths among children in China over the past two decades. Environmental risk factors such as meteorological factors, population factors and economic factors may affect the incidence of HFMD. In the current paper, we used a novel model-geographical detector technique to analyze the effect of these factors on the incidence of HFMD in China. We collected HFMD cases from 2,309 counties during May 2008 in China. The monthly cumulative incidence of HFMD was calculated for children aged 0-9 years. Potential risk factors included meteorological factors, economic factors, and population density factors. Four geographical detectors (risk detector, factor detector, ecological detector, and interaction detector) were used to analyze the effects of some potential risk factors on the incidence of HFMD in China. We found that tertiary industry and children exert more influence than first industry and middle school students on the incidence of HFMD. The interactive effect of any two risk factors increases the hazard for HFMD transmission.
[J].
DOI:10.1002/grl.v43.2URL [本文引用: 2]
[J].
[本文引用: 1]
[J].
[本文引用: 1]
[J].
[本文引用: 1]
[J].
[本文引用: 1]
[J].
[本文引用: 1]
[J].
[本文引用: 1]
[J].
[本文引用: 1]
[J].
[本文引用: 1]
[J].
[本文引用: 1]
[J].
[本文引用: 1]
[DB/OL]. (2017-12) [
URL [本文引用: 1]
[DB/OL]. (2017-12) [
URL [本文引用: 1]
[DB/OL]. (2017-12) [
URL [本文引用: 1]
[DB/OL]. (2017-12) [
URL [本文引用: 1]
[本文引用: 1]
[本文引用: 1]
[J].
[本文引用: 1]
[J].
[本文引用: 1]
[J].
[本文引用: 1]
[J].
DOI:10.1080/15481603.2013.778562URL [本文引用: 1]
[J].
DOI:10.18402/resci.2019.08.13URL [本文引用: 1]
2,热岛斑块有619个,且南部斑块数量明显多于北部,斑块面积由西向东显著增大。为消除城市热岛效应,需布局绿地冷岛6154 hm 2。其中,绿地冷岛高需求区面积1054 hm 2,主要位于朝阳区南部的八里庄街道;中需求区面积2021 hm 2,集中在双井、劲松和潘家园街道;低需求区零散分布,面积约3079 hm 2。因此,位于生态空间内的冷岛需求区,绿地配置需要保证一定数量的绿地面积与绿量,并满足绿地斑块结构要求;而位于建设空间内的冷岛需求区,则需要重点提升与利用周边绿地的冷岛效率及辐射效应。]]>
[J].
[本文引用: 1]
[J].
[本文引用: 1]
[J].
[本文引用: 1]
[J].
[本文引用: 1]
[J].
[本文引用: 1]
[J].
[本文引用: 1]
[J].
[本文引用: 1]
[J].
[本文引用: 1]
[本文引用: 1]
