 ,1,2, 王捷凯1,2, 黄琴诗3,4, 宋伟轩,1,5
The spatio-temporal pattern of shop rent and its influencing factors in Nanjing
GU Yue,1,2, WANG Jiekai1,2, HUANG Qinshi3,4, SONG Weixuan,1,5通讯作者:
收稿日期:2020-10-19接受日期:2021-04-8
| 基金资助: |
Received:2020-10-19Accepted:2021-04-8
作者简介 About authors
谷跃(1996-), 男,江苏南京人,硕士,研究方向为城市社会地理。E-mail:

摘要
关键词:
Abstract
Keywords:
PDF (10393KB)元数据多维度评价相关文章导出EndNote|Ris|Bibtex收藏本文
本文引用格式
谷跃, 王捷凯, 黄琴诗, 宋伟轩. 南京商铺租金时空格局及影响因素分析[J]. 地理研究, 2021, 40(9): 2459-2475 doi:10.11821/dlyj020201003
GU Yue, WANG Jiekai, HUANG Qinshi, SONG Weixuan.
1 引言
城市商业空间结构与发展演化一直是经济地理学研究的重要内容[1,2]。商铺作为商业活动的重要载体,其空间布局与发展水平是衡量城市区域商业活力的重要指标[3]。21世纪以来中国大城市职能由生产型向消费型逐渐转变[4],随着国民消费需求的不断提升、房地产市场的蓬勃发展和城市更新改造的深入推进,商业街、城市商业综合体、新建住宅区底层商铺等商业地产项目迅速成为房地产投资开发的热点,深刻影响着城市商业和消费空间结构[5]。近年来,互联网经济的迅速崛起以及大众消费模式的变革,严重冲击着传统零售业和商业地产的发展,迫使实体商业在空间布局、消费定位、业态组合及运营模式等方面进行转型升级,并且改变着城市商业空间价值格局[6]。商铺租金是衡量一个城市或地区经济实力和消费水平的标尺,因具有良好的时效性和真实性,相对于可能存在“泡沫化”风险的商铺售价而言,能够更加及时、客观地反映城市商业空间价值[7]。分析城市商铺租金的整体涨落、空间差异以及影响因素,既可以为判断城市经济活力、内需增长和商业开发潜力提供“晴雨表”,也可以为政府部门科学规划商业空间、开发商合理投资商业项目、商铺投资者评估投资回报以及普通商户制定经营策略等提供佐证参考,具有明确的研究意义与实践价值,但相较于国外关于商铺租金广泛而深入的研究,国内相关研究成果较为有限。
国外****对商铺租金的研究兴盛于20世纪90年代,以中心地理论、零售集聚理论、零售需求外部性理论为理论基础[8]27,研究主要集中于商铺租金的构成[9]、商铺租金的估算和预测[10,11]、商铺租金的决定因素等方面。其中,商铺租金的影响因素是研究焦点。研究发现,城市商铺的整体租金水平受到诸如GDP、商业税率、居民收入[12,13]等宏观经济因素的显著影响,而城市内部的商铺租金则受到中心区位、交通可达性、商圈购买力、人流量、经济潜力等空间要素[14,15,16,17,18,19],以及租约特征、业态组合、商铺形象、商业竞争关系等非空间要素[20,21,22,23,24]的综合影响。国内有关城市商铺的研究起步较晚,涉及到商铺租金的研究更为少见,既有研究主要是通过实地调研、调查问卷与计量模型相结合的方法,分析影响商铺租金的主要因素,结果显示,交通区位、商铺规模、购买力水平、人流量、空置率、租约以及商户组合等因素都会对商铺租金产生影响[8]2,[25,26,27,28,29,30]。
纵观国内外相关研究发现:① 商铺价格与租金涉及商业机密,大规模可靠数据的获取难度较大,难以完全满足回归模型复杂严苛的前置假设条件,进而会对统计检验、模型估计等产生不利影响,使分析结果较难令人信服,所以国内为数不多的实证研究主要集中于北、上、港、深等少数一线发达城市,而针对中国城市“主力军”二三线城市的分析较少见。② 中西方在发展背景、经济水平、消费习惯等方面存在显著差异,例如美国的研究主要以位于偏远郊区、标准化设计、单层建筑的购物中心为主,消费者大多以私家车作为出行方式,所以大量有关商铺租金的实证研究都是基于商业零售空间具有同质性的假设进行的[31];而中国的商业空间通常位于人流量大、可达性好的繁华街区,建筑和经营模式多样,购物出行方式大多以公共交通为主,这使得中国城市商业空间通常具有更强的异质性;并且针对中国城市的实证研究也表明,在国外研究中比较常见的影响因素(停车位、建筑年代、主力租户等)对中国商铺租金影响并不一定显著[30]。
鉴于上述分析,本文以南京为案例城市,基于较大研究范围、较长时间跨度内的大量可靠商铺租金数据,在利用GIS空间分析手段探究南京商铺租金时空分异格局的基础上,运用地理探测器,结合定性分析,试图揭示影响中国城市商铺租金空间分异格局的重要因素及其组合变化,以期纵深推进符合中国实际情况的城市商铺租金和商业空间研究,并为地方政府、开发商和商户等各方利益主体提供一定参考。
2 研究数据与方法
2.1 研究区域
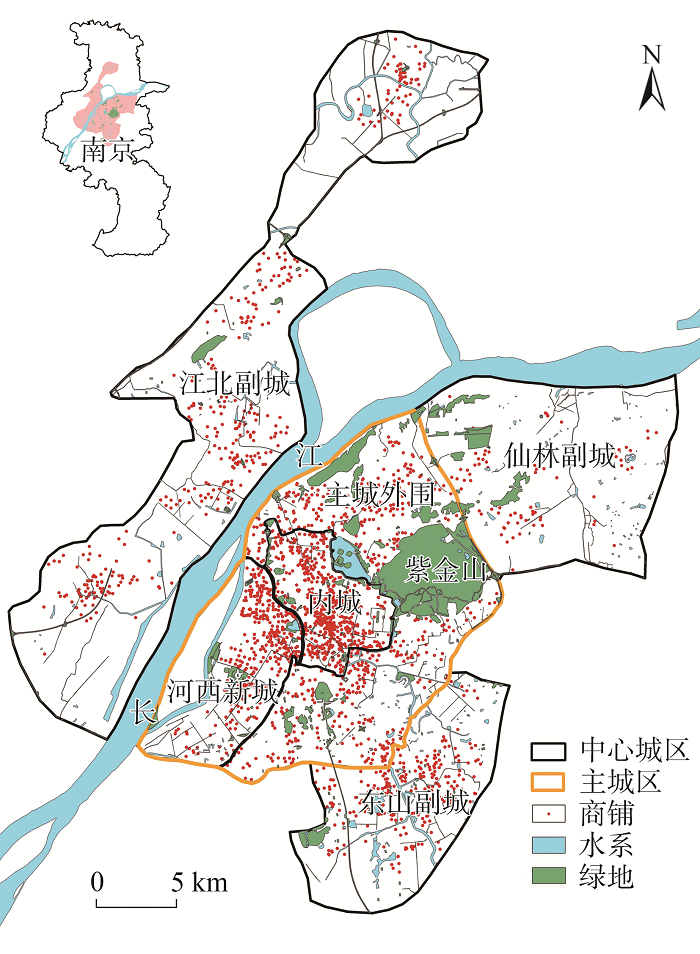
南京地处经济发达的长三角地区,是二线城市的典型代表,自古以来就是商业重镇,城市中心新街口地区更有“中华第一商圈”的美誉。南京不仅拥有近千万常住人口,每年还吸引着大量安徽、苏北等周边地区的消费群体,城市商业氛围浓厚,消费潜力巨大。2019年南京实现社会消费品零售总额6135.7亿元,连续六年位居全省第一。因此,本研究以南京为案例城市,选择南京最新版城市总体规划确定的“中心城区”为研究区域。如图1所示,包括主城区、东山副城、仙林副城和江北副城,即“一主三副”,总面积约为846 km2,占全市总面积的12.8%。其中主城区包括内城、河西新城和外围地区,是南京商铺分布最为密集的区域,也是本文重点研究区域。
图1
 新窗口打开|下载原图ZIP|生成PPT
图1研究区域和研究对象
Fig. 1Research area and subjects
2.2 数据来源
南京市商铺租金数据来源于中国房价行情平台(2.3 研究方法
(1)核密度分析。本文使用核密度分析法(Kernel Density)对商铺点位数据的空间分布进行无差别连续化模拟,以探测商铺位置的空间集聚情况,其数学表达式为[32]:式中:
(2)莫兰指数。莫兰指数(Moran's I)可以被用来从全局范围内分析商铺租金的空间自相关程度。I>0表示商铺租金空间正相关;I<0表示空间负相关;若I=0,则商铺租金的空间分布呈随机性,其表达式如下[33]:
式中:
(3)局部空间自相关分析。局部空间自相关分析可以被用来分析局部区域的空间集聚特征,探测局部区域空间集聚的异常值等信息,本文选择AnselinLocal Moran's I方法进行局部空间自相关分析,其计算公式为[34]:
式中:
(4)地理探测器。以往对于商铺租金影响因素的研究多采用特征价格模型(Hedonic Model)或其他回归模型,但此类模型在实际分析中通常会伴随有指标多重共线性、异方差等问题,且不易补救,可能会影响计算结果的可靠性。地理探测器(Geographical Detector)是一种基于空间方差分析的空间分析方法,该方法无需线性假设,且对于共线性免疫,能够有效识别地理空间要素的空间分异性,并揭示其背后的驱动因素[36]。因此,本文选择地理探测器中的因子探测器与交互探测器来探究影响商铺租金的关键性因素。因子探测器的数学表达式如下:
式中:
3 南京市商铺租金时空演化格局
3.1 南京商铺空间格局演变
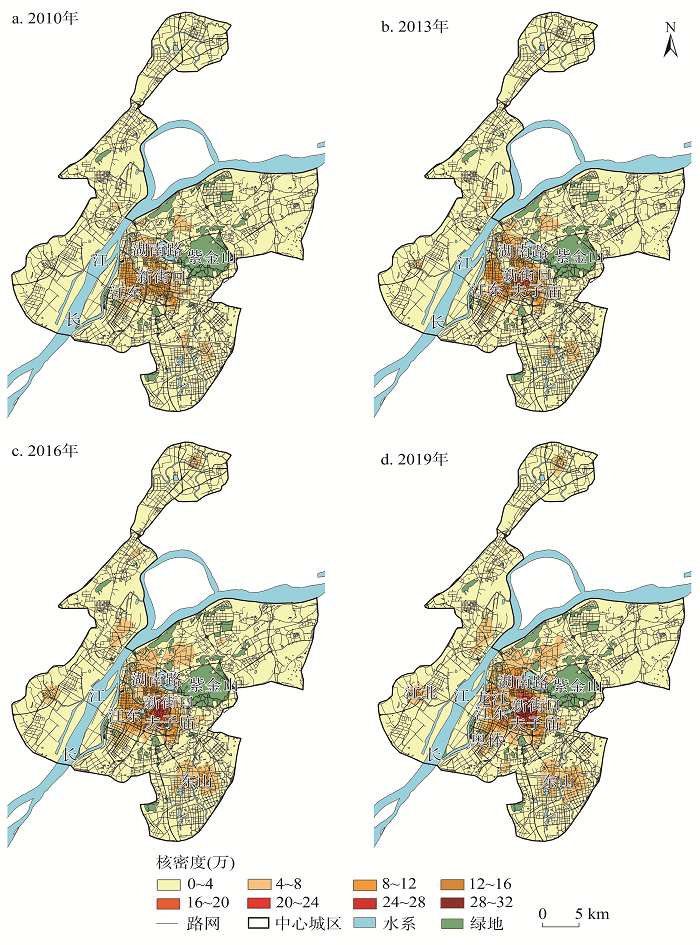
对南京市中心城区商铺点位数据进行核密度分析,结果如图2所示,南京的商业区主要集中在主城区,空间布局上以新街口为核心,呈现出日益增强的中心极化趋势,此外河西、东山和江北等新城核心区亦出现不断强化的商业集聚态势。具体而言:2010年(图2a),商铺集中分布在新街口、湖南路和江东商业圈,前两者是南京内城传统的商业中心,后者位于南京第一个开发的新城区——河西新城,也是南京新CBD所在地;到2013年(图2b),新街口对商铺的吸引力不断加强,商业集聚趋势愈发明显,湖南路和江东商圈的商业密度也表现出一定程度的增强;到2016年(图2c),主城区商业集聚程度显著增强,其中新街口商圈的商铺密度已经远超湖南路、江东等其他地区,表现出以新街口为核心向外围圈层递减的“核心-边缘”结构,同时东山、江北、奥体等商业板块的商铺密度有所提升;至2019年(图2d),在新街口商业密度进一步提高的同时,其辐射范围亦在不断扩大,逐步形成了“鼓楼-新街口-大行宫”连片发展的城市中心商圈,而在湖南路、江东、龙江和夫子庙等地出现次级商业集聚中心,联合外围的奥体、东山和江北共同组成等级鲜明的商业集聚格局。图2
 新窗口打开|下载原图ZIP|生成PPT
图22010—2019年南京市中心城区商业空间时空演变
Fig. 2The spatio-temporal evolution of commercial space in the central urban areas of Nanjing from 2010 to 2019
3.2 商铺租金时序变化特征
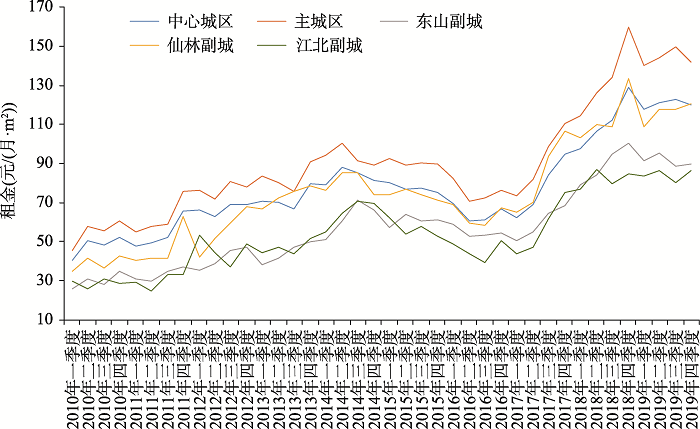
从2010—2019年南京中心城区和各城区商铺平均租金变化上看(图3,见第2464页),租金变化走势表现出较好的一致性,大体上以2014年三季度和2017年一季度为时间节点,呈现前期平稳增长、中期显著下降、后期迅速回升的特点。整体来看,十年间中心城区商铺平均租金从40.48元/(月·m2)上涨到119.8元/(月·m2),涨幅接近200%,其中受到南京房地产调控政策的影响,商铺租金在2014下半年至2016年期间出现下跌,跌幅超过30%。而自2017年起,在实体零售积极转型,新零售迅速崛起的背景下( 2016年国务院办公厅印发《关于推动实体零售创新转型的意见》,强调实体零售的重要性,鼓励实体零售创新转型。在此之后,无论是阿里巴巴等互联网企业,还是永辉等传统实体店,都积极通过推出“盒马生鲜”“超级物种”等新零售业态,探索线上线下相融合的转型升级之路,带动了实体零售行业的复苏。),南京商铺租金也出现明显回升,其中2017—2018年涨势最为迅猛,年均增长幅度达43.52%。分城区看,商铺租金地区差异明显,主城区商铺平均租金始终最高,2018年底一度达到159.5元/(月·m2),远超其他副城区;仙林副城租金次之,前期低于中心城区平均水平,但中后期基本与中心城区整体水平相吻合;东山和江北副城的商铺租金长期低于其他城区,且增长相对缓慢,导致与其他城区特别是主城区的租金差距拉大。图3
 新窗口打开|下载原图ZIP|生成PPT
图32010—2019年南京商铺租金变化趋势
注:数据来源于中国房价行情平台(
Fig. 3Trend of change in the shop rent in Nanjing from 2010 to 2019
3.3 商铺租金时空关联特征
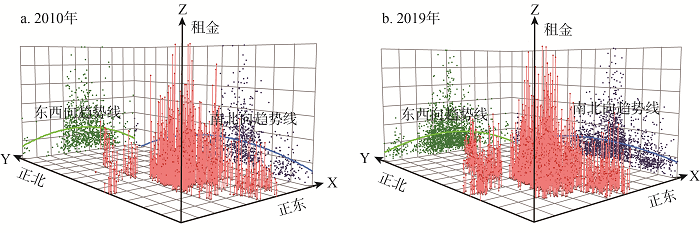
利用ArcGIS趋势分析工具,生成的南京中心城区商铺租金空间分布趋势见图4。租金在南北(Y轴)与东西(X轴)走向上都表现出典型的“倒U型”走势,说明商铺租金在空间上呈现出由市中心向外围递减的分布格局,并且由投影点的分布形态和密度可以发现,2010—2019年南京商铺租金的中心极化趋势显著增强。图4
 新窗口打开|下载原图ZIP|生成PPT
图42010年、2019年南京市商铺租金趋势分析
Fig. 4Analysis on the trend of shop rent in Nanjing in 2010 and 2019
根据以往的研究,区域房地产市场往往具有显著的空间关联性或集聚特征[37,38]。采用全局莫兰指数分析十年间商铺租金的空间关联特征,结果如表1所示,2010—2019年商铺租金的莫兰指数呈现先上升、后下降、再上升的“N”型变化趋势,总体上由0.086上升为0.180。十年间的Moran's I值均为正值,且均在1%的水平下通过显著性检验,说明商铺租金存在显著的空间正相关性,即商铺租金表现为明确的空间集聚与空间依赖性。
Tab. 1
表1
表12010—2019年南京市商铺租金莫兰指数
Tab. 1
| 年份 | 2010 | 2011 | 2012 | 2013 | 2014 | 2015 | 2016 | 2017 | 2018 | 2019 |
|---|---|---|---|---|---|---|---|---|---|---|
| Moran's I | 0.086 | 0.124 | 0.137 | 0.159 | 0.107 | 0.100 | 0.116 | 0.129 | 0.141 | 0.180 |
| Z(I) | 7.33 | 9.71 | 8.96 | 10.46 | 6.89 | 12.70 | 8.62 | 12.06 | 15.19 | 18.09 |
| P | 0.00 | 0.00 | 0.00 | 0.00 | 0.00 | 0.00 | 0.00 | 0.00 | 0.00 | 0.00 |
新窗口打开|下载CSV
根据Moran's I值的变化情况将商铺租金空间关联格局演变分为三个阶段:2010—2013年,Moran's I上升,表明该阶段商铺租金的空间集聚性增强,商铺租金空间差异加剧;2013—2015年,Moran's I由0.159降到了0.100,说明商铺租金的空间集聚性有所减弱;2015—2019年,Moran's I迅速回升,到2019年达到0.180,意味着商铺租金的空间集聚程度陡然加剧,区域内租金差异显著扩大。
3.4 主城商铺租金分异格局
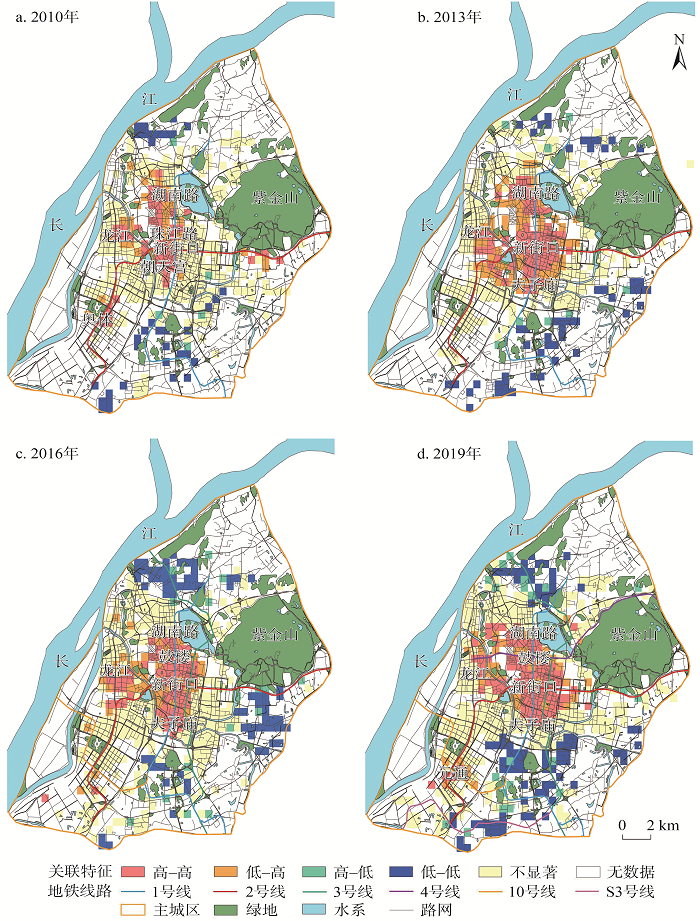
考虑到南京主城区商铺空间分布最为密集且租金水平相对较高,为提高空间分析精度,选择主城区为重点研究区域,通过建立500 m×500 m网格作为基础分析单元,采用Anselin Local Moran's I方法挖掘商铺租金的局部空间分异格局,计算得出南京主城区商铺租金LISA集聚图如图5所示。图5
 新窗口打开|下载原图ZIP|生成PPT
图52010—2019年南京主城商铺租金局部空间关联特征
Fig. 5Localized spatial autocorrelation of shop rent in primary urban areas of Nanjing from 2010 to 2019
总体上看,南京主城区商铺租金高低值集聚程度在不断加剧,具有高-高、低-高、高-低、低-低等显著集聚特征的区域占比从2010年的24.7%上升到2019年的34.5%,说明主城区商铺租金的局部空间集聚性在逐步增强,区域间的商铺租金分化趋势日益加剧。高值热点区域以新街口为核心向外围拓展,特别是地铁沿线上更容易形成高租金商铺集聚区,河西的龙江逐渐成为仅次于内城的新兴热点区,而低租金集聚区则主要分布于主城外围地区。
从不同时间点来看:
(1)2010年(图5a)租金高值集聚的热点区分布在内城的新街口、朝天宫以及湖南路、珠江路一带以及河西的龙江、奥体等地,外围的城南和城北零散分布着低值集聚的冷点区。
(2)2013年(图5b),出现新街口、湖南路、河西龙江三个明显的集中连片租金热点区,同时低租金冷点区的范围也有所扩大。
(3)伴随2014年之后城市商铺租金的整体下跌,至2016年(图5c),高租金热点区范围明显缩小,除新街口租金水平未见明显下降外,内城区两大传统商圈——湖南路和夫子庙走势各异,湖南路商圈繁华不在,商业吸引力下滑严重,大量商户和客源流失,导致租金大幅下降,而夫子庙-老门东商圈经过业态升级,有机融合地方传统商业文化与现代时尚消费元素,从单纯旅游商业区蜕变为颇具地方特色的综合性商业中心,使商铺租金实现逆势上涨。
(4)至2019年(图5d),城市商铺租金的整体迅速回暖甚至“报复性反弹”,使内城商铺租金高值集聚程度再度加深,新街口与附近的大行宫、珠江路以及湖南路、夫子庙等热点商业区逐渐融合,形成以新街口为核心,地铁1、2号线为轴线的巨型租金热点区,而外围城南和城北地区除地铁2号线与10号线交汇处的元通地铁站附近,依然分布有较大范围的租金冷点区。
4 南京主城商铺租金影响因素分析
4.1 商铺租金的影响因素
根据经济地理学相关理论、国内外****对于商铺租金价格的实证研究,以及南京主城区商铺租金空间分布规律,并结合数据实际可获取情况与量化难度,本文从交通区位、周边配套、消费能力、建筑特征四个方面,遴选出10个可能对商铺租金产生重要作用的因素(表2)。分别为中心位势(代表商业区位条件)、地铁通达、公交便利、路网密度(代表交通可达性)、商业环境(代表周边商业集聚程度)、商务氛围(代表周边商务配套条件)、生活配套(代表周边居住配套环境)、居住密度(代表周边居住人口密度)、住宅价格(代表周边地价和购买力水平)和建筑年代(代表商铺自身的建筑特征)。Tab. 2
表2
表2商铺租金影响因素
Tab. 2
| 特征类型 | 解释变量 | 变量描述 |
|---|---|---|
| 交通区位 | 中心位势 | 与新街口和最近次级商业中心距离之和 |
| 地铁通达 | 1 km范围内的地铁口数量 | |
| 公交便利 | 1 km范围内的公交站数量 | |
| 路网密度 | 1 km范围内的路网密度 | |
| 周边配套 | 商业环境 | 1 km范围内大型商场、超市和餐饮网点数量 |
| 商务氛围 | 1 km范围内公司企业、星级酒店和银行数量 | |
| 生活配套 | 1 km范围内住宅小区、学校、医院、体育休闲场所数量 | |
| 居住密度 | 1 km范围内住宅小区的平均容积率 | |
| 消费能力 | 住宅价格 | 1 km范围内单位面积住宅平均售价 |
| 建筑特征 | 建筑年代 | 商铺的建成年代 |
新窗口打开|下载CSV
由于地理探测器适合分析离散型数据[39],为了使离散化后同类数据内部的相似性和各类数据间的差异性都尽可能明显,本文在结合轮廓系数(Silhouette Coefficient)判定最佳分类数的基础上,运用K-means聚类方法对以上10个连续性自变量数据进行离散化处理,然后采用地理探测器识别不同因素对南京主城区商铺租金的作用强度。
4.2 单影响因素分析结果
通过地理探测器对单因子进行探测分析,结果如表3显示。除了建筑年代,其余9个因素的分析结果均在5%水平上通过显著性检验,且2019年各指标因子的q值普遍高于2010年。就单个因素的解释力大小而言,两个年份中“公交便利”和“商务氛围”的解释力排名变化较大,“地铁通达”和“住宅价格”两个指标的解释力均一直相对较高,其次是“商业环境”“生活配套”,再次是“中心位势”,而“路网密度”“居住密度”和“建筑年代”的解释力一直较低。Tab. 3
表3
表3因子探测器分析结果
Tab. 3
| 影响因素 | 2010年 | 2019年 | |||
|---|---|---|---|---|---|
| q | p | q | p | ||
| 中心位势 | 0.0444 | 0.000 | 0.0561 | 0.000 | |
| 地铁通达 | 0.0609 | 0.000 | 0.0957 | 0.000 | |
| 公交便利 | 0.0694 | 0.000 | 0.0608 | 0.000 | |
| 路网密度 | 0.0254 | 0.013 | 0.0502 | 0.000 | |
| 商业环境 | 0.0374 | 0.003 | 0.0867 | 0.000 | |
| 商务氛围 | 0.0353 | 0.009 | 0.0913 | 0.000 | |
| 生活配套 | 0.0547 | 0.000 | 0.0755 | 0.000 | |
| 居住密度 | 0.0207 | 0.033 | 0.0260 | 0.000 | |
| 住宅价格 | 0.0677 | 0.000 | 0.0911 | 0.000 | |
| 建筑年代 | 0.0099 | 0.092 | 0.0127 | 0.033 | |
新窗口打开|下载CSV
2010年,各影响因子解释力排名为公交便利>住宅价格>地铁通达>生活配套>中心位势>商业环境>商务氛围>路网密度>居住密度>建筑年代,到2019年,解释力排名变化为地铁通达>商务氛围>住宅价格>商业环境>生活配套>公交便利>中心位势>路网密度>居住密度>建筑年代。究其原因:
(1)地铁通达性的解释力排名提升,而公交便利的解释力排名下降,这表明消费者交通出行方式的转变对商铺租金的影响较大。近年来南京地铁网络逐渐成熟(2南京作为中国第六个修建地铁的城市,地铁建设速度异常之快,是中国第一个辖区全部开通地铁的城市。截至2019年底,南京的地铁线路里程为378 km,位居中国第4位(仅次于北上广),世界第5位。),地铁逐步取代公交成为居民消费购物的主要出行方式,极大压缩了购物的时空成本,而地铁大运量和便捷性特点使地铁口周边易形成人流密集的商业区,改变了传统以城市中心向外围圈层扩散的商业结构和租金格局,并在一定程度上削弱了中心位势对商铺租金的影响力。
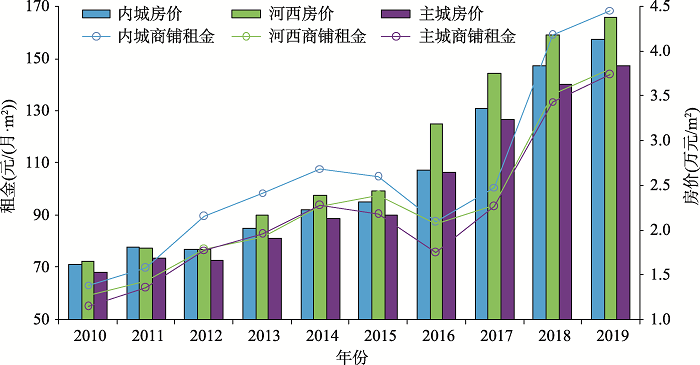
(2)住宅价格指标既表征地价水平也代表消费潜力,而且同受房地产市场影响,因此对商铺租金具有较高的解释力,但解释力排名的下降又说明商品房价与商铺租金的分异机制并非一致。以南京住宅价格与商铺租金最高的两个区域——内城区与河西新城为例(图6,数据来源于中国房价行情平台:www.creprice.cn),河西新城在“城市新中心”和南京青奥会等政策红利与“大事件”的加持下,集聚了大量优质资源和高收入群体,房价得以迅速攀升,也带来消费层级和商铺租金的提升(3 2014年南京青奥会的召开极大促进了河西地区的开发建设,在此期间既有地铁10号线、河西有轨电车、江东快速路等交通线路的打通,又有河西儿童医院、南师大新城初中、保利大剧院等优质公共服务资源的落户,交通、教育、医疗、文化休闲等城市配套设施的完善强化了河西新城的综合功能,在聚集区域人气的同时,也吸引了部分商业资源向河西地区转移和集聚,从而带动了河西商铺租金水平的整体上涨。);尽管房价高于内城,但河西在商铺租金上仅相当于主城区平均水平,内城则依托悠久历史与商业文化积淀、便捷交通条件与优质公共服务,以及近年来大规模城市更新与绅士化改造[40,41,42,43],保持着商铺租金的领先优势,并存在扩大与河西租金差距的趋势,从侧面说明商铺租金与住宅房价分异机制的关联性与差异性并存。
图6
 新窗口打开|下载原图ZIP|生成PPT
图62010—2019年内城与河西商铺租金和房价对比
Fig. 6Comparison of shop rent and house price between inner city and Hexi area from 2010 to 2019
(3)周边配套条件上,商务氛围的解释力排名上升而生活配套解释力排名下降,说明区域内公司白领、商旅人士和金融机构的集聚对于商铺租金发挥着越来越重要的作用,而居住、教育医疗、体育休闲等生活配套服务设施,对于商铺租金涨落的影响程度相对降低,也就是说城市高端“职”“商”两者间存在空间融合趋势,而“宜居”空间并不一定“宜商”。
(4)居住密度的解释力较低,反映出居住规模与商业能级空间错位的“商住分离”城市发展趋势,即人口聚居地并不一定是商业发达区。特别是随着新城新区和地铁网络的建设完善,内城人口持续外迁,在外围形成功能单一的“卧城”,而内城改造和环境提升过程中,部分居住空间转变为商业职能,使内城商业活力不断增强,吸引着城市外围消费者。
4.3 双因子交互分析结果
在单因素分析基础上,考虑到商铺租金是多种因素叠加作用的产物,进一步采用交互因子探测器进行分析发现(表4)。双因子交互作用下的商铺租金解释力明显增强,例如2019年地铁通达与住宅价格两因子交互作用之后的q值达到了0.159,比原单因子q值分别提升了65.9%和74.3%;2010年中心位势和商业环境两个因子的解释力排名分别为第4和第5位,而两因子交互作用后q值达到0.127,解释力上升至第1位,说明双因子交互作用能够产生“1+1>2”的化学反应。Tab. 4
表4
表4交互因子探测器分析结果
Tab. 4
| 交互因子 | q | 交互因子 | q | 交互因子 | q | |||
|---|---|---|---|---|---|---|---|---|
| 2010年 | 2019年 | 2010年 | 2019年 | 2010年 | 2019年 | |||
| 地铁通达∩中心位势 | 0.118 | 0.118 | 中心位势∩路网密度 | 0.081 | 0.093 | 生活配套∩住宅价格 | 0.115 | 0.136 |
| 地铁通达∩商业环境 | 0.084 | 0.136 | 中心位势∩建筑年代 | 0.083 | 0.079 | 生活配套∩居住密度 | 0.074 | 0.085 |
| 地铁通达∩商务氛围 | 0.092 | 0.125 | 商业环境∩商务氛围 | 0.088 | 0.102 | 生活配套∩公交便利 | 0.096 | 0.098 |
| 地铁通达∩生活配套 | 0.065 | 0.134 | 商业环境∩生活配套 | 0.081 | 0.092 | 生活配套∩路网密度 | 0.077 | 0.121 |
| 地铁通达∩住宅价格 | 0.114 | 0.159 | 商业环境∩住宅价格 | 0.091 | 0.136 | 生活配套∩建筑年代 | 0.112 | 0.111 |
| 地铁通达∩居住密度 | 0.082 | 0.117 | 商业环境∩居住密度 | 0.056 | 0.094 | 住宅价格∩居住密度 | 0.092 | 0.108 |
| 地铁通达∩公交便利 | 0.101 | 0.152 | 商业环境∩公交便利 | 0.090 | 0.129 | 住宅价格∩公交便利 | 0.114 | 0.121 |
| 地铁通达∩路网密度 | 0.081 | 0.149 | 商业环境∩路网密度 | 0.077 | 0.120 | 住宅价格∩路网密度 | 0.096 | 0.126 |
| 地铁通达∩建筑年代 | 0.117 | 0.151 | 商业环境∩建筑年代 | 0.075 | 0.123 | 住宅价格∩建筑年代 | 0.098 | 0.132 |
| 中心位势∩商业环境 | 0.127 | 0.093 | 商务氛围∩生活配套 | 0.086 | 0.110 | 居住密度∩公交便利 | 0.099 | 0.079 |
| 中心位势∩商务氛围 | 0.108 | 0.010 | 商务氛围∩住宅价格 | 0.087 | 0.137 | 居住密度∩路网密度 | 0.078 | 0.072 |
| 中心位势∩生活配套 | 0.114 | 0.087 | 商务氛围∩居住密度 | 0.074 | 0.097 | 居住密度∩建筑年代 | 0.056 | 0.058 |
| 中心位势∩住宅价格 | 0.110 | 0.116 | 商务氛围∩公交便利 | 0.098 | 0.123 | 公交便利∩路网密度 | 0.095 | 0.102 |
| 中心位势∩居住密度 | 0.080 | 0.066 | 商务氛围∩路网密度 | 0.083 | 0.138 | 公交便利∩建筑年代 | 0.109 | 0.099 |
| 中心位势∩公交便利 | 0.099 | 0.096 | 商务氛围∩建筑年代 | 0.072 | 0.121 | 路网密度∩建筑年代 | 0.064 | 0.087 |
新窗口打开|下载CSV
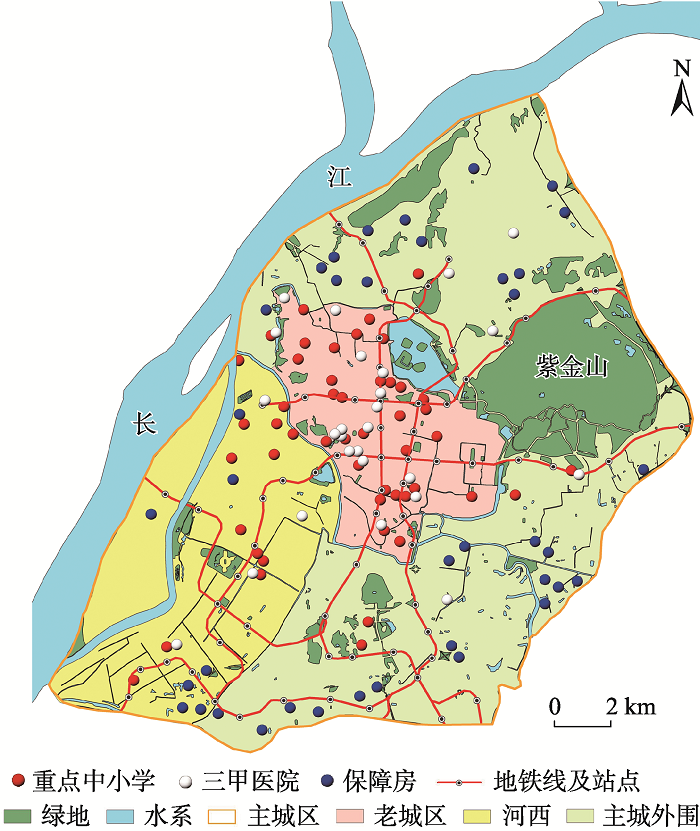
双因子交互探测的组合因子q值和解释力排名变化能够更好揭示和解释商铺租金空间分异的影响因素及其组合变化特征。以解释力排名首位的两组因子为例,2010年,地铁2号线5月才正式开通,城市房地产市场也未如近年来火爆,因此租金商铺高低更多受到商铺所在的空间区位(中心位势)及周边商业成熟度(商业环境)的共同影响;到2019年,南京开通地铁线路达到10条,包括174座地铁站,城市地价房价居高不下,主城区平均商品房价从2010年的15221元/m2上涨为38384元/m2,而且房价与周边地铁站具有高度相关性[44,45],在交通、客流、经营成本和消费能力等共同作用下,地铁通达与住宅价格成为对商铺租金最具影响力的组合因子。再以解释力排名末尾的居住密度因子为例,从交互因子探测结果来看,2010年和2019年居住密度与其他任意因子组合的解释力均不强,证明高密度住宅区与高租金商铺之间并不存在显著关联;从城北和城南的实际情况可以得到进一步验证,如图7所示,城北和城南地区分布着大规模、高密度的保障房社区,虽有大量人口聚居,但购买力有限,综合通达条件相对不佳,教育、医疗等优质公共资源匮乏,使得商铺租金水平普遍不高,表现为2019年保障房空间布局与商铺租金冷点区分布(图5)具有较高重合度;即使是居住密度因子与解释力最强的地铁通达因子的组合,即地铁沿线周边的保障房社区周边,商铺租金冷点区域同样持续存在,甚至不断加深和蔓延,再度说明商铺租金并非由单因素决定而是多种影响因素共同作用的结果。
图7
 新窗口打开|下载原图ZIP|生成PPT
图72019年南京主城优质公共资源与保障房分布
注:根据南京市住房保障和房产局提供数据整理。
Fig. 7Distribution of high-quality public resources and security housing in primary urban areas of Nanjing in 2019
4.4 内生影响因素的作用
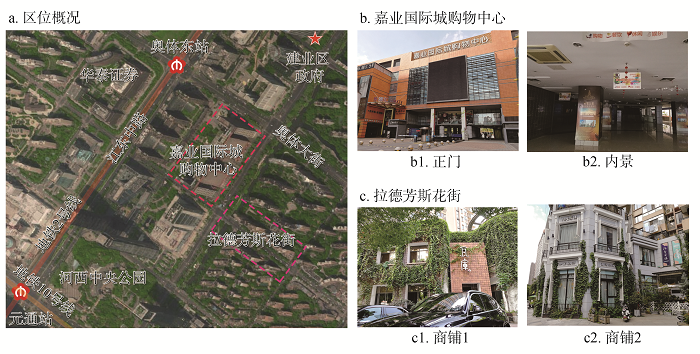
除上述外部影响因素以外,商业地产项目的商业业态、经营模式、建设管理水平、目标群体定位等难以量化的内生因素同样会对商铺租金产生重要影响[20,21,22,23,24],即使是空间毗邻的商铺,也可能因微区位、面积、楼层、朝向、装修程度等不同而造成租金差异。本文以河西新城的嘉业国际城购物中心和拉德芳斯异国风情花街为例(图8),阐释商业地产内生因素对于商铺租金的作用。图8
 新窗口打开|下载原图ZIP|生成PPT
图8嘉业国际城购物中心、拉德芳斯花街对比
注:由作者谷跃于2020年10月在南京河西新城拍摄。
Fig. 8Comparison of Jiaye International Town Shopping Centerand La Défense Flower Street
嘉业国际城与拉德芳斯花街同处河西中央商务区黄金地段,位于地铁2号线奥体东站与元通站之间,周边分布着大量高端住宅,以及中央公园、明基医院、新城小学等优质公共服务资源,商业区位与配套环境俱佳(图8a)。不同的是,嘉业国际城(图8b)一度是河西体量最大的商业体,但近年来该商场出现品牌档次较低、业态布局混乱、缺乏特色鲜明的卖点、服务设施老旧等问题(图8b1、图8b2),不能满足河西地区高购买力人群的消费需求,导致人气惨淡,商铺经营困难,2019年商铺平均租金仅为106元/(月·m2),成为河西商铺租金的“洼地”;反观一街之隔的拉德芳斯花街(图8c),采用差异化定位,主营高端西餐、东南亚料理、洋房火锅、主题酒吧、清吧、高级茶社等富有异国风情特色且符合周边职住人群消费品味的高端餐饮业态(图8c1、图8c2),享有上佳的口碑和颇高的人气,2019年商铺平均租金高达264元/(月·m2),是河西平均租金的1.8倍。由此可见,商铺自身的定位、特色与经营品类等内生因素,通过营造差异化的商业形象和消费体验,深刻影响着消费层次和商铺租金的高低。当然,受数据和方法的限制,本文对内生因素的研究目前主要以对个案的定性分析为主,具有一定的探索性,期待后续的研究能够在定量分析方面进一步深化。
5 结论与讨论
本文以南京市中心城区的商铺租金为研究对象,利用核密度分析、莫兰指数等空间分析方法探究商铺租金的时空演化格局,并运用地理探测器进一步挖掘主城商铺租金背后的影响因素,得到的结论如下:(1)南京中心城区商业空间分布表现出以新街口为核心向外围圈层递减的“核心-边缘”结构,以新街口为核心的高密度区中心极化趋势日益加剧,各次级商业点的集聚态势逐年加强,逐步形成等级鲜明的商业空间体系。
(2)南京中心城区商铺租金呈现出较为明显的时空分异格局。2010—2019年南京中心城区商铺平均租金的变化趋势具有前期平稳增长、中期显著下降、后期迅速回升的特点。主城区商铺平均租金始终最高,且与副城的差距逐渐拉大。
(3)南京主城商铺租金在空间上具有显著的依赖性与集聚性。商铺租金空间集聚强度呈现出“增强-减弱-再增强”的演变特征,各区域间租金分化趋势日益加剧。租金的冷热点区分布具有典型的圈层结构,且易出现在地铁沿线附近。
(4)交通区位和消费潜力是影响主城区商铺租金的关键外部因素,而商业业态、经营模式等内生因素同样会对商铺租金产生影响。商铺租金的影响因素较为复杂,各种因素间相互关联、相互作用最终形成了南京主城商铺租金空间分异格局。
综上所述,商铺租金对空间环境的敏感性较高,充满活力的商圈不仅需要拥有便捷的交通区位,更需要良好的商业环境去吸引客流,优质的公共服务配套能够更快地集聚商业资源[46],而优质配套匮乏所引发的街区功能单一、人气不足、商业氛围淡薄等问题往往会成为制约商圈发展的瓶颈。另一方面,地铁的普及极大地压缩了消费者的出行距离,使得购物的空间成本急剧下降,而拥有绝佳的地理区位却濒临倒闭的商业案例不在少数,这意味着“地段为王”已经不再是商铺投资的铁律,互动式的消费体验和身临其境的社交氛围才是实体店无可替代的核心竞争优势。因此,规划部门在进行商业规划时应充分考虑周边环境的“软实力”建设,注重良好商业生态的构建,避免形成商业空间上的马太效应;商铺投资经营者则亟需转变经营理念,更加关注多元化、个性化的消费诉求,培育与周边消费氛围相契合的商业业态,努力提升消费体验,抓住当下国内经济内循环的机遇,实现线下商业的成功破局。
值得注意的是,商铺租金的形成机理是复杂的,是由多种要素综合作用而成的,本文虽然综合考虑了内外部因素的影响,但受数据获取的限制只是初步分析了部分可能的影响因素,缺乏对租约特征、业态组合、商业竞争关系等非空间因素的详细研究。除此之外,商铺的种类繁多,不同类型的商铺所受的影响因素也会有所区别,在今后的研究中将对这些方面加以完善,更深入地探索商铺租金的形成机理。
致谢:
真诚地感谢评审专家的指导和帮助,特别是在商铺租金影响因素的指标选取和结论探讨方面的修改意见,使本文获益匪浅,谨致谢忱!参考文献 原文顺序
文献年度倒序
文中引用次数倒序
被引期刊影响因子
DOI:10.11821/dlyj201802010 [本文引用: 1]

商业网点的空间集聚与分散是零售商业活动的重要表现,其合理化布局对发展城市经济、满足居民消费需求发挥着重要作用。基于核密度估计、区位熵指数及Ripley's K函数分析法,以长春市中心城区商业类城市兴趣点(POI)数据为基础,在分析城市商业空间格局特征的基础上,进一步从行业空间分异的视角,研究城市商业空间的行业分布及集聚特征。结果表明:① 长春市商业网点空间分布的集聚特征显著,并呈现多中心的分布形态,基于道路格网单元的商业网点热点区分布与识别的商业密度中心分布总体一致;② 不同商业中心表现出不同的等级规模差异,整体等级规模结构较为合理;③ 零售行业视角下的城市商业空间“中心—外围”分异明显,且不同行业表现出了不同的空间集聚模式;④ 各行业多尺度的空间集聚表现不同,综合零售、家用电器等行业区位选择的空间尺度范围较大,纺织服装、文化体育等行业区位选择的尺度范围较小;⑤ 行业视角的专业化功能区块差异显著,成熟区块呈现多功能要素、多优势行业集聚特征,发展中区块功能较为单一。
[本文引用: 1]
Commercial activity and its spatial structure are one of the important issues in urban geography and economic geography. The study of the industrial structure of commercial space helps to understand the formation of spatial structure of economic activities. In recent years, with wide use of geographical big data, it has become a new trend to study the spatial structure and location choice of commercial sites with a quantitative method. Based on the commercial POI (Point of Interest) data in the central district of Changchun, the study focuses on eight types of retailing industry: synthetic retail trade; food beverage and tobaccos; textiles, garments, doily consumer articles; culture and sports appliances and equipments; medicines and medical appliances; motor vehicles fuel and parts; household electric appliances and electronic products; hardware, furniture and decoration materials. The spatial pattern and its industrial distribution of commercial space were discussed in detail using kernel density estimation, location entropy analysis and Ripley's K function. The results show that: (1) the agglomeration of commercial sites is significant, and presents the multi-center pattern. In general, there are two main agglomeration centers: one is the "horseshoe-shaped" pattern with Railway Station, Renmin Squre, and Dama Road commercial centers in the core area; the other is the "islands" pattern with Hongqi Street, Guilin Road, etc. in the peripheral area, and the density centers show the gradient descending from the center to the periphery. (2) The hierarchical structure of the scale size is reasonable, which is mainly reflected in the stage of gathering from the single center to multicenter. There are more the first and second grade centers, and less third grade centers, while the third still presents the feature of small scale and slow development. Compared with the traditional commercial center grading, some regional commercial centers show significant scale advantage, and the quantity grade of commercial sites is higher than that of some of municipal-level commercial centers. (3) From the industry perspective, "core-periphery" spatial distribution of urban commercial space is obvious. The type of textile and apparel, food and beverage industries have high density agglomeration in core circle, while the automobile motorcycle, hardware furniture type is in surrounding regions, the others have a large scale of space density distribution, and show different spatial distribution patterns. (4) Each industry has different performances in multi-scale spatial agglomeration. Synthetic retail, household electric appliances, food beverage and tobaccos, medicines and medical appliances show the agglomeration features a large scale, with a wide range of location selection. Culture and sports, textile and apparel, hardware furniture and automobile motorcycle industries are located in a small space, with smaller location choice space. (5) Each industry has formed certain specialized function blocks, but has different regional specialization degrees. The mature districts generally have more advantage industries and more functions, while the function pattern of developing districts features a distinct single-focus approach.
[本文引用: 1]
[本文引用: 1]
URL [本文引用: 1]
DOI:10.11821/dlyj201509007 [本文引用: 1]
中国城市服务业职能特征研究可为构建合理的城市服务业职能规模结构、行业结构和空间结构及各城市服务业差异化发展提供科学依据。以中国287个地级及以上城市为单元,应用纳尔逊方法、城市服务业流量测度模型、服务业行业B/N比和空间自相关等方法,定量测算各城市服务业职能规模、专业化部门、职能强度,分析各服务业行业的分工水平、演变趋势和空间格局。研究表明:① 对外服务业输出流量高度集中于高级服务业中心,各等级服务业中心的服务业职能结构差异较大;② 城市服务业输出和输入流量规模在地带性尺度上都呈“东中西”三级递减空间格局。城市服务业输出流量空间没有显著集聚区域,而城市服务业输入流量空间上有弱集聚特征,呈“大分散小集中”格局,集聚城市呈“群”状分布,与重要城市群分布较一致;③ 各服务业行业分工强度存在差异,服务业整体分工在深化,具体行业分工有快速深化、缓慢深化、稳定三种类型;④ 服务业输入流量规模集中性比较低,各城市有普遍服务业需求,应根据需求类型采取不同发展策略。
[本文引用: 1]
A study of the functional features of China's urban service industries can provide scientific support for the development of the urban service sector to an appropriate scale, industrial make-up and spatial structure, and for exploring different routes for development from city to city. Based on a survey of 287 cities at prefecture level and above in China, this paper uses Nelson methods, flow measurement models, B/N ratio and spatial autocorrelation to conduct quantitative research on the functional scale, specialized units and functional strength of urban service industries in various cities in China. It presents an analysis of the level of labor division, development trends and spatial patterns of different service industries. The research demonstrates that China's exported services are highly concentrated in high-end service centers, and that the functional structures of service centers at various levels differ sharply. Geographically, both the import and export of urban services progressively diminish in scale from eastern to central and western China. Sources of exported urban services show no tendency to concentrate in a certain area, but the import of urban services displays a slight concentration in space, where cities are clustered in the same way as major urban agglomerations of China. In different service industries, the levels of labor divisions vary, but are deepening overall. Finally, it was found that imported service industries are of relatively low concentration, and because all cities demand the development of service industries, it is asserted that tailored development strategies should be taken in individual cities.
[本文引用: 1]
[本文引用: 1]
URL [本文引用: 1]
URL [本文引用: 1]
[本文引用: 1]
[本文引用: 1]
DOI:10.1080/10835547.2004.12091137URL [本文引用: 1]
[本文引用: 1]
[本文引用: 1]
URL [本文引用: 1]
[本文引用: 1]
DOI:10.1080/10835547.2005.12091160URL [本文引用: 1]
[本文引用: 1]
URL [本文引用: 1]
URL [本文引用: 1]
DOI:10.1080/10835547.2005.12091158URL [本文引用: 1]
DOI:10.15793/ksprURL [本文引用: 1]
[本文引用: 2]
URL [本文引用: 2]
[本文引用: 2]
[本文引用: 2]
[本文引用: 2]
[本文引用: 1]
URL [本文引用: 1]
[本文引用: 1]
[本文引用: 1]
[本文引用: 1]
URL [本文引用: 1]
[本文引用: 2]
URL [本文引用: 1]
[本文引用: 1]
以2001-2012 年扬州中心城区各居住小区的住宅平均单价为基本数据,通过建立住宅价格总体分异测度指数(GDI) 计算其总体分异趋势及各住宅类型内部的分异趋势;采用核密度函数等方法探索住宅价格的分布形态和分异格局的演变规律;利用趋势面分析不同住宅类型价格的空间分异趋势;基于上述结果总结空间分异的演变模式,并分别探索空间分异与格局演变的驱动力。结果表明:① 2001 年以来扬州市住宅价格差距显著增大,分异趋势在波动中增强,与城市住宅均价的年增长率耦合;住宅价格呈现西高东低的空间分异格局,同档次价格小区由空间集聚转为相对分散,高、低价格住宅区分别沿固定扇面由中心向外围扩散。②不同住宅类型内的价格分异走势差别显著,各类型住宅间的价格趋势面差距明显,但其空间形态类似。③ 空间分异模式由2001 年西高东低的扇形同档次价格集聚式分异转变为2012 年扇形与圈层相结合的多档次价格混合式分异。④ 2001 年以来住宅价格总体分异的核心驱动力是城市居住空间的迅速扩展、居民收入差距的增大、房地产市场的繁荣和住宅类型的多元化,其住宅价格空间格局演变的驱动力为城市发展方向的确立与变化、特定住宅类型建设的区位指向和古城保护、旧城改造与新区建设。
[本文引用: 1]
Urban housing price differentiation is an important issue in urban geography. However, relatively little analysis is available on continual time for all types, and all space. In China's high housing price times, housing price has become the core issue which was paid close attention by the government and inhabitants. The focus of this research is to examine global differentiation, spatial differentiation, model evolution and dynamics of housing prices in Yangzhou. Housing prices data for housing estates in the period 2001-2012 were used. Global differentiation index (GDI) was established to measure the trend of global and within-group differentiations on housing prices in Yangzhou. Then based on kernel density estimation (KDE), the evolvement rule of distribution shape and differentiation pattern of housing price is examined. After that, the trend of spatial differentiation of 6 types housing prices was captured by trend analysis. Finally, the model and dynamics of spatial differentiation and pattern were summarized according to the above results. The results show that: (1) there have been increasing gaps among housing estates since 2001. In this period, the trend of differentiation has showed an upward fluctuation, which is coupled with the annual growth rate of housing price. Moreover, there exists a sector pattern of western-eastern differentiation. The spatial distribution of housing estates of homogeneity price turned cluster in 2001 into dispersion in 2012. Meanwhile, high price and low price housing estates are expanded along particular directions from core to periphery; (2) the fluctuations of prices on 6 types housing are obviously different. And their price levels are unequal, but their shapes of trend are similar; (3) the spatial model that is sector of western-eastern differentiation with cluster on housing estates of homogeneity price in 2001 has been turned into sector and concentric circles integrated on housing estates of heterogeneity price in 2012; (4) the core dynamics of global differentiation on housing price exert great influence on rapidly expansion of urban residential land, widening of residents' income gap, boom of real estate market, and diversification of housing types. The main dynamics of the enrollment of spatial pattern on housing price are as follows: the formulation and change of direction for urban development, locational direction on dwelling construction of particular housing types, ancient city protection, urban redevelopment and new urban district construction.
DOI:10.11821/dlxb201608004 [本文引用: 1]
以2014年中国2872个县级单元的住宅平均单价为基本数据,通过空间自相关和核密度函数分析中国住宅价格的差异格局、空间关联特征和分布形态,构建“住宅价格等级金字塔”;根据“需求+供给+市场”的三维理论视角建立包括5大住宅价格差异影响因素在内的价格模型,采用地理探测器分析全国及其区域子市场的影响因素强度差异,并探索其影响机制。结果表明:① 中国区域住宅价格呈现以行政等级性为主、空间集聚性为辅的双重差异格局,其空间关联与集聚性显著;② 中国住宅价格呈现出房价越高,区域越少,所居住城镇人口越少的“金字塔式”等级分布特征。③ 租房户比例、流动人口规模、住房支付能力、住房市场活跃度、土地成本是中国住宅价格差异的5个核心影响因素,不同行政等级子市场的影响因素作用强度各异。
[本文引用: 1]
In contemporary China, housing price has become the vital issue, which attracted considerable attention from the governments and inhabitants. However, there are relatively few studies on spatial differentiation of housing prices in China at the county level. In addition, there is no unanimous conclusion on the main factors influencing spatial differentiation of housing price. To meet this deficiency, using spatial autocorrelation and kernel density function, this study examines the spatial differentiation pattern, spatial correlation characteristics and the distribution shape of housing prices in China, and constructs the 'Pyramid of Housing Price Grade' based on the average housing prices of China's counties in 2014. Furthermore, a housing price model is established according to the demand-supply-market theory in order to explore the impact factors, and intensity differences of the influencing factors are also analyzed. The main conclusions are as follows: (1) There exists significant spatial correlation and agglomeration of housing prices in China's counties, and the differentiation patterns are featured by the administrative grade and the spatial agglomeration simultaneously; (2) The housing prices present pyramid-ranked distribution in China. This finding indicates that the higher the housing price, the less the urban population. (3) The proportion of rental households, scale of the floating population, housing affordability, housing market activity and the cost of land are five core influencing factors of housing prices in China's counties. The intensities of these influencing factors vary across administrative grade sub-markets.
[本文引用: 1]
DOI:10.10282/dqxxkx.2018.180072 [本文引用: 1]
以南京市“一主三副”住宅小区为研究单元,运用GIS中的渔网(Fishnet)分析和探索性空间数据分析(ESDA)对“一主三副”住宅租金的空间分布进行模拟和估计,并利用地理探测器模型从住宅小区的区位特征、建筑特征和邻里特征3个方面探究住宅租金空间分异的影响机制。结果表明:① 南京市住宅租金总体呈上升趋势,空间上表现出主城向副城递减的中心外围模式,住宅租金空间结构逐渐由单核向双核发展,且住宅租金存在显著的空间异质性;② 住宅租金呈现出明显的空间正相关性和区域集聚性,热点区自内城核心区至副城趋于弱化,冷热点空间格局呈圈层结构;③ 交通位势和中心位势是对一主三副住宅租金解释力最大的因素,商务配套、金融设施和住宅房龄的解释力次之,特征因素对主城副城租金的影响强度各异。
[本文引用: 1]
DOI:10.11821/dlxb201701010 [本文引用: 1]
空间分异是自然和社会经济过程的空间表现,也是自亚里士多德以来人类认识自然的重要途径。地理探测器是探测空间分异性,以及揭示其背后驱动因子的一种新的统计学方法,此方法无线性假设,具有优雅的形式和明确的物理含义。基本思想是:假设研究区分为若干子区域,如果子区域的方差之和小于区域总方差,则存在空间分异性;如果两变量的空间分布趋于一致,则两者存在统计关联性。地理探测器q统计量,可用以度量空间分异性、探测解释因子、分析变量之间交互关系,已经在自然和社会科学多领域应用。本文阐述地理探测器的原理,并对其特点及应用进行了归纳总结,以利于读者方便灵活地使用地理探测器来认识、挖掘和利用空间分异性。
[本文引用: 1]
Spatial stratified heterogeneity is the spatial expression of natural and socio-economic process, which is an important approach for human to recognize nature since Aristotle. Geodetector is a new statistical method to detect spatial stratified heterogeneity and reveal the driving factors behind it. This method with no linear hypothesis has elegant form and definite physical meaning. Here is the basic idea behind Geodetector: assuming that the study area is divided into several subareas. The study area is characterized by spatial stratified heterogeneity if the sum of the variance of subareas is less than the regional total variance; and if the spatial distribution of the two variables tends to be consistent, there is statistical correlation between them. Q-statistic in Geodetector has already been applied in many fields of natural and social sciences which can be used to measure spatial stratified heterogeneity, detect explanatory factors and analyze the interactive relationship between variables. In this paper, the authors will illustrate the principle of Geodetector and summarize the characteristics and applications in order to facilitate the using of Geodetector and help readers to recognize, mine and utilize spatial stratified heterogeneity.
DOI:10.11821/dlyj020200272 [本文引用: 1]
以粤港澳大湾区58个县区单元的住房平均租金为基本数据,通过“住房租金等级金字塔”构建、租金空间格局展示、空间自相关分析、跨境租金差距对比、售租比研究等方法总结粤港澳大湾区住房租金的空间差异格局与特征。从“租赁需求+城市基本面”的理论视角构建由新增人口、人均住房面积、收入水平、经济水平、产业结构、学历结构组成的租金差异影响因素模型。通过模型对比,采用空间滞后模型测度粤港澳大湾区住房租金的主要影响因素,并基于地理探测器分析其因素的影响强度差异。结果表明,粤港澳大湾区住房租金总体呈现以港澳与珠三角九市之间的境内外差异为主、以广深核心区与其他区域差异为辅的双层次差异格局。跨境租金差异程度最高,广州、深圳、珠海的“售租比”较高;收入水平、经济水平、人均住房面积和产业结构对粤港澳大湾区的住房租金差异有显著影响,其中,收入水平的影响强度最高。
[本文引用: 1]
"Livability" is at the core of building a high-quality living circle in the Guangdong-Hong Kong-Macao Greater Bay Area (GHMGBA), and the excessive housing burden costs have become an important obstacle to livability. The differentiation of the rental market is an indispensable and important part of the housing market in the GHMGBA and is inseparable from the creation of a livable life circle. Based on the average housing rent of 58 counties in the GHMGBA, this study summarizes the patterns and characteristics of the spatial differences in housing rents through the construction of a “grading pyramid of housing rents”, and displays the spatial pattern of housing rents through spatial autocorrelation analysis, cross-border rent gap comparison, and price-to-rent ratio analysis. From the theoretical perspective of leasing demand and urban fundamentals, this study constructs a model of factors influencing rent differences, consisting of population growth, per capita housing area, income level, economic level, industrial structure, and education structure. Through model comparison, a spatial lag model was used to measure the main factors influencing the housing rents in the GHMGBA. Based on the geographical detector, the study further analyzed the differences in the intensity of the factors' influence. The results showed that the housing rents in the GHMGBA generally presented a two-level difference pattern. The pattern was dominated by domestic and foreign differences between Hong Kong, Macao, and nine cities in the Pearl River Delta, as well as the differences between the core areas of Guangzhou, Shenzhen, and other regions. The cross-border rent difference was the highest. Higher price-to-rent ratios were observed in Guangzhou, Shenzhen, and Zhuhai. Income level, economic level, per capita housing area, and industrial structure had a significant impact on housing rent differences in the GHMGBA. Among them, income level had the highest impact intensity. This study responds to cross-border regional differences within the country from the perspective of housing rent. Cross-border differences are not only reflected in the population′s economic, income, and institutional levels, but also in the housing rent. The key issue for the regional linkage development of the housing market in the GHMGBA and the construction of a livable and quality living area is the coordinated development across borders.
URL [本文引用: 1]
URL [本文引用: 1]
DOI:10.11821/dlyj020171052 [本文引用: 1]
城市交通网络的发展是城市空间扩展的重要表征和驱动力。以1936—2015年间6个代表性年份的城市交通地图为数据源,提取相应年份南京城市轴线图,利用基于空间句法的整合度、城市扩张强度(SS-EII)和智能度指数,分析1936年以来南京城市空间扩展趋势和特征,划分演化阶段,并分析城市加速扩张阶段的空间扩展质量。结果表明:① 南京城市空间扩展大体经历了滞缓(1936—1971年)、复兴(1971—1982年)和加速(1982—2015年)三个阶段,逐渐突破老城区,向西南、东北、南部和西北实现全方位空间扩展,形成多中心空间结构。② 加速阶段空间扩展质量总体较高,交通网络建设逐渐与用地扩张相协调,并开始引导城市空间多中心扩散,但各中心间有机联系不足,导致城市空间整体性和空间效率有所降低。③ 应进一步加强多中心间的交通联系,促进人口、经济有机疏散,并提高城市空间整体性。
[本文引用: 1]
The development of urban road network is one of the main driving forces of urban spatial expansion. Based on the urban traffic maps in 1936, 1949, 1971, 1982, 2001 and 2015, the urban axis maps of Nanjing were extracted for the corresponding years. With the Integration Index, Urban Expansion Intensity Index (SS-EII) and the Intelligence Index, which are all based on spatial syntactic analysis, the trends, characteristics and evolution stages of urban spatial expansion in Nanjing from 1936 to 2015 were analyzed, and the spatial expansion quality at the accelerated expansion stage was discussed. The results are as follows: (1) In the 80 years, the urban road network of Nanjing has been integrated into a whole from the original regional isolation, and the primary and secondary roads tend to be clear and neat. The early urban area was composed of Xinjiekou as the single center, and along the north-south, east-west and northwest major roads respectively, the urban area gradually expanded, forming a multi-center spatial structure. (2) The urban spatial expansion in Nanjing experienced three stages, that is stagnation (1936-1971), revival (1971-1982) and acceleration (1982-2015), and achieved an all-round expansion to the southwest, northeast, south and northwest. At the stagnation stage, the urban space maintained one single center, mainly along the northwest, southeast and northeast axes, there was slow infilling within the old urban area. At the revival stage, the urban space broke through the boundary of the Ming City Wall to expand in four directions, and some small-scaled regional centers gradually appeared in the northwest and south of city. At the acceleration stage, the urban space greatly expanded along the northeast-southwest and northwest-southeast axes, resulting in the urban multi-center structure. (3) At the acceleration stage, the quality of spatial expansion was generally high. The construction of transportation network followed the expansion of urban land use, and gradually caught up and matched with it, even begun to lead the directions of multi-center diffusion in the city. However, due to the lack of traffic links among the multi-centers, the integrity and spatial efficiency of the urban space generally declined. In summary, the general trends and characteristics of long-range and large-scaled urban spatial expansion can be reflected by analyzing the evolution of road network and SS-EII, and the urban multi-centers and their evolution can also also accurately extracted. Compared with L-EII, R-EII and the Intelligence Index, the quality of urban spatial expansion can be also evaluated. In view of the current lack of links between urban multi-centers, in the future, the traffic links between the urban centers and the sub-centers, as well as between the sub-centers, should be further strengthened, so as to improve urban traffic efficiency, organically decentralize the urban economy and population, as well as improve the organization integrity of urban multi-centers. In the future study, further considerations should be given to the impact of road attributes and subway networks on the topological relationship of the axis map and the accessibility of urban space.
DOI:10.11821/dlyj020181290 [本文引用: 1]
以城市居民最低生活保障统计数据为基础,运用ESDA的方法,探讨2000—2017年南京城市户籍贫困人口的时空分异格局,并从居住空间分异的视角出发,归纳总结出南京城市户籍贫困空间格局的演化过程与机制。研究表明:① 贫困人口的空间分布沿袭了2000年“大分散,小集中”的特点,且分布状态进一步趋于分散,空间集聚则呈现出“核心-边缘”结构,“核心”即热点区域基本都位于绕城公路以内;② 未成年、无业、有就业能力(尚未正式就业)和刑释解教的贫困群体,尤其是刑释解教且无业的贫困群体,是当下城市贫困空间治理重点关注对象;③ 相比于2000年,目前南京城市户籍人口的贫困地域产生了明显分异,可划分为隐蔽型、安置型和复合型三种类型贫困人口聚居区;④ 在政府职能、市场机制和社会行为的交织作用下,南京城市户籍贫困空间重构的同时,也经历了从显性到隐性的转向。
[本文引用: 1]
Urbanization has exprienced rapid development in China since 2000. In the course of time, urban social space has been changed and reconstructed, which means that the urban poor is demonstrating a new spatial pattern. At present, significant portions of domestic urban poverty space studies mainly remain in the period of 2000 or so. Based on the MLSPU (Minimum Living Standard Programme for Urban residents) recipient data, this paper explores spatio-temporal pattern of urban registered poor of Nanjing in the new period by the method of ESDA (Exploratory Spatial Data Analysis). On this basis of previous related studies, this paper summarizes spatial evolutionary process and mechanism of urban registered poverty of Nanjing in the perspective of residential differentiation. The results are obtained as follows. (1) Spatial distribution of the urban registered poor has followed the pattern of dispersion globally and concentration locally of 2000, which tends to be further dispersive. Spatial agglomeration of the urban registered poor presented a core-periphery structure while the core namely hotspot region was located within Nanjing belt highway. (2) In the context of high-speed growth of national economy, both urban poor population composition and urban poverty space governance have witnessed a transformation process. The underage, unemployed, employable (not yet formally employed) and released poverty groups, especially the unemployed as well as released poverty group, are the focus of urban poverty space governance at present. (3) Compared with the year 2000, urban registered poverty-stricken area of Nanjing has obvious differentiation in the new period, which can be divided into three types: concealed, resettled and mixed. It is the consequence of urban expansion and reconstruction. (4) Under the interaction of government functions, market mechanism and social behavior, urban registered poverty space of Nanjing has emerged at the turning point form visible to invisible while it has been reconstructed. On the hand, the original dilapidated shanty towns or old neighborhoods have been renovated to a certain extent, and hidden between modern city landscapes. On the other hand, urban poor almost have migrated to security housing, where the living condition is quite different from that of commodity housing.
DOI:10.11821/dlxb202002015 [本文引用: 1]
商业绅士化是指城市中传统商业、居住或工业被更高价值商业取代和置换的现象,与居住绅士化互为因果。由于城市发展阶段、模式和管制环境不同,不同国家和地区商业绅士化社会空间特征表现出显著差异。20世纪末以来,在城市社会空间转型语境下,具有异域风情的餐厅、酒吧、咖啡馆、健身房等高档消费场所置换传统住宅或社区商业并在城市特定空间中集聚,是中国最典型的商业绅士化现象。遴选出符合商业绅士化特征的六类高端商娱场所,采用空间核密度等方法,对2008年和2018年南京内城上述商娱场所空间集聚、演进模式和机理效应进行分析。研究发现:① 商业绅士化“热点区”首先出现在城市传统商业中心和文化历史街区,随后向商业中心周边和新兴商业地段跳跃式扩散;② 根据实践路径差异,可将南京内城商业绅士化分为整体植入式、侵入演替式和转型升级式三种模式,分别以1912街区、南京大学—南京师范大学(南大—南师大)片区和新街口地区为代表;③ 经济和文化力量在推动商业绅士化的发生演化中均发挥重要作用,其中地方政府、资本联手对“商业租差”的追逐,以及年轻、高收入绅士化群体日益增长的时尚、高端文化消费需求,从供需两端驱动着商业绅士化过程;④ 商业绅士化在提升城市商业活力和经济效益的同时,也在一定程度上产生对原住居民和低端商业的排挤和置换效应。
[本文引用: 1]
Commercial gentrification has been a research frontier of gentrification. It refers to the phenomenon that the traditional business, residence or industry is replaced by business with higher value in the city. Its connotation includes: (1) renovation and renewal of commercial environment and material landscapes; (2) realization of the rent gap of commercial space; (3) the upgrading and succession of business and consumption culture; (4) advanced replacement of business and consumer groups. The social spatial characteristics of commercial gentrification show differences in different countries and regions, for different stages, modes and regulatory environments of urban development. Under the influence of economic globalization and western-style consumer culture, traditional residence or community business was replaced by restaurants with exotic customs, bars, cafes, gyms, and other high-end consumer places, which mainly meet the growing needs of the middle-class consumer groups. They gathered in the specific space of the city since the end of the 20th century. This is the typical commercial gentrification in China, which is a business upgrading and replacement process that meets higher consumer demand. Commercial gentrification in China has a more intense process, as well as a wider range of impact, than that in European and American countries. The paper conducts a kernel density analysis of the six high-end entertainment establishments in the inner city of Nanjing in 2008 and 2018. The result shows that: (1) the "hot spots" of commercial gentrification first appear in the traditional commercial centers and historic conservation areas, and then spread to the periphery of commercial centers and new commercial areas; (2) according to the difference of practice path, commercial gentrification in inner Nanjing can be divided into three modes of holistic implantation, invasive succession, and transformation and upgrading, which are respectively represented by 1912 blocks, NJU-NNU area and Xinjiekou area. Both economic and cultural forces play an important role in promoting the evolution of the three modes of commercial gentrification. The process of commercial gentrification is driven by both the supply side and the demand side, including the facts that local government and capital join hands to pursue commercial rent gap, as well as that young and high-income gentrification groups have a growing demand for fashion and high-end consumption. Commercial gentrification has promoted the business vitality and economic benefits of the city. Also, it has affected the authenticity of the historical blocks, the inclusiveness of the commercial space and the fairness of the space production to a certain extent, for its exclusion and displacement produce effects on the residents, and the low-end business and consumer groups. Commercial gentrification involves cultural identity, quality of life, consumption experience and status symbol, meaning that it has more complicated social spatial connotation than residential gentrification. Consequently, it is urgent to conduct a more systematic study on the phenomenon of commercial gentrification in China.
[本文引用: 1]
[本文引用: 1]
[本文引用: 1]
[本文引用: 1]
[本文引用: 1]
[本文引用: 1]
DOI:10.11821/dlyj020191108 [本文引用: 1]
空间破碎化是城市空间结构研究亟待深化的重要课题。从形态、联系以及功能3个维度构建城市空间破碎化测度指标,并运用地理探测器模型,探讨长沙城市空间破碎化的格局特征及其影响因素。主要结论:① 城市空间破碎化可从形态分割、联系阻隔、功能失序三方面进行测度,形态分割可用平均地块面积指数表征,联系阻隔可用平均阻抗指数刻画,功能失序可用功能多样指数、邻接冲突指数来反映;② 长沙城市空间破碎化呈现圈层式分异为主、扇形扩展分异为辅的格局特征,低破碎化区主要分布在城市核心区,高破碎化区沿着特定的扇面向外围扩展,且主要分布在大型封闭社区、工业园区、山地绿地及大型站场等区域;③ 长沙城市空间破碎化的空间分异是多因素综合作用的结果,其中海拔、坡度等自然因素是基础因素,土地价格、人口密度、设施投入是主导因素;④ 长沙城市空间破碎化治理可从突破市场供给约束、市场需求约束和设施丰度约束三方面着手,采取针对性调控对策,以最大程度地消减空间破碎化带来的负面效应。
[本文引用: 1]
Space fragmentation is an important issue to be deepened in the study of urban spatial structure. The measurement index of urban space fragmentation is constructed from three dimensions of form, connection and function, and its pattern characteristics and influencing factors in Changsha are discussed by using geographical detector model. The main conclusions are as follows: (1) fragmentation of urban space can be measured from three aspects: morphological segmentation, contact barrier and functional disorder. Morphological segmentation can be characterized by mean block area index (MBA), contact barrier can be featured by average impedance index (AI), and functional disorder can be reflected by functional diversity index (FD) and adjacency conflict index (AC). (2) The spatial fragmentation of Changsha presents a pattern of circle-shaped differentiation and fan-shaped expansion differentiation. The low-fragmentation area is mainly distributed in the urban core area, while the high-fragmentation area extends to the periphery along specific sectors, and is mainly distributed in large-gated communities, industrial parks, mountain green areas and large railway stations. (3) The spatial differentiation of urban space fragmentation is the result of the joint action of multiple factors, among which the natural conditions such as altitude and slope are the basic factors, while land price, population density and facility input are the dominant factors. (4) The governance of urban space fragmentation in Changsha should break through the constraints of market supply, market demand and facility abundance. In order to reduce the negative effect of space fragmentation, the corresponding countermeasures should be adopted.
