
河南大学环境与规划学院,开封 475004
The origin and application history of statistical analysis of spatial data
ZHAOYong收稿日期:2018-04-6
网络出版日期:2018-10-20
版权声明:2018《地理研究》编辑部《地理研究》编辑部 所有
作者简介:
-->
展开
摘要
关键词:
Abstract
Keywords:
-->0
PDF (847KB)元数据多维度评价相关文章收藏文章
本文引用格式导出EndNoteRisBibtex收藏本文-->
主旨聚焦:空间数据统计分析作为地理信息科学的核心,是地理学研究的重要方法。认识它的起源、发展背景和历程,有助于明晰和聚焦空间数据统计分析的研究方向,更好地为实际应用服务。
世界是物质的,物质总是存在于一定的空间中,空间把事物分隔又联系起来。无论是自然界还是人类社会,无论是微观粒子还是宏观宇宙,事物都在相应尺度上有其本身的空间结构以及与外界的联系途径。事物在时间和空间上的普遍规律是科学研究的目的之一。所以在数据分析中,空间是洞察数据,进而是揭示现实世界中事物或现象规律的一个重要视角。并且随着认知的深入,空间问题变得越来越重要。
在研究地理学中的方法和理论时,应从其产生的地理环境、社会经济背景和哲学与科学基础进行分析,才能收温故知新、预测方向之效[1]。所以,要了解空间数据统计分析,应当了解与其相关的发展历史与背景,以及不同阶段的代表性成果、人物和事件等,但系统总结空间数据统计分析的文献不多。下面以时间为主序,力图从宏观背景和微观具体两方面系统梳理空间数据统计分析思想与方法的渊源和发展脉络,并探索其发展趋势。
1 早期孕育
1.1 德国区位论
18世纪末19世纪初,德国依然是一个农业国家,而已经走上工业化道路的英法等国的农产品价格上涨,德国农场主通过与英国的农产品贸易而获利,于是德国农业开始向规模化、产业化过渡。德国经济学家冯·杜能(Johann von Thünen)研究了德国农业经营模式和产业化问题,于1826年写成《孤立国》[2],发现经济活动以城市为中心由内向外大致呈同心圆状分布,大致描述了城市周围农业生产中明显的空间分布特征,从而奠定农业区位论的基础。19世纪末20世纪初,德国完成第一次产业革命后迅速成为第二次产业革命的策源地之一,经济活动和人口在空间上加速向大城市聚集。在此背景下,德国经济学家韦伯(Alfred Weber)于1909年创立了工业区位论,而地理学家克里斯塔勒(Walter Christaller)于1933年提出的中心地理论[3]首次把非生产性的服务业纳入经济活动中,系统探讨了城镇等级、规模及其空间分布模式。1940年,德国经济学家勒施(August L?sch)的《经济空间秩序》[4]把独立的农业区位论、工业区位论扩展为系统的空间经济理论,并对克里斯塔勒的中心地理论进行了扩展。这些著作日益意识到距离对空间行为的影响,经济学和社会科学以空间问题为核心的科学研究,已成为地理学家的范式[5]。
区位论思想通过经济、商业和工业地理学进入美国地理学界,在1950-1960年代被翻译成英文,并被很快接受和得到发展[6]。这期间,美国宾夕法尼亚大学的艾萨德(Walter Isard)和一些同事对经济学家不考虑空间维度的做法日益表示不满,进而想开创一门结合经济学和地理学的新学科[7],并在1956年出版的《区位与空间经济》[8]中将冯·杜能、韦伯、克里斯塔勒、勒施等的模型整合为一个统一框架,尝试建立涵盖空间中分布的所有经济活动的一般化理论,艾萨德也因此被誉为西方区域科学和现代空间经济学的创始人。区位论思想也被一位爱沙尼亚地理学家坎特传到瑞典,坎特的研究助手哈格斯特朗(T?rsten H?gerstrand)使用类似空间观点调研瑞典中部的创新扩散[9]。
1.2 空间数据统计分析的“星星之火”
早在计量革命以前,不同学科领域就有空间数据统计分析方法的思想和实践。在英国,19世纪的工业革命时期发生了四次霍乱流行。1854年霍乱在伦敦第三次流行时,斯诺(John Snow)医生把伦敦SOHO地区的道路、十多个饮水井和六周内因感染霍乱而致死的每一位死者的居住位置等内容绘制在一张地图上[10],发现一个明显的空间特征:死者的居住地集中在布罗得街饮水井附近。政府随后关闭了该水井,本次霍乱流行结束。
在美国,1872年Hilgard计算了美国1840-1870年的人口重心,发现一直在西移[11]。1890年,Drude建议用样方分析方法描述植物在不同空间位置出现的频率[12]。1913年,Priestley发表了野外布置样方的详细方法[13]。1917年,Jefferson把英国的城市和煤矿绘制在一张图上,发现城市在空间上呈现聚集分布[14]。1926年,Lefever用标准差椭圆测度人口分布的空间离散度[15]。1937年,Wright用统计方法描述地理分布的中心趋势[16]。1942年,Blackman提出度量植物空间分布的“分散系数”方法[17]。1948年,莫兰(Patrick Moran)对连接数统计量进行研究[18]。但一些社会****如Neprash[19]、Gehlke等[20]就已经注意到经典统计学不能不加鉴别地应用到空间数据中。
2 1950-1960年代:计量革命
2.1 1950年代:计量革命的兴起
源于1950年代初的计量革命是在二战后随着人口、能源、环境、城市、交通等社会问题的提出,信息论、系统论和控制论新型综合性科学技术的出现,地理学也不可避免地卷入其中的结果[1]。在此背景下,统计学、数学等被引入并促进了地理学的科学化,新地理学在位于美国本土西北部西雅图的华盛顿大学地理系开始发展,被称为华盛顿学派。他们把空间概念作为理解地理学的基础。其计量地理的开端,是引进和发展了德国地理学家克里斯塔勒的中心地理论,领导者加里森(William Garrison)倡导应用统计学和计算机研究和理解空间问题,培养了一批现代地理学名家。他的很多学生(被称为“太空学员”)毕业后在美国重要的地理系中任教,如芝加哥大学、俄亥俄州立大学和密歇根大学等,后来成为新理论、新方法的带头人,如邦奇(William Bunge)、达西(Michael Dacey)、盖蒂斯(Arthur Getis)、托布勒(Waldo Tobler)等[21]。华盛顿大学地理系的另一位著名****厄尔曼(Edward Ullman)认为大多数地理****将焦点集中在人与环境或景观方面的研究,而忽视了经济与社会间的互动才是影响空间分布的主因[22]。华盛顿学派的主要贡献包括从其他科学引入规范的理论、数学和统计方法,并依此来建立形态规律[5],并从瑞典隆德大学地理学家哈格斯特朗那里获益匪浅。哈格斯特朗是地理学理论化、数量化的倡导者之一,也是欧洲与华盛顿学派联系的桥梁。与此同时,位于美国东海岸的哥伦比亚大学,斯特拉勒(Arthur Strahler)教授正在用动态、基于过程的方法改造传统的地貌学研究,当时从英国牛津大学地理学专业毕业的乔利(Richard Chorley)是斯特拉勒的学生,乔利后来把统计学和系统建模方法带回剑桥大学,与儿时伙伴哈格特(Peter Haggett)、哈维(David Harvey)等成为计量革命在英国的重要代表[21]。从1950年代起,伴随计量革命重视数量工具、关注空间关系、注重实用性的思潮,一系列论著开始出现并传播到英国、澳大利亚和加拿大等其他国家,推进了地理学从描述向使用空间分析方法的转变。基于此,地理学家们发展和修正了不同分析方法,探索具有相似性和普遍性的空间问题,努力从地理学的视角描述与表达空间共性规律。这些方法源于不同学科领域(生态学、地理学和采矿工程)、基于不同目标(探索性或推断性)、统计方法(方差—协方差或基于计数的方法)和假设(平稳性或伪平稳性)。计量革命的早期主要是把统计方法引入地理学。如1950年英国牛津大学的澳大利亚籍统计学家莫兰[23]和1954年爱尔兰统计学家吉尔里(Roy Geary)[24]对空间自相关的研究,1951年南非统计学家和工程师克里格(Danie Krige)[25]在用对数正态分布预测矿床含金量时,用样本的几何均值乘以一个与样本量和总体相对变异有关的因子,发现比代数均值更接近真实均值、更稳定。在生态学领域,Clark等提出基于植物个体之间的最近邻距离研究其空间分布模式[26],Grieg-Smith用统计方法解决植物生态学问题并指出对统计方法的误用[27]。Whittle认为与时间序列数据只受过去的影响不同,空间过程受到来自各方向的影响,并基于规则格网构建了空间自回归(SAR)模型研究农产品的产量[28]。哈格斯特朗在1953年写就的博士论文中提出具有重要理论意义的空间扩散问题,激起很多人的研究兴趣[29]。美国地质学家Krumbein等把趋势面分析引入地学领域[30],当时计算机使得多项式回归的计算变得不是那么困难[31]。1956年,Robinson注意到空间数据统计分析中存在的一些问题[32],这可能是1960年代以前研究空间自相关问题的唯一一篇地理学论文[33]。
2.2 1960年代:理论与方法
在地理学计量革命的背景下,空间数据统计分析的热情空前高涨,空间、数学、统计成为关键词,理论与方法成果卓著,尤其是1960年代后期。2.2.1 理论 虽然主要应用数学和统计学,但****们也试图像物理学那样去发现普遍性的规律,使地理学成为“将控制地球表面某些特征的空间分布规律用公式来表达的科 学”[34]。如邦奇的《理论地理学》基本思想十分明确:几何学是地理学的语言[35]。地图对地理学的作用就像数学对其他学科的作用一样,而地理学之所以给空间研究提供巨大能效,就是因为可以找到反复出现的空间现象。所以对地球表层系统的模式分析可能导致一系列关于人类和自然系统行为的形式化理论,而这种理论的发现将把地理学置于坚实的科学基础之上。邦奇在扉页上写到:献给沃尔特·克里斯塔勒,并认为他是理论地理学之父。1964年,Pattison发表论文“地理学的四个传统”,认为地理学研究分为空间传统、地域研究传统、人地关系传统和地球科学传统[36]。虽然四种传统在逻辑上各自独立,但它们共同作用,可以说地理学同时追求四种传统。将四种传统进行各种结合,可以解释地理学领域的常规分类[37]。1969年,哈维针对地理学计量革命中对“最锋利工具”数学和统计学的滥用或误解,出版《地理学中的解释》,引入科学哲学的思想,从方法论角度开拓理论地理学,重点阐述了地理学中的理论、定律和模型的作用,并对地理学中的描述模型、解释模型,以及地理学建模的数学语言、几何语言和概率论语言进行了系统介绍[38]。而寻找更强有力理论支持的经济地理学家开始密切关注区位论,也开始接触新兴的区域科学[39]。
2.2.2 方法 尽管邦奇、哈维及其他一些人认为分析空间形式的语言应是几何学,而这项工作实际上集中于对空间问题运用描述性和推断性的统计学,大多数研究者认为在其他研究领域发展起来的统计手段对地理研究者来说不难接受,一般都认为用标准程序处理空间数据不存在技术问题[5],主要应用统计方法分析点、线、面等地理对象的空间分布模式,强调空间点模式分析、样方分析和最近邻方法[40]。但同时也有一些****认为有必要对这些统计手段进行修正。尤其在1960年代后期,英国布里斯托尔大学有一批研究者开始怀疑地理研究中大多数统计手段的作用,主要问题在于空间自相关,而且较之时间序列数据更难处理:时间过程只有一个方向,而二维空间中点的独立性会受到其四周各个方向的干扰。对空间自相关的认识,表明地理分析中应用经典统计方法的严重局限性[5]。这一时期的论著繁多,典型文献如:哈格特综合考虑了哲学思潮以及地理学概念和方法,是新地理学的范例[41];乔利等着重强调运用科学方法和空间分析技术,发现和解释空间活动(如城市、居住地、经济发展等)的分布模式[42];哈维关注尺度问题[43];Berry等的《空间分析:统计地理学读本》收集了过去十多年计量革命中发表过的有影响的三十多篇论文,对空间数据统计分析方法进行了系统回顾[44]。1969年,英国布里斯托尔大学的地理学家克利夫(Andrew Cliff)和统计学家奥德(Keith Ord)的“空间自相关问题”[45]成为计量地理学处理空间自相关问题的转折点。虽然这不是第一篇思考空间自相关问题的文章,但提出了一般意义上的测度方法,并置于坚实的统计基础之上,成为该领域后续研究的基础,影响深远。为纪念该文发表四十周年,英文期刊Geographical Analysis在2009年第四期出专刊庆祝他们对此做出的突破性贡献。鉴于数学模型和统计方法在地理学中的广泛和精致应用,以及地理学从描述走向解释,1969年Gould使用“新地理学”一词描述该现象[46]。
除了对空间自相关的认识,方法上的另一重要成果是地统计学(Geostatistics)的形成。地统计学是法国统计学家和地质学家马特隆(Georges Matheron)在南非学派克里格等1950年代研究的基础上,结合十多个国家四十多个矿床实践进一步理论化、系统化,提出在空间上进行线性无偏最优估计的方法并命名为克里金(Kriging)[47],由此建立了地统计学的一些基本概念和数理基础,地统计学也作为一门新兴边缘学科诞生,而马特隆的根本贡献是在预测模型中加入了空间效应。
按照加拿大****Burton的说法[48],在1940年代末或1950年代初顺应科学发展潮流兴起的计量革命在1960年代已经结束,很大程度上是非地理学家在很多学科领域所做的工作对地理学影响的结果。这场革命的最大贡献是把地理学从区域特殊性研究转向对地理现象的规律性认识,激起地理****对理论研究的持续关注。
3 1970-1980年代:空间统计学
3.1 1970年代:空间自相关与空间模型
对空间自相关问题的认识最早可追溯到1914年,1950年代前后再次受到人们关注[49],主要由美国华盛顿大学的达西在加里森和厄尔曼指导下进行初步研究,而加里森和厄尔曼受1930年代德国地理学家克里斯塔勒中心地理论的影响很深[50]。这一时期的重要成果,如1970年美国密西根大学地理学家托布勒提出地理学第一定律:“任何事物都是相关的,但距离近的事物比距离远的事物相关性更强”[51]。该定律实际上是对空间自相关的定性描述,并在不同类型的空间数据统计分析中进行了繁简不同的定量化,可以说是空间数据统计分析的基础。《美国地理学家协会年刊》(AAAG)在2004年第二期刊发了对该定律的专门讨论。1973年,克利夫等发表了具有重要影响的开拓性专著《空间自相关》,该书侧重于假说检验,首次简明、全面、详细地提出了识别数据中空间关系的解决方案[52],开启了地理分析的新时代。空间自相关是空间统计学的基础,没有其他概念(如距离衰减、空间相互作用等)像空间自相关那样成为构建空间模型的核心。英国。剑桥大学出版社从1970年代开始,整合工程、地理和统计等领域的****出版了剑桥地理研究系列著作,内容涉及点、线和面的空间过程模型[53]、疾病的空间扩散[54]等。而英国皇家地理协会下属的定量方法研究组(QMRG)则致力于地理学中定量方法的应用,从1975年起到20世纪90年代后期,以“现代地理学方法与技术(CATMOG)”为名发表了系列研究论文五十多篇。1974年,牛津大学的Bartlett在综述基础上系统阐述了点数据、面数据和空间连续性数据的统计分析问题[55],利物浦大学统计学家Besag提出条件空间自回归(CAR)模型[56]。1977年,帝国理工学院统计学家瑞普雷(Brian Ripley)提出并推荐使用K函数对空间点模式进行描述和探索[57],这可能是当时空间点模式分析最重要的研究成果。1978年布里斯托尔大学的哈格特从地理学家的角度论述空间经济学[58],1979年利兹大学的奥彭肖(Stan Openshaw)等阐述了可变面元问题(MAUP)[59]。对于物理学中熵概念的应用,伦敦环境研究中心的威尔逊(Alan Wilson)提出空间相互作用最大熵模型[60],Geographical Analysis在2010年第4期出专刊庆祝该文发表四十周年,伦敦大学学院的Batty也提出空间熵概念与技术[61]。或许,地理学中的最大熵模型具有重新构建“经典”模型的潜力,这些经典模型可以是冯·杜能、韦伯、克里斯塔勒和勒施等关于区位、中心地理论、零售和重力模型等[62]。1977年,Webber扩展了威尔逊的论述,即最大熵模型的目的是从一组数据中获取数据自身的“自然”结论,而没有解释者的偏见[63]。
另外,1975年美国伊利诺伊大学地理系副教授Soot研究了地理分布的中心趋势[64];在国内,杨吾扬等在1978年中国地理学会经济地理专业委员会年会上,陈述和介绍了地理系统理论,促进了中国理论地理学和计量地理学的起步[1]。
3.2 1980年代:空间统计学
这一时期,在前期积累尤其是空间自相关研究成果的基础上,空间统计学发展迅速、应用广泛。瑞普雷认为空间统计学就是对空间模式进行简明清晰的概括[31],但空间模式的类型太多,需要用一个或多个图对其进行概括,而不是像经典统计学那样用均值、标准差等简单概括。克利夫和奥德的《空间过程》[65]是他们之前合著的《空间自相关》[52]的续篇并对其进行了扩展,重点关注空间自相关及其抽样分布。1988年,Griffith的《高级空间统计学》内容除了MAUP与空间自相关外,还包括对空间统计学的理论思考、谱分析、空间分析模拟实验[66]。1989年春季,在美国雪城大学举行了一次持续三个月的学术研讨会,评价了空间统计学过去曾经、现在正在和将来应该扮演的角色,随后出版《空间统计学:过去、现在和将来》读本[67]。国内,张超等编著了计量经济学的基础教材[68],高小真详述了空间相互作用模型的发展与应用[69]。这一时期的空间统计学主要有空间点模式分析、面数据统计学、地统计学三个分支。① 空间点模式分析感兴趣的问题是点在研究区域内的空间分布。如Diggle在1983年的专著中了阐述了各种不同的单变量和多变量空间点模式分析及其空间过程模型,并介绍了在生态学和生物学中的具体应用[70]。该书在2003年出第二版,2014年第三版中加入了点模式分析在空间流行病学中的应用和时空点过程模型等内容。Upton等说明了空间点模式分析在不同领域的具体应用[71]。1987年,英国纽斯卡尔大学的奥彭肖等融合计算机、统计学和地理信息系统(GIS),构建地理分析机(GAM)探索空间点模式的集聚性,并应用于英格兰北部的儿童癌症研究[72]。1989年,中国****周成虎引介了点模式分析[73]。② 面数据统计学基于克利夫和奥德对空间自相关的开创性贡献[52],其结果之一是空间计量经济学的出现。如1979年荷兰****Paelinck等的《空间计量经济学》[74],1979年也因此被安瑟琳(Luc Anselin)[75]称为空间计量经济学元年。空间计量经济学在应用上主要对面数据进行分析,重要成果是1988年美国加州大学圣巴巴拉分校安瑟琳的专著《空间计量经济学:方法和模型》[76]。该书系统阐述了数据的空间依赖性(空间自相关性)和空间异质性(空间结构)及其对模型设定(如空间滞后模型、空间误差模型)、参数估计和统计推断的影响。这本专著被广泛引用,其出版促进了空间问题和空间自相关的研究[50]。值得一提的是,安瑟琳是比利时人,本科和硕士阶段的专业分别是经济学和统计学,后来去美国康奈尔大学在艾萨德指导下于1980年获得区域科学博士学位,在加州大学工作时又与GIS有交叉。③ 地统计学主要用于插值,半变异函数是其核心。1978年,马特隆的学生儒尔奈耳(Andre Journel)等的《矿业地质统计学》深入浅出地论述了地统计学的理论基础[77],将地统计学应用推向成熟。1981年,Henley出版《非参数地统计学》[78],以区别于参数地统计学。1983年,在美国斯坦福大学举办的地统计学专题研讨会上有来自23个国家的****、工程师和学生等一百多人参会,集结参会论文出版的《自然资源地统计学》[79],除了传统的矿业,还涉及水文、土壤科学、污染控制和岩土工程领域的应用。1987年,中国****王仁铎等出版教材《线性地质统计学》[80]。1989年儒尔奈耳在第28届国际地质学大会上的短课程《基础地统计学五讲》[81]出版。而Isaaks等的《应用地统计学导论》[82]无论对于地理学家甚至是地统计学家都是不同寻常、独特和有见地的一本好书,不仅让我们理解不同类型的地统计学工具能干什么,而且指出其局限性。
此外,鉴于计算机软硬件的快速发展,也提出探索性空间数据统计分析(ESDA)方法,如Sibley把EDA扩展到ESDA[83],美国雪城大学教授Monmonier提出地理刷概念进行动态交互式显示[84]。
4 1990-2000年代:成熟与扩散
4.1 1990年代:发展成熟
1991年,美国国家地理信息与分析中心(NCGIA)提交给美国国家科学基金会的“GIS与空间分析”研究计划中倡导两者的融合和相互促进,这最终导致有关空间数据统计分析与GIS的系列会议召开和很多重要成果的出现。如1992年的美国圣地亚哥特别会议[85],40位参与者中包括26位****,以及政府人员和企业代表,分为四个工作组:空间分析与GIS的融合、空间数据分析与GIS、基于GIS的区位分析和规划,以及模式识别。之后,在GIS快速发展和空间数据更易获取的背景下,出现了一系列的局部空间统计量与模型。所谓局部统计量就是探测研究区域内每一个对象及其邻域空间相关性的方法,从另一角度也可以认为是探索空间异质性[86],如局部空间自相关指数(LISA)[87,88,89]。而空间局部模型就是对局部空间子集进行建模。如从NCGIA回到英国纽斯卡尔大学的布伦森(Chris Brunsdon)等提出了地理加权回归(GWR)模型,其系数随空间位置而变化[90];美国国家癌症研究所库多夫(Martin Kulldorf)提出的空间扫描统计量在特定大小的圆形区域内进行统计计算,用于探索点数据或面数据的空间聚集[91]。1996年,利兹大学成立交叉学科性质的计算地理学中心(CCG),借助计算机强大的计算能力实现元胞自动机、智能体模型等在地理空间问题研究中的应用,本质上也是局部方法。局部空间统计量和模型与1970-1980年代探索全局空间自相关的指数和模型相呼应,从整体和局部两个视角进行分析,这是空间数据统计分析的又一重要进展,也是从宏观到微观的必然发展趋势。这一时期也出现一些有较大影响力的观点和著述。如1992年古德柴尔德(Michael Goodchild)提出地理信息科学,并认为空间统计学不是一个简单的研究领域,因为地理数据为空间统计学提出了特殊问题[92]。1993年,统计学家Cressie系统阐述了空间点模式、面数据和空间连续性数据的分析方法[93]。自从Cressie的开创性工作以来,空间数据的统计分析得到了长足发展[94]。1995年,Bailey等除了Cressie的三类空间数据外,又加入了空间相互作用数据共四类进行论述[95]。1997年美国北卡罗莱纳大学的克里斯塔科斯(George Christakos)等提出不需要线性、正态性或空间均质性假设的贝叶斯最大熵(BME)地统计学方法[96]。对于大的空间数据集,加拿大西蒙菲莎大学计算机科学系著名****韩家炜(Jiawei Han)等在1997年提出空间数据挖掘(SDM)的原型系统GeoMiner,认为SDM是数据挖掘(DM)的一个分支,是寻找空间数据中的隐含知识、空间关系或其他有趣模式的过程[97],并在2009年与Miller合编了《地理数据挖掘与知识发现》一书[98]。SDM的对象可以是空间的文本、图像、数据库或其他任何组织在一起的空间数据集,其方法包括统计学和空间统计学、聚类分析、粗集、云理论、智能计算、可视化和决策树等[99]。自1997年以来,国际著名期刊Science和Nature连续发表了一系列空间数据统计分析的应用文章,引起中国****的重视。王劲峰等[100]首次在国内对此进行了系统介绍。
所以,1990年代的空间数据统计分析已经成熟和系统化。在计算上实现了自动化和程序化,其方法和概念成为许多学科领域中的研究基础,包括地理学、生态学、流行病学、社会科学、地质学和环境研究等[50,101]。
4.2 2000年代:应用扩散
在空间数据统计分析成熟和系统化后,很自然地出现了很多总结和应用性质的著作,把空间数据统计分析方法向其他学科领域扩散。如Fotheringham等针对近二十年尤其是1990年代的发展变化进行总结,并概括了空间建模和空间理论演化的几个时期[101]。Haining对空间数据统计分析领域的技术方法进行了广泛论述[102]。Schabenberger等采用农业、生态和医学等领域的例子对空间数据统计分析的基本统计理论和方法进行全面、系统的阐述,并介绍了较新的贝叶斯层次模型和时空模型[103]。国内,如王劲峰等的研究内容涉及公共健康、人口与就业、土地利用和技术扩散等[104]。也有专门领域和技术的总结:如健康领域主要关注疾病在地理分布上的差异性和规律性,内容涉及数据可视化、疾病制图、聚集探测、模型构建和危险因素识别等[105,106];生态学领域有针对生态学家的空间分析指南[107]和后来出版的生态学空间点模式分析手册[108]等;人文社科领域,1999年美国加州大学圣芭芭拉分校成立了空间综合社会科学中心(CSISS),2009年在香港中文大学举办了第一届空间综合人文学与社会科学研讨会并出版专著;专门技术如Okabe等从空间镶嵌角度探讨空间插值、空间模型和空间点模式分析[109],Lloyd、Illian等分别对局部模型和空间点模式统计分析进行系统总结[110,111]。作为教材,O'Sullivan等详细地论述了不同空间数据类型的分析方法[112],国内教材如王远飞等[113]。2000年代也有方法上的创新。① 贝叶斯层次建模(BHM)。逻辑上讲,包含前人研究成果、经验知识等合理先验信息的贝叶斯方法具有一定优势[114],而把参数作为随机变量允许考虑特定的相关性,如参数中的空间相关性结构,因而也考查了观测数据中的空间相关性。现在,BHM在空间数据统计分析中应用广泛,很多空间问题可以在BHM范式中进行考虑,可参考Banerjee等[115]。② 空间分异性。1990年代的局部空间统计量探测研究区内某一个子区域与其邻域之间的局部空间关系,而地理探测器(GeoDetector)[116]是探测研究区内多个子区域的空间分异性并揭示其背后驱动力的一组统计学方法,并且可以判断两因子是否存在交互作用及其强弱、方向、线性还是非线性等,应用广泛。
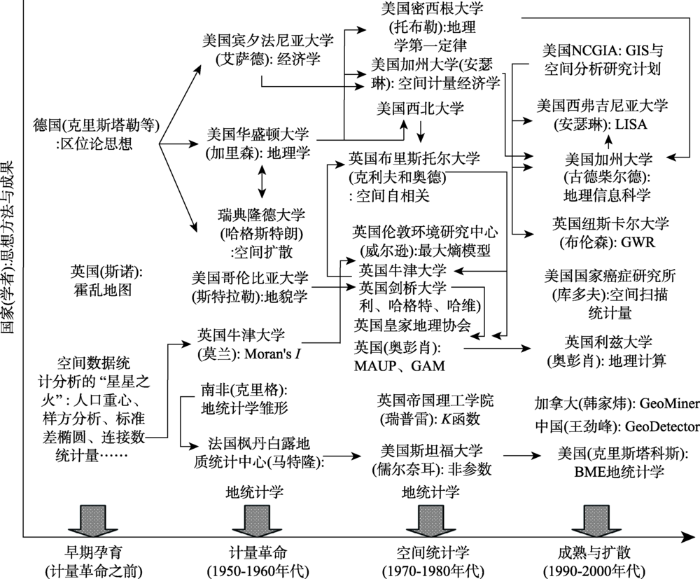
至此,空间数据统计分析经过半个多世纪的发展与完善(图1),尽管还有很多问题需要解决,但已经成为一个新领域,具有成熟、系统化的方法和显著的社会意义。
 显示原图|下载原图ZIP|生成PPT
图1空间数据统计分析的发展历程简图
-->Fig. 1A simplified history of statistical analysis of spatial dat
-->
5 2010年以后:时空大数据
现代科技背景下的手机数据、轨迹数据、社会媒体数据、自愿地理信息(VGI)、物联网、电商、公交刷卡、智能水电气表数据等,基本上是细粒度的实时数据并含有位置信息,其在时间上的累积产生时空大数据。所以,现代科技的发展必然引起分析理论与方法的变革,这对基于抽样的传统空间数据统计分析方法提出了重大挑战,并依赖于高性能计算机和良好的算法。时空大数据分析主要有两个主题:一是探索时空规律,二是探测时空异常,这两个主题在空间、时间和时空三种视角,以及全局和局部两种尺度上呈现。在技术与方法上,时空大数据分析主要借助云计算与协同计算[117,118,119]、时空数据挖掘[120,121]与机器学习[122],以及融合了空间统计学和时间统计学(时间序列分析)的时空统计学[114,123]等,从根本上讲是从大量低价值数据中提炼一些高价值信息的过程。如下几个研究方向值得关注:
5.1 时空点模式与过程
大数据之大源于小,即由细粒度数据大规模聚合而成。例如,由定位设备、移动通信等记录的各类移动对象的活动轨迹具有空间位置、时间等信息,可以把这些对象抽象为点数据,进而分析其时空模式和过程。例如,这些对象的时空轨迹是随机游走(random walk)吗,如果不是,如何描述其行为特征?这不仅适用于模拟以点数据为基本组成的地学现象,而且由于大多数地学过程可以转化为时空点过程,故其具有更广泛的应用范围[124]。如对人类活动、交通工具、动物和自然现象活动等的轨迹数据挖掘[125,126],可以研究这些对象的时空规律和异常,对个体行为和群体事件进行预测等。研究内容包括轨迹数据模式挖掘、轨迹数据分类和隐私保护等。此外,一些文献用统计方法对时空点模式与过程进行分析[114,127,128],如裴韬等提出了类似于信号处理中谱分析思路的时空点过程层次分解理论框架[129]。5.2 流分析
许多应用如物联网、网络点击、视频监控和传感器等产生的各种数据流(data streams)持续不断地从一个地方传输到另一个地方,流分析的目的是从连续数据流中提取隐藏的信息或知识。但由于其数据量大、快速、连续和非平稳性等特点,传统的静态数据分析方法已经不适应流分析。就方法而言,流分析基于界标窗口、滑动窗口、衰减窗口和倾斜时间窗口等,有两类计算方法[130]:增量学习和两阶段学习。增量学习中的模型通过实时数据或时间窗口进行逐步更新,以适应新传入数据的变化。两阶段学习中的第一阶段(在线阶段),实时更新数据概要;在第二阶段(离线阶段),每当用户发送请求时对存储的概要数据执行挖掘处理,如Aggarwal等的CluStream框架[131]。聚类和分类是流分析中两种常见的重要任务:聚类包括分割法、层次法、基于密度的方法、基于网格的方法和基于模型的方法五种,通常是扩展传统方法使其满足有界存储、有限次扫描、实时处理和概念漂移(concept shift)等约束,具体算法如CluStream、CluTree、DenStream、D-Stream、SWEM等[130]。也有其他方法,如基于模糊最大熵的优化模型聚类算法[132]。分类包括学习和检验两个阶段,第一阶段基于所收集的数据训练出合适的模型,第二阶段用该模型对未分类数据进行分类。分类算法包括决策树、贝叶斯、神经网络、支持向量机、K-近邻和集成方法等,具体算法如CVFDT、MC-tree、eGNN、StreamSVM、Lazy-tree、OVA等[130]。另一种流分析任务是频繁模式挖掘,其算法可以分为三类:Apriori类算法、FP-growth等基于增长的算法,以及Eclat等应用垂直数据格式(vertical data format)的算法[133]。对于流分析结果的评价,一种常见方法是根据模型随时间的变化绘制学习曲线来分析模型的性能,如果一种算法的学习曲线大部分时间都在另一种学习曲线之上,那么它比另一种算法要好得多[130]。
5.3 网络分析
从20世纪末Watts和Strogatz[134]、Barabasi和Albert[135]的研究开始,网络分析被越来越多的学科所接受,如物理学、计算机科学、社会学、流行病学和地理学等,并且很快表明他们的论文开创了一个多学科交叉领域——网络科学(network science)研究的新时代[136]。常见的网络类型有技术网络、社会网络、信息网络和生物网络等[137],这些网络体现了现实世界的复杂联系,并通常具有基本的时空标记,其出现、扩张、萎缩和消亡等演化规律,以及网络密度、中心性、结构性、偏好依附和度分布等特征是揭示复杂现实世界本质的重要途径。没有任何时候比在时空大数据如此易获取条件下更有机会对网络进行研究,这为探测复杂的相互作用和非线性关系提供了巨大可能[138]。网络分析中的模型包括随机网络、广义随机网络、小世界网络、无标度网络(scale-free network)等[139,140]。如Jiang用尺度定律(scaling law)描述小世界网络、无标度网络等复杂网络的层级特性,并认为应当用尺度定律描述空间异质性[141],与地理学第一定律描述空间依赖性相呼应。而在地理学与区域科学中,交通、电网、社会和经济网络等呈现出显式的空间特征,称为空间网络(spatial networks)[142],在研究这些网络的空间交互时,常用的两种模型是重力模型和威尔逊最大熵模型[143,144]。最近,针对Barabasi等提出的无标度网络[135]有一些不同观点,如Shi认为虽然无标度网络的幂律度分布最典型的是重尾分布,但重尾分布并不局限于幂律分布[145];而Broido等认为无标度网络是罕见的,在对近一千个不同类型网络数据集的统计分析基础上,发现无标度网络仅占4%[146]。另外,同一地区内的基础设施网络、社会网络、信息网络等不同类型网络之间的依赖与约束关系,网络的动态演化等也是值得研究的问题。
5.4 异常值探测
在时空大数据背景下,其重要性在于,数据中的异常值在各种应用领域中都会转化为重要的,通常是关键的信息。这在金融、公共卫生、灾害等很多领域中有重要应用。如银行卡在交易时间、地点、额度或频率上的异常行为表明可能被盗刷;又如在地球科学领域,通过卫星或遥感等收集的大量关于天气模式、气候变化或土地覆被模式的时空数据,其中的异常现象可以洞察人类活动或环境演变的可能原因[147]。异常值的类型包括全局异常、条件异常和群体异常三类[133],一个对象可以同时属于几种异常值类型。异常值探测即包括改造已有方法(如基于距离或基于密度的方法、统计学、机器学习、信息论等)使其适用于大数据,也需要基于高性能计算机的云存储与分析、深度学习等新 方法[148]。5.5 不确定性
一是大数据本身的不确定性。“高傲的大数据”通常暗示自己是对传统数据的替代而不是补充,但数据量大并不意味着可以忽视数据采集和构建的基本问题,很多广受欢迎的大数据并非是专门为科学分析所设计与收集的有效和可靠数据[138,149],这常常导致基于数据而不是基于问题的分析,其中存在由于各种原因导致的数据缺失值问题、代表性问题等且不易很好地解决,难以全面反映复杂的客观现实世界,甚至产生错误结果[150]。二是算法不确定性[138,151]。因为使用不同的程序、实现方式、数据环境或计算平台,故算法不确定性是地理知识产生过程中的必然,并且在数据的生成、处理和分析过程中常常被放大。另一方面,也有可能的解决方法,如古德柴尔德认为大数据可以相互印证[152]。这可用类似于李纳斯定律(Linus's Law)的语言来表述:只要有足够的数据,其收敛于真实值的速度就越快、效率就越高。例如OpenStreetMap(http://www.openstreetmap.org),尽管提供数据的大多数志愿者没有受过专业训练,但其数据质量却很好,就是利用了数据量大且更新快的优势。6 结论与讨论
6.1 结论
空间数据统计分析经过60多年的发展,已经成为一个行之有效的领域,具有成熟的方法、技术和显著的社会效益。首先,空间数据统计分析思想的重要来源之一是18世纪中后期和19世纪初德国经济学家和地理学家的区位论,于1950年代传入美国、英国和瑞典等国家,在特定的历史背景下结合生态学、矿业地质学等领域的定量化进程掀起计量运动,随后在不断创新过程中借助于GIS迅速发展,并在理论、方法和应用上获得显著成效。
其次,空间数据统计分析的发展历程可以分为五个时期:早期孕育(计量革命之前)、计量革命(1950-1960年代)、空间统计学(1970-1980年代)、成熟与扩散(1990-2000年代)和时空大数据(2010年以后)。换句话说,计量革命开始后的空间数据统计分析大约每20年有重要的新技术或方法出现。照此来看,时空大数据还要持续十多年时间,下一个技术和方法的重大创新即将出现。
最后,时空大数据是当前空间数据统计分析的重要研究趋势。在社会管理和商业等众多领域,无论对于****、政府还是企业,是机遇,更是挑战,应从空间、时间或时空进行多角度、多尺度综合分析,不仅要探索时空规律,也应关注时空异常。如下几个方向值得关注:时空点模式与过程分析、流分析、网络分析、异常值探测和不确定性。
6.2 讨论
本文仅侧重于统计角度系统回顾了空间数据分析的理论与方法,站在现今的高度看过去,可以更直接地看清方向和缘由,从中可以体会更多、更深,也可能对将来把握得更好。但限于篇幅不得不舍弃一些内容,如一定计算机背景下伴随分析方法而产生的一般软件和特定软件(包)技术或平台,也不涉及“空间数据分析”这一更为宽泛概念下的其他方法,如可视化、元胞自动机和智能体模型等,即空间数据统计分析是空间数据分析的分支,主要采用统计方法进行分析和建模。另外,鉴于作者的知识背景和资料获取途径,可能总结得不甚完善,但空间数据统计分析发展历程的大致轮廓已经有了。其次,从全局到局部是空间数据统计分析方法的创新路径之一。在局部空间统计量产生之前,即1990年代中期之前的所有方法都可以认为是全局方法,直到GIS提供了强大的制图能力,同时人们在实践中也逐渐认识到局部信息的重要性后,才出现了诸如LISA、GWR等各种局部空间统计量。反过来说,在一般意义上,所有全局统计量都是局部统计量的特殊形式,只不过是把邻域扩大到了全部数据。
最后,整合创新是空间数据统计分析方法和应用的重要思路。即从计量革命时期简单的统计应用,到考虑空间自相关的空间统计学,再到GIS技术支持下偏重于统计的空间数据分析,最后到大数据背景下偏重于计算的空间数据分析。故时空大数据时代的空间数据统计分析要获取和分析大体量数据、要创新方法和技术、要应用于不同领域,就需要计算机科学家、统计学家、地理学家、企业和许多其他领域人员的共同参与和努力。
The authors have declared that no competing interests exist.
参考文献 原文顺序
文献年度倒序
文中引用次数倒序
被引期刊影响因子
| [1] | |
| [2] | . 几年前,当国内经济学界对“空间集聚”一词还非常陌生时,经济活动的空间区位对经济发展和国际经济关系的重要作用在国际学术界已异乎寻常地引起人们的高度重视,空间经济已成为当代经济学中最激动人心的领域之一,空间经济理论被视为不完全竞争与收益递增革命的第四次浪潮。 . 几年前,当国内经济学界对“空间集聚”一词还非常陌生时,经济活动的空间区位对经济发展和国际经济关系的重要作用在国际学术界已异乎寻常地引起人们的高度重视,空间经济已成为当代经济学中最激动人心的领域之一,空间经济理论被视为不完全竞争与收益递增革命的第四次浪潮。 |
| [3] | |
| [4] | |
| [5] | |
| [6] | |
| [7] | . |
| [8] | |
| [9] | |
| [10] | . |
| [11] | |
| [12] | . |
| [13] | . The article discusses the value of quadrat method of mapping as a part of field excursion in studying the relation of the plant group to the habitat. It provides instruction in mapping a quadrat and to get acquainted on several types of vegetations. It emphasis the material needed in doing a wood quadrat which consists chiefly of squared paper and an ample supply of graduated tape. It suggests that tapes must be of three different lengths with100 meters marked at intervals of 10 meters, and 10 meters marked at intervals of 1 meter. |
| [14] | . |
| [15] | . Many social problems involve the geographic location of the social factors concerned. To know the characteristics of the areas in which these factors appear is to throw light on the entire situation. A statistical method for measuring the concentration of unit locations on a "spot map" is indicated. The symbolism has been kept parallel, as far as possible, to that used in the statistics of frequency distributions. |
| [16] | . |
| [17] | . |
| [18] | . |
| [19] | . (1934). Some Problems in the Correlation of Spatially Distributed Variables. Journal of the American Statistical Association: Vol. 29, Proceedings of the American Statistical Association, pp. 167-168. doi: 10.1080/01621459.1934.10506246 |
| [20] | . CiteSeerX - Scientific documents that cite the following paper: Certain effects of grouping upon the size of the correlation coefficient in census tract material |
| [21] | . The "quantitative revolution" in human geography which swept across so many universities in the 1950s and 1960s had its main diffusion centers in a few locations which were to have global significance. Two critical early centers were the University of Washington in the Pacific Northwest and Lund University in southern Sweden. But the experience of change was different in different locations as the general forces of perturbation sweeping around academia were translated into local eddies with local repercussions. Here, small and somewhat random quirks at the outset, led eventually to fundamental divergences between adoption and rejection. The theme is illustrated by reference to changes which occurred at Cambridge, one of England's two oldest universities, as seen from the perspective of someone who090000as undergraduate, graduate student, and later, faculty member090000was caught up in these changes and took some small part in propagating them. Special attention is given to the role of two environmental scientists, Vaughan Lewis and Richard Chorley, in introducing changes and the way in which later developments in human geography drew on preceding experiences in physical geography. The reasons behind the "Cambridge variant" and the questions of how intellectual DNA is passed across the generations are discussed. |
| [22] | |
| [23] | . |
| [24] | . Publication » The contiguity ratio and statistical mapping. |
| [25] | . Certain fundamental concepts in the application of statistics to mine valuation on the Witwatersrand are discussed, and general conclusions are drawn regarding the application of the lognormal curve to the frequency distribution of gold values. An indication is given of the reliability of present valuation methods on the Rand. It is shown that the existing over- and under-valuation of blocks of ore listed as high-grade and low-grade, respectively, can be explained statistically. Suggestions are made for the elimination of such errors and for the improvement of the general standard of mine valuation by the use of statistical theory. |
| [26] | . Not Available |
| [27] | |
| [28] | . The sampling theory of stationary processes in space is not completely analogous to that of stationary time series, due to the fact that the variate of a time series is influenced only by past values, while for a spatial process dependence extends in all directions. This point is elaborated in §§ 2-4. The estimation and test theory developed in § 7 is applied in § 8 to uniformity data for wheat and oranges. The final section is devoted to an examination of some particular two-dimensional processes. |
| [29] | . |
| [30] | . |
| [31] | |
| [32] | . First page of article |
| [33] | . 见: Longley P, Goodchild M F, Maguire D J, 等. . In: Longley P, Goodchild M F, Maguire D J, et al. |
| [34] | |
| [35] | |
| [36] | . |
| [37] | . |
| [38] | |
| [39] | |
| [40] | . In: Longley P, Goodchild M F, Maguire D J, et al. |
| [41] | . |
| [42] | . |
| [43] | . This paper examines a number of mathematical models suitable for describing spatial patterns. It is noted that many of these models suffer from a 'scale' problem in that the relevant statistic is partly dependent upon the size of area studied or the scale of the sampling procedure. This 'scale problem' has frequently been regarded as a major drawback to the employment of these models for describing spatial patterns. But geographers have long recognized that different processes are relevant for understanding areal differentiation at different scales--local, regional and national, for instance. The article, therefore, concludes that the problem of scale in the descriptive models of spatial pattern may be creatively linked with the problem of the scale at which a particular formative process operates. In particular, it is suggested that spatial autocorrelation functions may be developed to deal with the scale problem in a more comprehensive way and that, once developed, these spatial autocorrelation functions may be linked with the temporal processes governing the development of spatial patterns. |
| [44] | . |
| [45] | |
| [46] | . |
| [47] | . |
| [48] | . Au cours des dix dernières années, un phénomène qu'on pourrait appeler "révolution quantitative" a transformé radicalement esprit et objet de la géographie. Initiée par des physiciens et des mathématiciens, cette révolution n'a pas changé que la géographie, mais les autres sciences également. auteur décrit influence de cette révolution quantitative sur la géographie et ses rapports avec le déterminisme. Il est avis que ces transformations résultent un besoin élaborer des théories scientifiques. Les recherches géographiques feront de plus en plus usage des méthodes mathématiques et on accordera une plus large place à la construction et à application expérimentale de modèles théoriques. Ceci n'obviera pas au besoin études idéographiques, mais ces dernières pourront ětre étayées par des énoncés théoriques. |
| [49] | . |
| [50] | . Spatial autocorrelation is a concept that helps to define the field of spatial analysis. It is central to studies using spatial statistics and spatial econometrics. In this paper, we trace the early development of the concept and explain the academic links that brought the concept to the fore in the late 1960s. In geography, the importance of the work of Michael F. Dacey, Andrew D. Cliff, and J. Keith Ord is emphasized. Later, with the publication of a volume on spatial econometrics by Luc Anselin, spatial research and the use of the concept of spatial autocorrelation received a considerable boost. These developments are outlined together with comments about recent and possible future trends in spatial autocorrelation-based research. |
| [51] | . react-text: 589 The notion of a cartogram is reviewed. Then, based on a presentation from the 1960s, a direct and simple introduction is given to the design of a computer algorithm for the construction of contiguous value-by-area cartograms. As an example, a table of latitude/longitude to rectangular plane coordinates is included for a cartogram of the United States, along with Tissot's measures for this map... /react-text react-text: 590 /react-text [Show full abstract] |
| [52] | |
| [53] | |
| [54] | |
| [55] | . A brief survey is made of the range of models and statistical techniques relevant to the analysis of spatial pattern, and more detailed discussion given to three specific classes of stochastic process in two dimensions viz. (i) continuous processes X(r), (ii) point processes N(r), (iii) lattice processes Xi. The appropriate theory for these classes of processes is indicated in Part I; and in Part II some examples of data are classified under these same three headings, and their statistical analysis discussed. |
| [56] | . |
| [57] | . |
| [58] | . |
| [59] | |
| [60] | . |
| [61] | . |
| [62] | . Entropy in Urban and Regional Modelling introduced a new framework for constructing spatial interaction and associated location models. These ideas are reviewed briefly and then set in the wider context of the application of entropy in a range of disciplines. Related developments since 1970 are examined with particular reference to extensions of the core model, links to mathematical programming, the relationship to economics, and the introduction of a dynamic spatial structure hypothesis. The role of entropy maximizing in geography, and more widely in complexity science, is reviewed and two conclusions are drawn beyond the continued effective deployment of entropy models: geography could be a leading player as complexity science develops; and geography can use these ideas to update the presentation of its classic theories. The ongoing research agenda is extensive090000particularly in relation to the modeling of imperfect markets in economics090000in its links with network science and agent-based modeling. Recent developments in physics suggest a new role for entropy in understanding spatial structure. This article is organized into five main sections. The first summarizes the ideas of the book; the second sets this discussion in a wider context; the third surveys the developments that have taken place since its publication. The fourth summarizes the role of entropy maximizing in geography in the context of complexity science, and the fifth presents an ongoing research agenda.En el modelado urbano y regional, el concepto de entrop0102a abre las puertas a un nuevo marco conceptual para construir modelos de interacci0106n espacial y otros modelos de localizaci0106n similares. El art0102culo presente rese01±a brevemente estas ideas y las enmarca en el contexto de la aplicaci0106n del concepto de entrop0102a en otras disciplinas acad0108micas. Asimismo, el autor examina el desarrollo de estas ideas desde 1970 con 0108nfasis particular en las ampliaciones y modificaciones al modelo base original, a los v0102nculos con la programaci0106n matem0103tica, en la relaci0106n con la Econom0102a, y en la presentaci0106n de una hip0106tesis de la estructura espacial din0103mica. El papel de la maximizaci0106n de entrop0102a en Geograf0102a, y en general en las ciencias de la complejidad son rese01±adas y dos conclusiones que van mas all0103 de la aplicaci0106n de los modelos de entrop0102a son extra0102das: la Geograf0102a puede jugar un papel l0102der en el desarrollo de las ciencias de la complejidad; y, la Geograf0102a puede utilizar estas ideas para actualizar la presentaci0106n de sus teor0102as cl0103sicas. La agenda de investigaci0106n en curso es muy ambiciosa, en particular en relaci0106n al modelado de mercados imperfectos en Econom0102a -en lo que respecta a sus v0102nculos con ciencias de redes y los modelos basados en agentes. Los avances m0103s recientes en F0102sica sugieren un nuevo rol del concepto de entrop0102a para entender estructuras espaciales. El estudio presente est0103 organizado en cinco secciones principales. La primera resume las ideas del libro (de Wilson); la segunda enmarca esta discusi0106n en un contexto m0103s amplio; la tercera examina los avances y el desarrollo de ideas ocurridos desde dicha publicaci0106n; la cuarta, resume el rol de la maximizaci0106n de entrop0102a en Geograf0102a en un contexto de las ciencias de la Complejidad; y finalmente la quinta, presenta la agenda de investigaci0106n que esta en curso en la actualidad. |
| [63] | . |
| [64] | |
| [65] | . |
| [66] | |
| [67] | . |
| [68] | |
| [69] | . . |
| [70] | |
| [71] | . |
| [72] | . |
| [73] | . . |
| [74] | . |
| [75] | . |
| [76] | . |
| [77] | |
| [78] | |
| [79] | . |
| [80] | |
| [81] | . |
| [82] | |
| [83] | |
| [84] | . |
| [85] | |
| [86] | . |
| [87] | . |
| [88] | . |
| [89] | . |
| [90] | . |
| [91] | . |
| [92] | . |
| [93] | . |
| [94] | |
| [95] | . |
| [96] | . |
| [97] | |
| [98] | |
| [99] | . . |
| [100] | . . |
| [101] | . |
| [102] | |
| [103] | |
| [104] | |
| [105] | . |
| [106] | . |
| [107] | |
| [108] | |
| [109] | . |
| [110] | |
| [111] | . |
| [112] | . |
| [113] | |
| [114] | . |
| [115] | |
| [116] | . |
| [117] | . |
| [118] | . . |
| [119] | . |
| [120] | . . |
| [121] | . . |
| [122] | . |
| [123] | . . |
| [124] | . |
| [125] | . |
| [126] | . . |
| [127] | . |
| [128] | |
| [129] | . |
| [130] | . |
| [131] | |
| [132] | . . |
| [133] | . |
| [134] | . |
| [135] | . |
| [136] | . |
| [137] | |
| [138] | . |
| [139] | . |
| [140] | . |
| [141] | . |
| [142] | . |
| [143] | . . |
| [144] | . |
| [145] | . |
| [146] | |
| [147] | |
| [148] | |
| [149] | . . |
| [150] | . . |
| [151] | . |
| [152] | . |
