Estimating genomic breed composition of individual animals using selected SNPs
Jun He1,3, Changsong Qian2, Richard G. Tait Jr.3, Stewart Bauck3, Xiaolin Wu1,3,4编委: 赵要风
收稿日期:2017-12-4修回日期:2018-02-27网络出版日期:2018-04-20
| 基金资助: |
Editorial board:
Received:2017-12-4Revised:2018-02-27Online:2018-04-20
| Fund supported: |
作者简介 About authors
何俊,博士,副教授,研究方向:动物遗传育种与繁殖E-mail:

摘要
关键词:
Abstract
Keywords:
PDF (726KB)元数据多维度评价相关文章导出EndNote|Ris|Bibtex收藏本文
本文引用格式
何俊, 钱长嵩, RichardG.TaitJr., StewartBauck, 吴晓林. SNP芯片数据估计动物个体基因组品种构成的方法及应用. 遗传[J], 2018, 40(4): 305-314 doi:10.16288/j.yczz.17-394
Jun He, Changsong Qian, Richard G. Tait Jr., Stewart Bauck, Xiaolin Wu.
动物个体的基因组品种构成(genomic breed composition, GBC)反映了动物个体基因组与现有品种(系)的遗传关系,即现有品种对于动物个体基因组的遗传贡献。在动物遗传学研究和育种上,估计动物个体的GBC具有广泛的应用价值,如了解和评估某动物品种的育成历史和品种纯度[1]、地方品种的保种[2,3]、杂种优势预测[4]以及设计杂交计划和杂交育种方案[5,6]等。此外,在全基因组关联分析中,验证个体的品种(系)关系可以帮助校正群体分化,降低对疾病和经济性状关联分析中的假阳性率[7,8]。
近20年来,基因组选择已经成为动物遗传改良的有力工具,尤其在奶牛育种上取得了巨大的成功[9]。但迄今为止,大多数的基因组选择都只针对纯种动物品种(品系)而不考虑杂种个体。而用纯种动物建立的基因组预测模型并不适用于杂种个体,因为预测准确度往往很低。例如,对美国荷斯坦奶牛(Holstein)的基因组选择,就使用了一些品种鉴别的标记来排除杂种个体而只对纯种进行选择[10]。但也有证据表明,通过加权纯种的SNP效应来计算基因组育种值,可以提高杂种的预测准确度,其权重就是采用动物个体的GBC[11]。
早期的群体遗传分析、亲缘关系和品种鉴定主要依靠基因组特定区域的微卫星标记分析[12,13]。在过去的10多年里,SNP标记[14]和序列数据[15,16]得到了广泛应用。采用SNP估计个体的GBC比系谱更准确,主要原因是:(1)与系谱资料相比,用覆盖全基因组的分子标记(例如SNP)可以更为准确地估计出动物个体基因组的亲本贡献和遗传抽样[17,18];(2)系谱记录常常有错误或者资料遗失等现象[11]。用SNP标记估计动物个体GBC的统计方法大体上可以分为两类:第一类是基于多群体基因频率混合分布(admixture)的分析方法。Bansal和Libiger(B-L)提出基于最大似然估计基因频率混合系数(admixture coefficients)快捷算法[15],用以估计已知群体对于个体基因组相对贡献率;第二类方法是用线性回归分析估计动物个体的GBC[19,20]。在计算机软件方面,估计GBC比较多的是利用现有估计亲缘(祖先)关系的软件,如ADMIXTURE[21,22]和ANCESTRY[15]等,或者是利用估计群体结构的软件,如STRUCTURE[23]、MENDEL[24]和EigenStrait[25]等。线性回归分析的 方法也可以利用现有的线性回归程序,如R的lm 命令。
本文总结了动物个体GBC的概念、参考SNP和参考动物的选择,以及用线性回归分析和B-L混合分布模型[15]方法估计GBC的统计原理,并且用5个品种的SNP芯片数据,演示了B-L混合分布模型方法[15]的具体实施步骤以及相应的结果,以期为推广和应用动物个体GBC的估计方法提供参考。
1 动物个体基因组品种构成
自然和人工选择、地理隔离、遗传漂移等原因都可以改变群体间动物的基因频率。因此通过SNP基因分型,依据多个基因座(位点)的基因型信息,可以将纯种动物个体的品种关系鉴定出来[23]。通过不同品种(祖先)杂交所获得的后代个体,其基因组各位点的基因型与这些品种(祖先)在相应位点上的基因频率存在一定的关系。因此,通过合适的数学模型和统计方法可估计出每个品种(祖先)对于动物个体基因组的遗传贡献比例[11],即每个动物个体的基因组源于这些品种(祖先)的相对比例,这就是动物个体的GBC。从育种角度看,某品种内动物个体的平均GBC,也反映出该动物所在群体的培育历史。例如,布兰格斯肉牛(Brangus)是安格斯牛(Angus)和婆罗门瘤牛(Brahman)的杂交后裔,综合这两个品种的优良性状,在遗传上大致有3/8的婆罗门瘤牛和5/8的安格斯牛血统[26]。牛肉王牛(Beefmaster)是20世纪30年代用海福特牛(Hereford)母牛和短角牛(shorthorn)母牛与瘤牛公牛杂交培育而成的肉牛品种,其含有25%的海福特牛、25%的短角牛以及50%的婆罗门瘤牛血统[26]。2 参考SNP的选择
估计动物个体的GBC,首先需要筛选出一组适用的SNP。筛选这些SNP,一般需要满足两个条件:第一,筛选的SNP是该物种目前商用芯片中共同的SNP,这样可以很方便地将这些商用SNP芯片用于品种的鉴定和估计,而不需要重新设计新的芯片或增加芯片中的SNP位点;第二,选出的SNP有比较高的信息含量,可以准确鉴定和区分现有的动物品种,其统计准确度要高,两类统计错误的概率都要控制在比较低的程度。筛选SNP的第一步是要找出目前商用SNP芯片中的共同SNP,然后在这些共同的SNP中减少或删除处于高度连锁不平衡的SNP。特别是在有限群体中用高密度的SNP芯片所检测的SNP基因型,有相当数量的SNP之间都存在高度的连锁不平衡关系,在统计学上表现为高度的多重共线性(multi-collinarity),不仅不会增加这些SNP的信息量,而且实际上会降低对于动物个体GBC的估计准确度。Hulsegge等[27]采用LD的r2>0.30作为删除SNP的尺度,结果表明,在保持相同准确性的前提下,使用这个尺度来筛选SNP,可以明显降低所需SNP标记的数目。第二步是要筛选信息量高的SNP。筛选高信息量的SNP可以依据不同的统计指标。例如,Hulsegge等[27]比较了3个统计指标用以衡量标记信息量的效果。这3个统计指标分别是Delta (群体间等位基因频率的绝对差异)、Wright的FST[28]以及Weir和Cockerham的FST[29]。Delta是衡量标记信息量最常用的指标。以
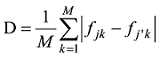
式中


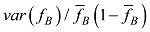
式中


式中a为群体间等位基因频率的方差,b为群体内个体间等位基因频率的方差,c为个体内配子间等位基因频率的方差。Hulsegge等[27]结果表明,这3个指标都可以有效应用于筛选品种鉴定和估计的SNP,用不同指标所获得的结果之间的差异比较小。本课题组采用SNP基因频率的平均欧式距离(average Euclidean distance, AED)来筛选SNPs,实际效果也非常好[30]。该方法简介如下:
设在


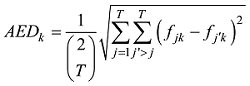
式中

除了以上介绍的指标,信息熵(entropy)[31]和主成分分析(principal component analysis, PCA)中的加载系数(loading score)[32]也是衡量SNP信息量的指标。在信息学里,熵是每个信号所承载的平均信息量;在统计学上,熵是随机事件(例如基因型)的非确定性的一个指标。就选择SNP而言,熵是SNP等位基因频率的一个函数[33]。在筛选品种鉴定的SNP时,除了考察SNP的熵值以外,还要求SNP的频率在品种间的差异最大化。在主成分分析中,PCA的加载系数是从主成分到变量(SNP)上的投影。如果一个变量(SNP)的加载系数越高(低),就表明它与主成分的相关关系越密切(其影响也越大)。PCA加载可以理解为在计算主成分时每个原始变量的权重。理论上,一个变量平方加载系数之和,代表该变量所解释的方差量。用PCA的加载系数来筛选SNP的前提是品种间基因频率的协方差或相关矩阵为非奇异矩阵,可以进行特征分解,这个条件对于高维的SNP数据不一定总是成立。因此,本文采用SNP基因频率的平均欧式距离(AED)来筛选SNP。
至于具体筛选多少SNP,可以因用途、目的和统计模型而异。例如,Kuehn等[20]使用Illumina 50K芯片的全部SNP;Hulsegge等[27]筛选出少于100 SNP用于品种鉴定,效果也非常好。本课题组研究结果表明,用线性回归模型估计GBC所需要的SNP数目通常比混合分布模型所需要的SNP 数目要大[30]。
3 参考动物的选择
原则上,每个参考群体的动物应该是纯种,或者是每个品种中有代表性的动物个体。但由于各种原因,实际数据中往往会掺杂一些杂种个体,甚至有其他品种的个体。因此需要对参考群体中的动物个体加以清理。为此,本文提出基于动物个体的品种似然值(likelihood)的方法来选择参考群体的动物。具体方法为:设第k个SNP的3种基因型分别为AA、AB和BB,


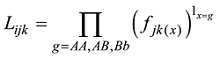
式中


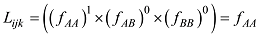
因此,如果只考虑一个SNP,一个个体属于某个品种的似然值实际上就等于该SNP基因型在品种中的频率。
将上式(6)拓展到M个SNP。设定

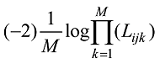
设定一个群体有n个个体,该群体某位点的AA、AB和BB基因型的计数分别为


式中
为了避免对数取0,使用贝叶斯方法估计等位基因频率。假设q的先验分布是Beta函数:

设定

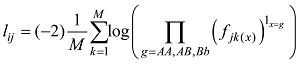
依据以上公式计算的基因型频率,可以计算出每个品种内个体的
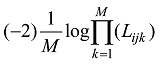
计算每个品种中每个动物个体的(-2)logLK值,然后选择(-2)logLK值小于某个阈值的动物个体组建参考群。阈值的确定因具体的品种和数据而定。原则上,数据的清理只要清除每个品种中不具备该品种遗传特征的极端个体,删除个体的比例一般在5%以内。保留混杂个体会增加品种鉴定中的假阳性率。相反,如果过度清理,会使群体基因频率走向另一个极端,从而增加品种鉴定的假阴性率。参考群动物确定以后,使用新群体的基因型数据重新计算SNP 的基因频率和基因型频率。
4 估计GBC的统计方法
估计动物个体GBC的统计方法大体上可以分为两类:第一类是基于基因频率混合分布的分析方法。这类方法包括无监督的聚类方法(unsupervised clustering approach)和有监督的聚类分析(supervised clustering approach)。前者同时估计K个品种(祖先)的基因频率以及这些品种(祖先)对于动物个体基因组的相对遗传贡献[6,21,34];后者在已经知道祖先的情形下,可以更准确估计出它们对于动物个体基因组的贡献比例[22]。如果一个个体的祖先起源于不同品种(祖先)的杂交(交配),其遗传组成(基因型)在统计上可以用这些品种(祖先)的基因频率(概率)的混合分布来描述。假设一个个体的基因组是几个已知品种(祖先)基因频率的一个混合分布,因此可以借助于适合的统计模型和方法,估计出每个品种在这个混合分布中比率(权重),后者就是对于该动物个体GBC的估计。B-L提出了基于最大似然估计基因频率混合系数的快捷算法,用以估计已知群体对于个体基因组相对贡献率,而不需要进行聚类分析;第二类方法是使用线性回归模型来估计动物个体的GBC[19,20]。该方法以参考品种的等位基因频率为依据,采用线性回归的方法来估计参考群体对于动物个体基因组的品种贡献比例[20]。更准确地说,是以参考群体中每个SNP等位基因频率(例如B等位基因)作为回归变量,以动物个体各SNP的B等位基因的计数作为依变量,计算参考群体对于每个个体等位基因计数的回归系数。该方法目前已用于估计牛的品种遗传组成[11,20,27]。此外还有一些其他的方法,如Dodds等[35]将基因组BLUP方法应用于动物个体GBC的估计。动物品种和祖先的估计,多采用线性回归模型和B-L混合分布模型这两个方法。4.1 线性回归模型
假设y为一个个体所有M个SNP的基因型向量


式中b是

理论上,每个动物个体的GBC之和应该为1。但是对于每一个动物而言,T个品种的回归系数之和并不一定等于1,因为回归系数本身都可能超过1,有的甚至可能为负数,因此需要加以调整和约束,使其和为1。VanRaden等[11]提出一个校正品种回归系数的方法,在计算上比较繁琐。本文介绍一个比较简单的校正方法,实际效果也比较好:
首先将动物个体负的品种回归系数值设置为0,计算每个动物M个品种回归系数之和;
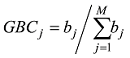
每个品种(例如第j个品种)对于动物个体基因组的贡献比例估计等于该品种回归系数

4.2 B-L(2015)混合分布模型
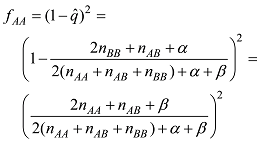
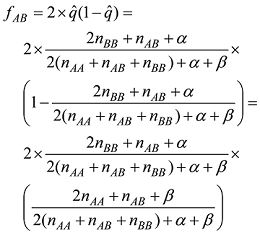
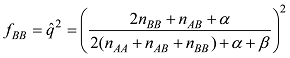
设第j个SNP共有3种可能的基因型:AA (0),AB (1)和BB (2)。假设该SNP基因型的分布符合Hardy-Weinberg平衡定律[23],则它们的频率可以计算如下: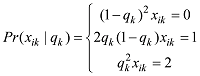
式中

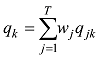


设
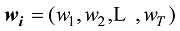
式中C是一个常数。值得说明的是,上式的计算是基于所有SNP相互独立或连锁平衡的假设,对于低密度或超低密度SNP而言,可以视为一个比较近似的假设。但是,这个假设对于高密度SNP显然是不成立的。
在


(1)计算混合系数向量

(2)对于每个具有非零混合系数的品种,如第j个品种,将其混合系数的最大似然估计值限制为0,然后计算δl=Lmax-L-l;
(3)找出δl的最小值的品种;
(4)如果某个品种的δj小于阈值T(δj<T),将相应的混合系数设为0。
重复(2)~(4)步,直到似然值的变化达到可接受的最小程度。阈值T通过似然比率的检验方法来确定。如B-L中使用T=5.414,其所对应的P值是0.001。
5 方法应用示例
选择5个牛品种共36 574头牛用于筛选和构建参考群体,5个牛品种分别是日本红毛和牛(Akaushi)、安格斯牛(Angus)、海福特牛(Hereford)、荷斯坦牛(Holstein)和娟珊牛(Jersey),其中前3个为肉牛品种,后两个为奶牛品种。基因组SNP分型数据由美国GeneSeek公司提供。日本红毛和牛、娟珊牛和荷斯坦牛为50K SNP基因型数据,海福特牛和安格斯牛为40K SNP基因型数据。各品种的样本数量、SNP数和最小等位基因频率见表1。参考群体中的缺失基因型比例很低。为了保证所计算的基因频率不受基因型填充误差的影响,参考群体中的缺失基因型不参入基因频率的计算。但是,对于待检查的(分析)动物个体,其缺失基因型在计算GBC以前需要通过一定的方法或程序(例如FImpute[36])进行基因型填充。Table 1
表1
表1 5个牛品种使用的芯片信息
Table 1
| 品种 | 数量 | SNP数 | 最小等位基因频率 |
|---|---|---|---|
| 日本红毛和牛 | 198 | 49 463 | 0.250±0.155 |
| 安格斯牛 | 18137 | 40 660 | 0.215±0.179 |
| 海福特牛 | 2423 | 40 663 | 0.270±0.150 |
| 荷斯坦牛 | 8905 | 49 463 | 0.295±0.152 |
| 娟珊牛 | 6911 | 49 463 | 0.256±0.158 |
新窗口打开|下载CSV
5.1 选择SNPs
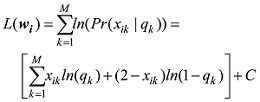
对于共同SNP的筛选,本文考虑目前6款商用牛的SNP芯片,分别是GGP ULD (7K) SNP芯片、GGP LD (40K) SNP芯片、GGP 50K SNP芯片、GGP HD (80K) SNP芯片、GGP UHD (150K) SNP芯片和Illumina bovine HD (777K) SNP芯片。这6款芯片有6923个共同的SNP。通过最大化5个品种间的SNP基因频率的平均欧式距离(AED),筛选出1000 (1K)、2000 (2K)、3000 (3K)、5000 (5K)的4个超低密度的SNP子集(panels)。这4个SNP子集在牛染色体的分布见图1。显而易见,对于品种鉴定的SNP分布在几乎所有的染色体上(没有显示Y染色体)。但是在每一条染色体上,这些SNP分布是很不均匀的。需要说明的是,本文没有删除(LD)r2>0.30的标记,主要原因是这6000多个共同的SNP对于基因组的覆盖率已经很低,并且本文的目的不是要筛选出最小数目的SNP。但在高密度芯片中筛选品种鉴别的SNP,删除(LD)r2>0.30的多余SNP是很有必要的。图1
 新窗口打开|下载原图ZIP|生成PPT
图1筛选的4个SNP子集中的SNP在牛染色体上的分布情况
A:筛选的1K子集的SNP在牛1~29和X(30)染色体上的分布;B:筛选的2K子集的SNP在牛1~29和X(30)染色体上的分布;C:筛选的3K子集的SNP在牛1~29和X(30)染色体上的分布;D:筛选的5K子集的SNP在牛1~29和X(30)染色体上的分布。
Fig. 1The distribution of SNP in each chromosome in four SNP panels
这4个SNP子集的AED值与Delta的相关性很高,从0.939(1K)~0.964(10K),二者所筛选的相同的SNP的比率也很高。例如,依据AED和Delta这两个指标,分别从16K SNP子集中筛选出2个1K的SNP子集,其共同SNP的比率为89.4%。
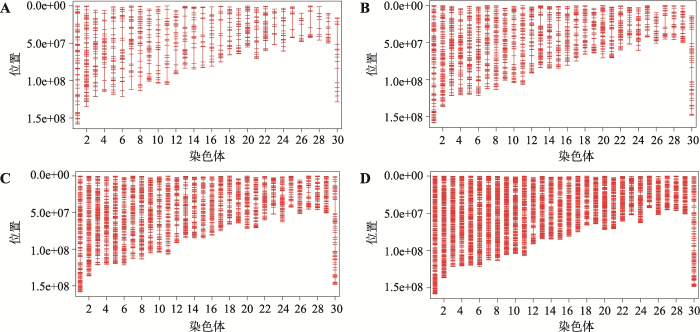
计算4个SNP子集在这5个牛品种间的AED,作为这4个SNP子集信息量的估计(图2)。1K的SNP子集具有最大的AED,随着子集中筛选的SNP数目的增加,AED依次降低。该结果表明,信息含量高的SNP总是被优先选择,且随着筛选SNP数目的增加,平均SNP信息量呈下降的趋势。
图2
 新窗口打开|下载原图ZIP|生成PPT
图2用筛选的4个SNP子集计算5个牛品种间基因频率的平均欧氏距离(标准差)
5个牛品种分别是日本红毛和牛(Akaushi)、安格斯牛(Angus)、海福特牛(Hereford)、荷斯坦牛(Holstein)和娟珊牛(Jersey)。
Fig. 2The average AED of gene frequency between five cattle breeds calculated by four SNP panels
5.2 建立参考群
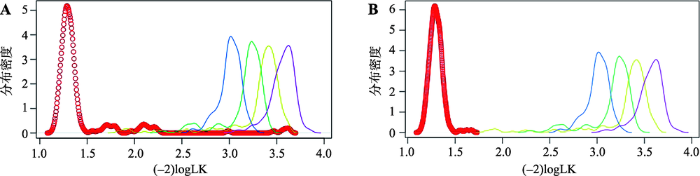
以198头待鉴定的日本红毛和牛为例,使用1K的SNP子集,计算每头个体动物的(-2)logLK。根据图3的分布,如果以(-2)logLK>1.52作为阈值,可以淘汰31头非代表性的个体。根据1K的SNP子集,分别计算了清理前(198头动物)和清理后的数据(167头动物)对于5个品种的(-2)logLK,见图3。显而易见,数据清理前的动物个体存在品种间的混杂情况,而数据清理之后,就可以清楚地区分日本红毛和牛与其他品种的牛群。需要说明的是,这个数据中的日本红毛和牛的混杂情形比较严重,因此淘汰的个体比例也比较高(15%)。一般情形下,动物个体的淘汰率在5%以内比较合适。例如,对于筛选各品种的参考群动物,荷斯坦牛的淘汰率为0.47%,海福特牛的淘汰率仅为0.12%。图3
 新窗口打开|下载原图ZIP|生成PPT
图3使用1K子集计算日本红毛和牛整理前和整理后数据的(-2)logLK的分布
A:原始数据计算的(-2)logLK;B:整理后数据计算的(-2)logLK。
Fig. 3The (-2)logLK distribution between unclean data and clean data of Akaushi calculated by 1K panel
5.3 计算GBC
基于B-L的混合分布模型[15],分别用1K、2K、3K和5K的SNP子集,估计198头待测的日本红毛和牛的品种系数。日本红毛和牛的GBC值(GBC of Akaushi breed, GBCA)见表2。GBCA 值为1表示纯种日本红毛和牛,GBCA 值小于1的个体表示为不同程度的杂种或者根本不属于该品种。从表2可见,用这4个筛选的SNP子集所得到的结果是比较一致的。在这198 头待鉴定的牛中,有166 头是纯种的日本红毛和牛,27~28头可能是日本红毛和牛与其他牛的杂交牛,其余的4~5头GBC值最小的牛是其他品种的牛(实际上是红色安格斯牛)。以上结果可以通过这些牛的系谱资料加以验证。Table 2
表2
表2 198头日本红毛和牛个体的GBC值
Table 2
| GBC值 | SNP子集 | |||
|---|---|---|---|---|
| 1K | 2K | 3K | 5K | |
| =1 | 166 | 166 | 166 | 166 |
| 0.9≤GBCA<1.0 | 2 | 1 | 1 | 1 |
| 0.8≤GBCA<0.9 | 10 | 11 | 10 | 10 |
| 0.7≤GBCA<0.8 | 2 | 2 | 3 | 3 |
| 0.6≤GBCA<0.7 | 4 | 5 | 5 | 5 |
| 0.5≤GBCA<0.6 | 8 | 7 | 7 | 7 |
| 0.4≤GBCA<0.5 | 0 | 0 | 0 | 0 |
| 0.3≤GBCA<0.4 | 0 | 0 | 0 | 0 |
| 0.2≤GBCA<0.3 | 0 | 0 | 0 | 0 |
| 0.1≤GBCA<0.2 | 2 | 2 | 2 | 1 |
| 0≤GBCA<0.1 | 4 | 4 | 4 | 5 |
新窗口打开|下载CSV
6 结语与展望
本文系统介绍了动物个体GBC分析的原理、步骤与方法,并通过实例演示了混合分布模型方法进行动物GBC分析的步骤和结果。在现有SNP芯片的基础上,筛选可应用于品种鉴定和估计的SNP子集,是对现有SNP芯片功能的拓展和深入开发利用,尤其对于动物的纯种选育、品系选育,已经地方品种的保种的方面的应用具有特别的价值。所筛选的SNP子集也可以用于相关动物群体的遗传结构和变异分析。本研究筛选了1K、2K、3K和5K的SNP子集。实际上,估计GBC所需要的SNP数目还可以更少。例如,我们发现如果筛选更少数目的SNP,也可以有效地估计GBC。但是,最少需要筛选多少SNP可以有效地估计GBC,该问题还有待于进一步的研究。此外,如何利用SNP基因型估计动物个体GBC,以便提高纯种和杂种动物的基因组预测和选择的准确度,也是一个值得深入研究的领域,并有望为基因组预测杂种动物的遗传价值提供有效的途径。参考文献 原文顺序
文献年度倒序
文中引用次数倒序
被引期刊影响因子
URLPMID:23061480 [本文引用: 1]

Swiss Fleckvieh was established in 1970 as a composite of Simmental (SI) and Red Holstein Friesian (RHF) cattle. Breed composition is currently reported based on pedigree information. Information on a large number of molecular markers potentially provides more accurate information. For the analysis, we used Illumina BovineSNP50 Genotyping Beadchip data for 90 pure SI, 100 pure RHF and 305 admixed bulls. The scope of the study was to compare the performance of hidden Markov models, as implemented in structure software, with methods conventionally used in genomic selection [BayesB, partial least squares regression (PLSR), least absolute shrinkage and selection operator (LASSO) variable selection)] for predicting breed composition. We checked the performance of algorithms for a set of 40 492 single nucleotide polymorphisms (SNPs), subsets of evenly distributed SNPs and subsets with different allele frequencies in the pure populations, using FST as an indicator. Key results are correlations of admixture levels estimated with the various algorithms with admixture based on pedigree information. For the full set, PLSR, BayesB and structure performed in a very similar manner (correlations of 0.97), whereas the correlation of LASSO and pedigree admixture was lower (0.93). With decreasing number of SNPs, correlations decreased substantially only for 5% or 1% of all SNPs. With SNPs chosen according to FST, results were similar to results obtained with the full set. Only when using 96 and 48 SNPs with the highest FST, correlations dropped to 0.92 and 0.90 respectively. Reducing the number of pure animals in training sets to 50, 20 and 10 each did not cause a drop in the correlation with pedigree admixture.
URL [本文引用: 1]
URL [本文引用: 1]
The use of marker-assisted mating to achieve maximum heterozygosity in offspring populations was investigated. Analysis of variance with simulated data was performed; the heterozygosity in offspring populations was significantly determined by sire heterozygosity in offspring of non-inbred parents and by sire heterozygosity and percentage of parental difference in offspring produced by inbred pa...
URL [本文引用: 1]
Genomic scanning using microsatellites was carried out on 192 pigs over a total of 5 generations. A total of 42 microsatellite markers were used, which were polymorphic in the starting generation. These markers were assigned to 6 linkage groups. Association of heterozygosity with observed average heterosis was investigated for each locus using a generalized linear model. Analysis of variance re...
URL [本文引用: 1]
本文介绍了家禽开放核心群育种体系(ONBS)培育蛋鸡工业化品系的育种模型与实际效果,并讨论了与之相关的遗传质量检测问题。
URL [本文引用: 1]
本文介绍了家禽开放核心群育种体系(ONBS)培育蛋鸡工业化品系的育种模型与实际效果,并讨论了与之相关的遗传质量检测问题。
URL [本文引用: 2]
URL [本文引用: 1]
URLPMID:15052271 [本文引用: 1]
Large-scale association studies hold substantial promise for unraveling the genetic basis of common human diseases. A well-known problem with such studies is the presence of undetected population structure, which can lead to both false positive results and failures to detect genuine associations. Here we examine approximately 15,000 genome-wide single-nucleotide polymorphisms typed in three population groups to assess the consequences of population structure on the coming generation of association studies. The consequences of population structure on association outcomes increase markedly with sample size. For the size of study needed to detect typical genetic effects in common diseases, even the modest levels of population structure within population groups cannot safely be ignored. We also examine one method for correcting for population structure (Genomic Control). Although it often performs well, it may not correct for structure if too few loci are used and may overcorrect in other settings, leading to substantial loss of power. The results of our analysis can guide the design of large-scale association studies.
URL [本文引用: 1]
Genomic selection has revolutionized dairy cattle breeding. Since 2000, assays have been developed to genotype large numbers of single nucleotide polymorphisms (SNP) at relatively low cost. The first commercial SNP genotyping chip was released with a set of 54,001 SNP in December 2007. Over 15,000 genotypes were used to determine which SNP should be used in genomic evaluation of U.S. dairy cattle. Official USDA genomic evaluations were first released in January 2009 for Holsteins and Jerseys, in August 2009 for Brown Swiss, in April 2013 for Ayrshires, and in April 2016 for Guernseys. Producers have accepted genomic evaluations as accurate indications of a bull鈥檚 eventual daughter-based evaluation. The integration of DNA marker technology and genomics into the traditional evaluation system has doubled the rate of genetic progress for traits of economic importance, decreased generation interval, increased selection accuracy, reduced previous costs of progeny testing, and allowed identification of recessive lethals.
URLPMID:20412945 [本文引用: 1]
Abstract To facilitate routine genomic evaluation, a database was constructed to store genotypes for 50,972 single nucleotide polymorphisms (SNP) from the Illumina BovineSNP50 BeadChip (Illumina Inc., San Diego, CA). Multiple samples per animal are allowed. All SNP genotypes for a sample are stored in a single row. An indicator specifies whether the genotype for a sample was selected for use in genomic evaluation. Samples with low call rates or pedigree conflicts are designated as unusable. Among multiple samples that qualify for use in genomic evaluation, the one with the highest call rate is designated as usable. When multiple samples are stored for an animal, a composite is formed during extraction by using SNP genotypes from other samples to replace missing genotypes. To increase the number of SNP available, scanner output for approximately 19,000 samples was reprocessed. Any SNP with a minor allele frequency of > or = 1% for Holsteins, Jerseys, or Brown Swiss was selected, which was the primary reason that the number of SNP used for USDA genomic evaluations increased. Few parent-progeny conflicts ( or = 90%) were additional requirements that eliminated 2,378 SNP. Because monomorphic SNP did not degrade convergence during estimation of SNP effects, a single set of 43,385 SNP was adopted for all breeds. The use of a database for genotypes, detection of conflicts as genotypes are stored, online access for problem resolution, and use of a single set of SNP for genomic evaluations have simplified tracking of genotypes and genomic evaluation as a routine and official process. Copyright 2010 American Dairy Science Association. Published by Elsevier Inc. All rights reserved.
URL [本文引用: 5]
Genomic evaluations are desired for crossbred as well as purebred populations when selection is applied to commercial and not only breeding herds. Genomic breed composition was estimated from 60 671 markers using the known breeds of daughter-proven Holstein, Jersey, Brown Swiss and Ayrshire bulls as the four traits (breed fractions) to be predicted. Genotypes of 6 296 crossbred animals were imputed from lower density chips together with either their 3 119 ancestors or all 834 367 genotyped animals. Estimates of breed composition were adjusted so that no values were negative or exceeded 100 and the four breed percentages summed to 100. The crossbreds included 733 Jersey x Holstein crossbreds with >40% of both breeds (F1 crosses), 55 Brown Swiss x Holstein F1, 2 300 Holstein backcrosses with >67% and <90% Holstein, 2 026 Jersey backcrosses, 27 Brown Swiss backcrosses and 502 other crossbreds of various mixtures. Crossbred evaluations were averages of direct genomic values computed using marker effects for each pure breed, weighted by the animal鈥檚 genomic breed composition. The marker effects were estimated separately for each breed on the all-breed scale instead of the within-breed scales currently used.
URLMagsci [本文引用: 1]
<FONT face=Verdana>采用美国ABI公司牛亲子鉴定试剂盒(Bovine Paternity PCR Typing Kit, 包括11个常染色体)和3个自选的Y染色体微卫星座位, 检测我国部分种公牛站肉用种公牛14个微卫星座位的多态性分布, 评估其遗传多样性, 并探讨其用于个体识别与亲缘鉴定的可行性。结果表明: 种公牛在14个微卫星座位中遗传多样性均较高, 其中MCM158座位的平均多态信息含量最高达到0.888, <EM>ETH10</EM>座位的最低, 为0.482。单个座位的个体识别能力在0.715~0.968之间, 累积个体识别能力为99.99%, 累计非父排除率达到99.99%, 表明采用的14个位点适用于个体识别和亲缘鉴定。</FONT> <P></P>
URLMagsci [本文引用: 1]
<P>选用联合国粮农组织(FAO)和国际动物遗传学会(ISAG)推荐的12对微卫星引物, 采用荧光标记–多重PCR技术, 检测了9个中国地方黄牛品种和3个外来牛品种的遗传多样性。利用等位基因频率计算出各群体的平均遗传杂合度(H)、多态信息含量(PIC)和群体间的DA及DS遗传距离。基于DA遗传距离, 用UPGMA法进行聚类分析, 结果12个中外牛品种被聚为4类: Ⅰ类属于南方黄牛品种, 包括恩施牛、黎平牛、昭通牛和川南山地牛; Ⅱ类属于中原黄牛品种, 包括郏县红牛、早胜牛和平陆山地牛; Ⅲ类属于北方黄牛, 包括延边牛和长白地方牛; Ⅳ类属于外来牛品种, 包括西门塔尔牛、夏洛来牛和德国黄牛。研究结果为中国地方牛品种的保护和利用提供了理论依据。</P>
URLPMID:15844419 [本文引用: 1]
To determine whether a selected set of 20 single nucleotide polymorphism (SNP) markers derived from beef cattle populations can be used to verify sample tracking in a commercial slaughter facility that processes primarily market (ie, culled) dairy cows.Prospective, blinded validation study.165 cows and 3 bulls from 18 states (82% Holstein, 8% other dairy breeds, and 10% beef breeds).Blood was collected by venipuncture from randomly chosen animals just prior to slaughter. The purported corresponding liver samples were collected during beef processing, and genotype profiles were obtained for each sample.On the basis of SNP allele frequencies in these cattle, the mean probability that 2 randomly selected individuals would possess identical genotypes at all 20 loci was 4.3 x 10(-8). Thus, the chance of a coincidental genotype match between 2 animals was 1 in 23 million. Genotype profiles confirmed appropriate matching for 152 of the 168 (90.5%) purported blood-liver sample pairs and revealed mismatching for 16 (9.5%) pairs. For the 16 mismatched sample pairs, 33% to 76% of the 20 SNP genotypes did not match (mean, 52%). Discordance that could be attributed to genotyping error was estimated to be < 1% on the basis of results for split samples.Results suggest that this selected set of 20 bovine SNP markers is sufficiently informative to verify accuracy of sample tracking in slaughter plants that process beef or dairy cattle. These or similar SNP markers may facilitate high-throughput, DNA-based, traceback programs designed to detect drug residues in tissues, control of animal diseases, and enhance food safety.
URLPMID:25592880 [本文引用: 6]
Background Estimation of individual ancestry from genetic data is useful for the analysis of disease association studies, understanding human population history and interpreting personal genomic variation. New, computationally efficient methods are needed for ancestry inference that can effectively utilize existing information about allele frequencies associated with different human populations and can work directly with DNA sequence reads. Results We describe a fast method for estimating the relative contribution of known reference populations to an individual???s genetic ancestry. Our method utilizes allele frequencies from the reference populations and individual genotype or sequence data to obtain a maximum likelihood estimate of the global admixture proportions using the BFGS optimization algorithm. It accounts for the uncertainty in genotypes present in sequence data by using genotype likelihoods and does not require individual genotype data from external reference panels. Simulation studies and application of the method to real datasets demonstrate that our method is significantly times faster than previous methods and has comparable accuracy. Using data from the 1000 Genomes project, we show that estimates of the genome-wide average ancestry for admixed individuals are consistent between exome sequence data and whole-genome low-coverage sequence data. Finally, we demonstrate that our method can be used to estimate admixture proportions using pooled sequence data making it a valuable tool for controlling for population stratification in sequencing based association studies that utilize DNA pooling. Conclusions Our method is an efficient and versatile tool for estimating ancestry from DNA sequence data and is available from https://sites.google.com/site/vibansal/software/iAdmix webcite.
URLPMID:28200055 [本文引用: 1]
Abstract To enable direct comparison of ancestry background in different studies, we developed LASER to estimate individual ancestry by placing either sequenced or genotyped samples in a common ancestry space, regardless of the sequencing strategy or genotyping array used to characterize each sample. Here we describe the LASER server to facilitate application of the method to a wide range of genetic studies. The server provides genetic ancestry estimation for different geographic regions and user-friendly interactive visualization of the results. Availability: The LASER server is freely accessible at http://laser.sph.umich.edu/. Contacts:dtaliun@umich.edu, wangcl@gis.a-star.edu.sg. Supplementary information : Supplementary data are available at Bioinformatics online.
URL [本文引用: 1]
Genetic markers provide a useful tool toestimate pairwise coancestry betweenindividuals in the absence of a known pedigree. Inthe present work 62 pigs from two relatedstrains of Iberian breed, Guadyerbas andTorbiscal, belonging to a conservationprogramme with completely known pedigrees since1945, have been genotyped for 49microsatellites. Four coefficients thatsummarise molecular resemblance betweenindividuals together with eightestimators of coancestry have been calculatedfrom this information. Their values werecompared with the genealogical coancestry,calculated from the complete or partialpedigree. The eight estimations obtained usingmolecular information substantiallyunderestimate the coancestry calculated usingthe genealogical analysis. The correlationbetween the estimates and the genealogicalvalues was also calculated. This correlationwas high, between 0.78 and 0.93 for differentestimators, when all pairwise comparisons amongthe 62 animals were considered. However, thecorrelation decreases remarkably to 0.49鈥0.69and 0.37鈥0.47 for the Guadyerbas and Torbiscalpopulations respectively, when they wereanalysed separately. All the correlations weresimilar to those obtained when using simplecoefficients of molecular resemblance such asmolecular coancestry or similarity indexes.Finally, simulations were carried out tofurther explore the results obtained. It isconcluded that lack of information on theallele frequencies in the base population mayexplain the bias of these estimators inpopulations with complex pedigrees.
URLPMID:3176119 [本文引用: 1]
ABSTRACT Inbreeding depression, which refers to reduced fitness among offspring of related...
URLPMID:2832667 [本文引用: 2]
Abstract As we move forward from the current generation of genome-wide association (GWA) studies, additional cohorts of different ancestries will be studied to increase power, fine map association signals, and generalize association results to additional populations. Knowledge of genetic ancestry as well as population substructure will become increasingly important for GWA studies in populations of unknown ancestry. Here we propose genotyping pooled DNA samples using genome-wide SNP arrays as a viable option to efficiently and inexpensively estimate admixture proportion and identify ancestry informative markers (AIMs) in populations of unknown origin. We constructed DNA pools from African American, Native Hawaiian, Latina, and Jamaican samples and genotyped them using the Affymetrix 6.0 array. Aided by individual genotype data from the African American cohort, we established quality control filters to remove poorly performing SNPs and estimated allele frequencies for the remaining SNPs in each panel. We then applied a regression-based method to estimate the proportion of admixture in each cohort using the allele frequencies estimated from pooling and populations from the International HapMap Consortium as reference panels, and identified AIMs unique to each population. In this study, we demonstrated that genotyping pooled DNA samples yields estimates of admixture proportion that are both consistent with our knowledge of population history and similar to those obtained by genotyping known AIMs. Furthermore, through validation by individual genotyping, we demonstrated that pooling is quite effective for identifying SNPs with large allele frequency differences (i.e., AIMs) and that these AIMs are able to differentiate two closely related populations (HapMap JPT and CHB).
URLPMID:21278116 [本文引用: 5]
Knowledge of breed composition can be useful in multiple aspects of cattle production, and can be critical for analyzing the results of whole genome-wide association studies currently being conducted around the world. We examine the feasibility and accuracy of using genotype data from the most prevalent bovine genome-wide association studies platform, the Illumina BovineSNP50 array (Illumina Inc., San Diego, CA), to estimate breed composition for individual breeds of cattle. First, allele frequencies (of Illumina-defined allele B) of SNP on the array for each of 16 beef cattle breeds were defined by genotyping a large set of more than 2,000 bulls selected in cooperation with the respective breed associations to be representative of their breed. With these breed-specific allele frequencies, the breed compositions of approximately 2,000 two-, three-, and four-way cross (of 8 breeds) cattle produced at the US Meat Animal Research Center were predicted by using a simple multiple regression technique or Mendel (http://www.genetics.ucla.edu/software/mendel) and their genotypes from the Illumina BovineSNP50 array, and were then compared with pedigree-based estimates of breed composition. The accuracy of marker-based breed composition estimates was 89% when using either estimation method for all breeds except Angus and Red Angus (averaged 79%), based on comparing estimates with pedigree-based average breed composition. Accuracy increased to approximately 88% when these 2 breeds were combined into an aggregate Angus group. Additionally, we used a subset of these markers, approximately 3,000 that populate the Illumina Bovine3K (Illumina Inc.), to see whether breed composition could be estimated with similar accuracy when using this reduced panel of SNP makers. When breed composition was estimated using only SNP in common with the Bovine 3K array, accuracy was slightly reduced to 83%. These results suggest that SNP data from these arrays could be used to estimate breed composition in most US beef cattle in situations where pedigree is not known (e.g., multiple-sire natural service matings, non-source-verified animals in feedlots or at slaughter). This approach can aid analyses that depend on knowledge of breed composition, including identification and adjustment of breed-based population stratification, when performing genome-wide association studies on populations with incomplete pedigrees. In addition, SNP-based breed composition estimates may facilitate fitting cow germplasm to the environment, managing cattle in the feedlot, and tracing disease cases back to the geographic region or farm of origin.
URL [本文引用: 2]
URL [本文引用: 2]
[本文引用: 3]
URLPMID:11462172 [本文引用: 1]
The major causes of fragile X syndrome are mutational expansion of the CGG repeat in the FMR1 gene, hypermethylation, and transcriptional silencing. Most fragile X embryos develop somatic mosaicism of disease-causing "full" expansions of different lengths. Homogeneity of the mosaic patterns among multiple tissues in the same individual indicates that these previously unstable expansions acquire mitotic stability early in fetal life. Since mitotic stability is found strictly associated with hypermethylation in adult tissues, current theory has fixed the time of instability to developmental stages when fully expanded CGG repeats exist in an unmethylated state. We used murine embryocarcinoma (EC) cells (PC13) as a model system of pluripotent embryonic cells. Hypermethylated and unmethylated full expansions on human fragile X chromosomes were transferred from murine A9 hybrids into EC cells, by means of microcell fusion. As demonstrated in the present study for the first time, even full expansion alleles that were fully methylated and stable in the donors' fibroblasts and in A9 became demethylated, reactivated, and destabilized in undifferentiated EC hybrids. When destabilized expansions were reintroduced from EC cells into A9, instability was reversed to stability. Our results strongly support the idea that fully expanded alleles are initially unstable and unmethylated in the human embryo and gain stability upon genetic or epigenetic change of the embryonic cells.
URLPMID:16862161 [本文引用: 1]
Abstract Population stratification--allele frequency differences between cases and controls due to systematic ancestry differences-can cause spurious associations in disease studies. We describe a method that enables explicit detection and correction of population stratification on a genome-wide scale. Our method uses principal components analysis to explicitly model ancestry differences between cases and controls. The resulting correction is specific to a candidate marker's variation in frequency across ancestral populations, minimizing spurious associations while maximizing power to detect true associations. Our simple, efficient approach can easily be applied to disease studies with hundreds of thousands of markers.
URL [本文引用: 2]
URLPMID:24045484 [本文引用: 5]
Reliable breed assignment can be performed with SNP. Currently, high density SNP chips are available with large numbers of SNP from which the most informative SNP can be selected for breed assignment. Several methods have been published to select the most informative SNP to distinguish among breeds. In this study, we evaluated Delta, Wright's FST, and Weir and Cockerham's FST, and extended these methods by adding a rule to avoid selection of sets of SNP in high linkage disequilibrium (LD) providing the same information. The SNP that had a r2 value>0.3 with any of the SNP already selected were discarded. The different selection methods were evaluated for both the 50K SNP and 777K Bovine BeadChip. Animals from 4 cattle breeds (989 Holstein Friesian, 97 Groningen White headed, 137 Meuse-Rhine-Yssel, and 64 Dutch Friesian) were genotyped. After editing 30,447 and 452,525 SNP were available for the 50K and 777K SNP chip, respectively. All selection methods showed that only a small set of SNP is needed to differentiate among the 4 Dutch cattle breeds, whereas comparison of the selection methods showed only small differences. In general, the 777K performed marginally better than the 50K BeadChip, especially at higher confidence thresholds. The rule to avoid selection of SNP in high LD reduced the required number of SNP to achieve correct breed assignment. The Global Weir and Cockerham's FST performed marginally better than other selection methods. There was little overlap in the SNP selected from the 2 BeadChips, whereas the number of SNP selected was about the same.
URLPMID:15439261 [本文引用: 1]
The articles published by the Annals of Eugenics (1925–1954) have been made available online as an historical archive intended for scholarly use. The work of eugenicists was often pervaded by prejudice against racial, ethnic and disabled groups. The online publication of this material for scholarly research purposes is not an endorsement of those views nor a promotion of eugenics in any way.
[本文引用: 1]
In:
[本文引用: 2]
URL [本文引用: 1]
This book is intended to provide engineering and/or statistics students, communications engineers, and mathematicians with the firm theoretic basis of (or ) in information theory. Although information theory consists of two main areas, source coding and channel coding, the authors choose here to focus only on source coding. The reason is that, in a sense, it is more basic than channel coding, and also because of recent achievements in source coding and compression. An important feature of the book is that whenever possible, the authors describe coding methods, i.e., the methods that can be used without prior knowledge of the statistical properties of the data. The authors approach the subject of source coding from the very basics to the top frontiers in an intuitively transparent, but mathematically sound, manner.
URL [本文引用: 1]
URLPMID:48 [本文引用: 1]
Abstract Low-density (LD) single nucleotide polymorphism (SNP) arrays provide a cost-effective solution for genomic prediction and selection, but algorithms and computational tools are needed for the optimal design of LD SNP chips. A multiple-objective, local optimization (MOLO) algorithm was developed for design of optimal LD SNP chips that can be imputed accurately to medium-density (MD) or high-density (HD) SNP genotypes for genomic prediction. The objective function facilitates maximization of non-gap map length and system information for the SNP chip, and the latter is computed either as locus-averaged (LASE) or haplotype-averaged Shannon entropy (HASE) and adjusted for uniformity of the SNP distribution. HASE performed better than LASE with 芒聣陇1,000 SNPs, but required considerably more computing time. Nevertheless, the differences diminished when >5,000 SNPs were selected. Optimization was accomplished conditionally on the presence of SNPs that were obligated to each chromosome. The frame location of SNPs on a chip can be either uniform (evenly spaced) or non-uniform. For the latter design, a tunable empirical Beta distribution was used to guide location distribution of frame SNPs such that both ends of each chromosome were enriched with SNPs. The SNP distribution on each chromosome was finalized through the objective function that was locally and empirically maximized. This MOLO algorithm was capable of selecting a set of approximately evenly-spaced and highly-informative SNPs, which in turn led to increased imputation accuracy compared with selection solely of evenly-spaced SNPs. Imputation accuracy increased with LD chip size, and imputation error rate was extremely low for chips with 芒聣楼3,000 SNPs. Assuming that genotyping or imputation error occurs at random, imputation error rate can be viewed as the upper limit for genomic prediction error. Our results show that about 25% of imputation error rate was propagated to genomic prediction in an Angus population. The utility of this MOLO algorithm was also demonstrated in a real application, in which a 6K SNP panel was optimized conditional on 5,260 obligatory SNP selected based on SNP-trait association in U.S. Holstein animals. With this MOLO algorithm, both imputation error rate and genomic prediction error rate were minimal.
URL [本文引用: 1]
[本文引用: 1]
URLPMID:4076979 [本文引用: 1]
Abstract BACKGROUND: Genotype imputation can help reduce genotyping costs particularly for implementation of genomic selection. In applications entailing large populations, recovering the genotypes of untyped loci using information from reference individuals that were genotyped with a higher density panel is computationally challenging. Popular imputation methods are based upon the Hidden Markov model and have computational constraints due to an intensive sampling process. A fast, deterministic approach, which makes use of both family and population information, is presented here. All individuals are related and, therefore, share haplotypes which may differ in length and frequency based on their relationships. The method starts with family imputation if pedigree information is available, and then exploits close relationships by searching for long haplotype matches in the reference group using overlapping sliding windows. The search continues as the window size is shrunk in each chromosome sweep in order to capture more distant relationships. RESULTS: The proposed method gave higher or similar imputation accuracy than Beagle and Impute2 in cattle data sets when all available information was used. When close relatives of target individuals were present in the reference group, the method resulted in higher accuracy compared to the other two methods even when the pedigree was not used. Rare variants were also imputed with higher accuracy. Finally, computing requirements were considerably lower than those of Beagle and Impute2. The presented method took 28 minutes to impute from 6 k to 50 k genotypes for 2,000 individuals with a reference size of 64,429 individuals. CONCLUSIONS: The proposed method efficiently makes use of information from close and distant relatives for accurate genotype imputation. In addition to its high imputation accuracy, the method is fast, owing to its deterministic nature and, therefore, it can easily be used in large data sets where the use of other methods is impractical.
