Vegetation cover change and driving factors in Fujian Province between 1975 and 2014
LIChao, ZHAOShu-Qing, FANGJing-Yun*, College of Urban and Environmental Sciences, and Key Laboratory for Earth Surface Processes of the Ministry of Education, Peking University, Beijing 100871, China 通讯作者:* 通信作者Author for correspondence (E-mail:jyfang@urban.pku.edu.cn) 收稿日期:2015-07-4 接受日期:2016-11-28 网络出版日期:2017-02-10 版权声明:2017植物生态学报编辑部本文是遵循CCAL协议的开放存取期刊,引用请务必标明出处。 基金资助:国家自然科学基金(31321061和31330012)
关键词:土地覆被;Landsat TM/MSS/OLI;长期变化;驱动因素;植被生态 Abstract Aims Fujian Province has been one of the most severe soil erosion regions since Ming and Qing Dynasty in China. Recently, several ecological restoration projects have been implemented and they have significantly changed vegetation cover in this region. Methods We analyzed the four-decade vegetation cover change in Fujian Province using seven time-series data of Landsat Multispectral Scanner (MSS), Thematic Mapper (TM), and Operational Land Imager (OLI) between 1975 and 2014. We further explored the possible drivers on vegetation cover change by incorporating statistical data of plantation, cropland and urbanized area. Important findings Vegetation coverage in Fujian Province has increased from 69.0% to 77.8% between 1975 and 2014. However, a slight decrease was observed between 1995 and 2005. Spatially, forest was the primary vegetation type in the northwest, where croplands and human settlements were scattered along rivers or oceans. Shrubs and bare lands were also scattered across the northwest. In southwest, the areas of bare land, shrub land and cropland decreased, while areas of forest and human settlements expanded. The vegetation coverage and urbanized area increased at the cost of cropland and bare land.
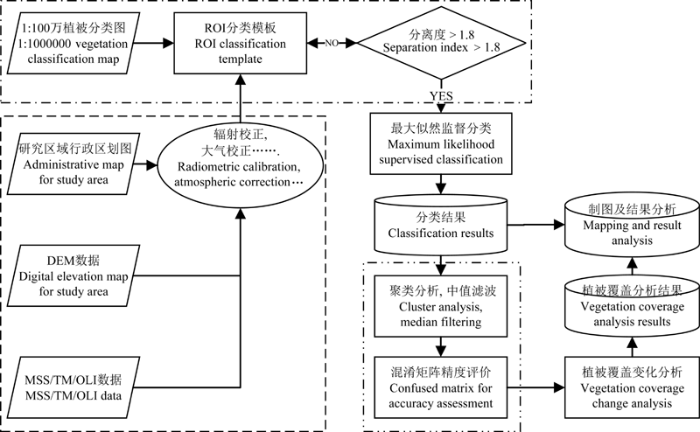
研究中使用的主要方法包括遥感植被覆盖分类方法和遥感数据处理方法。其中, 遥感植被覆盖分类方法是按照国际常用的遥感土地利用分类指标体系(Loveland & Pierce, 1995)并结合实际需要对数据进行简化, 具体如下: 城镇或建筑用地、农田用地、灌丛和草丛占地、森林占地、裸地、其他(水体、湿地、滩涂等)及未分类用地, 其中植被覆盖面积包括森林面积、灌丛和草丛占地面积。遥感图像处理流程见图1, 具体情况如下: 遥感数据预处理, 通过ENVI进行辐射校正、几何校正和FLAASH大气校正, 并结合30 m分辨率的SRTM3 DEM数据进行地形校正, 最后通过1:100万全国县级行政区矢量图对镶嵌图像进行分割, 形成研究区域遥感影像图, 待进一步处理。监督分类模板的建立和评价, 通过在监督分类中建立不同植被覆盖类型的分类度指标来判别分类模板是否合格来控制分类精度。再以1:100万全国植被分类图(侯学煜, 2001)和Google Earth近年高分影像(分辨率为1-2 m)为先验知识, 通过混淆矩阵对分类精度进行评价。其中, 农田与茶园、果园等灌丛和经济林在中等分辨率遥感数据下区分度较差, 且研究区域地处亚热带, 农作物种类较多, 季节性不明显, 目视解译及监督分类结果不是很理想, 故采用统计数据。分类后处理及变化检测分析, 通过监督分类结果的后处理, 如聚类分析、中值滤波等输出较为直观准确的监督分类图像, 最后通过图像的变化进行检测分析, 较直观地给出不同时间序列的图像中各类植被覆盖面积的变化情况。 显示原图|下载原图ZIP|生成PPT 图1遥感数据处理流程。短线框表示数据预处理; 短线单点框表示监督分类模板的建立和评价; 短线双点框表示分类后处理及变化检测分析。 -->Fig. 1Flow chart of OLI/TM/MSS data processing. The rectangular with dash line means data preprocessing. The rectangular with dash and point line means establishment and assessment of supervised classification model. The rectangular with dash and double points line means post processing and change analysis. -->
通过监督分类结果(图2)可知, 福建省自1975年以来植被覆盖面积一直较大, 北部森林分布密集, 南部灌丛、草丛和农田分布广泛; 城镇和裸地、农田主要沿河或沿海分布, 其中农田、裸地呈斑块化分布; 再者, 1985年西部和河流沿岸裸地面积增加, 1995和2000年沿海城镇面积增加, 且2005年后森林面积增加较快, 裸地面积显著减少, 但沿海城市面积持续增加。 显示原图|下载原图ZIP|生成PPT 图21975-2014年福建省植被覆盖图。坐标系统: 北京-54。单位: m。 -->Fig. 2Vegetation coverage of Fujian Province between 1975 and 2014. Project system: Beijing-54. Unit: m. -->
通过对监督分类结果的变化检测可得到福建省植被覆盖面积变化图(图3)。图3展示了1975至1985年、1995年、2000年、2005年、2010年和2014年植被覆盖面积变化特征。其中, 1975-1985年南部灌丛、草丛和农田面积增加, 北部沿海及中北部植被覆盖面积略有减少; 1975-1995年中北部森林、灌丛和草丛得到恢复, 沿海区域植被覆盖面积减少, 城镇面积增加; 1975-2000年北部沿海和中部区域植被覆盖面积都减少, 中南部沿海城镇化面积增加; 1975- 2005年南部及沿海植被覆盖面积全面增加, 其他区域增加不显著, 南平、三明等中北部城镇化面积增加; 1975-2010年沿海植被恢复, 中北部城镇化面积增加; 1975-2014年南部、北部和沿海区域植被覆盖面积增加显著, 西南部裸地面积大量减少。 显示原图|下载原图ZIP|生成PPT 图31975-2014年福建省植被覆盖变化。小幅变化为像元值变化小于1%, 大幅变化为像元值变化大于等于1%。坐标系统: 北京-54。单位: m。 -->Fig. 3Vegetation cover change of Fujian Province between 1975 and 2014. Small change means the ratio of changed numbers of pixels is less than 1%, and big change means vice versa. Project system: Beijing-54. Unit: m. -->
2.3 植被覆盖面积变化及其驱动因素
通过上述检测手段得到植被覆盖面积变化检测图和分类变化结果(表3; 图4, 图5)。40年来, 福建省植被覆盖经历了增加—减少—增加的过程, 但总体上增加; 森林面积和城市面积持续增长; 农田面积、灌丛和草丛面积和裸地面积总体上减少。 Table 3 表3 表31975-2014年福建省土地利用面积变化及贡献率(面积单位: 104 km2) Table 3Area changes and factor contributions to the changes of land use/cover in Fujian Province between 1975 and 2014 (area unit: 104 km2)
森林Forest
人工林 Plantation
城镇 Urban
农田 Cropland
灌丛和草丛 Shrub & grass
裸地 Bare land
未分类用地 Unclassified
植被覆盖 Vegetation cover
植被覆盖率 Vegetation cover rate (%)
1975
6.334
1.640
0.047
1.450
2.043
1.889
0.377
8.377
69.0
1985
7.155
1.730
0.067
1.426
1.642
1.602
0.248
8.797
72.5
1995
7.117
3.060
0.154
1.392
1.993
1.403
0.081
9.111
75.0
2000
7.332
3.200
0.178
1.383
1.739
1.456
0.052
9.071
74.7
2005
7.393
3.390
0.212
1.348
1.538
1.493
0.156
8.931
73.6
2010
7.506
3.590
0.244
1.336
1.863
1.107
0.084
9.369
77.2
2014
8.060
3.980
0.268
1.311
1.382
1.079
0.040
9.442
77.8
面积变化 Area change
1.726
2.340
0.221
-0.139
-0.661
-0.810
-0.337
1.065
贡献率(%) Contribution rate
162.1
219.7
20.8
-13.1
-62.1
-76.1
-31.6
100
Total area of study region is 12.14 × 10⁴ km, contribute rate = (area change of various land use) ÷ (area change of total vegetation cover) × 100%. The data of planation area and cropland area were derived from statistical data, the rest of land use areas were derived from the interpretation of satellite images. Among them, the forest area contained the planation area.研究区域总面积为12.14 × 10⁴ km2, 贡献率=各类土地利用面积变化÷植被覆盖总面积变化×100%。人工林面积和耕地面积来源于统计数据, 其他土地利用类型数据来源于卫星影像的解译。其中, 人工林面积包含在森林面积之中。 新窗口打开 显示原图|下载原图ZIP|生成PPT 图4森林灌丛及植被覆盖面积变化。 -->Fig. 4Remotely sensed area changes of forest, shrub and vegetation cover. -->
显示原图|下载原图ZIP|生成PPT 图5农田、裸地及城镇或建筑用地面积变化。 -->Fig. 5Area changes of cropland, bare land and urban or built-up land based on statistics records. -->
CaoMK, LiKR (2000). Perspective on terrestrial ecosystem- climate interaction. Advance in Earth Sciences, 15, 446-452. (in Chinese with English abstract)[曹明奎, 李克让 (2000). 陆地生态系统与气候相互作用的研究进展. 地球科学进展 , 15, 446-452.] [本文引用: 1]
[2]
ChenZF (2014). Research of geographical condition monitoring of soil erosion in Fujian Province and its application—Taking 22 key counties as examples. Environmental Protection Science, 40(5), 45-50. (in Chinese with English abstract)[陈哲锋 (2014). 福建省水土流失地理国情监测研究与应用——以22个重点县为例 . 环境保护科学, 40(5), 45-50.] [本文引用: 1]
[3]
FangJY, PiaoSL, HeJS, MaWH (2003). Vegetation activity increasing in China over last 20 years. Science in China (Series C), 33, 554-565. (in Chinese)[方精云, 朴世龙, 贺金生, 马文红 (2003). 近20年来中国植被活动在增强 . 中国科学(C辑), 33, 554-565.] [本文引用: 1]
[4]
Fujian Provincial Bureau of Statistics (1999). Fujian Statistical Yearbook. China Statistics Press, Beijing. 142. (in Chinese)[福建省统计局 (1999). 福建统计年鉴. 中国统计出版社, 北京. 142.] [本文引用: 1]
[5]
Fujian Provincial Bureau of Statistics (2015). Fujian Statistical Yearbook. China Statistics Press, Beijing. 117. (in Chinese)[福建省统计局 (2015). 福建统计年鉴. 中国统计出版社, 北京. 117.] [本文引用: 2]
[6]
HongW, WuCZ (1999). Evaluation and analysis of forest vegetation potential productivity. System Sciences and Comprehensive Studies in Agriculture, 15(1), 48-53. (in Chinese with English abstract)[洪伟, 吴承祯 (1999). 福建省森林植被潜在生产力的估算及其分析 . 农业系统科学与综合应用, 15(1), 48-53.] [本文引用: 1]
[7]
HouXY (2001). 1:1000000 Vegetation Atlas of China. Science Press, Beijing. (in Chinese)[侯学煜 (2001). 1:100万中国植被图集. 科学出版社, 北京.] [本文引用: 1]
[8]
HoughtonRA (2002). Temporal patterns of land-use change and carbon storage in China and tropical Asia. Science in China (Series C), 45(Suppl.), 10-17. [本文引用: 1]
[9]
JiaK, WuB, TianY, ZengY, LiQ (2011). Vegetation classification method with biochemical composition estimated from remote sensing data. International Journal of Remote Sensing, 32, 9307-9325. [本文引用: 1]
[10]
JiangH, WangQM, WangXQ (2006). Dynamic monitoring of vegetation fraction by remote sensing in Changting County of Fujian Province. Journal of Natural Resources, 21, 126-132. (in Chinese with English abstract)[江洪, 王钦敏, 汪小钦 (2006). 福建省长汀县植被覆盖度遥感动态监测研究 . 自然资源学报, 21, 126-132.] [本文引用: 1]
[11]
JiangZL, ShaJM (2007). Study on the RS background value of vegetation eco-environment based on MODIS in Fujian Province. Research of Soil and Water Conservation, 14(4), 11-15. (in Chinese with English abstract)[江振蓝, 沙晋明 (2007). 基于MODIS的福建省植被生态环境遥感本底值研究 . 水土保持研究, 14(4), 11-15.] [本文引用: 1]
[12]
LeiWN, WenZM (2008). Research on soil erosion vegetation factor index based on community structure. Journal of Soil and Water Conservation, 22(5), 68-72. (in Chinese with English abstract)[雷婉宁, 温仲明 (2008). 基于植物群落结构的水土流失植被因子指数研究 . 水土保持学报, 22(5), 68-72.] [本文引用: 1]
[13]
LinC, ZhouSL, WuSH (2011). Evolution of soil erosion degree in 30 years in granite hills, southeastern of China—A case study of Changting County, Fujian. Scientia Geographica Sinica, 31, 1234-1241. (in Chinese with English abstract)[林晨, 周生路, 吴绍华 (2011). 30年来东南红壤丘陵区土壤侵蚀度时空演变研究——以长汀县为例 . 地理科学, 31, 1235-1241.] [本文引用: 1]
[14]
LinTS (2002). Vegetation destruction and soil erosion in Ming and Qing dynasty. Chinese Social and Economic Research, (3), 33-39. (in Chinese with English abstract)[林汀水 (2002). 明清福建植被的破坏与水土流失 . 中国社会经济史研究, (3), 33-39.] [本文引用: 1]
[15]
LiuJY, LiuML, ZhuangDF, ZhangZX, DengXZ (2002). Spatial pattern analysis of recent land cover change in China. Science in China (Series D: Earth Science), 32, 1031-1042. (in Chinese)[刘纪远, 刘明亮, 庄大方, 张增祥, 邓祥征 (2002). 中国近期土地利用变化的空间格局分析 . 中国科学: 地球科学, 32, 1031-1040.] [本文引用: 1]
[16]
LovelandTR, PierceLL (1995). A remote sensing based vegetation classification logic for global land cover analysis. Remote Sensing of Environment, 51, 39-48. [本文引用: 2]
[17]
PiaoS, FangJ, JiW, GuoQ, KeJ, TaoS (2004). Variation in a satellite-based vegetation index in relation to climate in China. Journal of Vegetation Science, 15, 219-226. [本文引用: 1]
[18]
QianLX, ChenYZ (2000). Spatial pattern of vegetation landscape and its responsibility on environment in Fujian . Journal of Henan University (Natural Science), 30(4), 66-73. (in Chinese with English abstract)[钱乐祥, 陈云增 (2000). 福建植被景观空间格局及其环境响应特征 . 河南大学学报: 自然科学版, 30(4), 66-73.] [本文引用: 1]
[19]
RuanXG, ZhengH, ZhangJ (2014). Clear water and green mountains are priceless—Documentary of soil erosion control in Changting County concerned by Comrade Xi Jinping. Soil and Water Conservation in China, (12), 1-5. (in Chinese with English abstract)[阮锡桂, 郑璜, 张杰 (2014). 绿水青山就是金山银山——习近平同志关心长汀水土流失治理纪实 . 中国水土保持, (12), 1-5.] [本文引用: 1]
[20]
State Forestry Administration of the People’s Republic of China (1987). China Forestry Statistical Yearbook. China Forestry Publishing House, Beijing. 1024. (in Chinese)[国家林业局 (1987). 中国林业统计年鉴. 中国林业出版社, 北京. 1024.] [本文引用: 2]
[21]
State Forestry Administration of the People’s Republic of China (2014). China Forestry Statistical Yearbook. China Forestry Publishing House, Beijing. 1174. (in Chinese)[国家林业局 (2014). 中国林业统计年鉴. 中国林业出版社, 北京. 1174.] [本文引用: 2]
[22]
WangKD, DengLY (2014). Dynamics of forest vegetation carbon stock in Fujian Province based on national forest inventories. Journal of Fujian College of Forestry, 34, 145-151. (in Chinese with English abstract)[王开德, 邓璐莹 (2014). 基于森林清查资料的福建森林植被碳储量及其动态变化 . 福建林学院学报, 34, 145-151.] [本文引用: 1]
[23]
WangWM, ChenMH, LinJL, WuQQ, ZhongBL, YueH (2005). Monitoring soil and water loss dynamics and its management measures in Changting County. Bulletin of Soil and Water Conservation, 25(4), 73-77. (in Chinese with English abstract)[王维明, 陈明华, 林敬兰, 吴清泉, 钟炳林, 岳辉 (2005). 长汀县水土流失动态变化及防治对策研究 . 水土保持通报, 25(4), 73-77.] [本文引用: 1]
[24]
WuGS, LinHH, ZhuHJ, ShaJM, DaiWY (2011). Spatial- temporal variation of typical red soil eroded landscape pattern: A case study in Changting County of Fujian Province. Chinese Journal of Applied Ecology, 22, 1825-1832. (in Chinese with English abstract)[武国胜, 林惠花, 朱鹤健, 沙晋明, 戴文远 (2011). 典型红壤侵蚀景观的时空变化——以福建长汀为例 . 应用生态学报, 22, 1825-1832.] [本文引用: 1]
[25]
XuHQ, HeH, HuangSL (2013). Analysis of fractional vegeta- tion cover change and its impact on thermal environment in the Hetian basin area of County Changting, Fujian Province, China. Acta Ecologica Sinica, 33, 2954-2963. (in Chinese with English abstract)[徐涵秋, 何慧, 黄绍霖 (2013). 福建省长汀县河田水土流失区植被覆盖度变化及其热环境效应 . 生态学报, 33, 2954-2963.] [本文引用: 1]
[26]
YangST, LiuCM, SunR (2002). The vegetation cover over last 20 years in Yellow River Basin. Acta Geographic Sinica, 57, 679-684. (in Chinese with English abstract)[杨胜天, 刘昌明, 孙睿 (2002). 近20年来黄河流域植被覆盖变化分析 . 地理学报, 57, 679-684.] [本文引用: 1]
[27]
ZhangP, ShaoG, ZhaoG, Le MasterDC, ParkerGR, DunningJB, LiQ (2000). China’s forest policy for the 21st century. Science, 288, 2135-2136. [本文引用: 1]
[28]
ZhangX, LiaoC, LiJ, SunQ (2013). Fractional vegetation cover estimation in arid and semi-arid environments using HJ-1 satellite hyperspectral data. International Journal of Applied Earth Observation and Geo-information, 21, 506-512. [本文引用: 1]
[29]
ZhangXS (1998). Development and utilization of grassland resources in southern China. Journal of Natural Resources, 13, 1-7. (in Chinese with English abstract)[张新时 (1998). 南方草地资源开发利用对策研究 . 自然资源学报, 13, 1-7.] [本文引用: 1]
[30]
ZhouR, YangYH, FangJY (2007). Responses of vegetation activity to precipitation variation on the Tibetan Plateau. Acta Scientiarum Naturalium Universitatis Pekinensis, 43, 771-775. (in Chinese with English abstract)[周睿, 杨元合, 方精云 (2007). 青藏高原植被活动对降水变化的响应 . 北京大学学报(自然科学版), 43, 771-775.] [本文引用: 1]
[31]
ZhouXC, LiHG, WangXQ (2007). An analysis about seasonal vegetation variety in Fujian Province using ENVISAT MERIS NDVI. Journal of Remote Sensing, 11, 617-624. (in Chinese with English abstract)[周小成, 励惠国, 汪小钦 (2007). 利用MERIS数据植被指数分析福建省植被长势季节变化. 遥感学报 , 11, 617-624.] [本文引用: 1]

 显示原图|下载原图ZIP|生成PPT
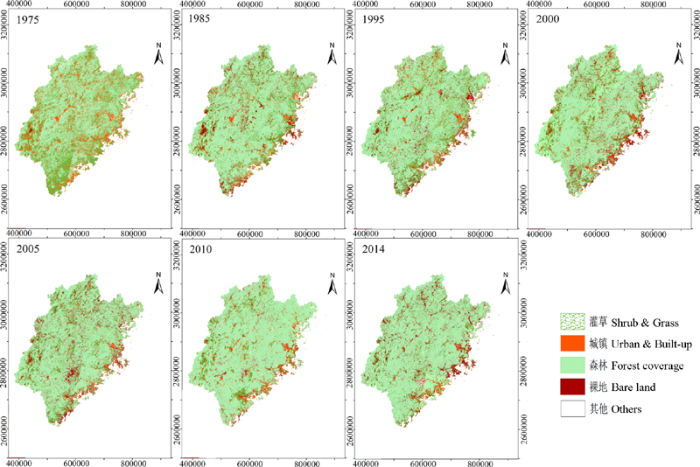 显示原图|下载原图ZIP|生成PPT
 显示原图|下载原图ZIP|生成PPT
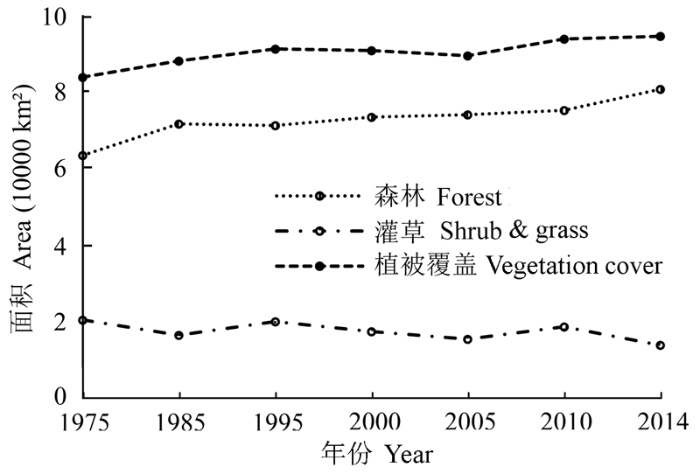 显示原图|下载原图ZIP|生成PPT
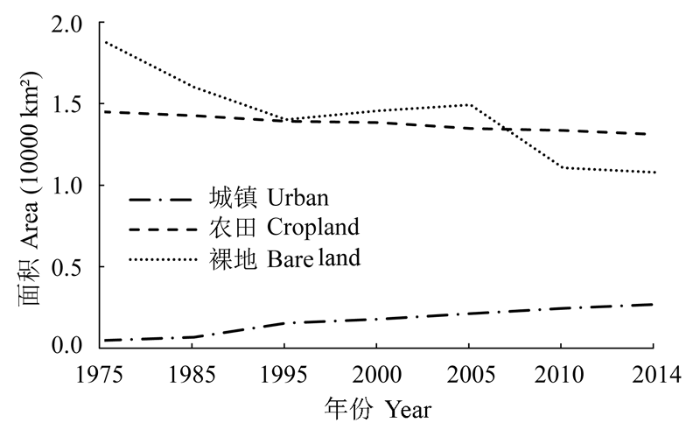 显示原图|下载原图ZIP|生成PPT
