HTML
--> --> -->All the major components of EASM, such as the western Pacific subtropical high (WPSH), the South Asian high, the upper-level East Asian westerly jet stream, and the low-level southwesterly jet, may affect EASM rainfall patterns and mei-yu activity (Tao and Chen, 1987; Ninomiya and Shibagaki, 2007; Sampe and Xie, 2010; Liu et al., 2019b; Ding et al., 2020). The northward progression of the East Asian westerly jet stream over East Asia in June can be seen as an early sign of the mei-yu onset (Li et al., 2004). The location and intensity of WPSH play an important role in setting the stage for flood and drought events in the Yangtze-Huaihe River valley (YHRV, Liu et al., 2012). The moisture transport which is regulated by the low-level southwesterly jet along the edge of the WPSH can affect the intensity of mei-yu rainfall (He et al., 2007).
Mei-yu characteristics (intensity, onset, retreat, and duration) exhibit significant interannual variations, which depend not only on the El Ni?o-Southern Oscillation (ENSO) and sea surface temperature (SST) anomaly in the Indian Ocean (Wu and Liu, 1995; Wu et al., 1995, 2000, 2003; Zhou and Wang, 2006; Kosaka et al., 2011; Zhou, 2011; Wang et al., 2013; Liu et al., 2019a), but also on the middle to high latitude wave trains over the Eurasian continent (Hsu and Lin, 2007). On sub-seasonal timescales, both the intraseasonal oscillation of 30?60 days (ISO) and the quasi-biweekly oscillation of 10?20 days (QBWO) are critical factors that affect the mei-yu activity (Ding and Liu, 2008; Chen et al., 2015; Song et al., 2016; Ding et al., 2020). The QBWO is more active during those years which have heavier rainfall attributed to mei-yu compared to normal years (Mao and Wu, 2005; Ouyang and Liu, 2020). The QBWO is evident in multiple meteorological variables of the EASM region (Yang et al., 2015; Zhu et al., 2020). The northwestward-propagating QBWO affects the summer rainfall of East China (Chen et al., 2015).
In the summer of 2020, the YHRV experienced an extreme mei-yu rainfall season that featured an earlier onset and a delayed retreat, as well as unusually intense and persistent rainfall events (Liu and Ding, 2020). The accumulated precipitation in the 2020 mei-yu season broke the historical record since 1961 and caused the worst flooding in the YHRV in recent decades with more than 140 dead or missing and $11.75 billion of economic losses by mid-July (Gan, 2020). The other two especially intense mei-yu rainfall seasons in the YHRV took place in 1998 and 2016 following super El Ni?o events, along with significant ISO and QBWO activities (Huang et al., 1998; Zhu et al., 2003; Mao and Wu, 2005; Shao et al., 2018). However, 2020 followed a weak central Pacific El Ni?o, and its influence was expected to be different from that of super El Ni?os (Feng and Li, 2011; Hu et al., 2012; Liu et al., 2020). Thus, it is necessary to answer the following questions: what causes this record-breaking mei-yu in the absence of a significant ENSO? How are the ISO or QBWO activities related and what is the nature of their impacts? What is the role played by the warming of the tropical Indian Ocean?
The remainder of this paper is organized as follows. Section 2 describes the datasets and methods used in this study. The characteristics of this record-breaking mei-yu, possible factors, and tropical SST forcing are analyzed in sections 3, 4, and 5, respectively. Section 6 is a summary and discussion.
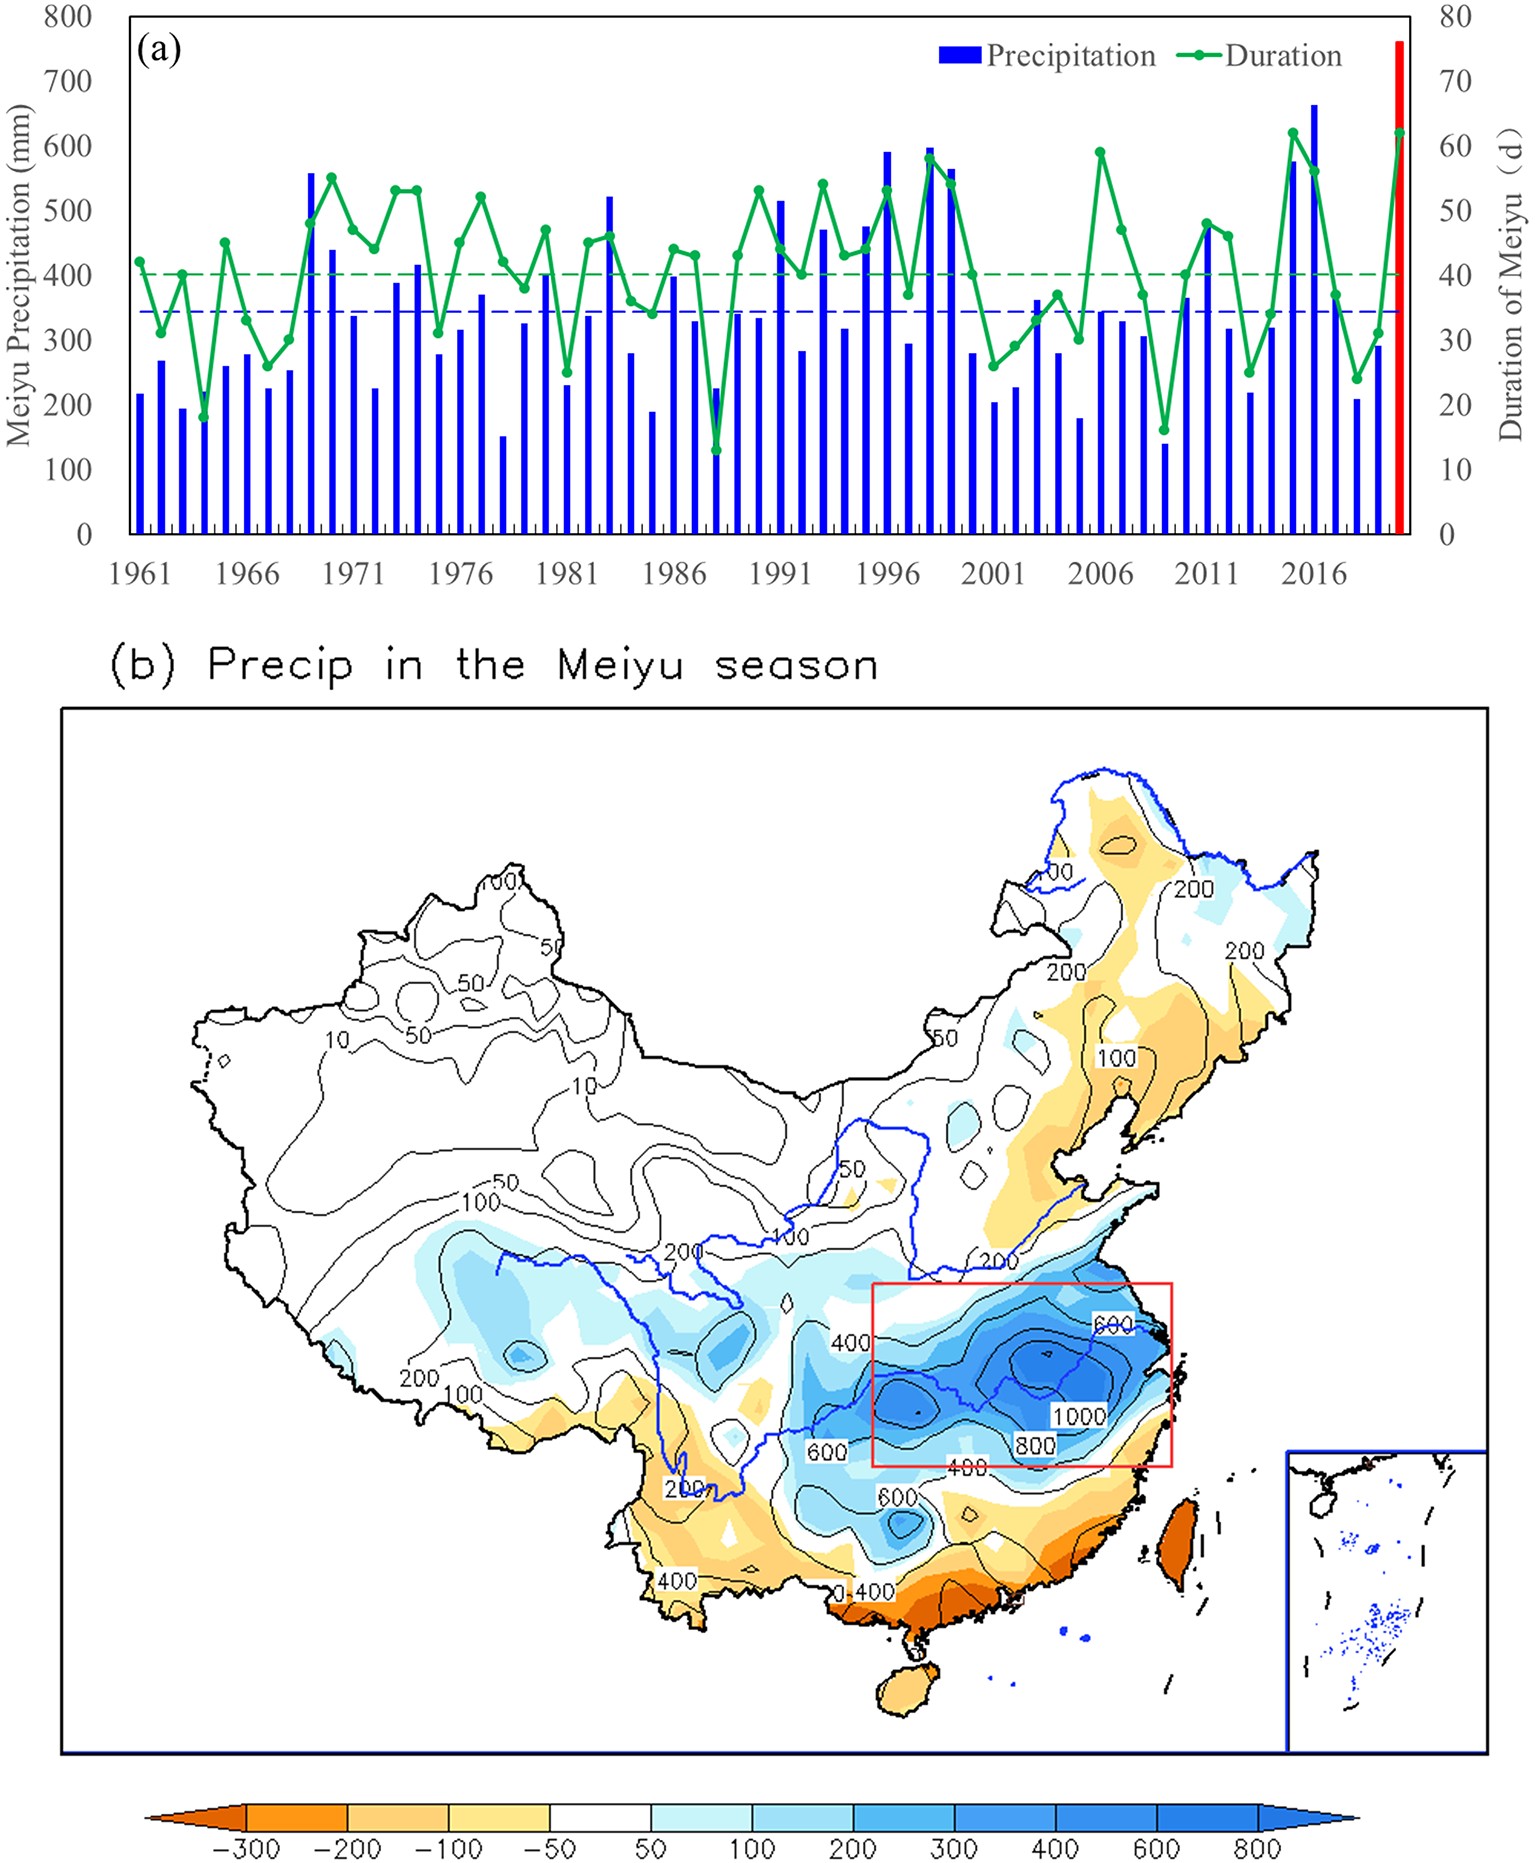 Figure1. (a) The accumulated precipitation (blue bars, mm) and duration of the mei-yu season (green lines, day) from 1961 to 2020 in the Yangtze-Huaihe River valley (YHRV). (b) Distributions of the accumulated precipitation (contour, mm) and corresponding anomaly (shading) during the mei-yu season in 2020. The red bar in (a) denotes the year 2020 and the dashed lines represent the mean of 1981–2010. The red rectangle in (b) represents the YHRV (110°–122.5°E, 28°–34°N).
To measure the tropical SSTA variations and their association with the atmosphere and the extreme mei-yu in 2020, we use the Ni?o3.4 and IOBM indices to represent the roles of ENSO and the tropical Indian Ocean SST anomaly, respectively. The Ni?o3.4 index is defined as the averaged SSTA in the region (5°S–5°N, 120°–170°W), and the IOBM index (Chambers et al., 1999) is the averaged SSTA in the region (20°S–20°N, 40°–110°E). The linear trends of these SST indices have been removed before calculating the correlation and reconstruction of the rainfall anomaly in the YHRV using these SST indices.
The statistical significance of the correlation is estimated by using the two-tailed Student’s t-test. For the mei-yu of 1961–2020, the correlation coefficients at the confidence levels of 90%, 95%, and 99% are 0.22, 0.26, and 0.33, respectively. The method of partial correlation is used to exclude the possible influence dominated by any particular factor (Sankar-Rao et al., 1996, Behera and Yamagata, 2003). The second-order Butterworth band-pass filter (Svalgaard et al., 2005) is used to extract the component of QBWO in this study, which is a common method for separating signals of different scales.
The spatial distribution of rainfall and its anomaly during the mei-yu season in 2020 is shown in Fig.1b. The accumulated precipitation amount in the YHRV tended to be greater than 400 mm, and above 800 mm along the middle and lower reaches of the Yangtze River, with the maximum center having precipitation amounts that exceeded 1,200 mm (Fig. 1b). Correspondingly, the precipitation amount was 200?800 mm above the climatological mean in most areas of YHRV, and more than twice the climatological mean in some areas (Fig. 1b), which exceeded the amounts observed during the same period in 1998 and 2016 (Huang et al., 1998; Yuan et al., 2017). During the mei-yu season, there were 10 heavy rainfall processes (defined as severe weather events with observed precipitation exceeding 50 mm d?1 and the duration lasting no less than three days) occurring over the YHRV, with high overlap and significant extremes (Chen et al., 2020). 18 national meteorological stations in Jiangxi, Anhui, Hubei, and Hunan Provinces broke their historical extreme records for daily precipitation.
Figure 2 shows the daily evolution of the main rainbelt over eastern China during the mei-yu season in 2020. It is shown that the mei-yu onset occurred south of YHRV before the rainbelt withdrew into southern China (south of 25°N). Then the mei-yu rainbelt had rapidly moved northward beginning 9 June and occupied most of the YHRV region during 10–16 June. Subsequently, the heavy rainfall occurred repeatedly over the lower and middle reaches of the Yangtze River and persisted for a long time, with a slight north-south oscillation. As a result, the mei-yu rainbelt spanned a wide meridional range. The duration of rainfall was 21 days in Hefei, Anhui Province, and 25 days in Anyi, Jiangxi Province, which broke their historical records (figure not shown). Coincident with the weakening of the rainfall intensity over the YHRV and the northward shift of the main rainbelt into North China, the mei-yu season concluded at the end of July.
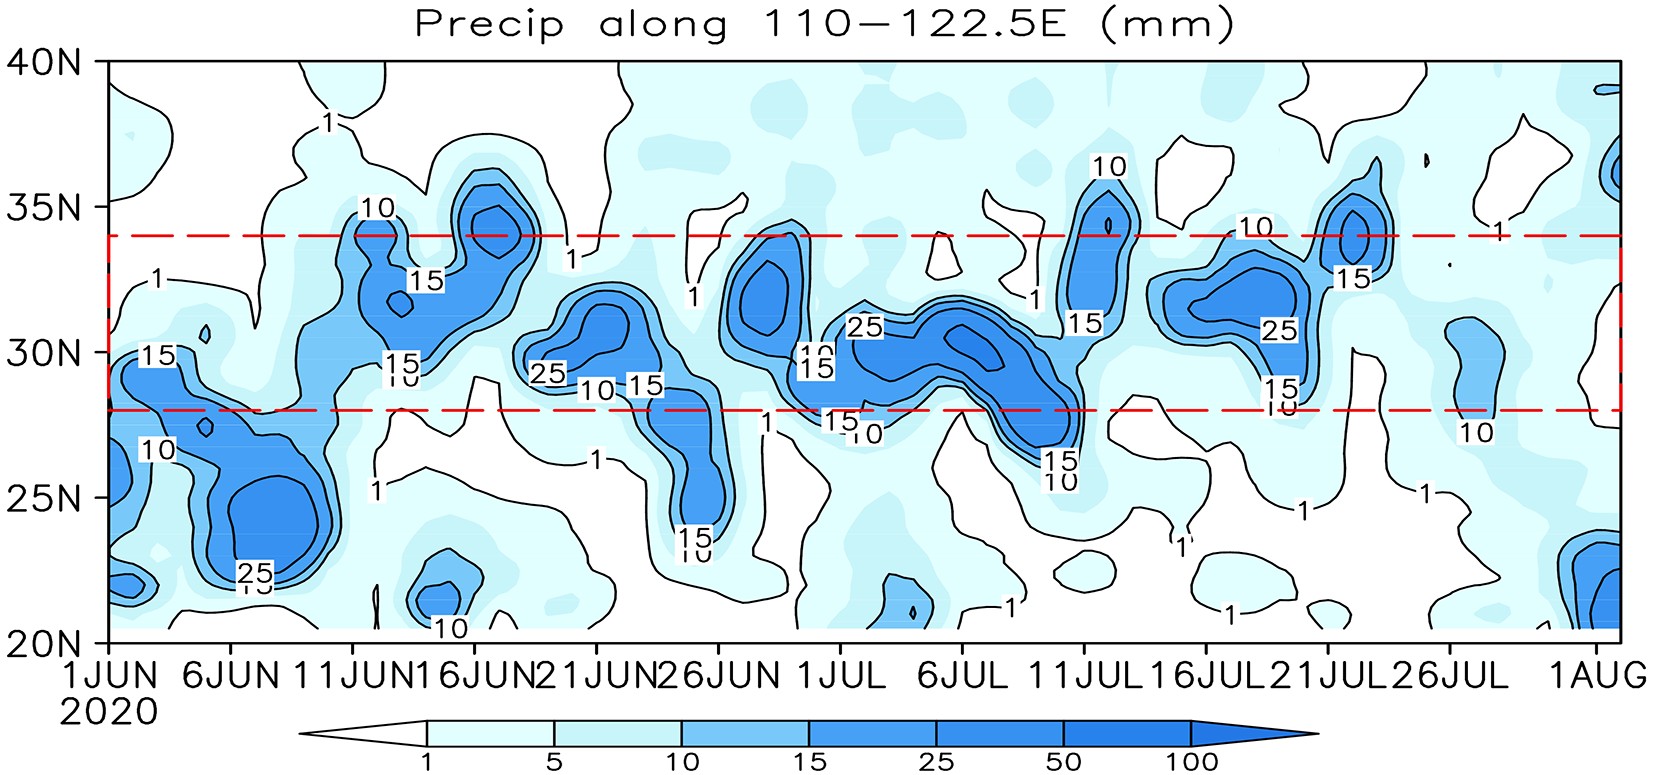 Figure2. Time?latitude cross-section of daily precipitation (units: mm) average of 110°–122.5°E during the mei-yu season in 2020. The red dash rectangle represents the latitudinal zone of the YHRV (28°–34°N).
Overall, the mei-yu season in 2020 featured an early onset, a delayed retreat, a long duration, a wide rainbelt, and multiple heavy rainfall processes, especially the stepwise oscillation of the mei-yu rainbelt on the sub-seasonal timescale. To reveal the possible reasons for such a record-breaking mei-yu season in 2020, we investigate the variations of the large-scale atmospheric circulation systems in the next section.
4.1. The western Pacific subtropical high
The location of the summer rainbelt over eastern China is largely determined by the location of the WPSH (Liu et al., 2012, 2019b). Two significant northward jumps of the WPSH occur around mid-June and mid-July which corresponded to the onset and retreat of the mei-yu season, respectively (Tao and Wei, 2006; Su and Xue, 2011). When the WPSH ridgeline lies within the range of 18°–26°N, it is conducive to the occurrence and persistence of the mei-yu in the YHRV (Niu et al., 2009; Liang et al., 2010; Hu et al., 2013). During the mei-yu season in 2020, the WPSH ridgeline showed significant QBWO features and experienced six northward jumps and southward withdrawals which occurred in stages (Fig. 3) and corresponded to the location of the mei-yu rainbelt (heavy rainfall area) in eastern China (Fig. 2). The first northward jump of the WPSH occurred around 30 May. The WPSH ridgeline crossed 18°N on 1 June, resulting in an early onset of the mei-yu over the southern part of the YHRV. After a brief southward withdrawal, the WPSH rapidly jumped northward again, to the north of 20°N, around 8 June, prompting the entire YHRV to enter the mei-yu season on 9 June. The two northward jumps of the WPSH occurred much earlier than in previous years, and the amplitude of the QBWO was intensified, which is one of the factors accounting for the early onset of the 2020 mei-yu season.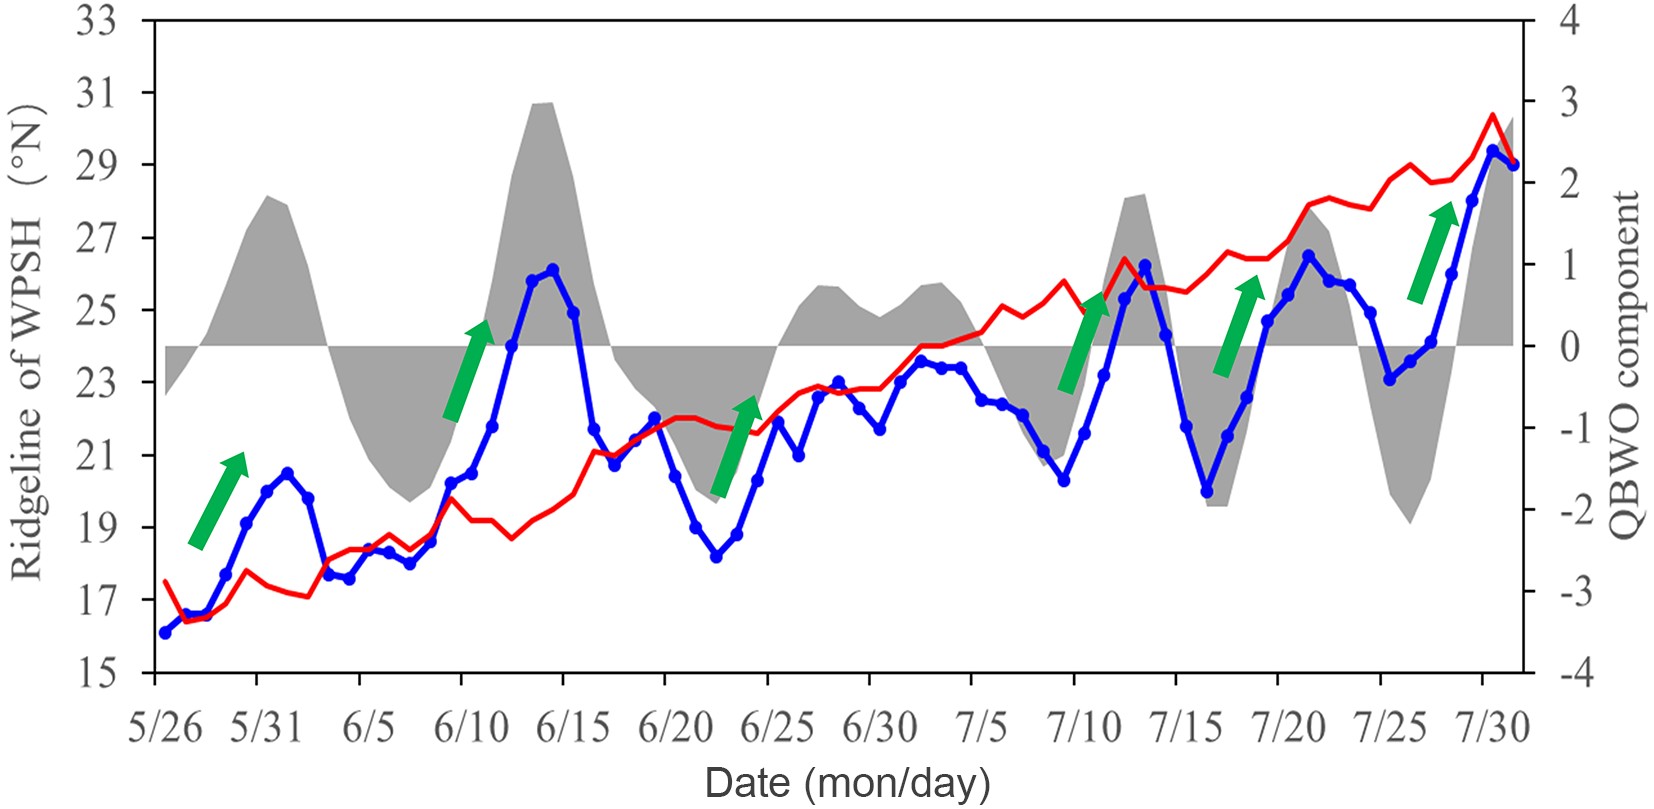 Figure3. Daily variation of the ridgeline of the western Pacific subtropical high (WPSH) along 110°–130°E during the mei-yu season in 2020 (blue line). The red line denotes the climatological mean, and the green bold arrows represent the northward uplift of the subtropical high. The grey shading is the quasi-biweekly oscillation (QBWO) component which is band-pass filtered with variability of 8–20 days.
The WPSH jumped northward for the third time on 24 June and oscillated between 20°–23°N from 25 June to 10 July. During this period, the amplitude of QBWO was relatively small, which provided favorable circulation conditions for the persistent heavy rainfall along the middle and lower reaches of the Yangtze River. In mid-July, the WPSH fluctuated twice and the corresponding rainbelt in the YHRV also showed a noticeable meridional swing. During 28–31 July, the WPSH significantly jumped northward, to the north of 26°N, for the sixth time. As a result, the summer monsoon rainbelt moved northward into North China, and the mei-yu season came to an end after persisting for two months.
The evolution of the WPSH meridional location is a key atmospheric circulation factor that led to the persistent extreme mei-yu season in 2020. The WPSH displayed obvious QBWO-like periodic variations, with six northward jumps and southward withdrawals that occurred in stages. These jumps and withdrawals were closely related to the onset and retreat of the mei-yu season, as well as the northward shift and stagnation of the mei-yu rainbelt.
2
4.2. Southwesterly low-level jet and water vapor transport
The low-level southwesterly jet was active over South China and included five intensified northward extensions, corresponding to the QBWO which occurred along with the meridional movement of the WPSH during the mei-yu season in 2020 (Fig. 4a). The formation of each strong southerly wind center and the associated convergence on its northern side can provide favorable dynamic conditions for the heavy rainfall in the lower troposphere. With multiple intensifications of the southwesterly jet, the corresponding convergence present on the northern side of the jet occurred repetitively (Fig. 4a), leading to the heavy rainfall processes. Furthermore, the low-level jet transported heat and moisture from the Arabian Sea, the Bay of Bengal, and the South China Sea into the YHRV (Figure not shown), providing further support for the formation of the mei-yu rainfall (He et al., 2007). Figure4. Time-latitude cross-section of (a) the 850 hPa meridional wind (contours, >1 m s?1) and southwesterly wind (vectors, m s?1), and divergence of the vertically integrated water vapor transport from the surface to 300 hPa (shading, 10?5 kg m?2 s?1); and (b) the geopotential height (black dashed lines, gpm), zonal wind (thin blue solid lines, m s?1), and horizontal divergence (shading, 10?6 s?1) along 110°–122.5°E at 200 hPa level during the 2020 mei-yu season. The red solid line in (b) is the latitude of the ridgeline of South Asian high. The number at the top of (a) and (b) indicate five establishment and strengthening processes of the low-level southerly centers, and five strengthening processes of the East Asian upper-level westerly jet, respectively.
The periodic intensification of the low-level southwesterly jet, the repeated formation of strong southerly wind centers over relatively stable locations, led to intensified water vapor transport, low-level convergence, and repeated ascent over the YHRV. As a result, the mei-yu persisted for a long time, accompanied by the frequent occurrence of heavy rainfall processes.
2
4.3. Upper-level East Asian westerly jet stream and South Asia high
The rapid northward jump of the South Asia High (SAH) is an early signal indicating the onset of the mei-yu season. The location and intensity of the upper-level East Asian westerly jet north of the SAH is closely related to the mei-yu rainfall (Zhang and Tao, 1999). Consistent with the variation of the atmospheric circulation systems in the lower and middle troposphere, the East Asian westerly jet experienced five alterations characterized by strengthening with northward shift and weakening with southward withdrawal, both occurring within a relatively stable location during the mei-yu season in 2020 (Fig. 4b). The SAH ridgeline was located between 20°–23°N before early June, corresponding to the mei-yu onset in the southern YHRV. After that, the westerly jet axis and the SAH ridgeline moved northward and stabilized around 37°–40°N and 26°–28°N, respectively. Under the combined influence of the relatively stable upper-level westerly jet stream and the SAH, the significant upper-level divergence was located to the south of the upper-level westerly jet axis and north of the SAH ridgeline, which is conducive to the development of vertical ascending motions and the formation of the mei-yu rainbelt over the YHRV. Consequently, the multiple intensifications of the upper-level westerly jet stream corresponded to the occurrence of heavy rainfall in the YHRV.It is suggested that the periodic enhancement of the upper-level westerly jet stream and the relatively stable location of SAH represent yet another two important atmospheric circulation factors that accounted for the extremely long mei-yu duration in 2020. Moreover, the meridional movement of the SAH and the intensification of the upper-level westerly jet on its northern side seemed to occur 1–3 days before the northward jump of the WPSH and the establishment of low-level southerly centers (Figs. 3, 4a). This finding suggests that the East Asian summer monsoon circulation evolves from the upper to the lower troposphere, and the anomalous variation in the upper-level atmospheric circulations may be precursors of the evolution of the mei-yu season.
2
4.4. Blocking high and cold air activities
The blocking high is a major atmospheric circulation system in the middle to high latitudes. The long-term persistence of a blocking high brings about persistent weather and climate anomalies (Tibaldi and Molteni, 1990). The mei-yu rainfall is the product of the interaction between the East Asian summer monsoon system and the Eurasian circulation system in the middle to high latitudes, including blocking high systems (Niu et al., 2009). During the mei-yu season in 2020, both the Okhotsk blocking high (eastern blocking) and the Ural blocking high (western blocking) were strong, and the Okhotsk blocking high was observed to be more stable and stronger than the Ural blocking high which is located further westward (Fig. 5).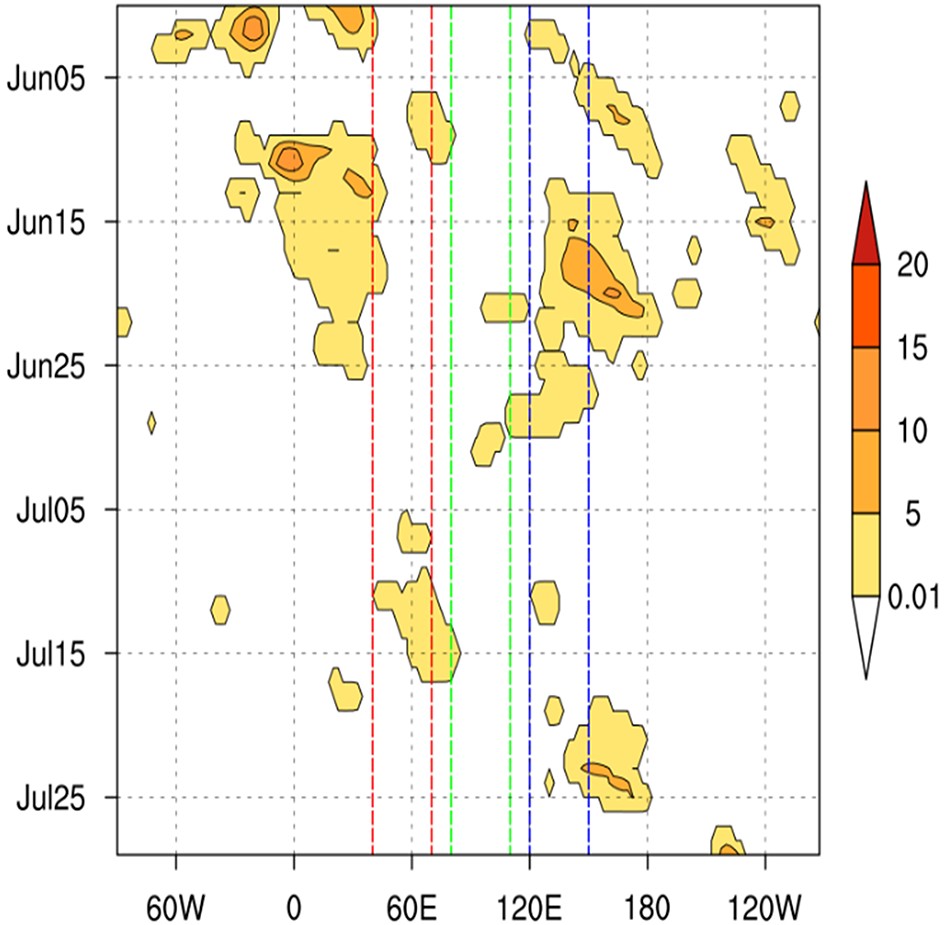 Figure5. Time-longitude cross-section of blocking strength (gpm) in the middle to high latitudes (40°–80°N), at the 500 hPa level, in the northern hemisphere. The red dashed lines denote the longitudinal range of the Ural region, the green dashed lines represent the longitudinal range of the Baikal region, and the blue dashed lines are the longitudinal range of the Okhotsk region.
Coincident with the two blocking highs, the Eurasian geopotential height field at the 500-hPa level (Z500) featured two ridges and one trough in the middle and high latitudes during the 2020 mei-yu season (Fig. 6). The two ridges were located over and to the west of the Ural Mountains and over the Okhotsk Sea extending to the Arctic region, respectively. The trough lied near the Balkhash Lake region with a wide meridional range, which enables the cold air from the high-latitudes to move southward along the northwesterly pathway (polar path) and thus affects eastern China. Cold air activities, which can be seen as one of the important factors leading to the persistent heavy rainfall, not only facilitate the convergence and uplift at the lower levels but also enhance the convective instability (Yao and Yu, 2005).
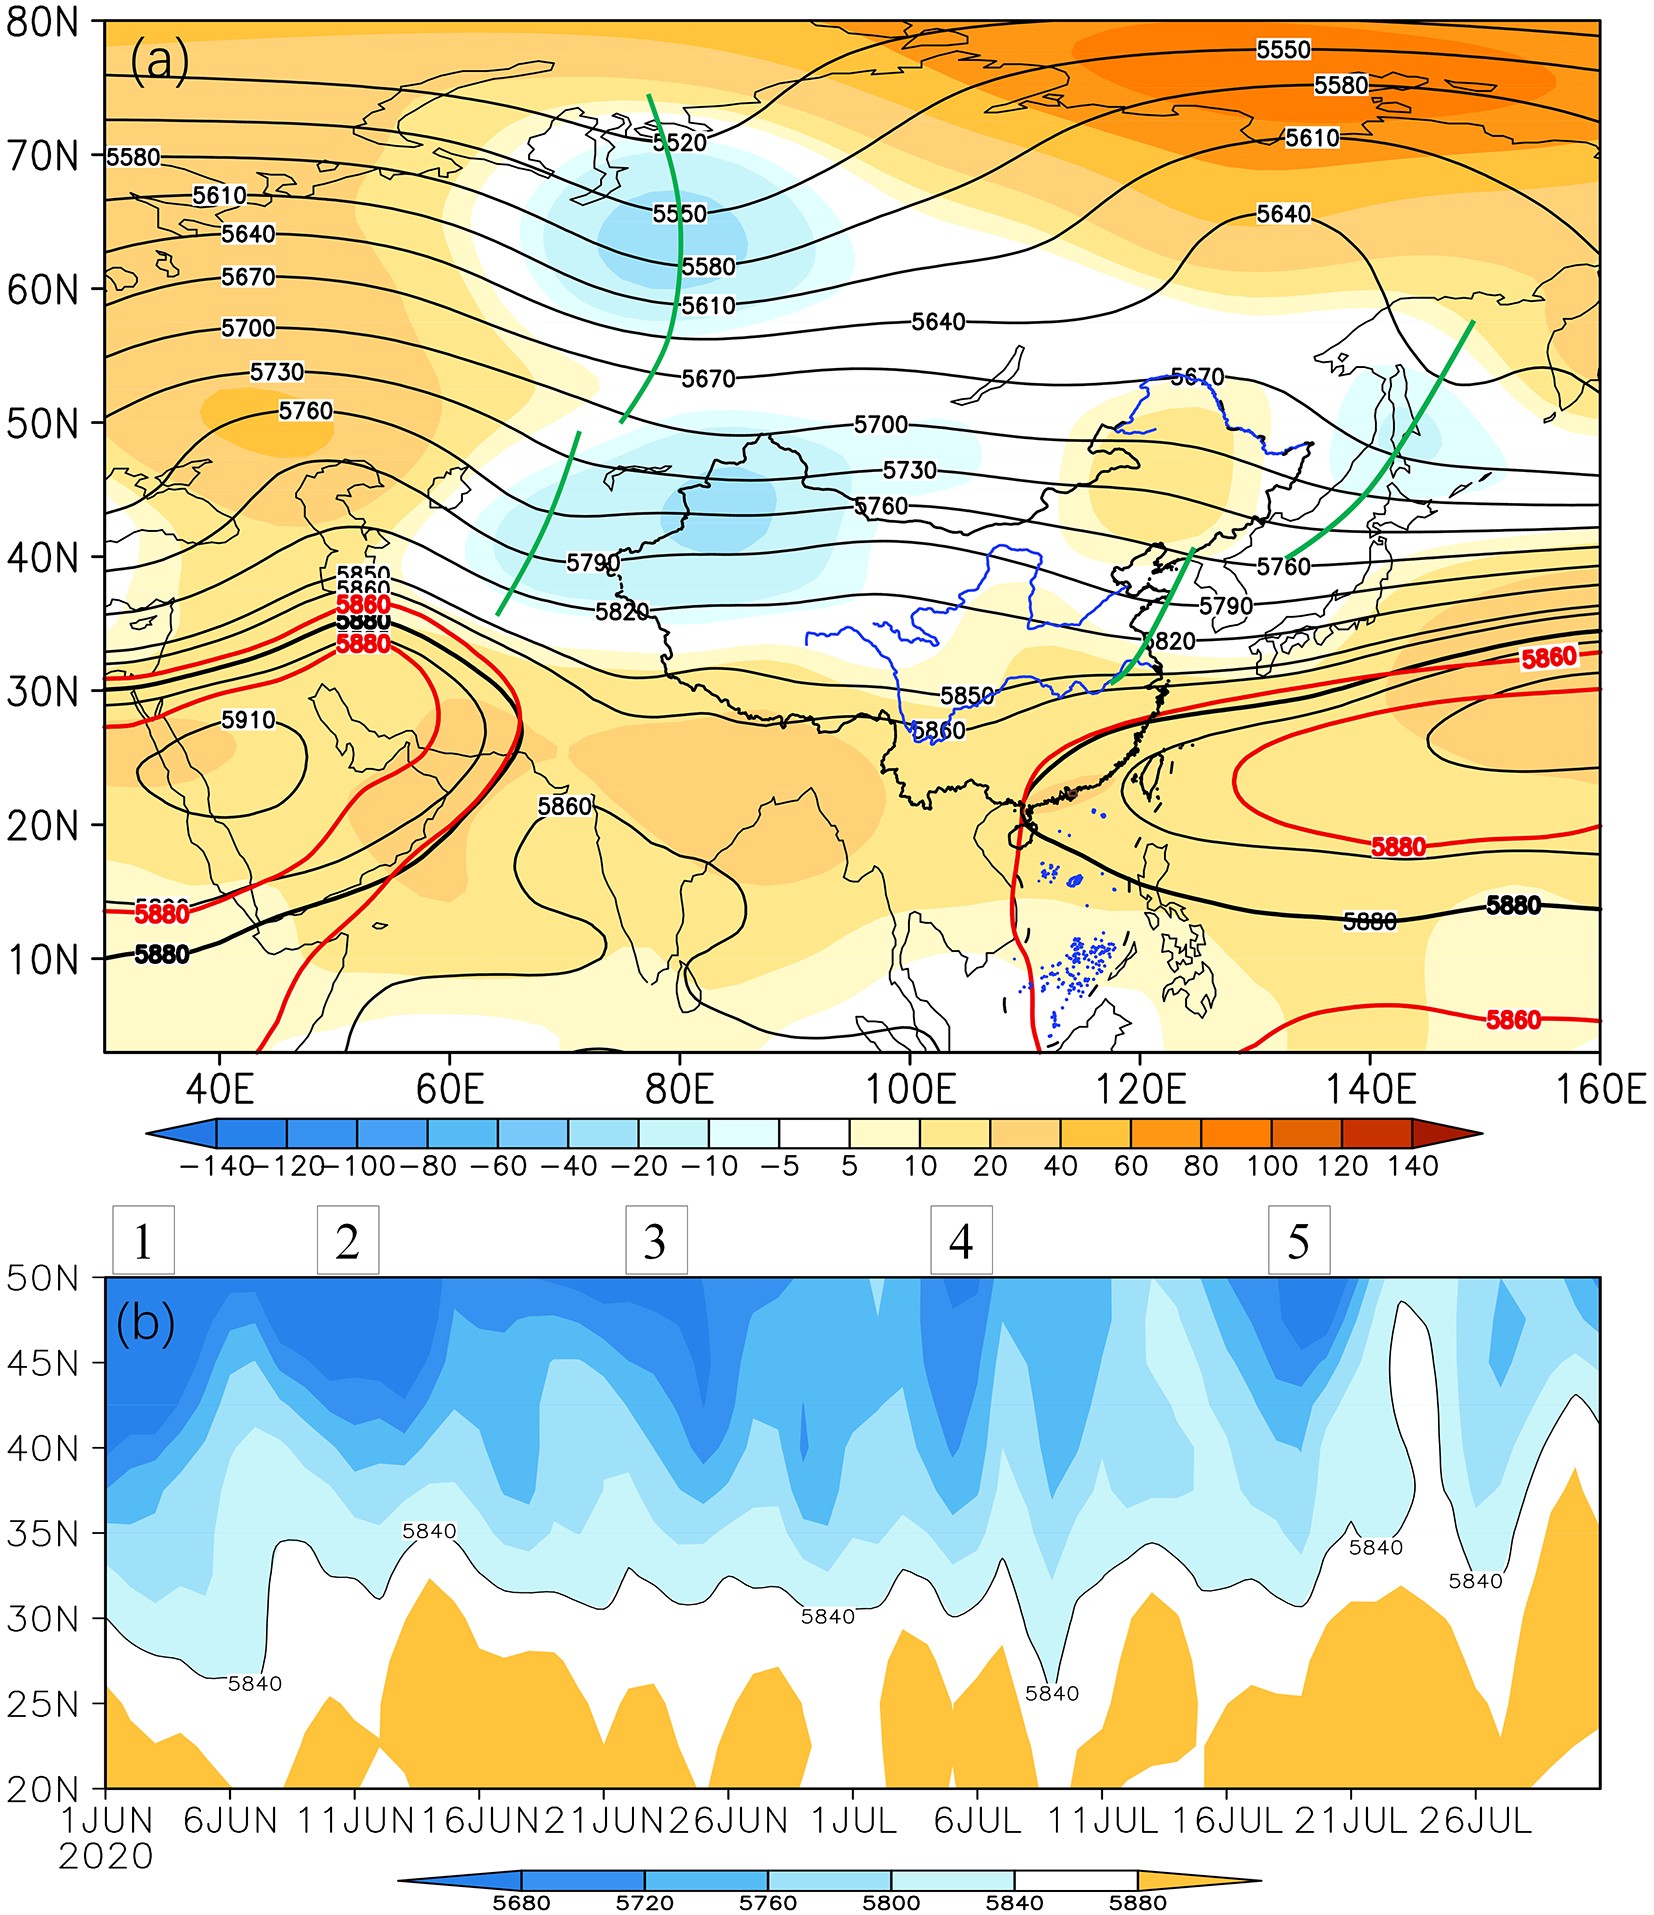 Figure6. Distribution of (a) the averaged Z500 (contours, gpm) and corresponding anomalies (shading), (b) variation of Z500 along 110°–122.5°E during the 2020 mei-yu period. In Fig. 6a, the red lines are the climatological mean 5880 and 5860 isolines, and the green bold lines represent the low troughs. In Fig. 6b, the isoline of 5840 represents the latitudinal position of the cold air in eastern China, and the number at the top of the figure indicates five cold air processes over eastern China.
Also, there was another low trough along the coast of East Asia, accompanied by its negative geopotential height anomaly. This implies that the cold air activities also frequently went southward through the northeasterly pathway (ultra-polar path), which is associated with the Okhotsk blocking high. Extreme mei-yu rain events occurred when frequent cold air intrusions collide with the warm moist air entrenched over the YHRV.
 Figure7. (a) Distribution of SSTA (℃) averaged in June–July 2020, and (b) evolution of the Ni?o3.4 and IOBM indices from September 2019 to July 2020.
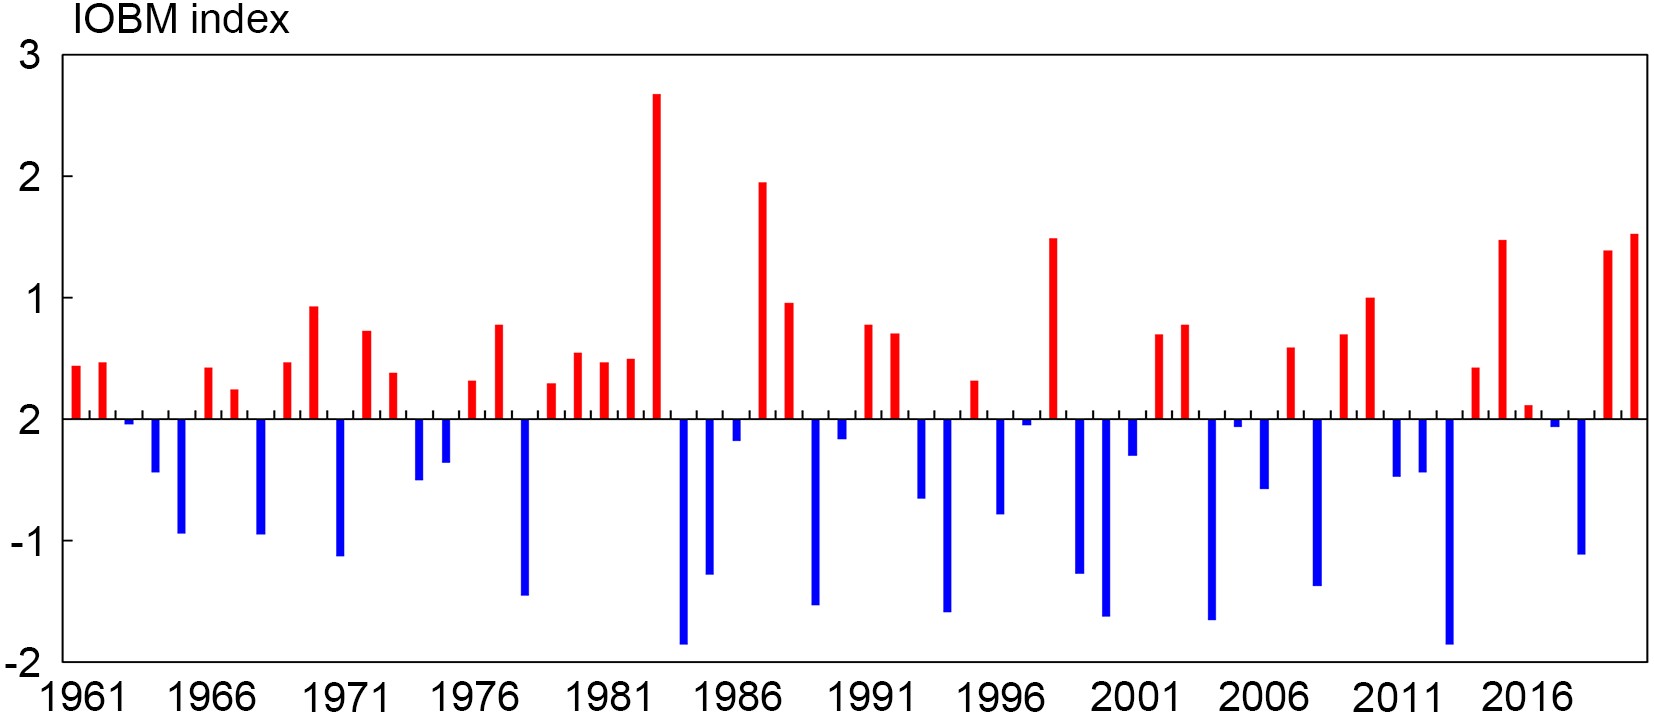 Figure8. The time series of the normalized detrended IOBM index in June?July from 1961 to 2020.
To explore the effect of the warming in the tropical Pacific and Indian Oceans on East Asian circulation anomalies and precipitation anomalies over the YHRV during the mei-yu season, we present the partial correlations of the Ni?o3.4 and IOBM indices with atmospheric circulation anomalies in the middle and lower troposphere, as well as the SSTA in Fig. 9. The partial correlations of SSTA with the Ni?o3.4 and IOBM indices show that the Ni?o3.4 and IOBM indices are relatively independent of each other in the spatial pattern during June–July (Fig. 9a and 9b), with a correlation coefficient of 0.23, which falls short of the 95% confidence level. As for the atmospheric circulation anomalies, the tropical Indian Ocean warming is accompanied by a positive–negative–positive, EAP/PJ-like teleconnection pattern over East Asia (Fig. 9c), which is favorable for an intensified and southerly displaced WPSH, and abundant rainfall in the middle and lower reaches of the Yangtze River (Nitta, 1987; Nitta and Hu, 1996; Huang, 2004). Also, the Eurasian circulation in the middle and high latitudes associated with the IOBM warming features two ridges and one trough, similar to the observation in 2020 (Fig. 6). However, according to the correlations shown in Fig. 9d, accompanied by the observed negative Ni?o3.4 index during June and July 2020, the positive center of the geopotential height anomaly is located over eastern China (Fig. 9d), further northwestward than that of IOBM index (Fig. 9c). Such an anomalous circulation pattern is conducive to the northward shift of the WPSH, different from the observations in 2020 (Fig. 6). Thus, compared with the Pacific Ocean, the persistent warming of the tropical Indian Ocean may be a more important factor in this flooding event.
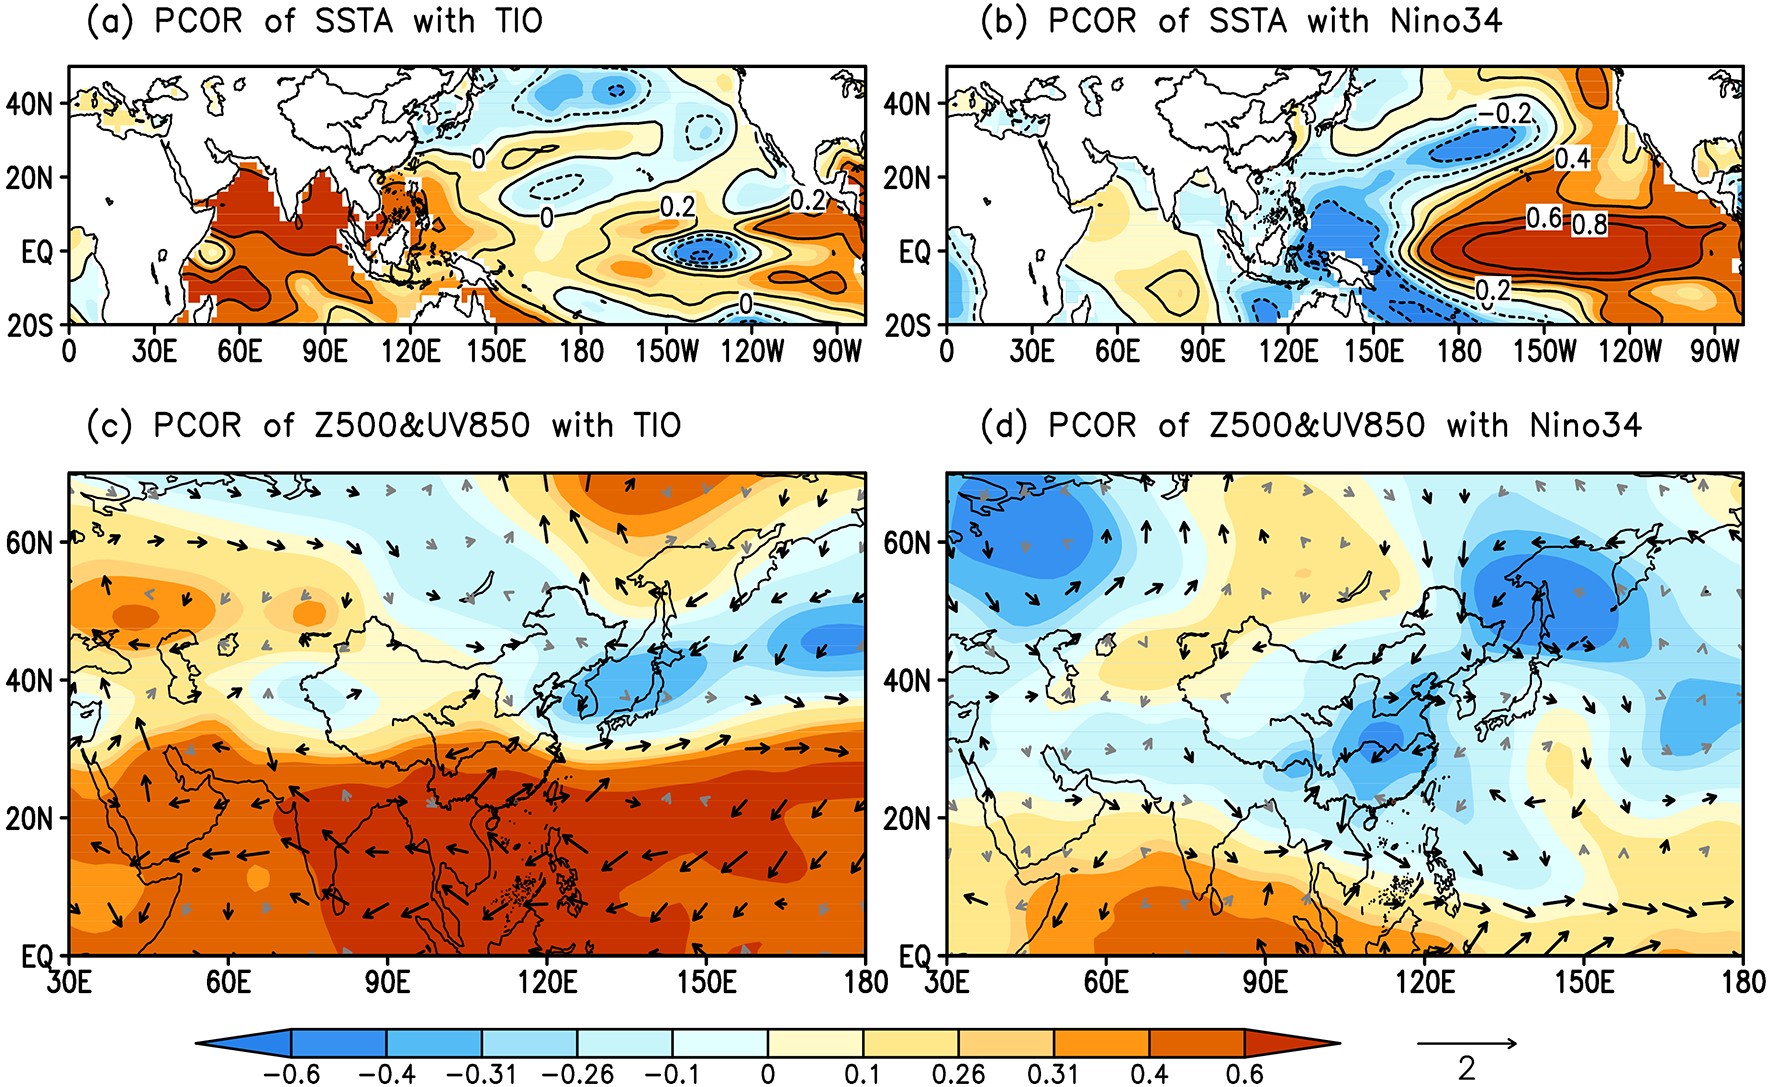 Figure9. Partial correlation of the (a, b) SSTA, (c, d) Z500 (shading), and uv850 (vector) anomalies in June–July with the normalized detrended (a, c) IOBM and (b, d) Ni?o3.4 indices during 1961–2019, respectively. The thick vectors exceed 0.05 t-test significant levels for either u or v components.
To further verify the contributions of SSTAs in the tropical Pacific and Indian Oceans to the mei-yu rainfall in 2020, linear regression is used to reconstruct the mei-yu anomaly over the YHRV in June–July 2020. First, the rainfall anomalies at each station are regressed onto the Ni?o3.4 and IOBM indices. Then, the linear regression coefficients are multiplied by corresponding values of each of the two indices in June–July 2020 to reconstruct rainfall anomalies in the mei-yu season. The observed pattern with excessive rainfall over the YHRV and deficit rainfall in North China is reproduced by the IOBM index (Fig. 10a), while the nearly opposite distribution of rainfall anomalies is obtained in the reconstruction using the Ni?o3.4 index (Fig. 10b). Thus, from the statistical correlations and the reconstructions, it is suggested that the persistent warming in the tropical Indian Ocean, rather than the SST anomaly in the tropical central and eastern Pacific, may have played a key role in leading to the extreme mei-yu in 2020. Nevertheless, the reconstructed rainfall anomaly based on the IOBM index is only about one-fourth of the observed rainfall anomaly during the mei-yu season in 2020, which further implies that there may be other factors, operating on multiple timescales, that contributed to the record-breaking mei-yu rainfall in 2020. For example, it might be partially attributed to the effects of global warming, which is known to have the potential to increase heavy rainfall around the YHRV during the mei-yu season (Zhu et al., 2012).
 Figure10. Reconstructions of 2020 June?July rainfall anomalies (mm) based on the linear regression with the normalized detrended (a) IOBM and (b) Ni?o3.4 indices.
It is noted that the East Asian monsoon circulation system featured significant QBWO during the mei-yu season of 2020. The onset and retreat of mei-yu, the northward shift and stagnation of the rainbelt, and the occurrence and persistence of heavy rainstorm processes had a close connection with the QBWO variations. During the 2020 mei-yu season, the western Pacific subtropical high (WPSH) experienced six periodic oscillations with northward advancements and southward retreats. Meanwhile, other monsoon circulation subsystems, including the East Asian westerly jet in the upper levels and the southwesterly jet in the lower levels were intensified on five occasions, corresponding with the QBWO. Especially noteworthy was the repeated establishment of the large southerly center with a relatively stable latitude range, which strengthened water vapor transport from the tropics. The moisture convergence and ascending motions developed repeatedly, leading to the long-term, persistent mei-yu rainfall in the YHRV accompanied by frequent occurrences of extreme rainstorm processes.
Moreover, two blocking highs persisted in the mid–high-latitudes over Eurasia, along with a major trough near the Balkhash Lake region. The combination of these features encouraged cold Arctic air to frequently flow into the YHRV. Furthermore, the trough along the East Asian coast was also active. The relative position of both of these troughs was conducive to frequent cold air intrusions moving southward through the northwestern and/or northeastern path before merging with the warm and moist airmass from the low latitudes over the YHRV.
Additionally, the persistent warming in the tropical Indian Ocean was found to be an important external contributor to an EAP/PJ-like teleconnection pattern over East Asia and the intensified and southwardly displaced WPSH. This pattern is conducive to abundant rainfall over YHRV.
It should be pointed out that in other abundant mei-yu rainfall years, such as 1954, 1991, 1998, and 2016, the variation of some key atmospheric circulation systems were similar to those of 2020. For example, the circulation in the middle and high latitudes over Eurasia also featured a typical pattern of “two ridges and one trough” with frequent cold air activities from high latitudes (Ding, 1993), the location of the upper westerly jet in East Asia was relatively stable and its second northward shift was not significant (Wang et al., 1992), and the meridional movement of WPSH was also small (Mao and Wu, 2005). Moreover, the mei-yu periods during these years were always accompanied by strong QBWO (Lu and Ding, 1996; Mao and Wu, 2005). Thus, combined with the analysis of the mei-yu in 2020, atmospheric circulation conditions characterizing the formation of the extreme mei-yu are summarized in Fig. 11.
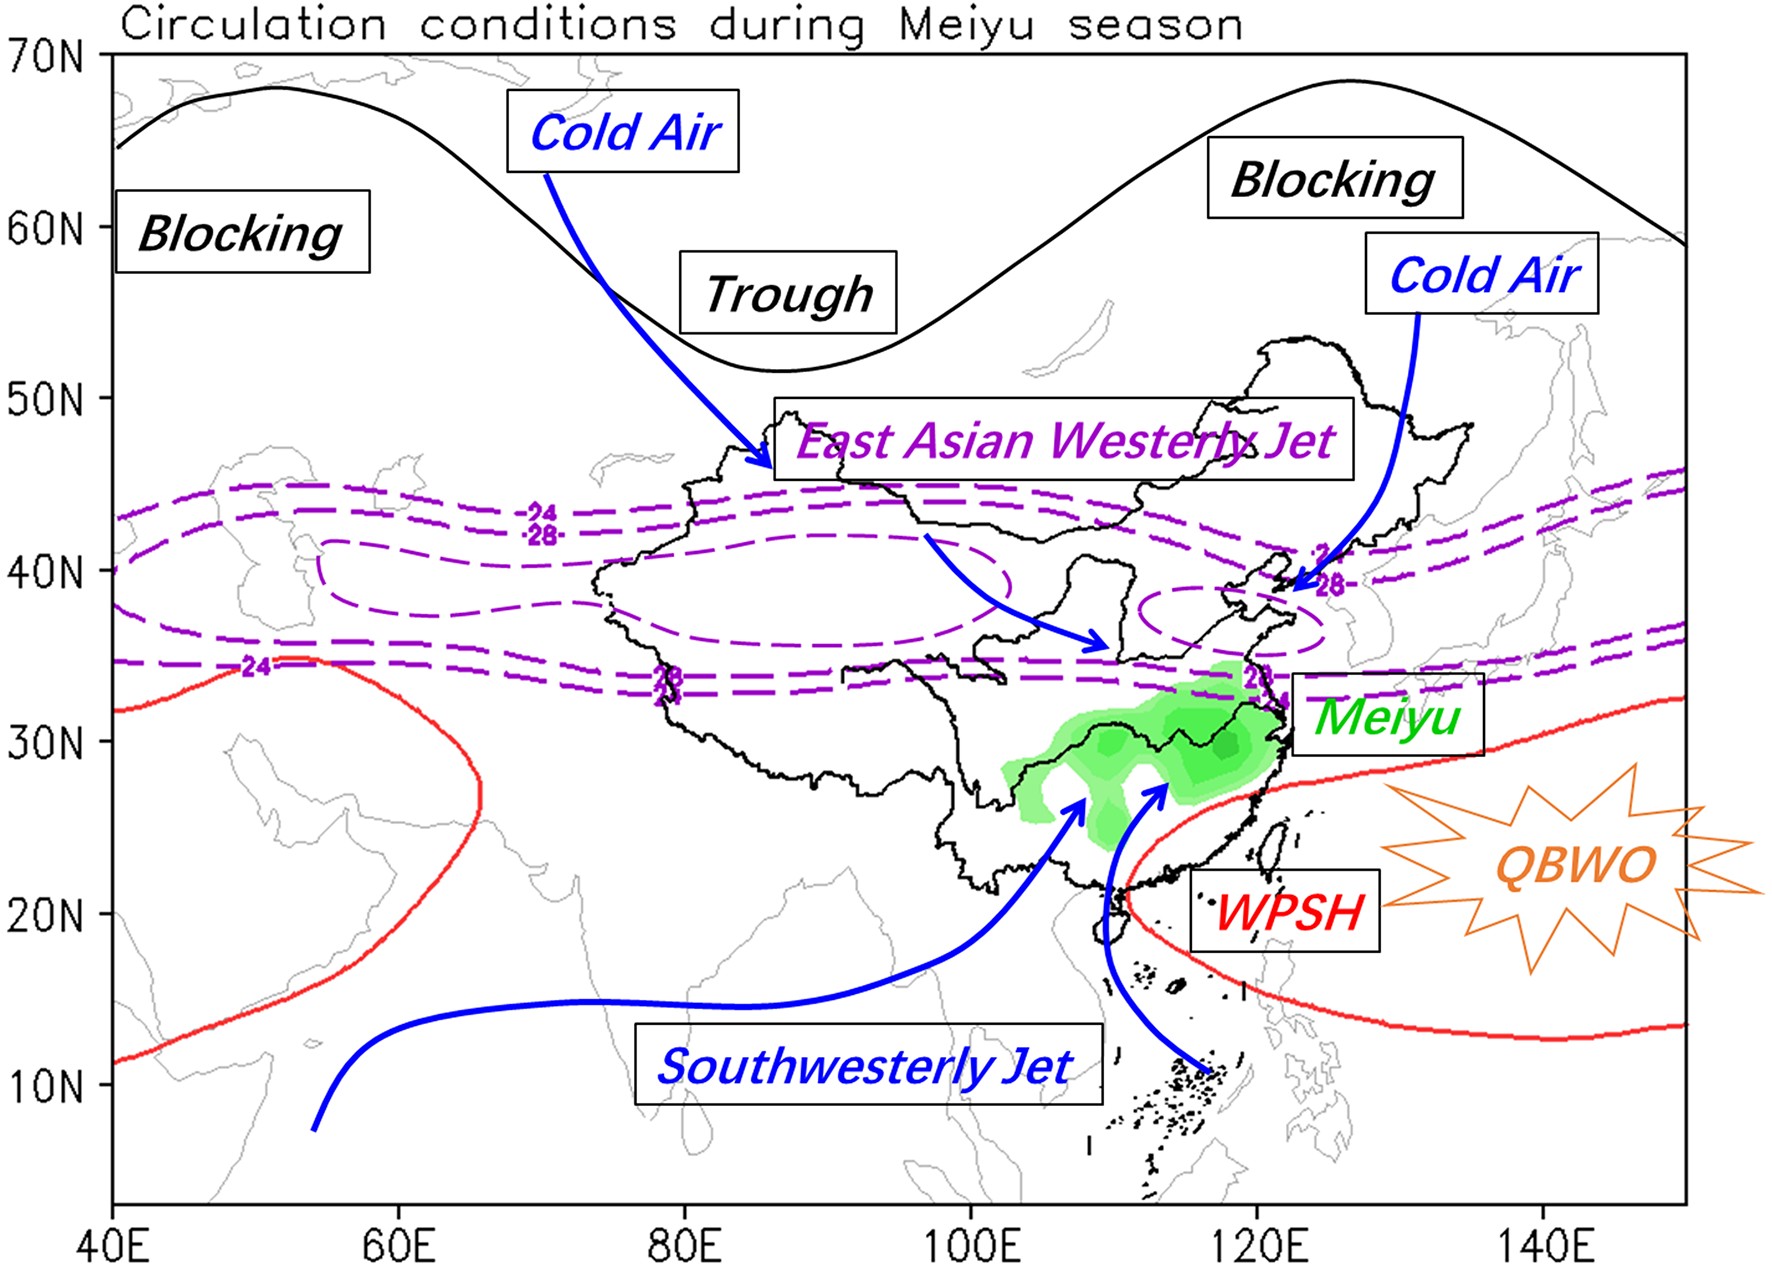 Figure11. Schematic diagram of atmospheric circulation conditions for the formation of the record breaking mei-yu in 2020.
In summary, four main circulation factors appear to affect the mei-yu, namely the blocking high in the mid-high latitudes, the WPSH, the southwesterly jet and its associated transport of warm and moist air, and the upper-level East Asian westerly jet. The locations of both the WPSH and the East Asian westerly jet which favor heavy rainfall over the YHRV tend to be stable in the range of 20°–26°N and 37°–40°N, respectively. Meanwhile, the southward invasion of cold air from the high latitudes coincides with the strengthening of the low-level southwesterly jet. This interaction represents yet another major circulation pattern that favors the occurrence of heavy rainfall over the YHRV. Furthermore, multiple and strong QBWOs are conducive to the repeated occurrence of heavy rainfall processes and excessive mei-yu rainfall over the YHRV. Moreover, the two rapid northward jumps of the WPSH in summer are closely related to the intraseasonal oscillation (Lu et al., 2005; Su et al., 2017; Sun et al., 2021). Yang et al. (2010) also argued that the QBWO strengthens the westward and northward extension of the WPSH, resulting in anomalous precipitation during the mei-yu season. Therefore, the variability of QBWO and its role in the summer monsoon subsystems and mei-yu variation deserve more attention and warrant further investigation.
Lastly, such a record-breaking event occurred within a weak ENSO background, and our study suggests that the persistent warming of the tropical Indian Ocean seems to be an important contributor to enhancing the mei-yu, which is consistent with the findings of Takaya et al. (2020). The temporal and spatial distribution of the SSTA for the 2020 case is different from those in 1998 and 2016 which featured a super El Ni?o (Huang et al., 1998; Yuan et al., 2017; Li et al., 2019). On the other hand, the entire Indian Ocean has been warming throughout the past half-century (Dong et al., 2014; Swapna et al., 2014; Roxy, 2014) and the impact of the IOBM on the Asian summer climate has been enhanced since the late 1970s, based on both statistical analysis and numerical experiments (Sun et al., 2019a). The 2020 case suggests that inter-basin SST and multiple timescale variabilities play important roles in affecting the mei-yu (Xie et al., 2009; Sun et al., 2019b; Wang et al., 2021). Further investigation is necessary for a comprehensive understanding of the pan-tropical SSTAs on this record-breaking mei-yu flooding event.
Acknowledgements. The authors appreciated the constructive comments and insightful suggestions from two reviewers and editors. For data used in this study, please contact us via liuyuny@cma.gov.cn. This work was jointly supported by National Key R & D Program of China (2018YFC1505806), Guangdong Major Project of Basic and Applied Basic Research (2020B0301030004), National Science Foundation of China (41875100), and the China Meteorological Administration Innovation and Development Project (CXFZ2021Z033), and China Three Gorges Corporation (Grant No. 0704181).
