
HTML
--> --> -->Isoprene (2-methyl-1,3-butadiene, C5H8) is a widespread biogenic hydrocarbon (Seinfeld and Pandis, 2016) that relates closely to photosynthetic activity in plants. Its main oxidation product is methacrolein (C4H6O, MACR), which occupies about 22% of the yield of isoprene. MACR is a model compound in photochemical experiments. Although MACR has a small Henry coefficient (

This study explores the aqueous photo-Fenton reaction involved in the oxidation of MACR in the presence of Fe(III)-Ox. The effects of oxalate concentration, Fe(III) concentration, MACR concentration, and pH are analyzed. The main long-lived oxidation species, Fe(III) and H2O2, in photo-Fenton reaction are measured. The kinds and abilities of free radicals involved in the reaction with MACR are evaluated. The photodegradation mechanism and the possible oxidative products are studied by liquid-chromatography quadrupole time-of-flight mass spectrometry (LC-QTOF-MS). The oxidation products (namely, small organic acids) are analyzed by ion chromatograph (IC). Furthermore, the absorbance of the aqueous solution is tracked by a UV-vis spectrometer. The results obtained in this study will provide a reference for predicting the influence of low boiling-point VOCs in photooxidation with Fe(III)-carboxylic complexes in atmospheric water.
2.1. Materials
MACR (95%) and potassium oxalate (99.98%) were purchased from Shanghai Aladdin Bio-Chem Technology Co. Ltd. Ferric perchlorate, perchloric acid (70%), ferrozine (97%), 4-hydroxyphenylacetic acid (99%), and peroxidase (from horseradish, RZ>2.5) were purchased from Sigma-Aldrich. Analytical grade

2
2.2. Photolysis experiments
Photolysis reaction was performed in a photochemical reactor (XPA-VII, Xujiang electromechanical plant, Nanjing, China) equipped with a 500 W Xenon lamp combined with a 290 nm cut-off filter as simulated solar light. The Xenon lamp spectrum received by the reaction solution is shown in Fig. A1 in the Appendix. The temperature of the reactor was maintained at 25°C ± 2°C by cooling water. The pH was adjusted by
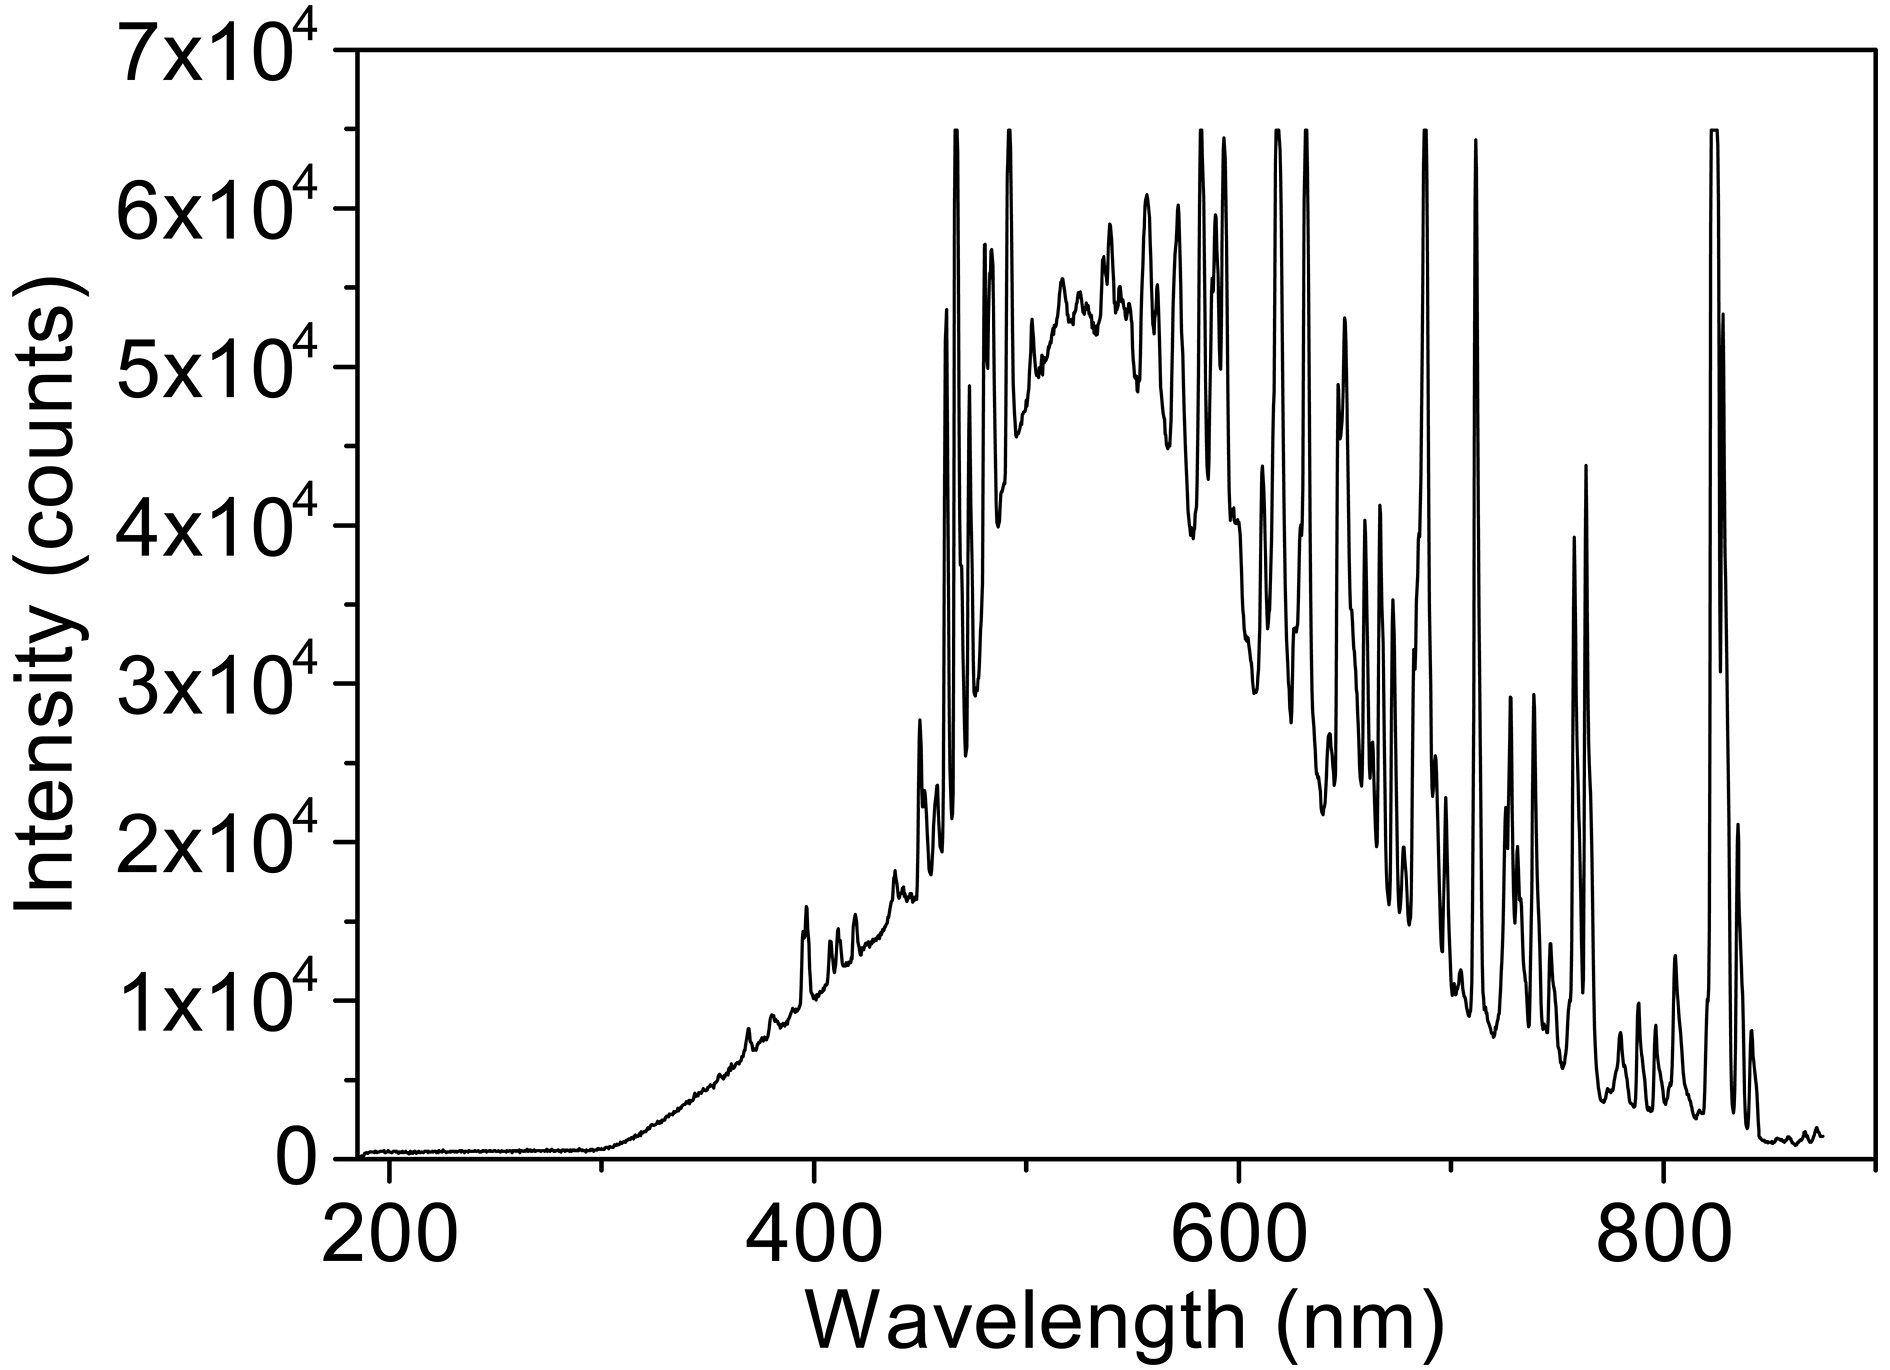 FigureA1. The xenon lamp spectrum received by the reaction solution.
2
2.3. Analytical procedures
GC-FID (Agilent 7890A, USA) was used to analyze the MACR concentration. It was equipped with a semi-polar capillary column (CNW CD-5MS 30 m × 0.25 mm × 0.25 μm, Germany), which allowed the injection of aqueous phase samples. The GC injector and detector were heated at 250°C. Nitrogen gas was used as carrier gas at 1 mL min?1 with a 1/10 split. The oven temperature program was 40°C for 4 min, raised by 10°C min?1 up to 120°C, and 120°C for 5 min (El Haddad et al., 2009; Liu et al., 2009).An IC (DIONEX ICS-3000, Thermo Fisher, USA) assembled with AG11-HC guard column and AS11-HC analytical column was used to measure organic acid anions (Zhou et al., 2018). The pH of the aqueous solution containing iron ion was adjusted to 10. Then, the solution was passed through a 0.22 μm PTFE filter and an H-type pretreatment filter to remove the iron.
The concentrations of Fe(II) and total dissolved iron were determined by using a spectrophotometry methodology with ortho-phenanthroline and hydroxylamine (Sastry and Rao, 1996). Hydrogen peroxide concentrations were determined by the fluorescence method developed by Lazrus et al. (1985) after sample mixing with EDTA-2Na. Solution pH was measured using a pH meter (METTLER TOLEDO FE20, Switzerland). UV-vis spectra of the solutions were tracked by UV-vis spectrometer (Scinco Nano MD, SCINCO, South Korea).
Reaction byproducts were identified with a LC-QTOF-MS system (Agilent 6540, USA) equipped with an electrospray ionization source, and analysis was performed under negative ionization mode (Lian et al., 2017).
3.1. The control experiments
As seen in Fig. 1, MACR shows little change under dark conditions. The small Henry coefficient of MACR keeps it mostly distributed in the aqueous solution, and errors caused by gas-liquid distribution are ignored in subsequent experiments. No obvious direct photolysis of MACR is found under the simulated sunlight conditions (λ > 290 nm) because MACR’s absorbance peak at 375 nm is low (Fig. 2). In the presence of Fe(III), MACR is oxidized about 7% in 90 min.
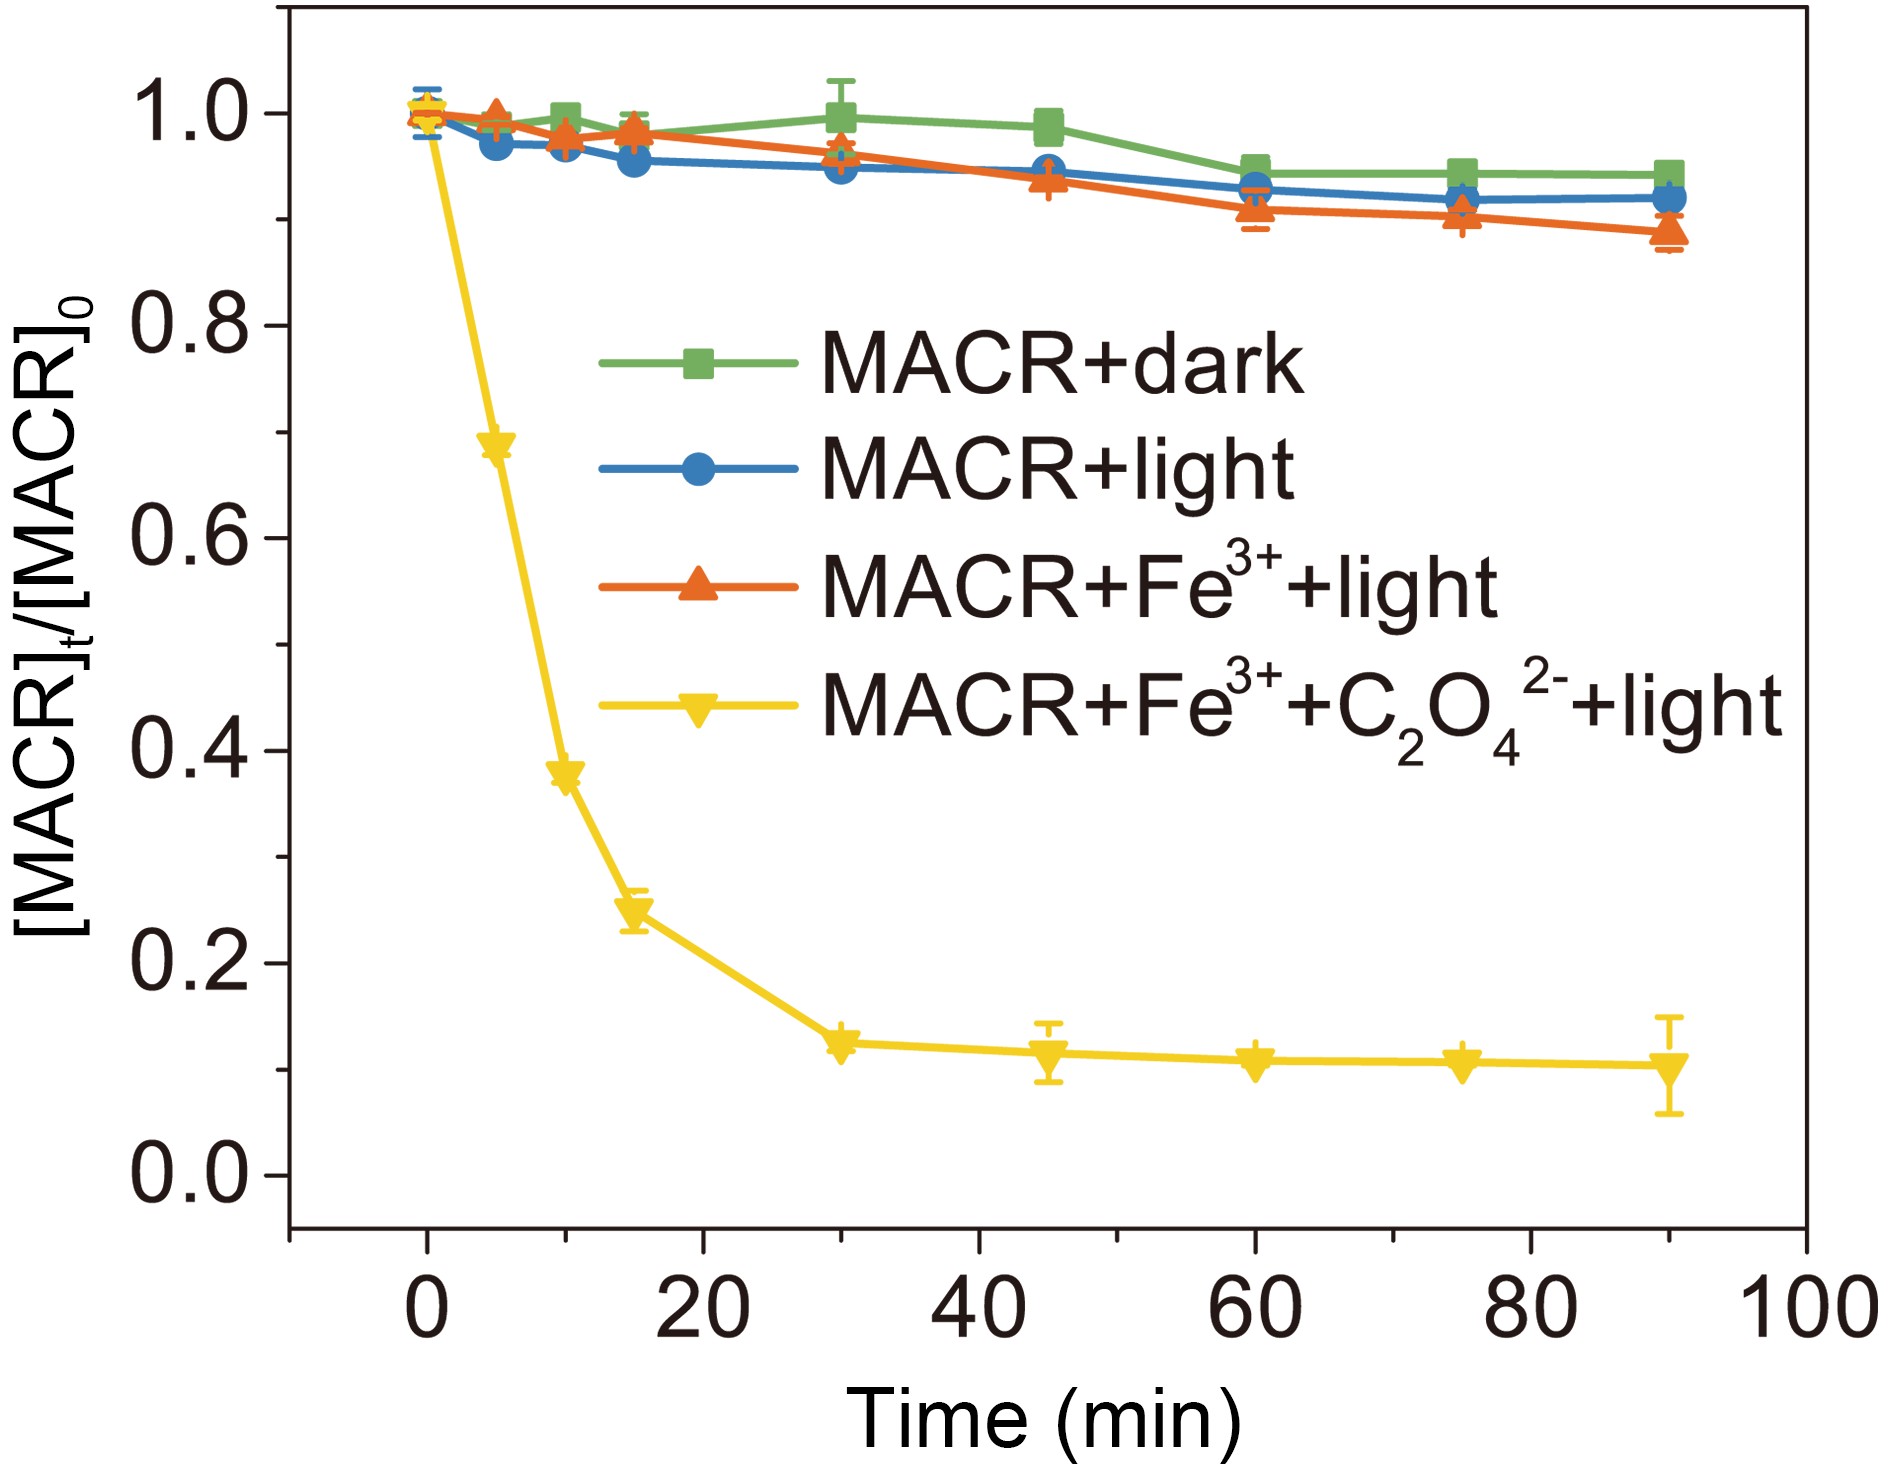 Figure1. Control experiments of MACR oxidation ([MACR]0 = 500 μM, [Fe(III)]0 = 100 μM, [Oxalate]0 = 1000 μM, pH = 4.0 ± 0.1, air-saturated solution).
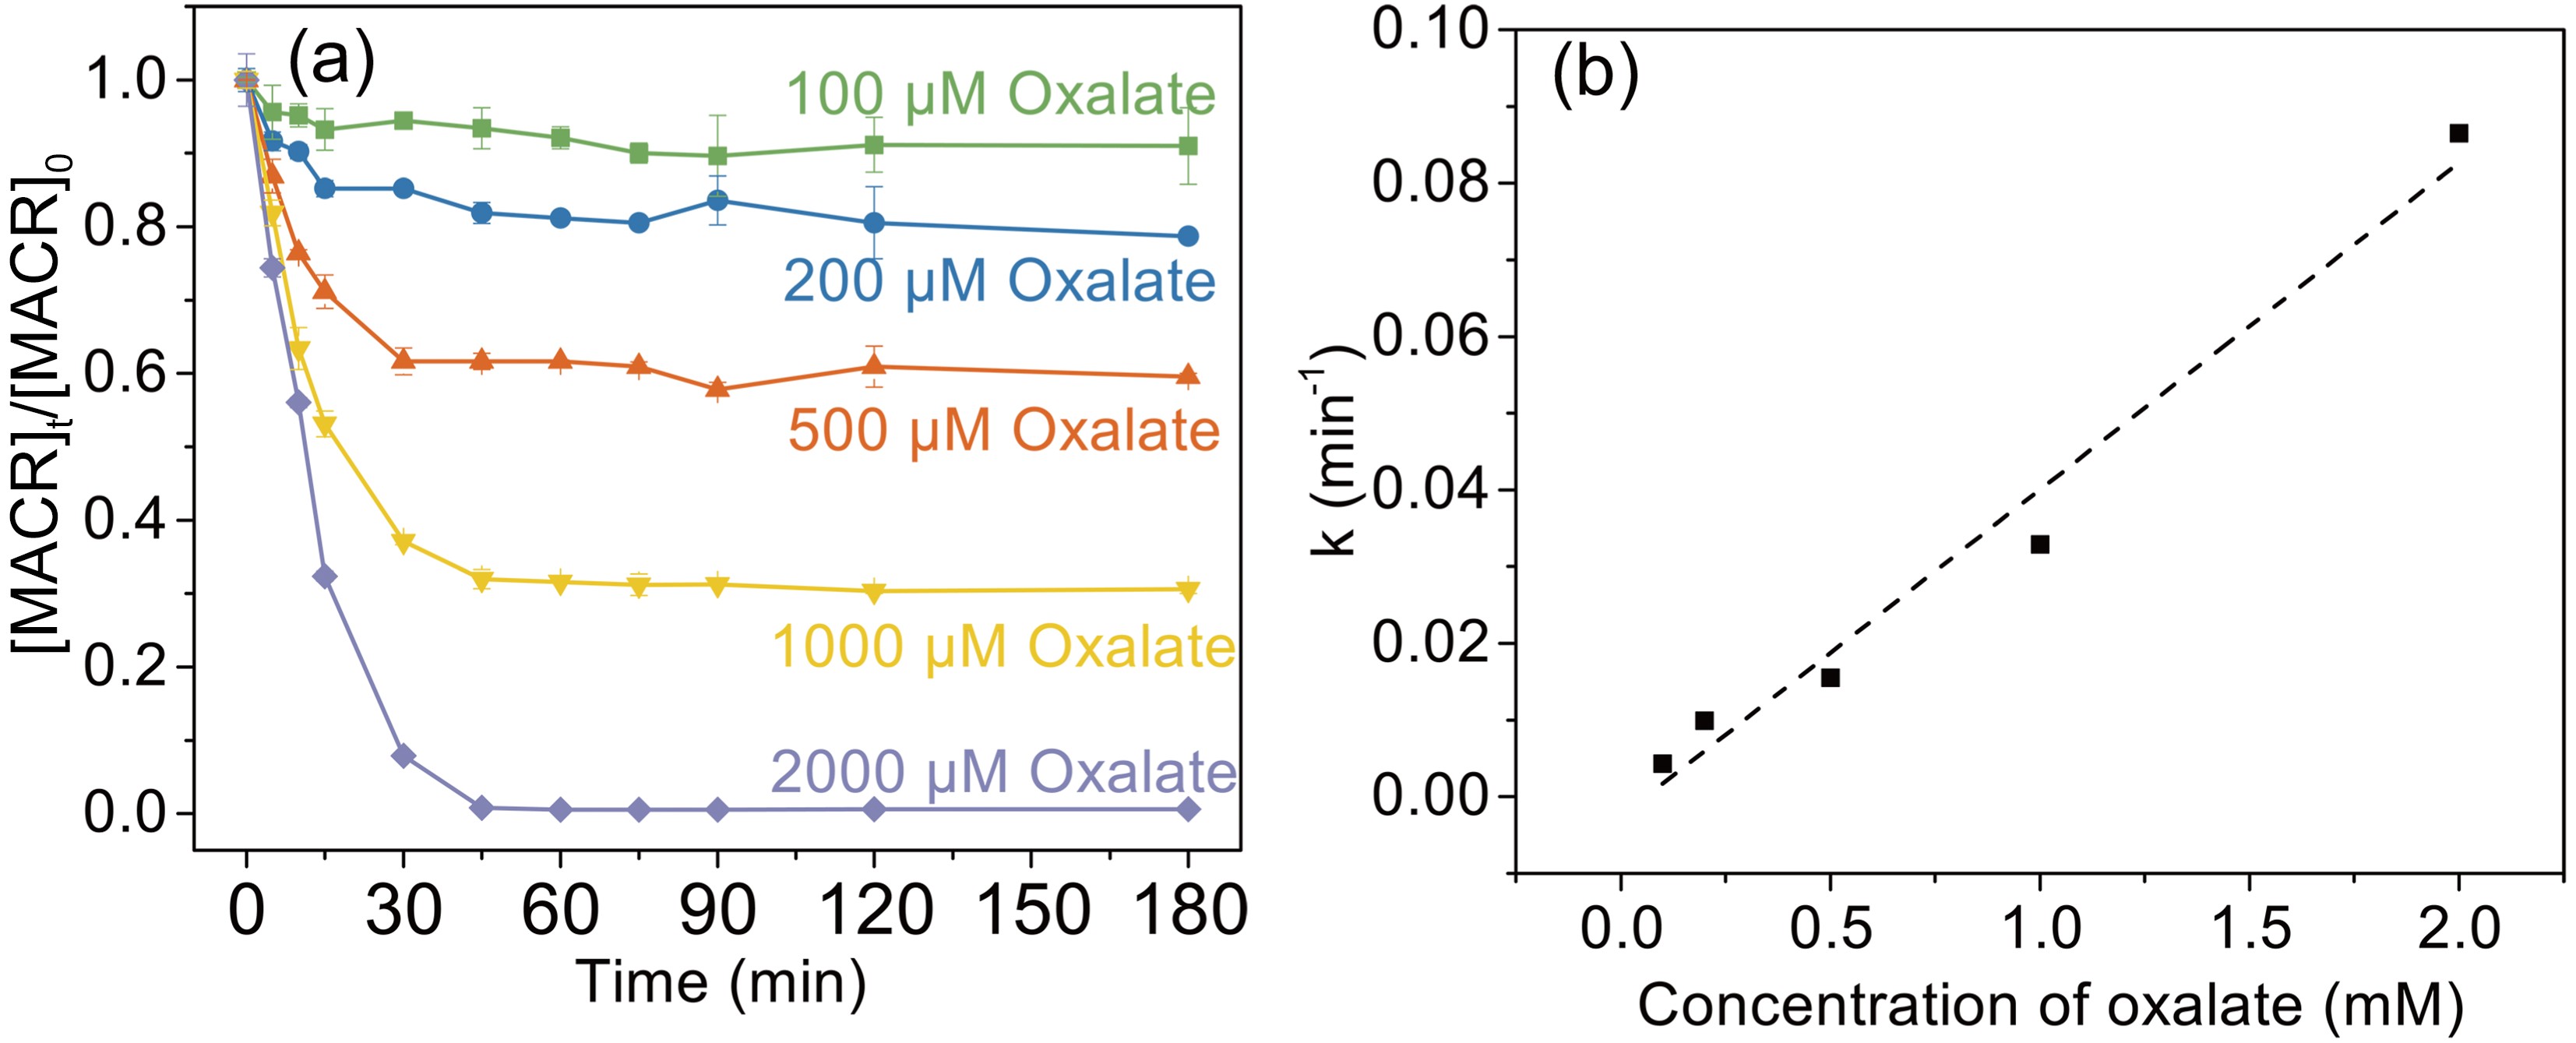 Figure2. (a) Effect of oxalate concentration on the photooxidation of MACR in the Fe(III)-Ox system; (b) The reaction rate constant calculated by the pseudo-first-order kinetics variation with the concentration of oxalate ([Oxalate]0 = 1000 μM, [MACR]0 = 500 μM, pH 4.0 ± 0.1, air saturated solution).
where h is Planck constant, v is frequency of light.
In the presence of Fe(III)-Ox (Fig. 1), the oxidation rate of MACR rapidly increases, and 80% MACR is oxidized in 60 min. This result occurs because Fe(III)-Ox forms and the efficiency of Fenton-like reaction is accelerated. As shown in Fig. A2, Fe(III)-Ox has more obvious absorption peaks in the sunlight range compared to the Fe(III) solution. Quantum yields (at 293 K, pH = 4.0) for the photolysis of


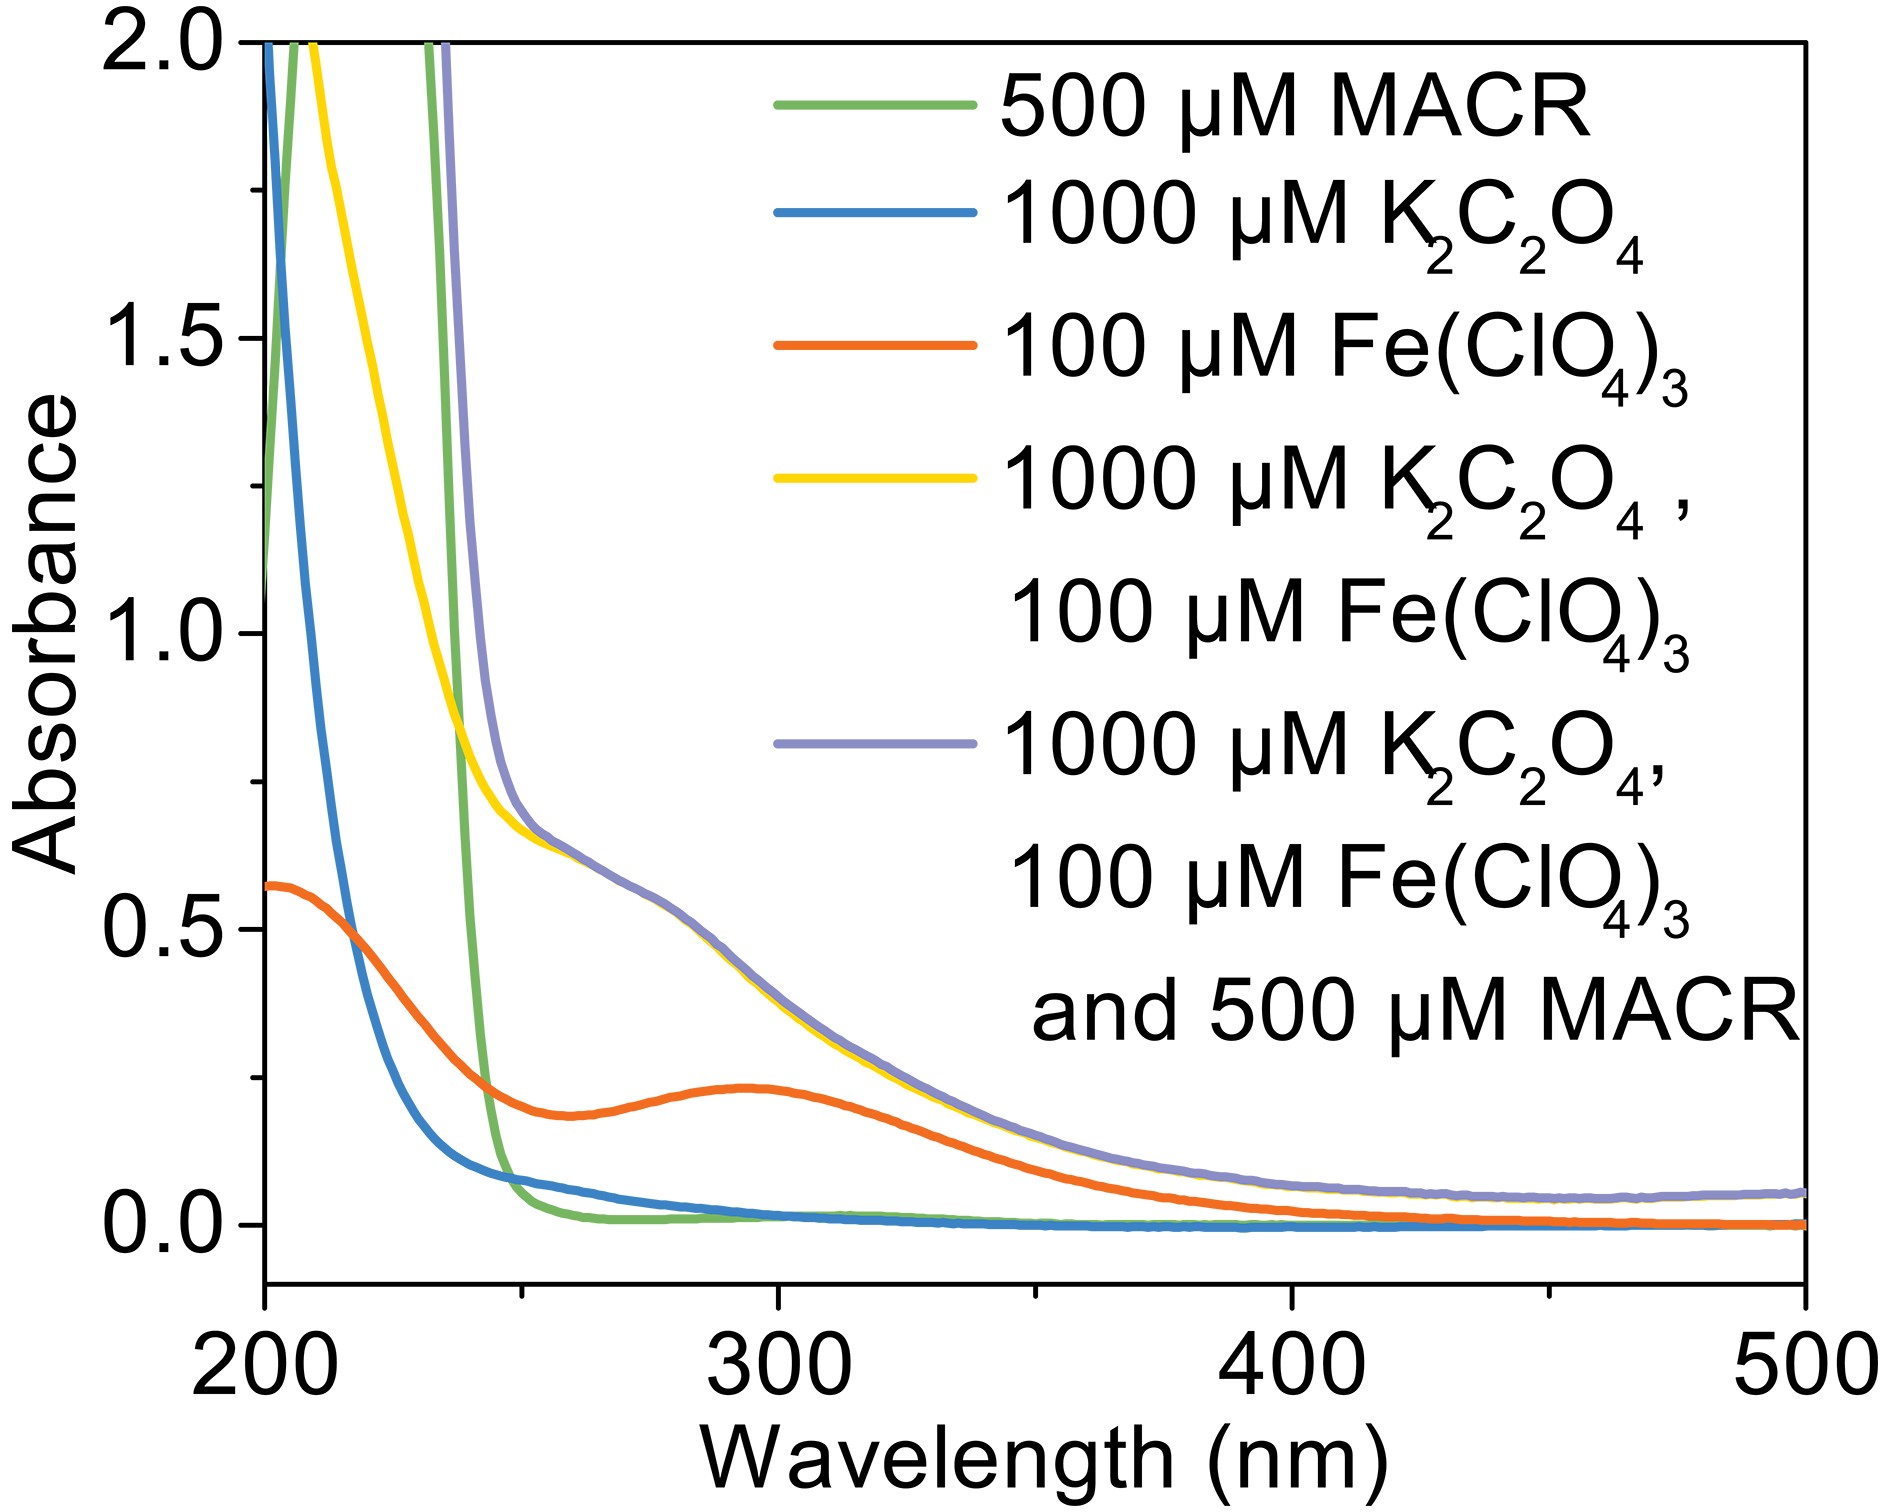 FigureA2. UV-vis absorption spectra of solution (pH = 4.0 ± 0.1, in dark condition).
2
3.2. Effect of oxalate concentration
The effect of oxalate concentration is investigated in the range from 100 μM to 2000 μM. As shown in Fig. 2a, the oxidation rate of MACR increases with increasing oxalate concentration. The pseudo-first-order oxidation rate of MACR has an increase of nearly equal proportion with increasing oxalate concentration from 100 μM to 2000 μM (Fig. 2b). Approximately 80% MACR is oxidized when oxalate concentration is 1000 μM. Oxalate at 2000 μM leads to the oxidation of all MACR, though this concentration is excessive. However, the oxidation rate corresponding to 2000 μM oxalate still increases linearly, and the inhibitory effect caused by excess oxalate is not observed in Fig. 2b. This result may be due to the low second-order reaction rate constant of oxalate and ·OH.The increasing degradation efficiency of MACR is due to the formation of Fe(III)-Ox, which is photolyzed to yield oxalate radicals (

Different ratios of oxalate and ferric form different complexes, and quantum yields for


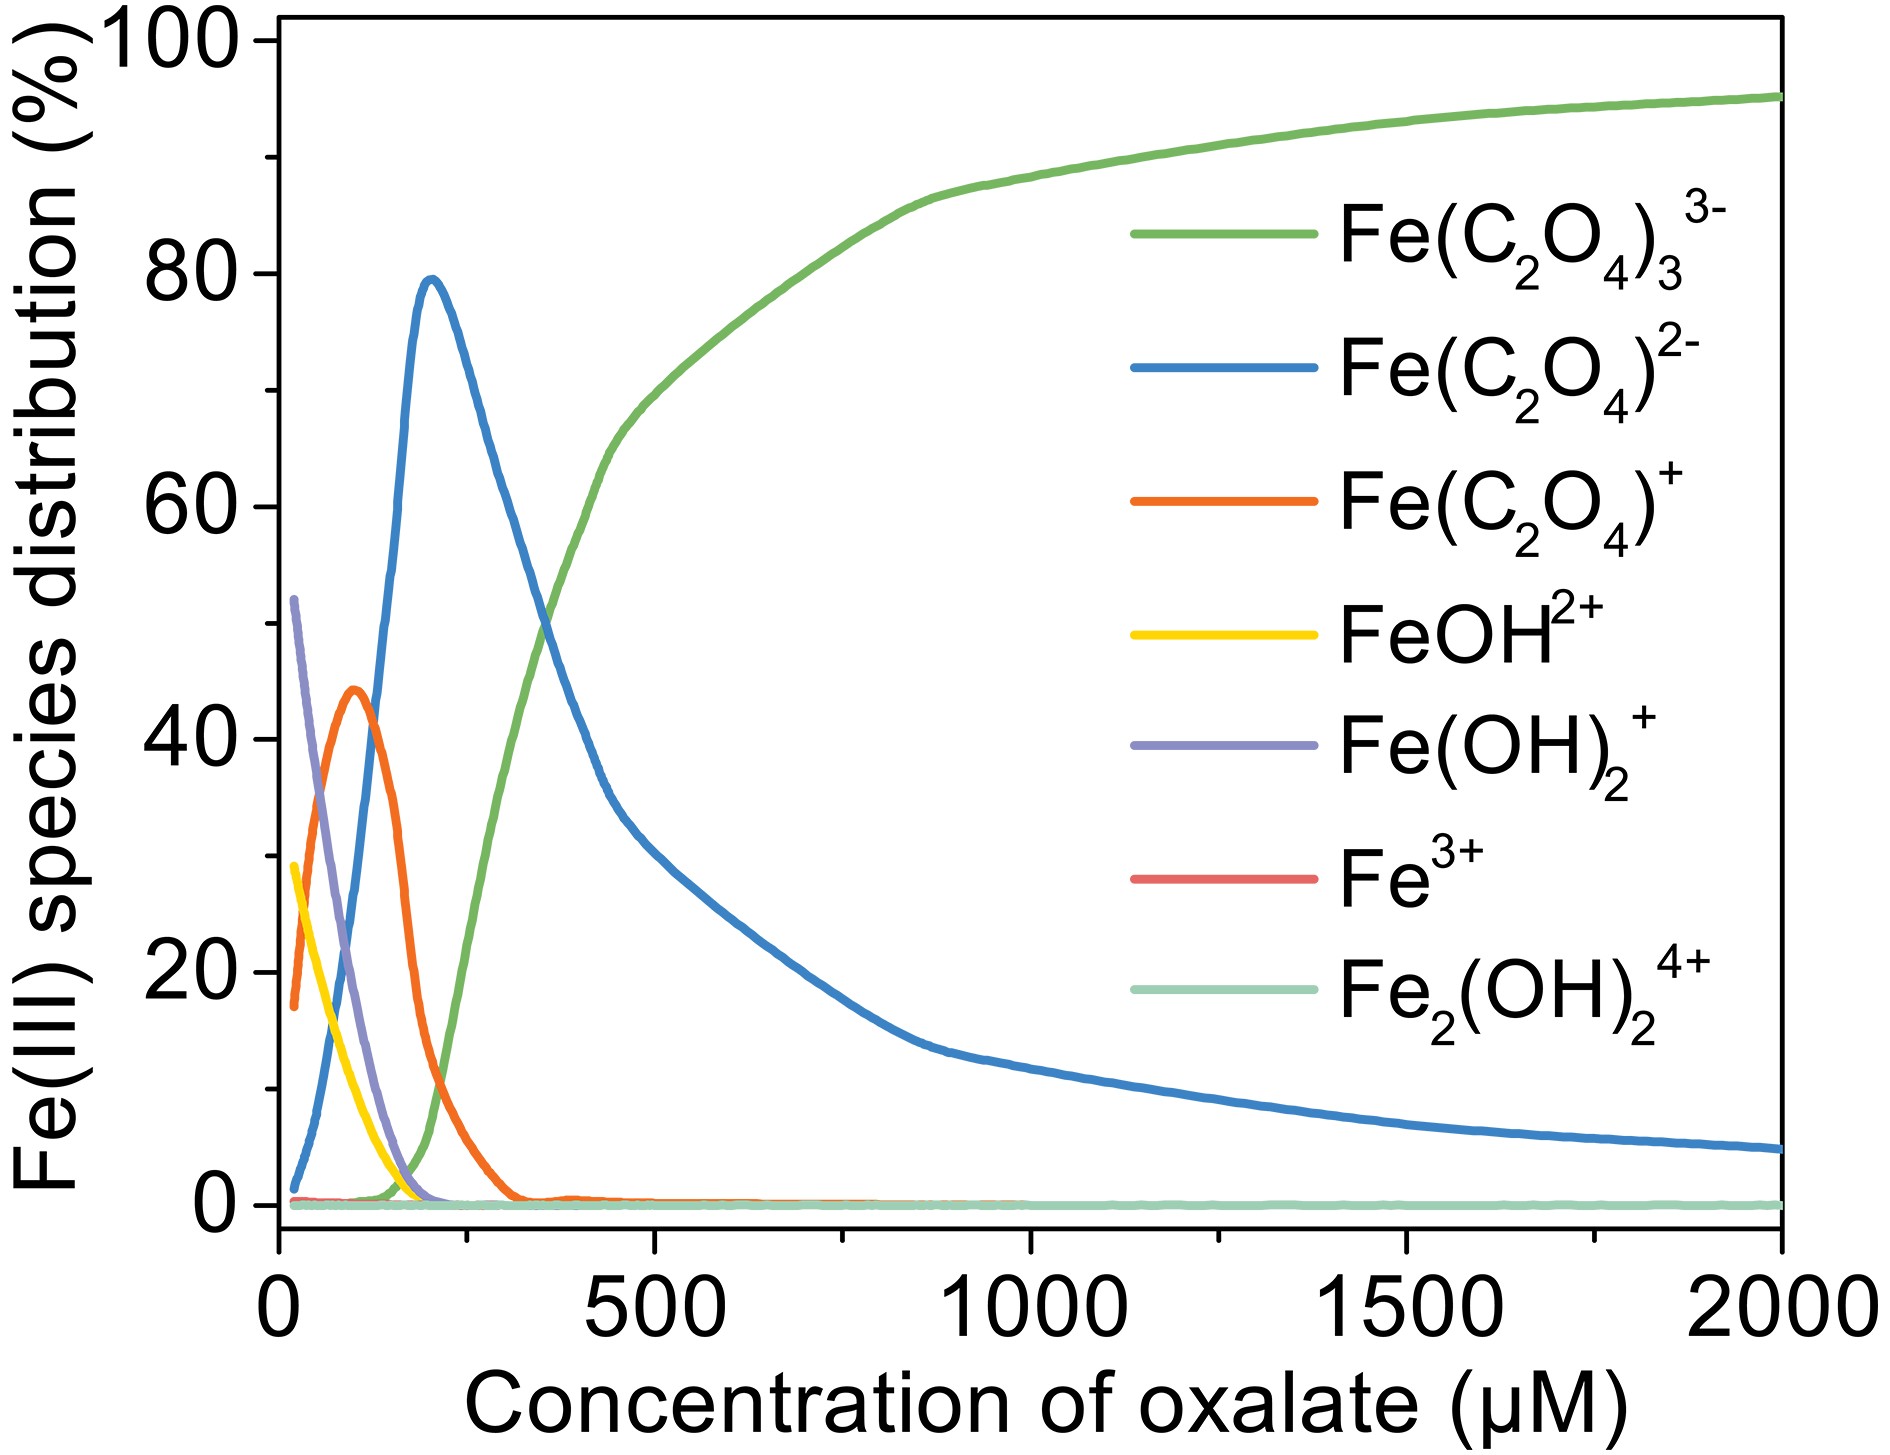 FigureA3. Change of Fe(III) species distribution with oxalate concentration, [Fe(III)]0 = 100 μM, pH = 4.0, 25°C.
2
3.3. Effect of Fe(III) concentration
To investigate the effect of Fe(III) concentration on the photooxidation of MACR, the Fe(III) concentration was varied from 20 μM to 200 μM during the reaction. As shown in Fig. 3, the photooxidation rate of MACR increases with increasing Fe(III) concentration from 20 μM to 200 μM in the first 60 min. This is because the complex species become different when the concentration ratio between ferric and oxalate is changed. The


 Figure3. Effect of Fe(III) concentration on the photooxidation of MACR in the Fe(III)-Ox system ([Oxalate]0 = 1000 μM, [MACR]0 = 500 μM, pH 4.0 ± 0.1, air-saturated solution).
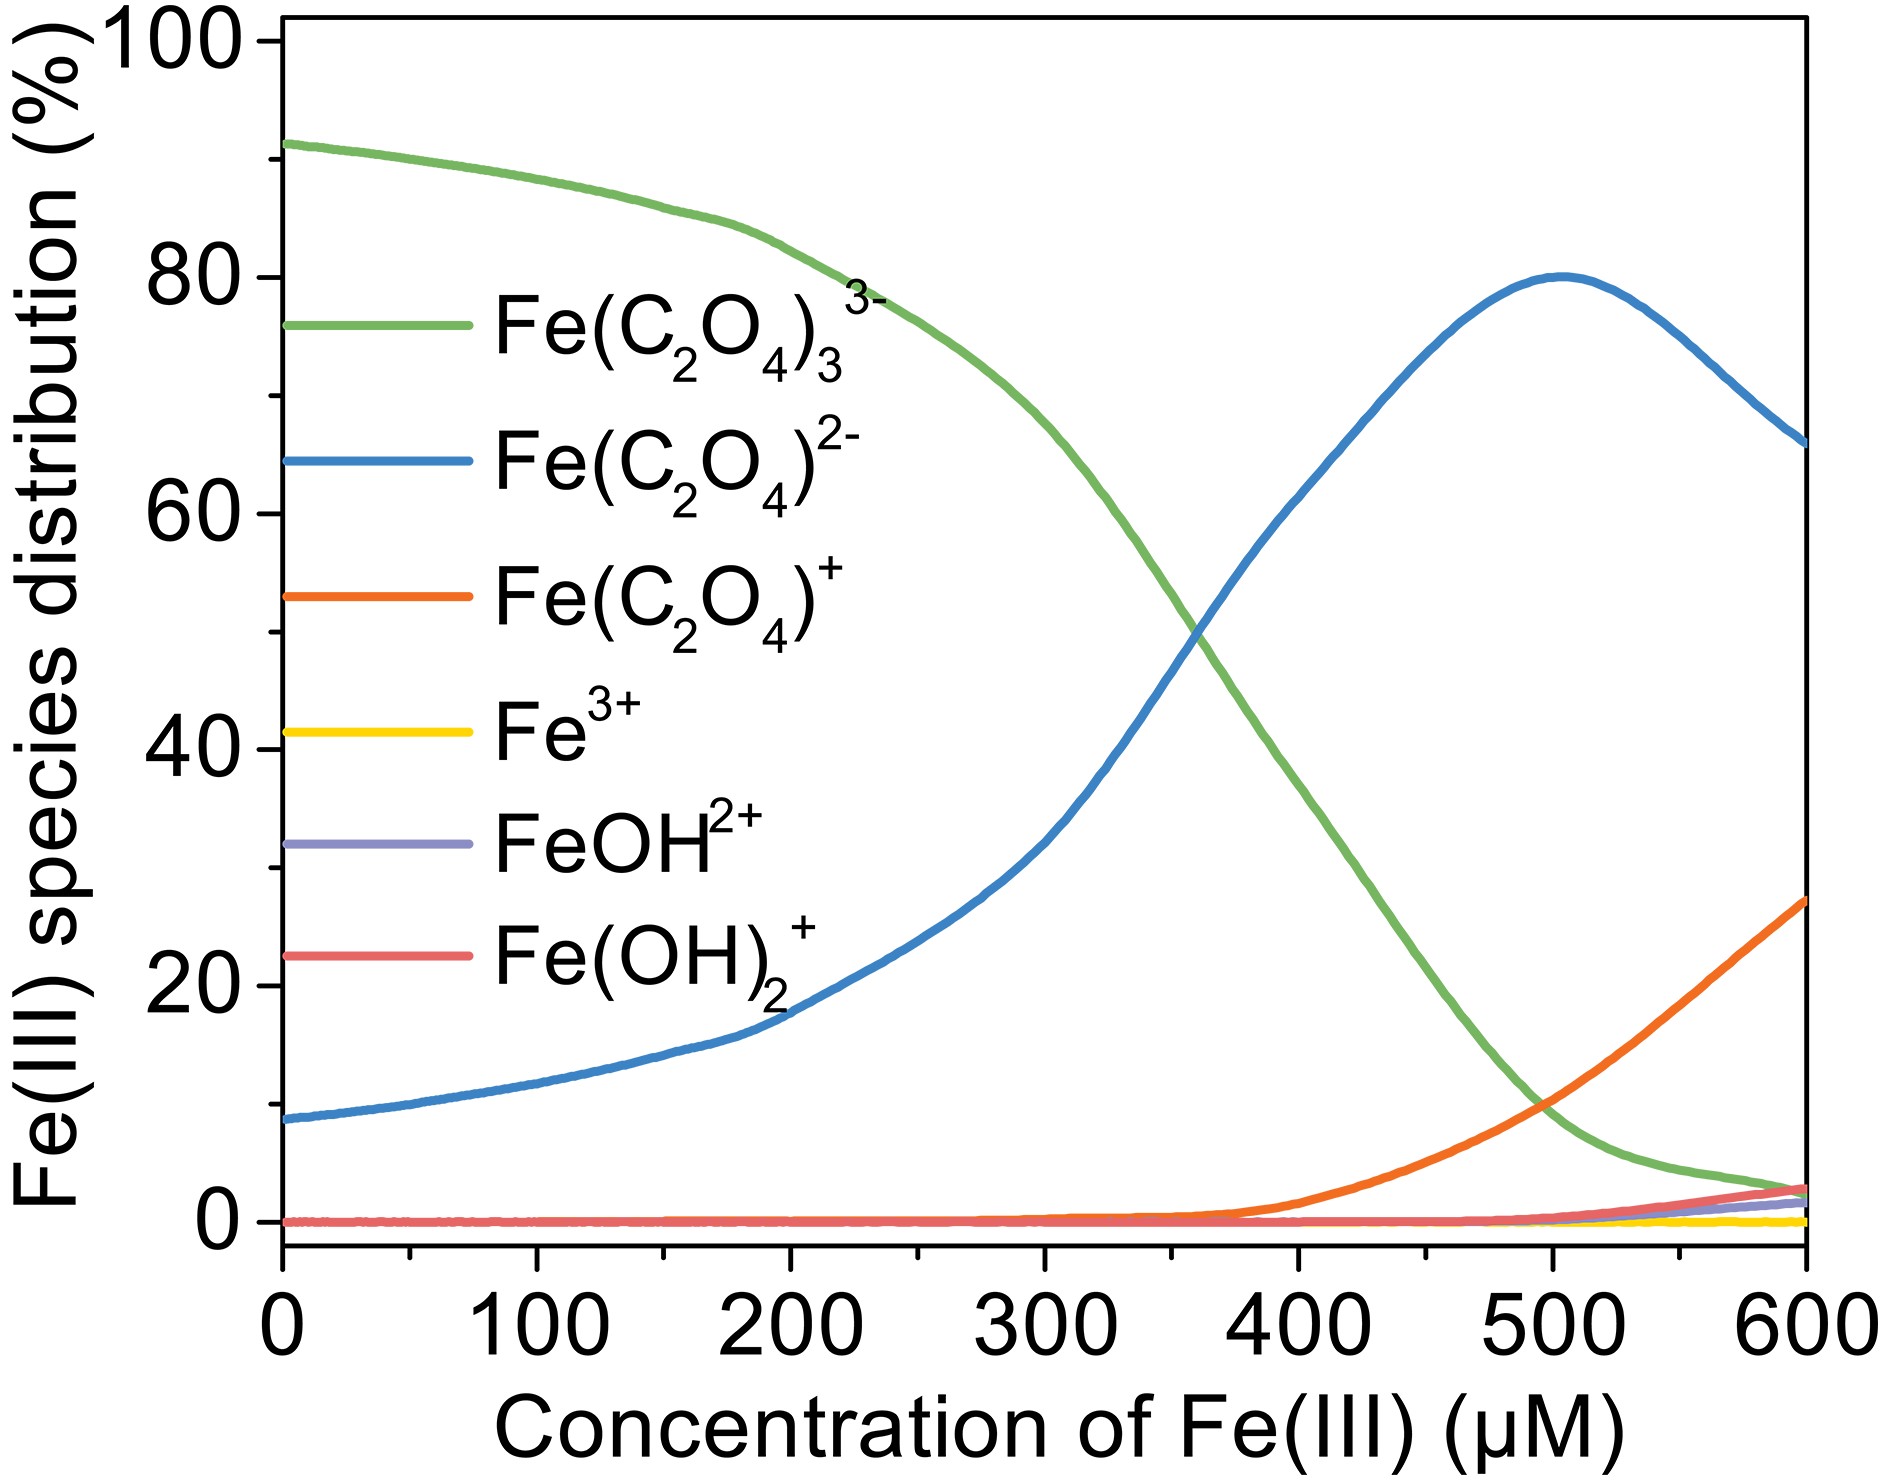 FigureA4. Change of Fe(III) species distribution with Fe(III) concentration, [Oxalate]0 = 1000 μM, pH = 4.0, 25°C.
2
3.4. Effects of solution pH
Solution pH has an important effect on the speciation and reactivity of Fe(III)-Ox. The typical pH value in the atmosphere is from 2.5 to 5.5. As shown in Fig. 4, the photooxidation rates of MACR decrease with increasing pH from 2.5 to 5.5.


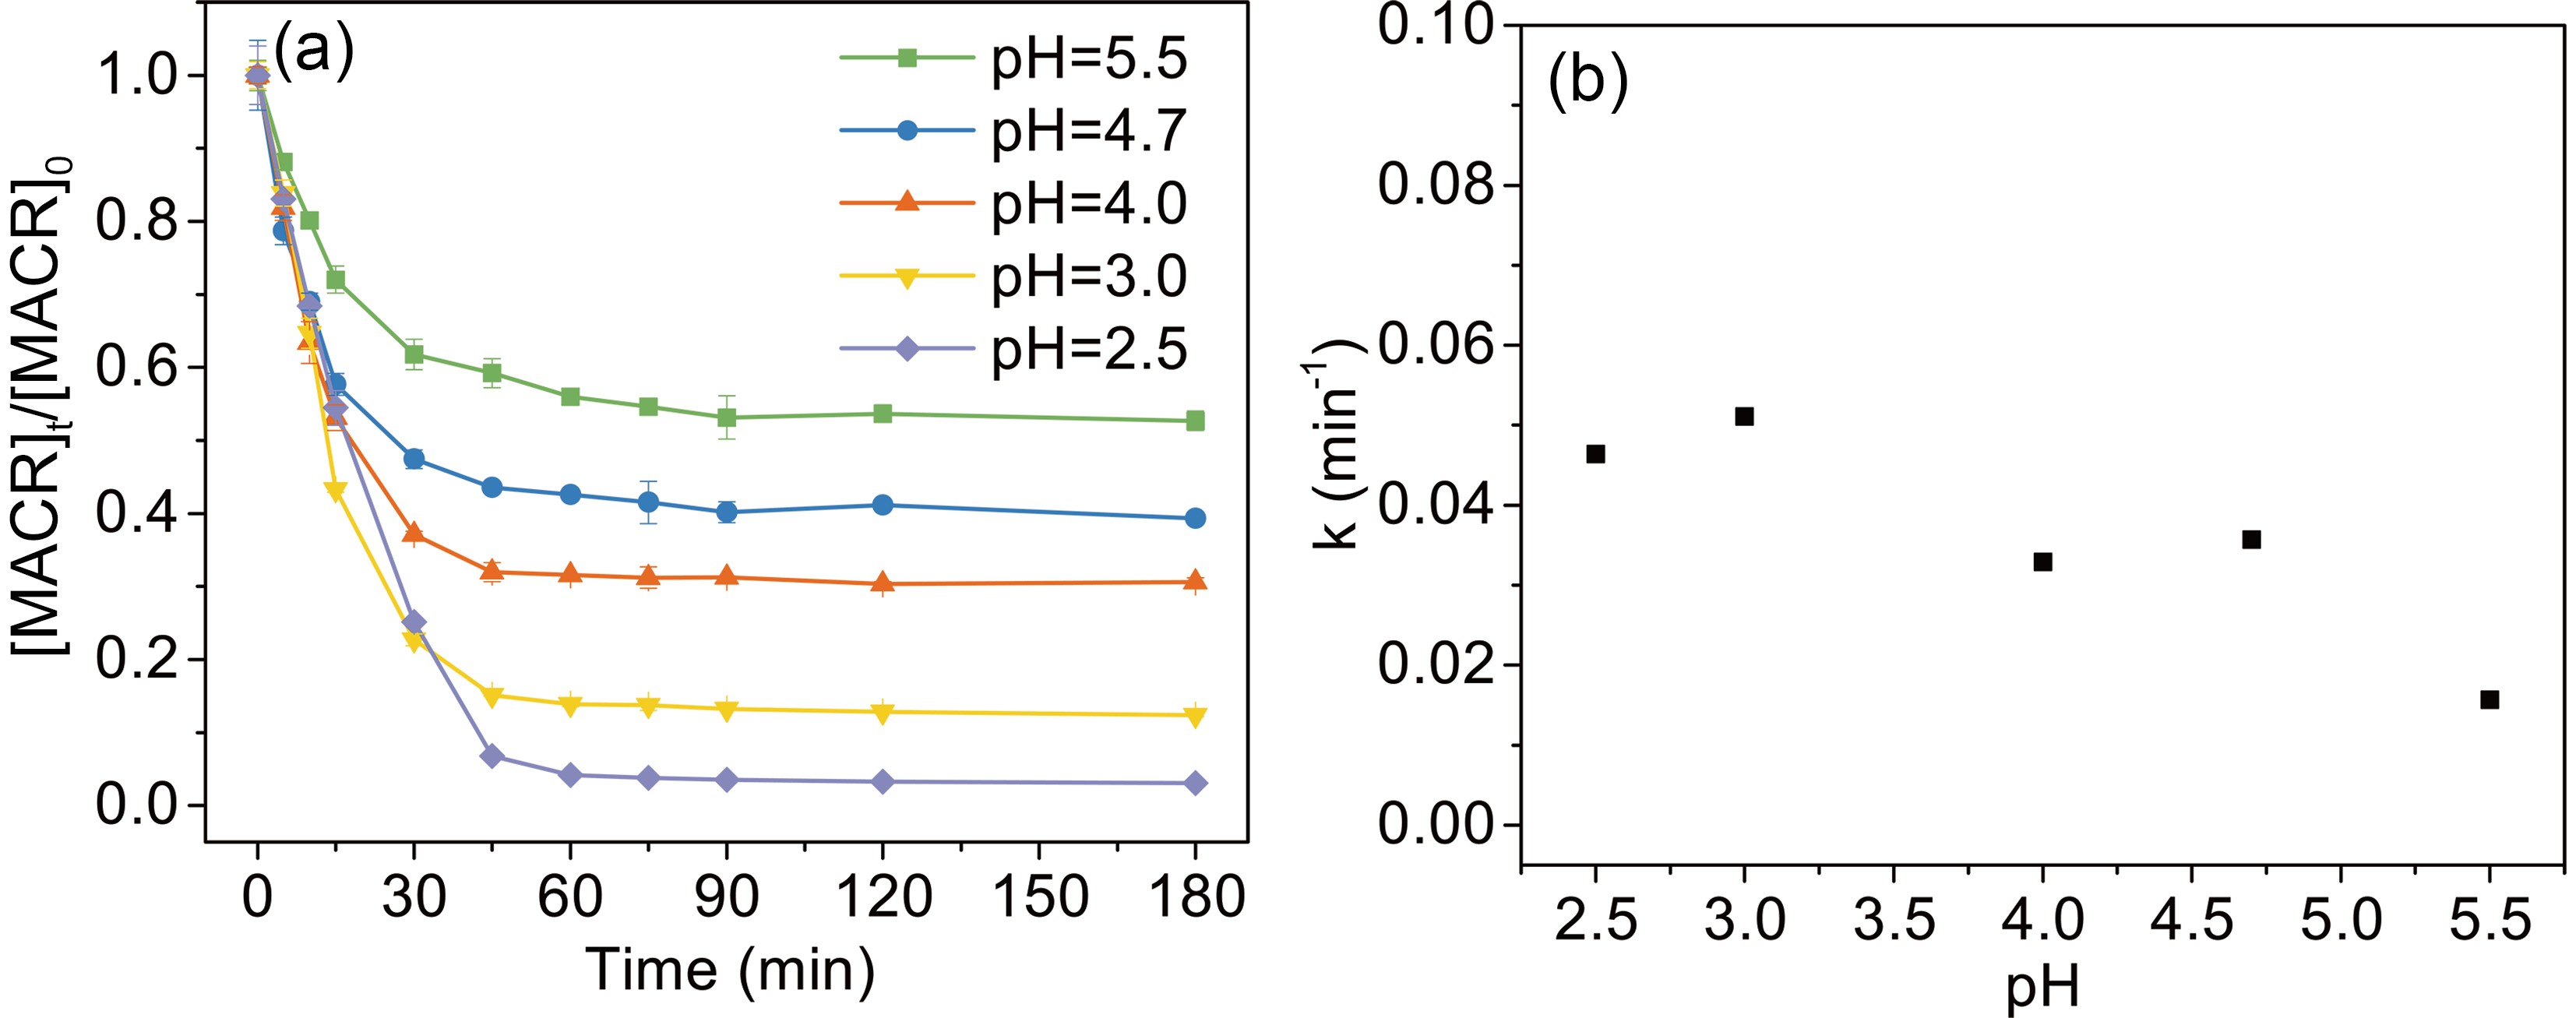 Figure4. Effect of pH on the photooxidation of MACR in the Fe(III)-Ox system ([Fe(III)]0 = 100 μM, [Oxalate]0 = 1000 μM, [MACR]0= 500 μM, air-saturated solution).
2
3.5. Effects of MACR concentration
The influence of initial MACR concentration (from 60 μM to 680 μM) is investigated (Fig. 5). The oxidation rates of MACR increase with decreasing MACR concentration, and 60 μM, 160 μM, and 250 μM MACR are 100% oxidized during 45 min. However, a certain amount of MACR remains when MACR concentration is high (such as 400 μM and 680 μM). This is because oxalate is depleted and is unable to produce enough ·OH to completely oxidize MACR.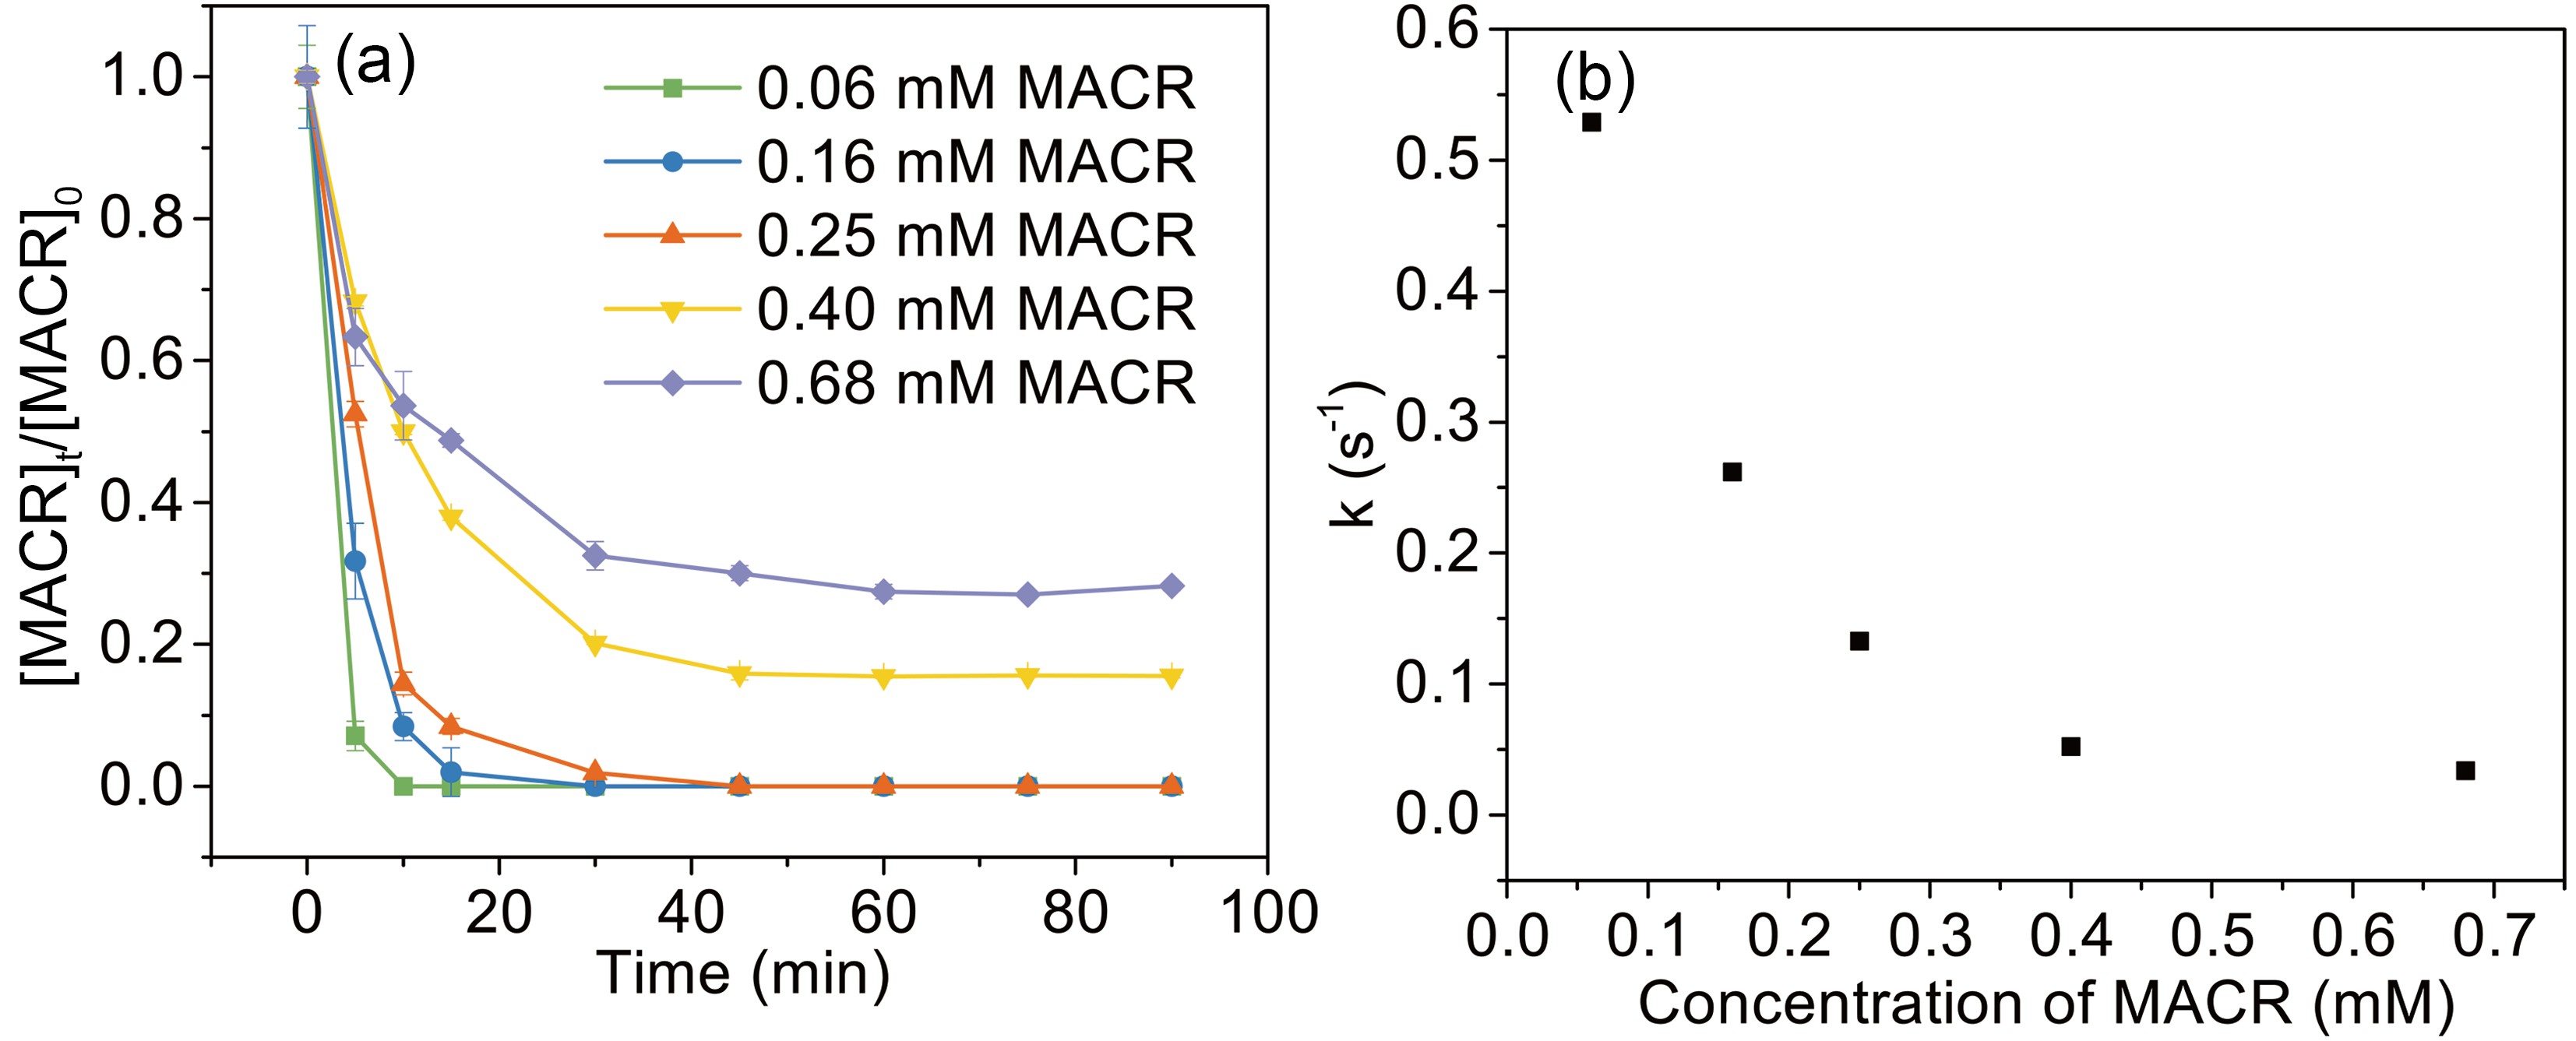 Figure5. Effect of MACR concentration on the photooxidation of MACR in the Fe(III)-Ox system ([Fe(III)]0 = 100 μM, [Oxalate]0 = 1000 μM, pH 4.0 ± 0.1, air-saturated solution).
2
3.6. Photooxidation mechanism of MACR in Fe(III)-Ox system
H2O2 and Fe(II) are the major long-lived oxidized active species in the photolysis of Fe(III)-Ox (Faust et al., 1993), and this determines the production of free radicals. As shown in Fig. 6a, Fe(II) concentration rapidly increases to 80% in 10 min, and then reduces to approximately 2% from 30 min to 60 min. Finally, Fe(II) concentration is maintained at an undetectable value in the remaining time. The total dissolved iron remains stable for 30 min and then quickly drops to only 5 μM left in the next 30 min. Fe(II) is usually formed by the photoreduction of


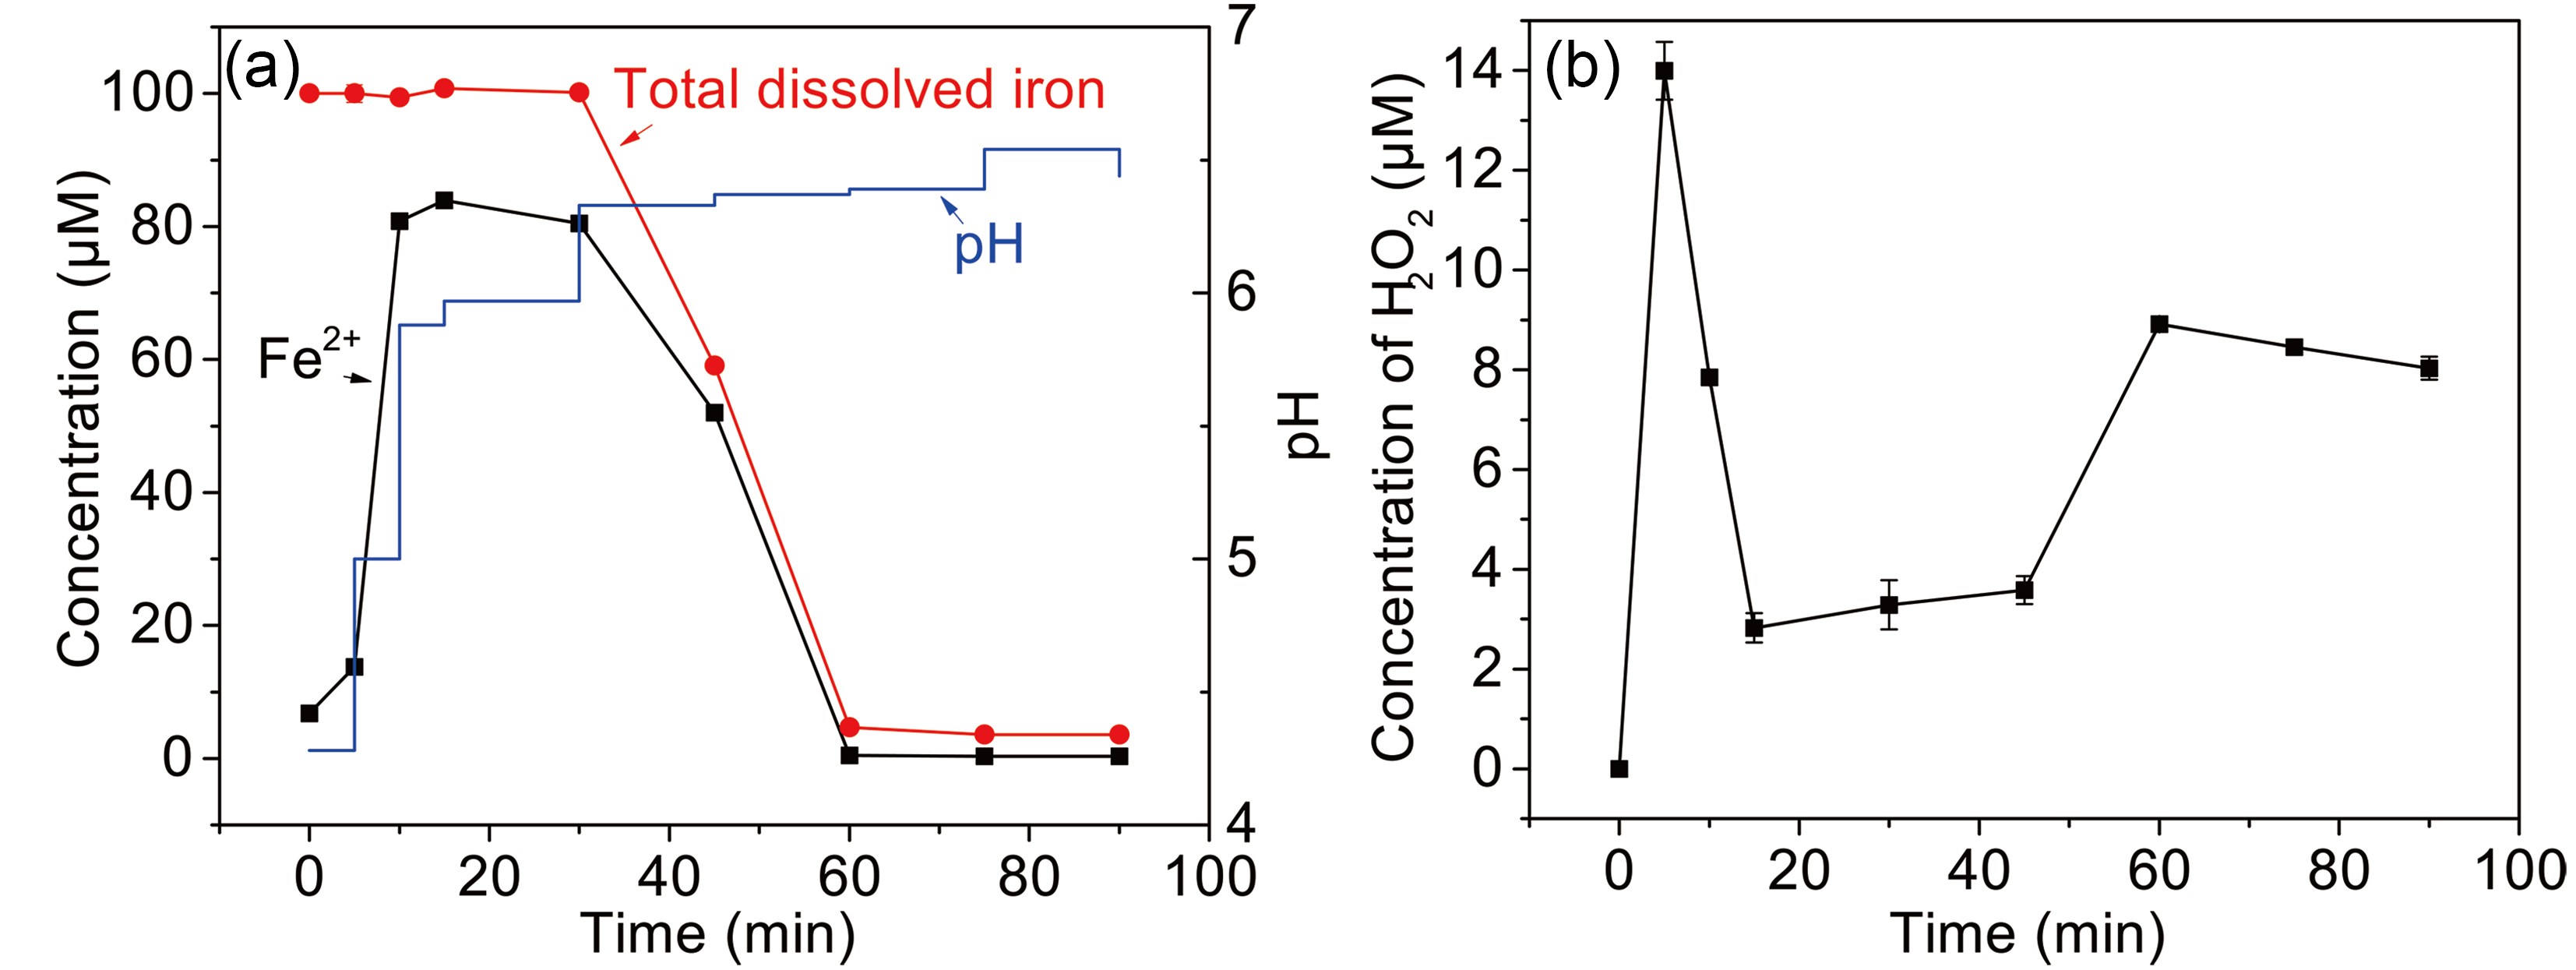 Figure6. (a) The change of Fe(II), total dissolved iron, and pH (b) H2O2 formation during the photooxidation of MACR in the Fe(III)-Ox system ([Fe(III)]0 = 100 μM, [Oxalate]0 = 1000 μM, [MACR]0 = 500 μM, pH 4.0 ± 0.1, air-saturated solution).
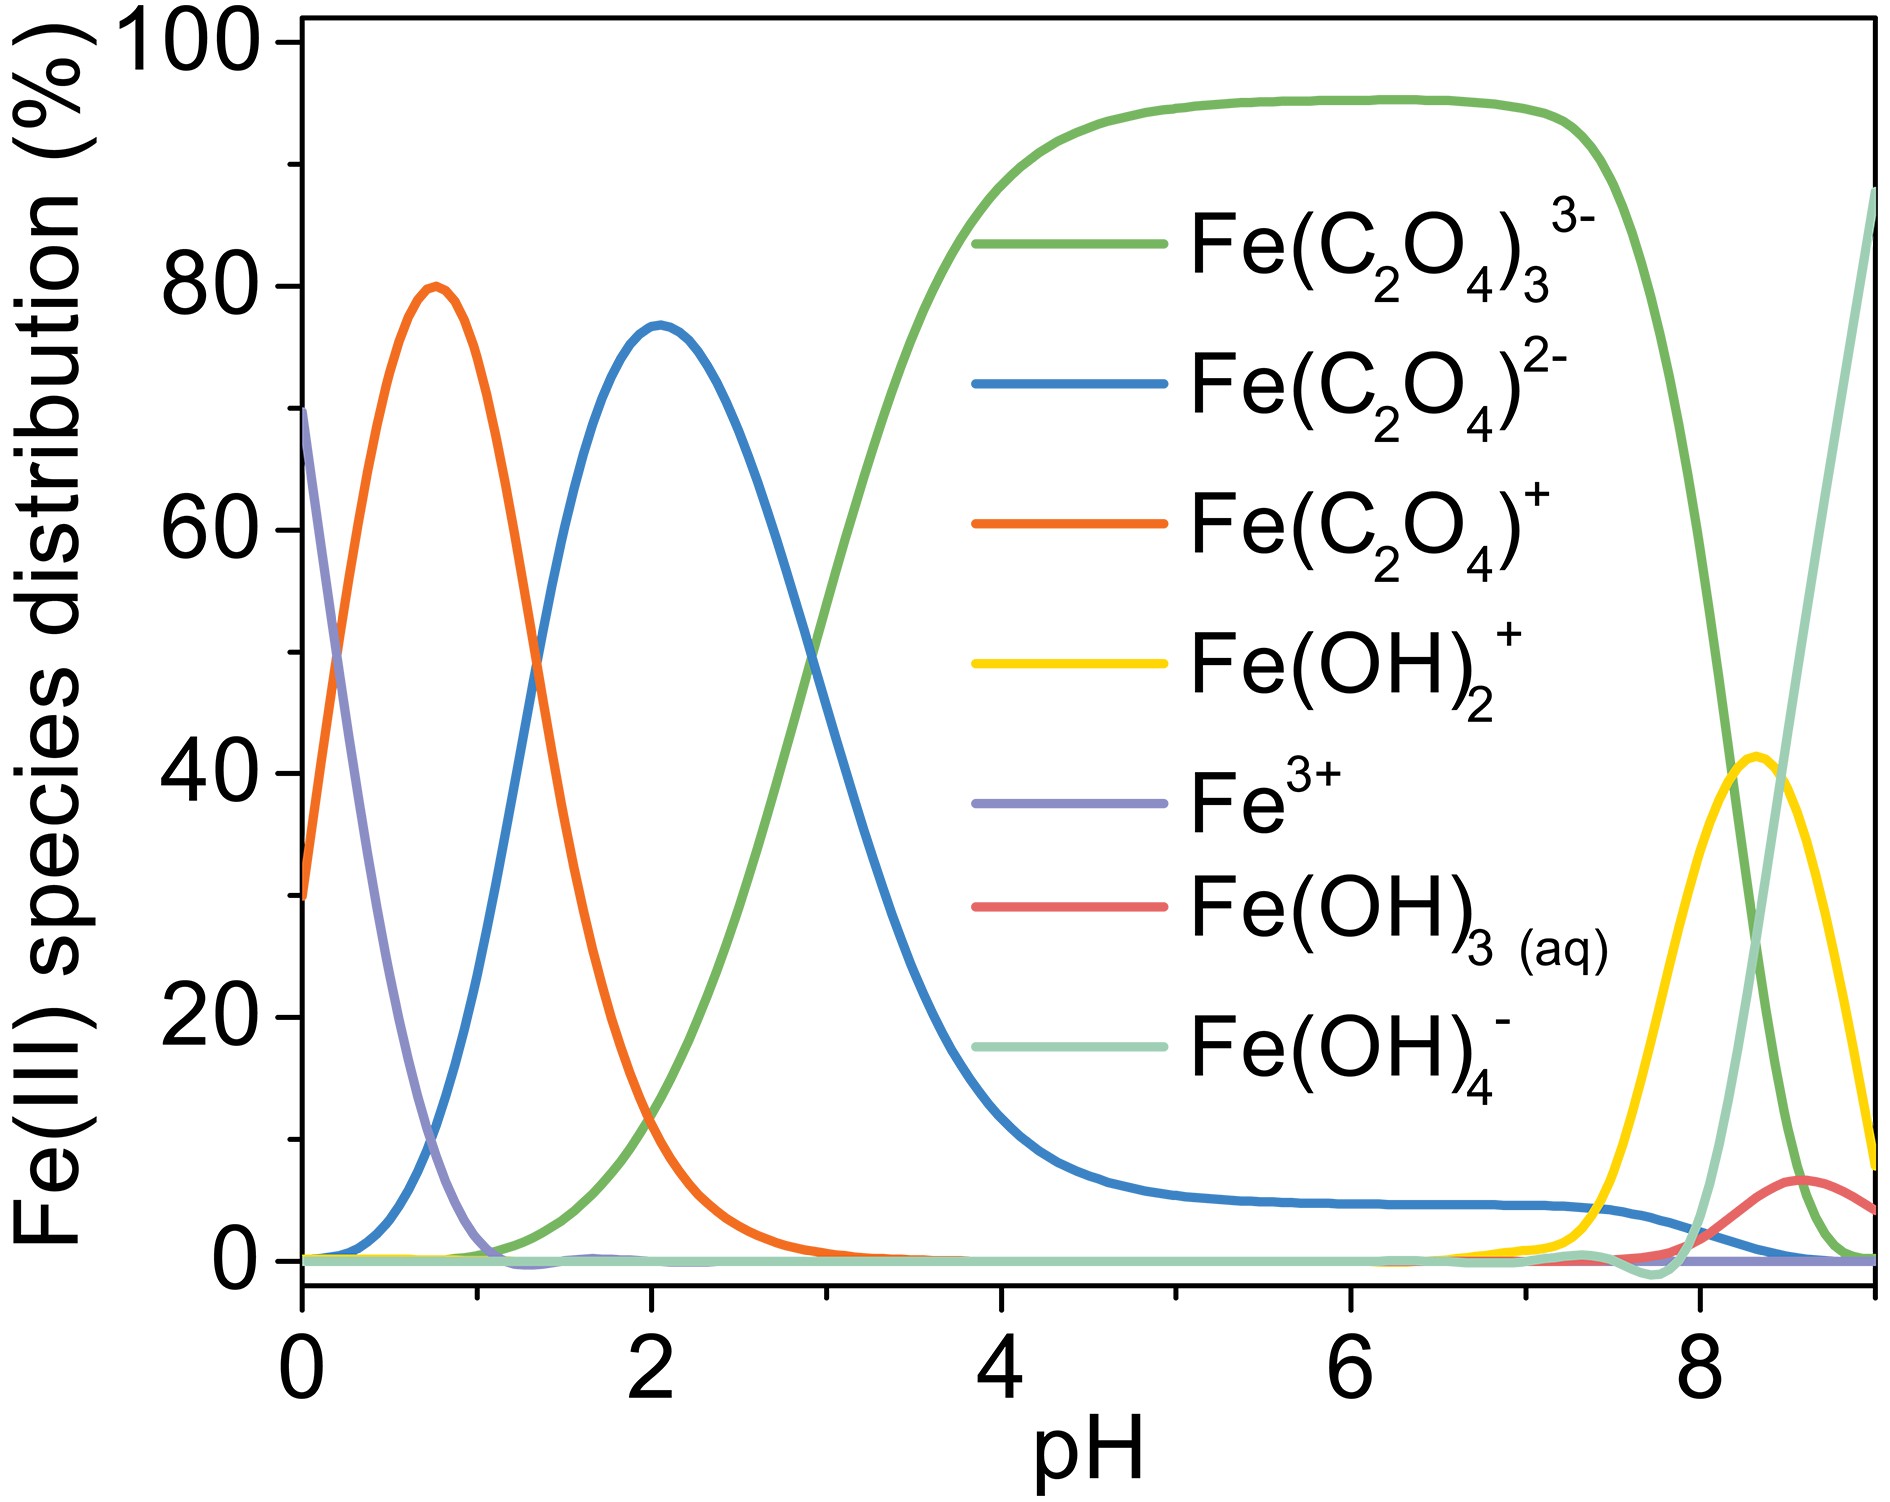 FigureA5. Change of Fe(III) species distribution with pH, [Fe(III)]0 = 100 μM, [Oxalate]0 = 1000 μM, 25°C.
The concentration of H2O2 increase in the first 5 min, then decreases in 5?45 min, and returns to increase after 45 minutes (Fig. 6b). H2O2 is the production of reaction of Fe(II) and


The mechanism of Fe(III)-Ox photolysis is shown in Eqs. 4?11.


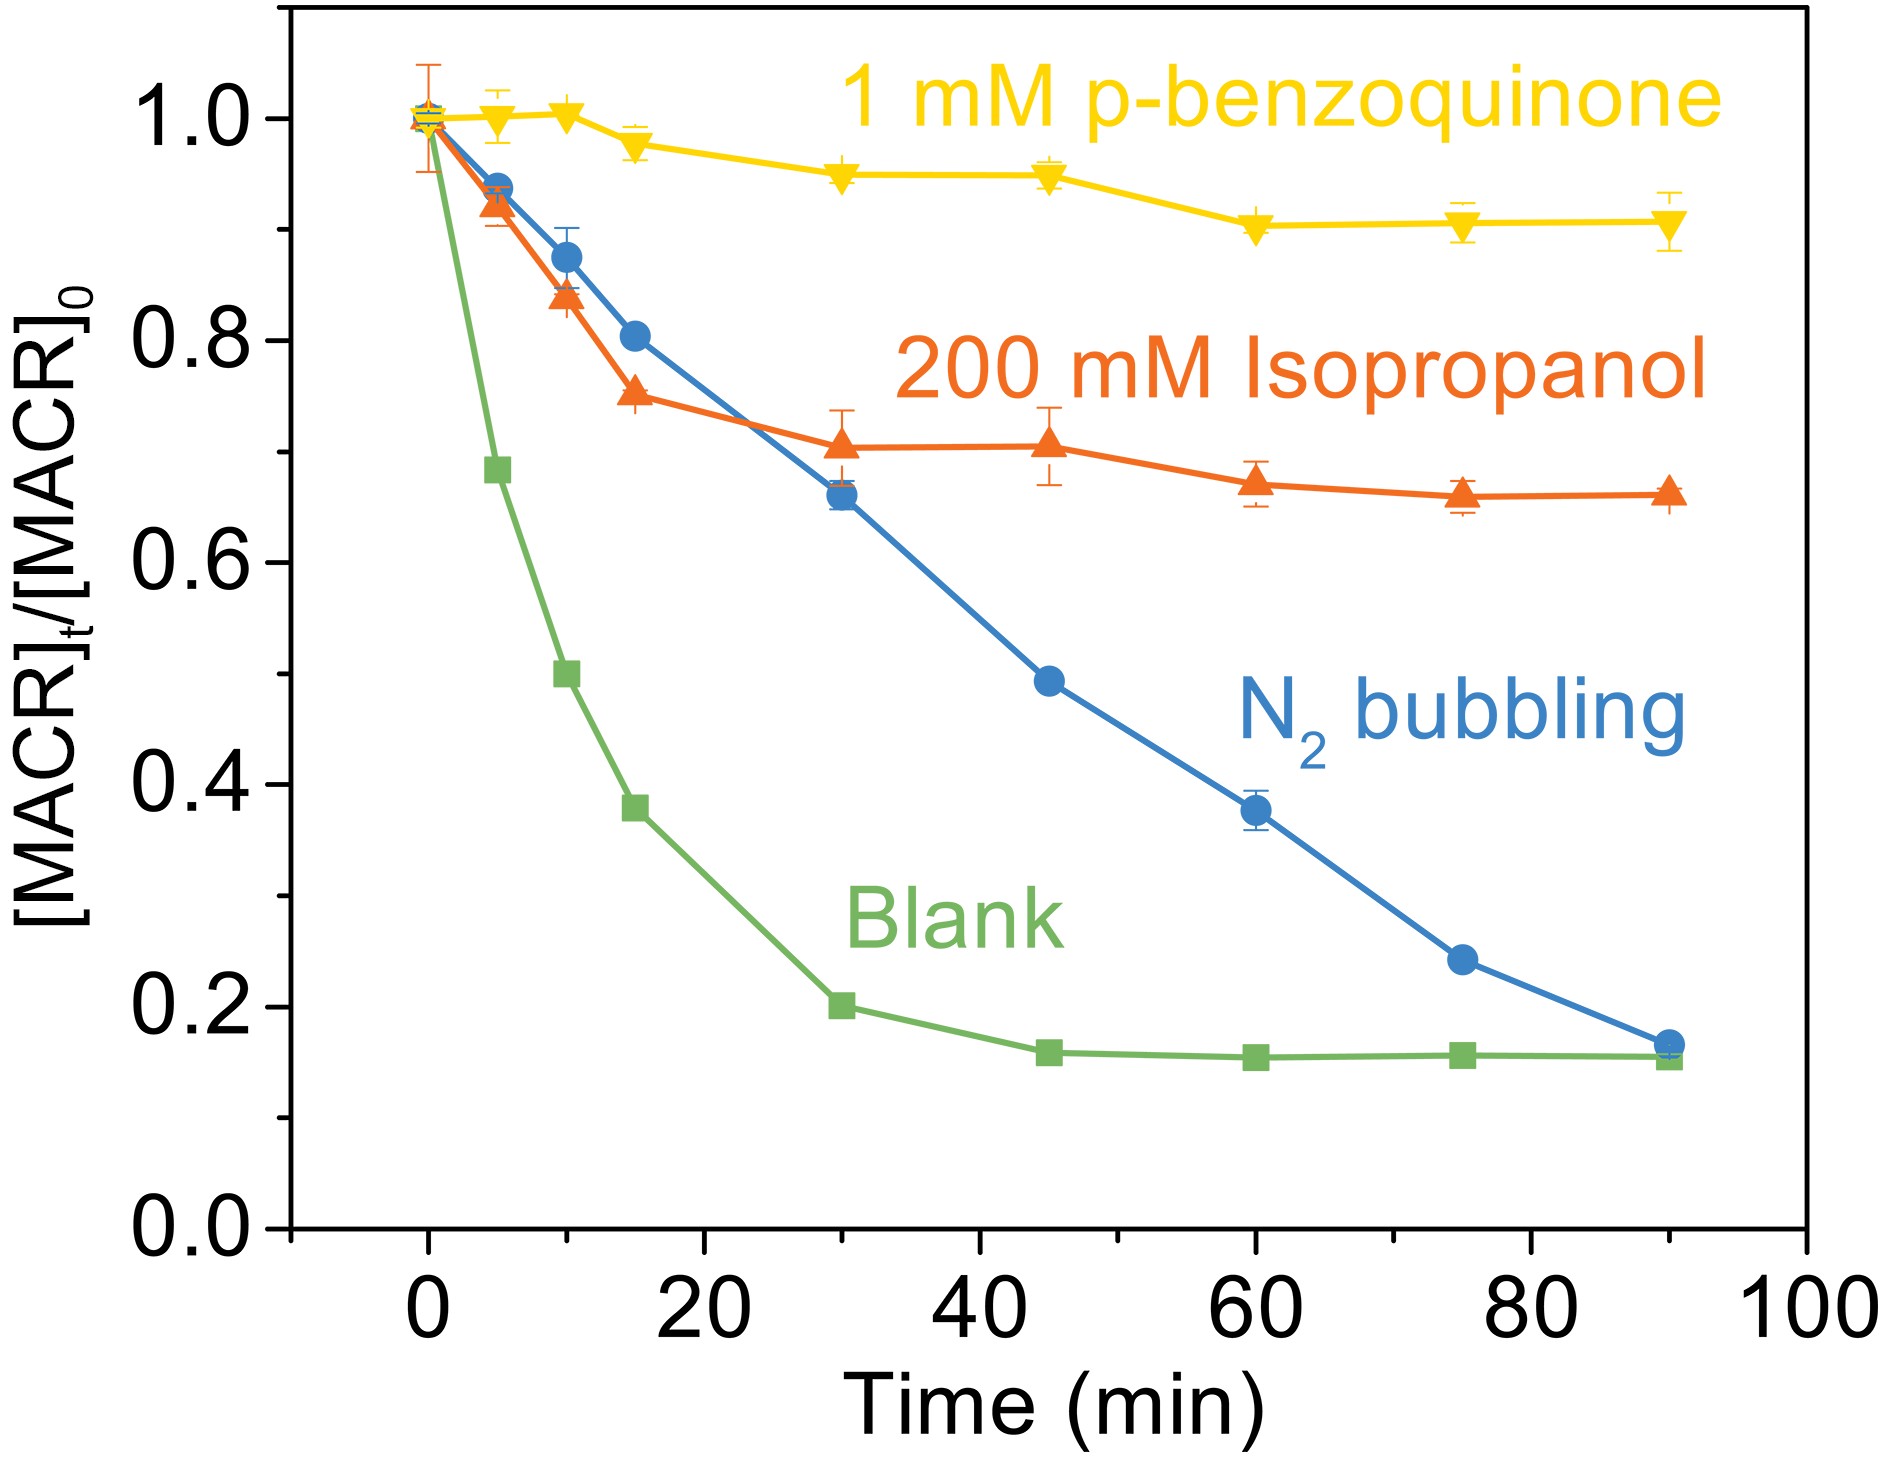 Figure7. Effect of scavengers on the photooxidation of MACR in the Fe(III)-Ox system ([Fe(III)]0 = 100 μM, [Oxalate]0 = 1000 μM, [MACR]0 = 500 μM, pH 4.0 ± 0.1, air-saturated solution).
The proposed reaction pathways based on the observed products are shown in Fig. 8. Here, we present and discuss the three possible pathways oxidation of MACR in Fe(III)-Ox Fenton-like reaction can proceed: via addition on the C = C bond by ·OH (pathway A) (Liu et al., 2009; Zhang et al., 2010), H-abstraction of the methyl group by ·OH and


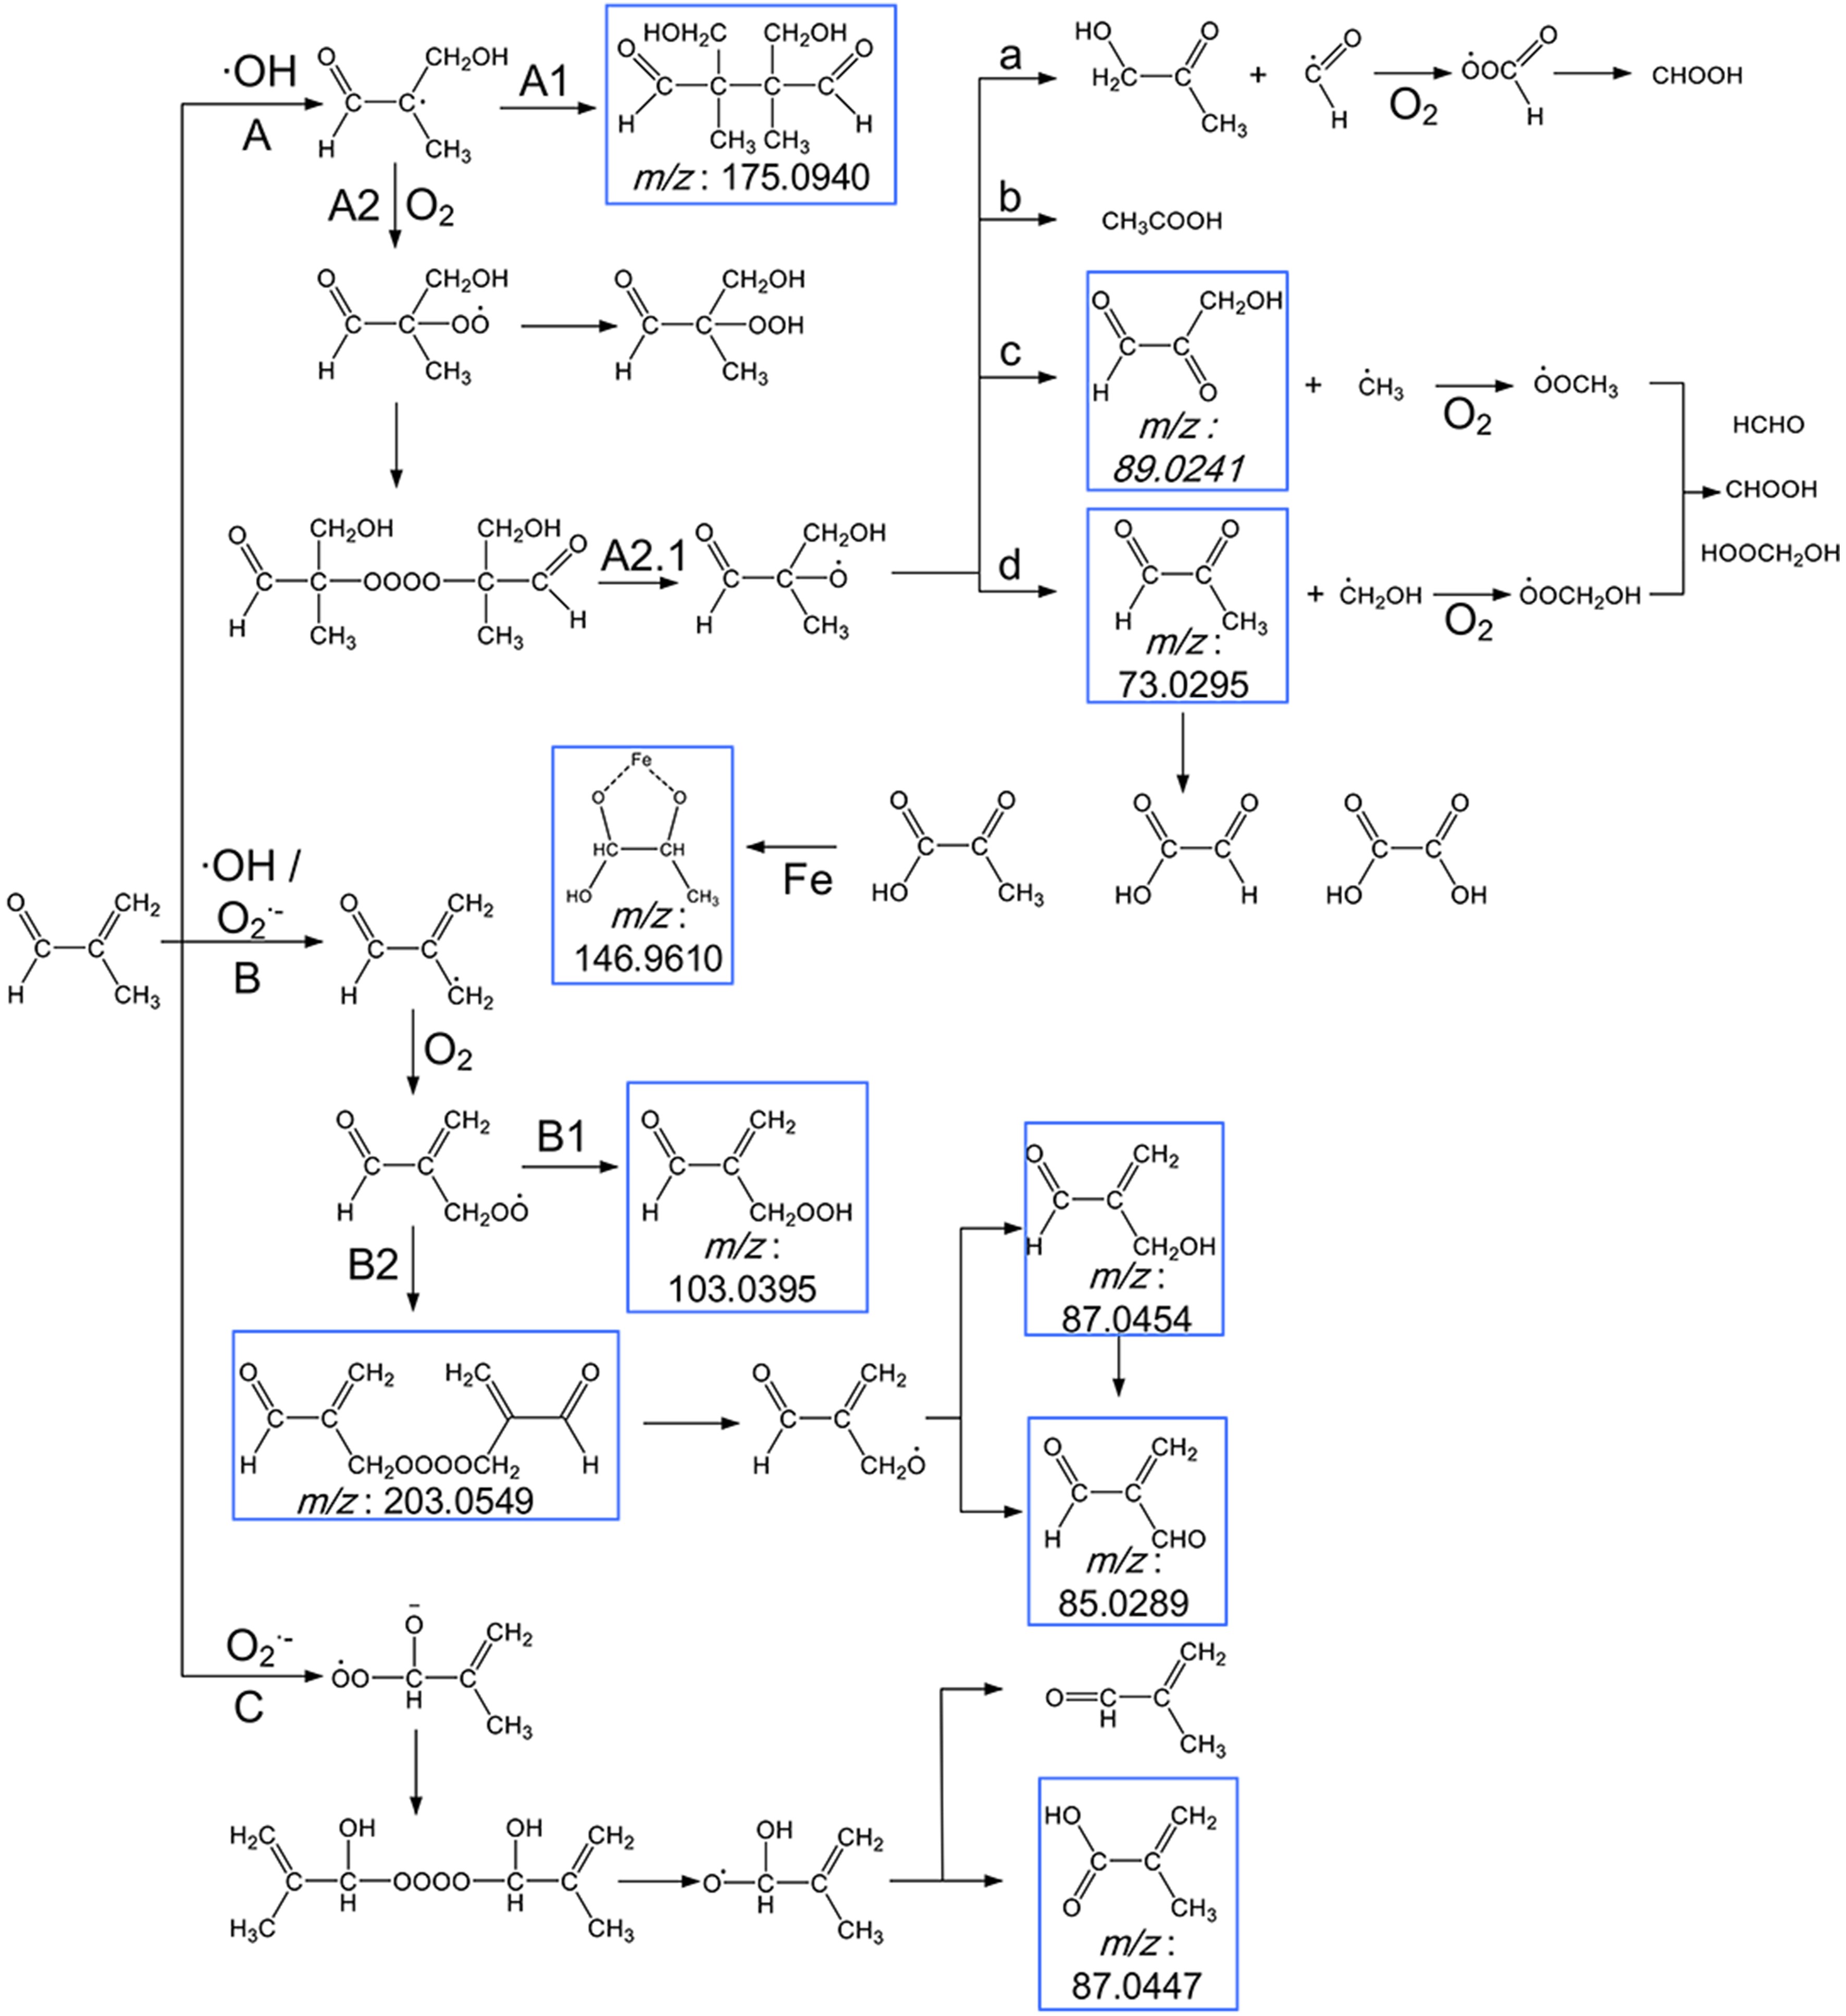 Figure8. Scheme for the proposed reaction pathways of the photooxidation of MACR in the Fe(III)-Ox system. The molecular formulas in the blue frames are observed products.
The external addition of ·OH leads to the formation of an alkyl radical, which may form aldehyde or react with itself to form polymer C8H14O4 (Mass-to-charge ratio m/z = 175.0940) directly (pathway A1) or rapidly add to O2 to form peroxy radical (pathway A2). The peroxy radical reacts with itself to form an unstable tetroxide, then degrades to form alkoxy radical (pathway A2.1). This alkoxy radical undergoes decomposition and forms C3H4O2 (m/z = 73.0295), C3H4O3 (m/z = 89.0241), C3H6O2, and acetic acid (pathway A2.1a, b, c, d). The radical fragments generated during the decomposition can also react with O2 to form HCHO, CHOOH, and HOOCH2OH. The C3H4O2 (m/z = 73.0296) can also result in the formation of pyruvate, glyoxylate, and oxalate. ·OH and


The formation of higher molecular weight compounds is observed, and the pathway of ·OH and

Small organic acids are known to be the main oxidation products of MACR (El Haddad et al., 2009). So, IC was used to analyze the 60 min photooxidation sample of MACR in Fe(III)-Ox and H2O2 systems. Photolysis of H2O2 only produces ·OH, and the product is compared with the oxidation product from the Fe(III)-Ox system. Similar MACR photooxidation rates are obtained in 200 mM H2O2 after 60 min compared with the Fe(III)-Ox system. The results of IC measurements are shown in Fig. 9. Except for the oxalate added at the beginning, acetic, formic and pyruvic acids are detected in photolysis of MACR in the Fe(III)-Ox system, although pyruvic acid is not detected in the H2O2 system. The concentrations of small organic acids in the two systems have obvious differences. More acetic acid and less formic acid are obtained from the Fe(III)-Ox system. This may be because the oxidation mechanism of MACR in the two systems differs, and the involvement of

 Figure9. Concentration of small organic acids in the photooxidation of MACR in H2O2 and Fe(III)-Ox system at 60 min obtained by IC ([Fe(III)]0 = 100 μM, [Oxalate]0 = 1000 μM, [MACR]0 = 500 μM, pH 4.0 ± 0.1).
As shown in Fig. 10, the absorbance of the solution changes significantly with irradiation time. Two big absorbance peaks are found at around 280 nm and 310 nm at the beginning of the reaction, which from oxalate and MACR, respectively. The absorbance at 310 nm decreases in the first 30 min, and the absorbance of 280 nm relative to the nearby baseline decreases in the first 10 min, increases from 10 min to 60 min, then decreases from 60 min to 180 min. The absorbance of the region with a wavelength higher than 320 nm increases from 30 min to 150 min. The increasing absorbance at 280 nm might be due to the

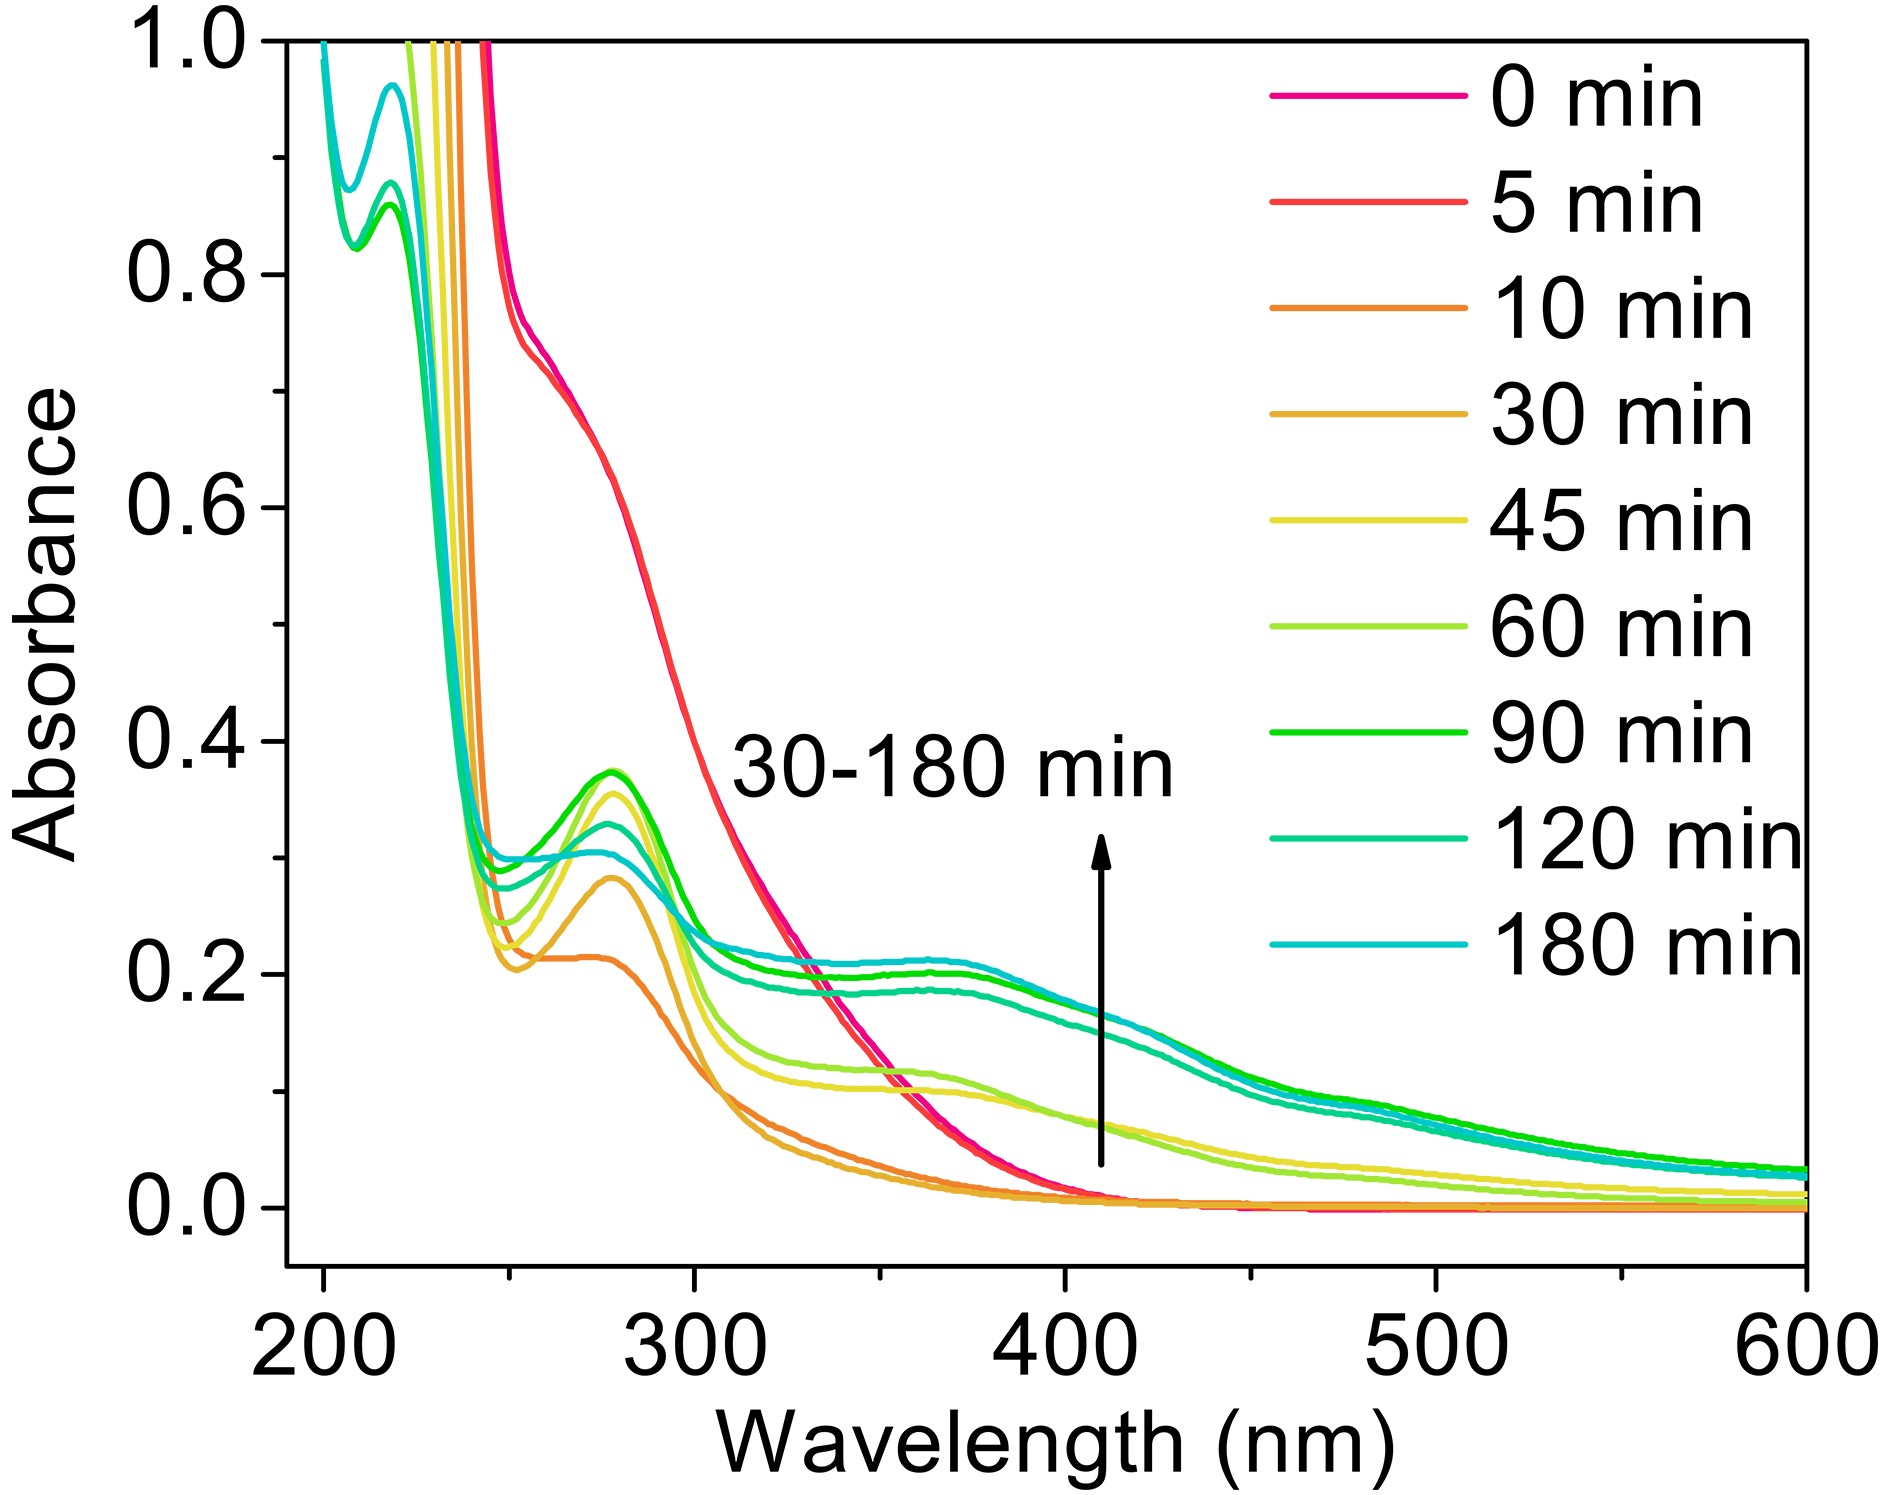 Figure10. The UV-Vis spectra of the photooxidation of MACR in Fe(III)-Ox system after filtering with 0.22 μm filter ([Fe(III)]0 = 100 μM, [Oxalate]0 = 1000 μM, [MACR]0 = 500 μM, pH 4.0 ± 0.1, air-saturated solution).
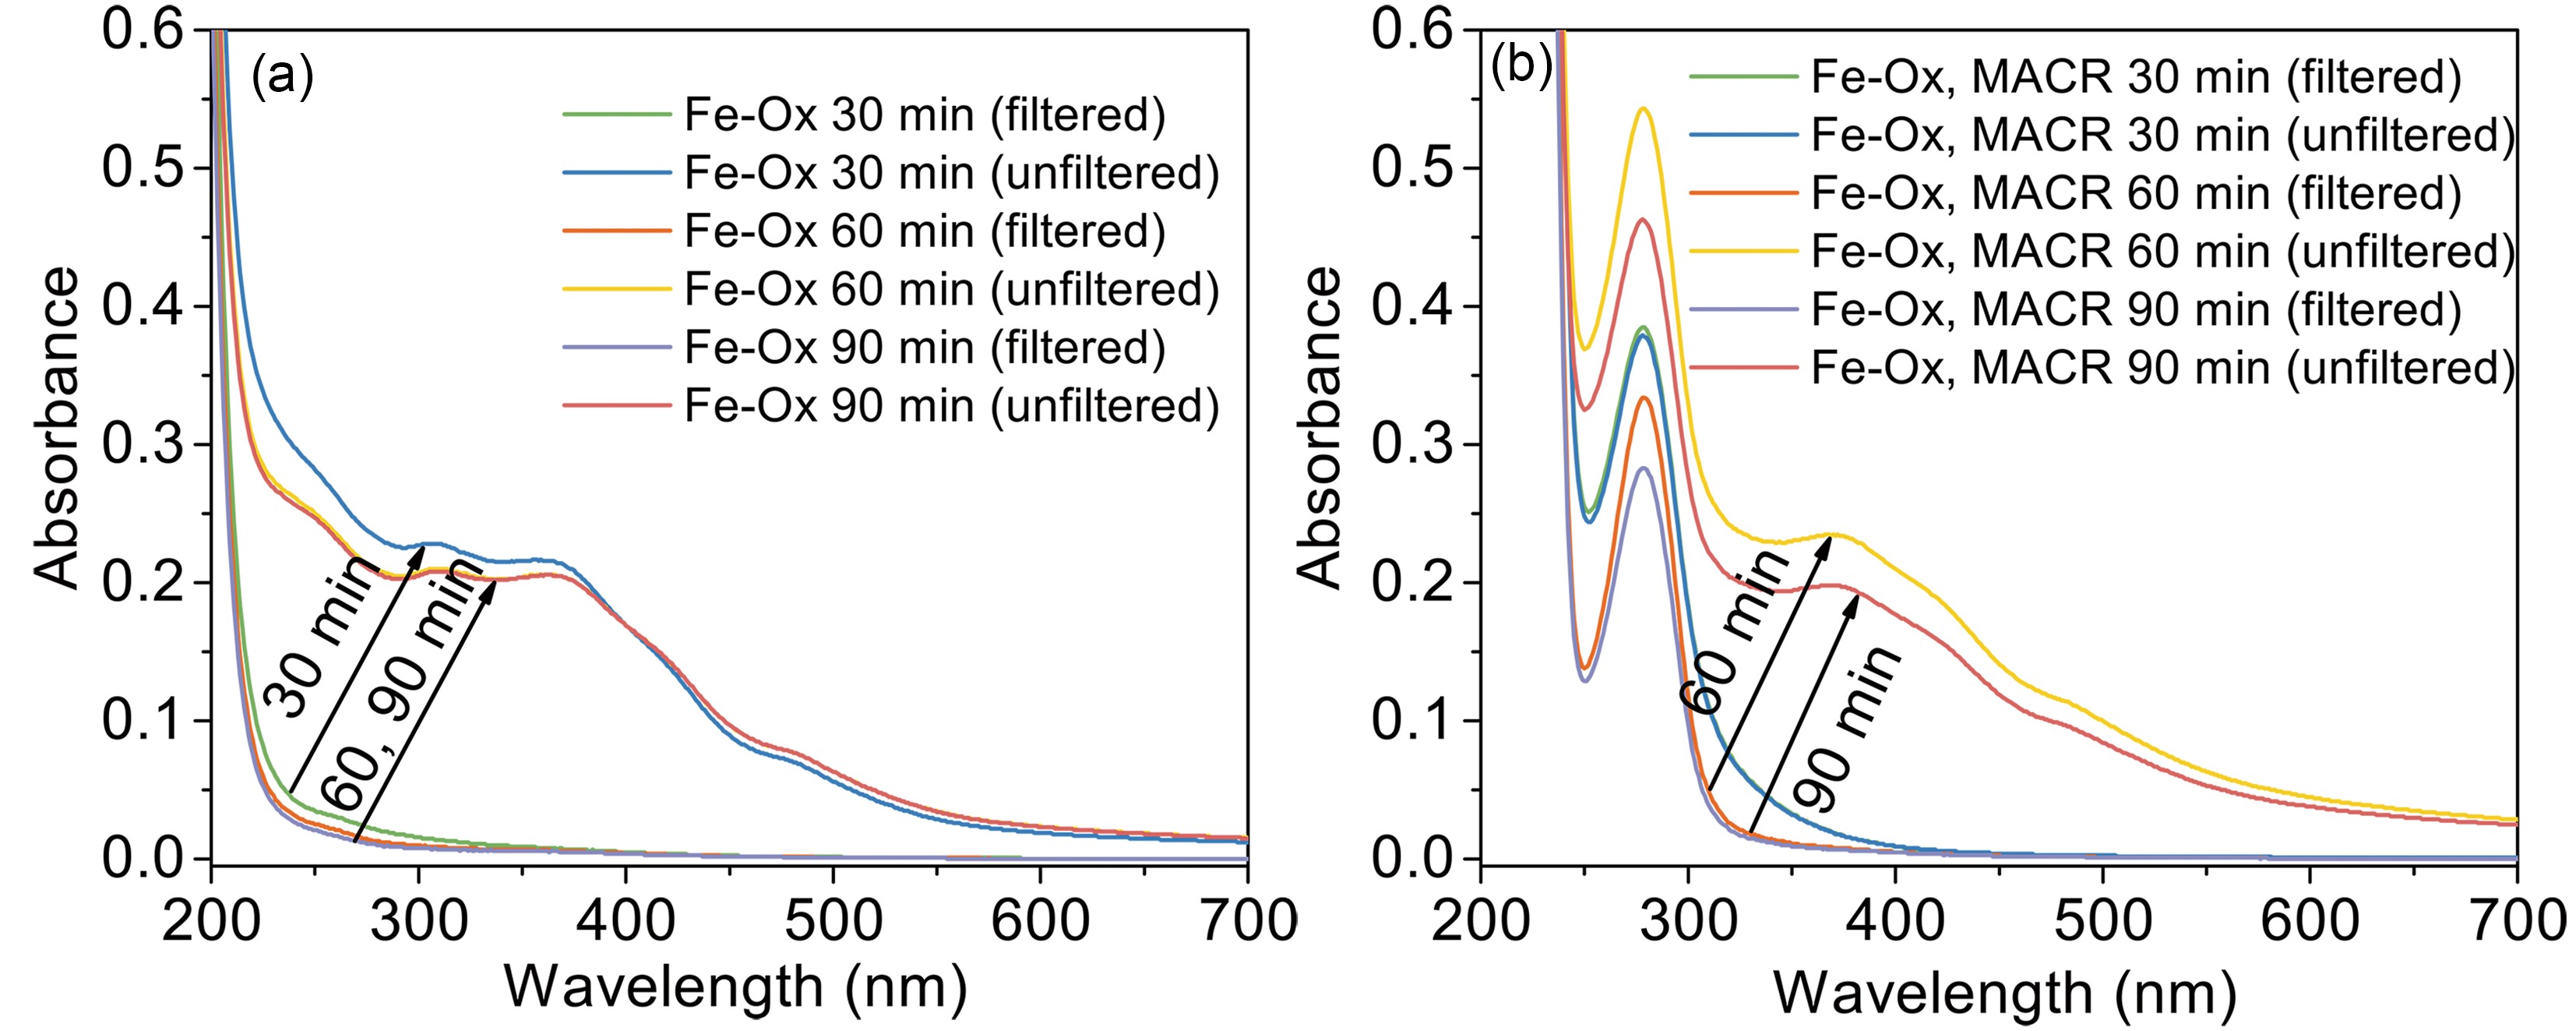 FigureA6. The UV-Vis spectra of filtered (0.22 μm) and unfiltered (a) photolysis of the Fe(III)-Ox system, and (b) the photooxidation of MACR in the Fe(III)-Ox system ([Fe(III)]0 = 100 μM, [Oxalate]0 = 1000 μM, [MACR]0 = 500 μM, pH 4.0 ± 0.1, air-saturated solution).


Acknowledgements. The authors gratefully acknowledge financial support from the Ministry of Science and Technology of the People’s Republic of China (Grant Nos. 2017YFC0210005 and 2016YFE0112200).
APPENDIX
