HTML
--> --> -->These results suggest that the exact relationship between the size of a TC measured by different metrics and the intensity remains unclear. Guo and Tan (2017) introduced a new concept to quantitatively interpret the wind structure of TCs, which they referred to as TC fullness (TCF). TCF is defined as the ratio of the radial extent between the near-surface RMW and R17 (namely the width of the outer core wind skirt) to R17. Guo and Tan (2017) found that the intensity of TCs is more strongly correlated with TCF than other measures of size. They further suggested that, along with rapid growth in the TCF, a strong low-level inflow and the radially inward advection of the absolute angular momentum favor the intensification of TCs. A significant finding in Guo and Tan (2017) is that either small or large TCs can be intense, depending on the TCF. Note that although TCF was proposed to supplement TC size metrics, this concept is not explicitly related to a specific TC size measurement. As found in Guo and Tan (2017), a given TCF value can be associated with either small or large TCs measured with typical TC size metrics.
Guo and Tan (2017) used the Extended Best-Track dataset (Demuth et al., 2004, 2006) to calculate the TCF. The wind radii in this dataset are mainly estimated using parameters derived from the Advanced Microwave Sounding Unit instrument onboard National Oceanic and Atmospheric Administration (NOAA) and European satellites. The main drawback of using microwave data to estimate the size of a TC is that the microwave instrumentation is onboard polar-orbiting satellites and is therefore not available at synoptic times. In addition, the winds estimated using microwave remote sensing may have more significant uncertainties than scatterometry, which gives the most direct estimation of surface winds (Dean et al., 2009). It is unclear whether the TCF characteristics reported by Guo and Tan (2017) are different from those determined using in situ observations. We thus re-examine the characteristics of TCF based on the Extended Flight Level Dataset for TCs (FLIGHT+; Vigh et al., 2018), which includes in situ, flight-level observations from aircraft reconnaissance flights. Moreover, the relationships between the kinematic and thermodynamic characteristics of TCs and the TCF will be discussed as well.
The remainder of this paper is organized as follows. Section 2 introduces the data and methods. Sections 3 describes the characteristics of the flight-level TCF measured in the FLIGHT+ dataset. The relationships between the kinematic and thermodynamic characteristics of TCs and the TCF are presented in section 4. A summary is given in section 5.
2.1. FLIGHT+ aircraft reconnaissance data
The FLIGHT+ dataset includes 229 flight missions for 74 hurricanes from 1997 to 2015. FLIGHT+ consolidates in situ, flight-level data observed by the NOAA WP-3D (Aberson et al., 2006b) and US Air Force WC-130 aircraft. Figure 1a shows a flight path into Hurricane Rita by WP-3D aircraft on 21 September 2005, which is in the FLIGHT+ dataset and includes several radial flight legs during the penetration of the aircraft into the inner core of the hurricane. The FLIGHT+ dataset consists of observations from the radial flight legs. The radial legs where the radial extent is > 45 km and the aircraft flew within 25 km of the center of the TC (Fig. 1b) are defined as “good” radial legs. We only use the observations in “good” radial legs in this study. More information on the FLIGHT+ dataset is given in Martinez et al. (2017) and Vigh et al. (2018).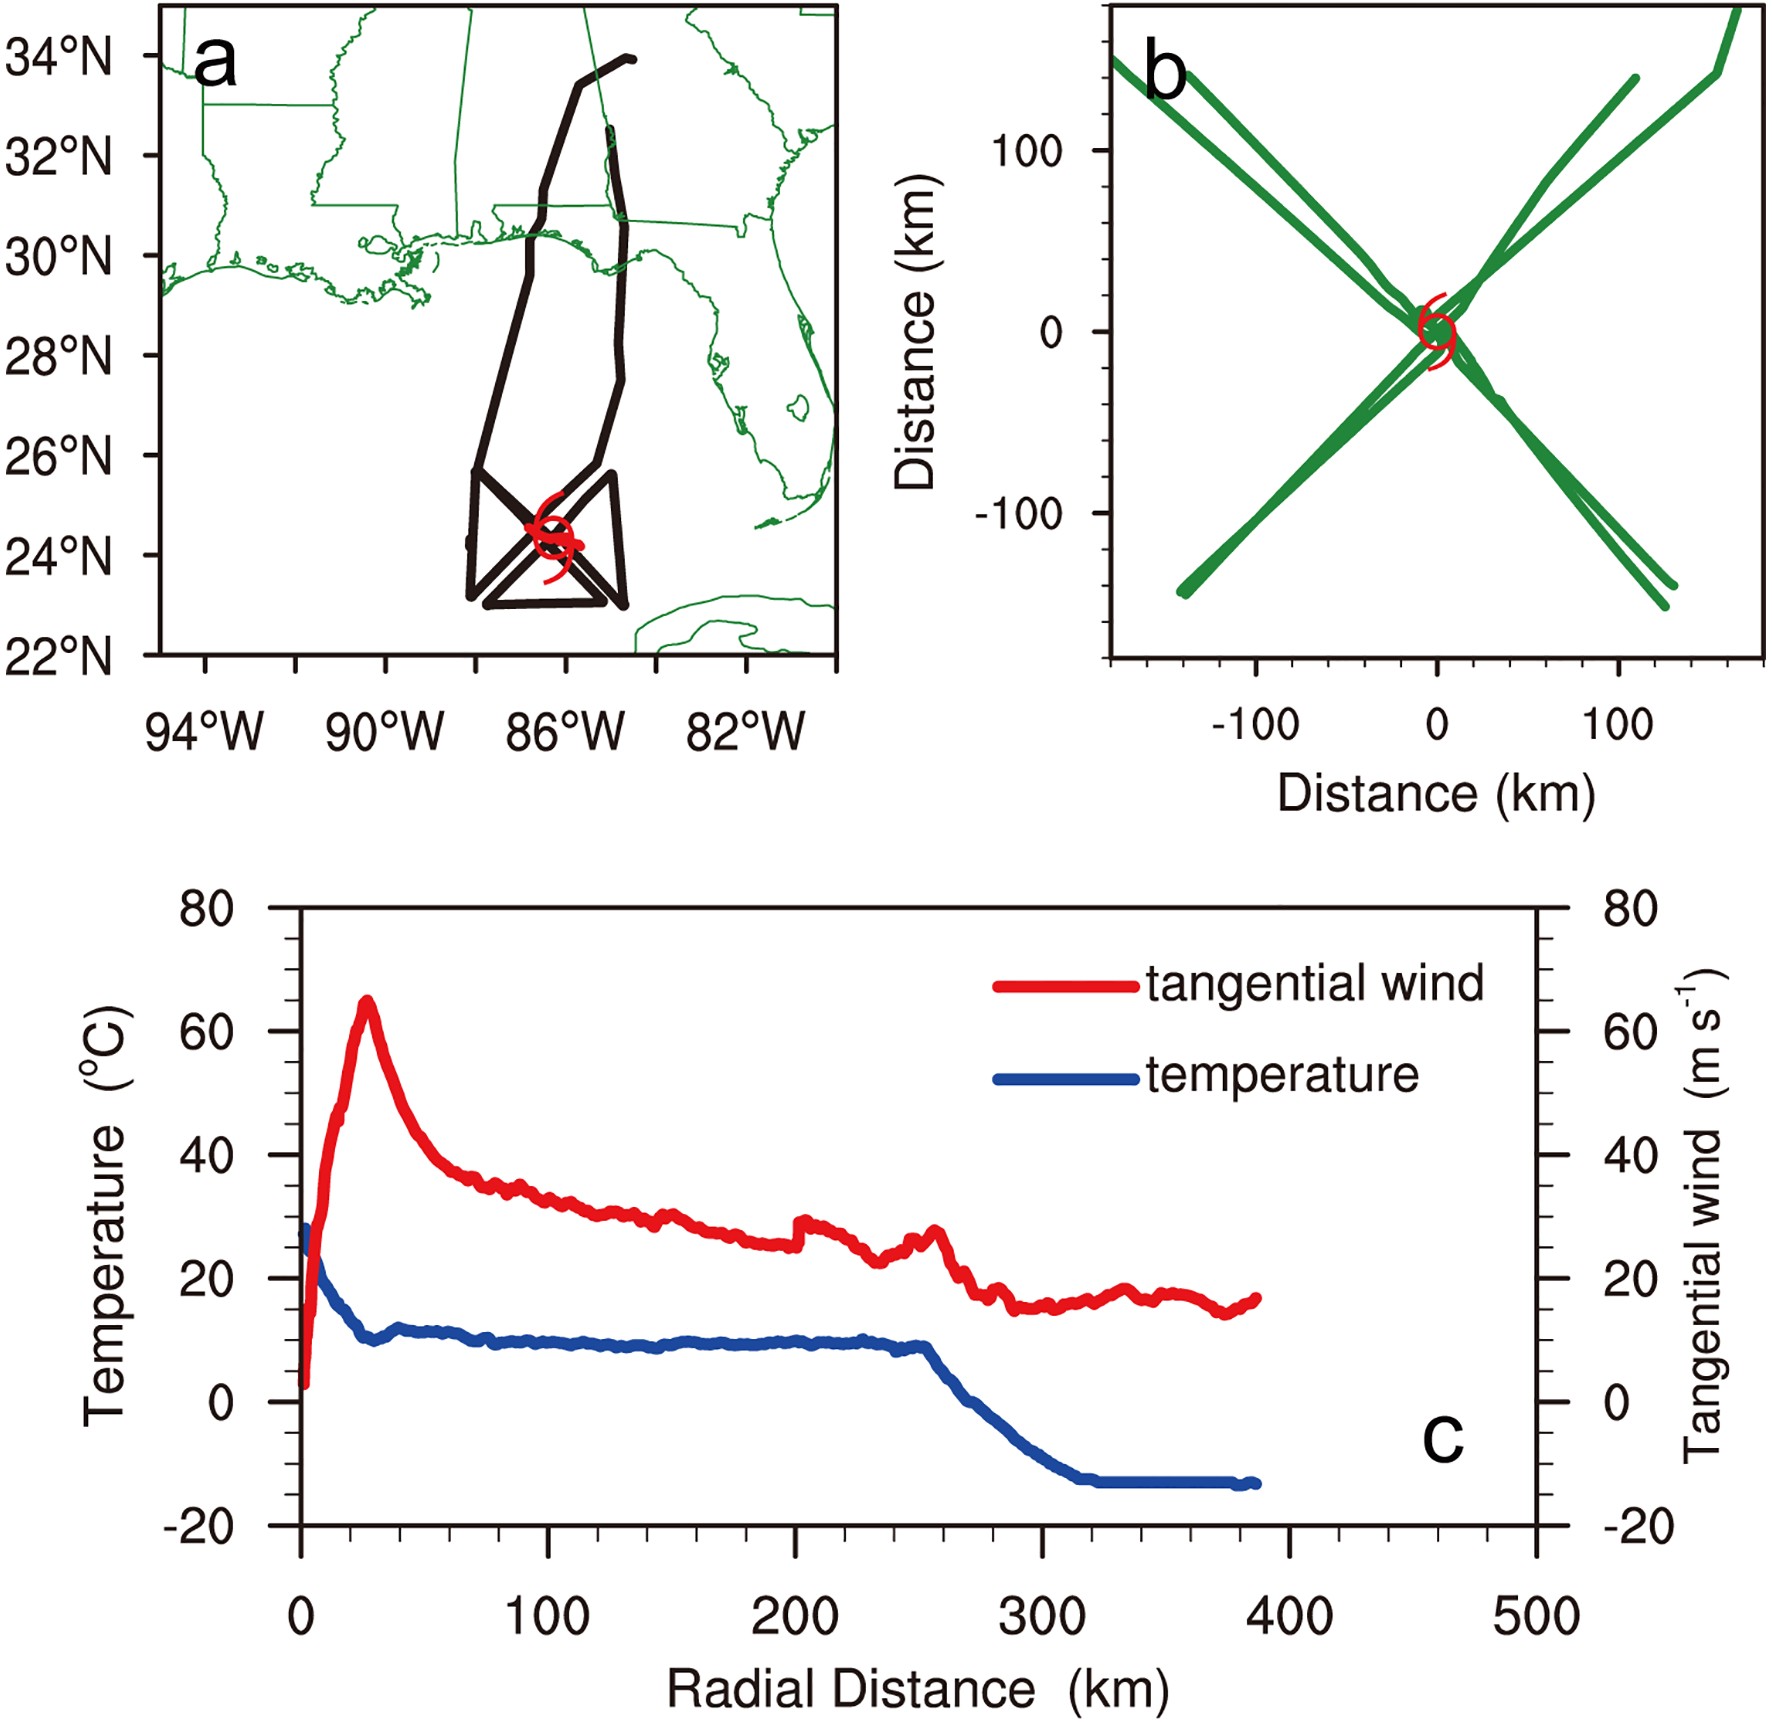 Figure1. (a) Flight path (black line) through Hurricane Rita on 21 September 2005. The red hurricane symbol denotes the center of the hurricane determined using the method proposed by Willoughby and Chelmow (1982). (b) Example of “good” radial legs (green lines) relative to the center of the TC. (c) Azimuthal mean profiles of the tangential wind (red line; m s?1) and temperature (blue line; °C) of “good” radial legs in a flight mission into Hurricane Rita on 21 September 2005.
Aircraft reconnaissance missions into hurricanes are typically conducted at either 850 or 700 hPa, with the 850-hPa flight level mostly used for weak depressions and tropical storms. We only use the observations at 700 hPa in this study. During the passage through the TCs, water droplets may adhere to the sensors mounted on the aircraft exterior, which regularly generates instrument wetting errors (Eastin et al., 2002). In addition, the observed temperature may be underestimated as a result of evaporative cooling on the thermistors. The correction method introduced by Zipser et al. (1981) is adopted to remove these errors. Eastin et al. (2002) concluded that this correction method could reduce the average errors in temperature, specific humidity, and equivalent potential temperature to 0.6°C, 0.5 g kg?1, and 2.7 K, respectively. About 9.7% of the observational samples used in this study are corrected (not shown), a relatively low proportion.
Because we will examine the azimuthal mean distributions of the kinematic and thermodynamic fields, we also need to ensure that the selected “good” radial legs are relatively evenly distributed in the main quadrants (Fig. 1b). Therefore, the azimuthal mean values of a hurricane for each flight mission are calculated by averaging all of the “good” radial legs at each radial point. Figure 1c shows the azimuthal mean structures of the temperature and tangential wind in a flight mission into Hurricane Rita (2005) on 21 September 2005. The maximum tangential wind and the RMW at the flight level at that time were about 65 m s?1 and 25 km, respectively, with an apparent warm-core structure and a temperature maximum of 28°C within the eye.
2
2.2. Intensity of TCs
We do not use the FLIGHT+ wind velocity to estimate the intensity of TCs in this study because the flight-level velocity is not routinely used to measure the intensity of TCs and the observations for the flight legs are insufficient to capture the maximum wind speed within the circulation of a TC. We use the intensity of TCs derived from the National Hurricane Center Best-Track dataset. The best-track data are available at standard synoptic times (0000, 0600, 1200, and 1800 UTC), but the average flight mission times are generally mismatched with the standard synoptic times. To obtain the intensity of TCs at the FLIGHT+ record times, we linearly interpolate the maximum sea-level wind velocity (Vmax) and the minimum sea-level pressure (Pmin) from the best-track data at two adjacent standard synoptic times to the corresponding average flight mission time. The interpolated intensity of the TC can be used to reasonably represent the intensity of a TC at the average flight mission time because the change in intensity between two adjacent standard synoptic times is generally not large.2
2.3. TCF calculation
Guo and Tan (2017) defined TCF as the ratio of the radial extent between the RMW and R17 to R17 at the surface. We focus on the TCF at 700 hPa based on the FLIGHT+ dataset. Previous studies have suggested that the wind speed of TCs at sea level is about 85% of the wind speed at the 700-hPa flight level (Shea and Gray, 1973; Powell, 1982; Jorgensen, 1984a; Powell et al., 2009). Here, the radius of the 20 m s?1 wind speed is applied to represent the outer boundary of the outer core wind skirt of TCs. The TCF at the flight level is thus formulated as:where RMW700 hPa is the mean RMW at 700 hPa in the “good” radial flight legs. Similarly,


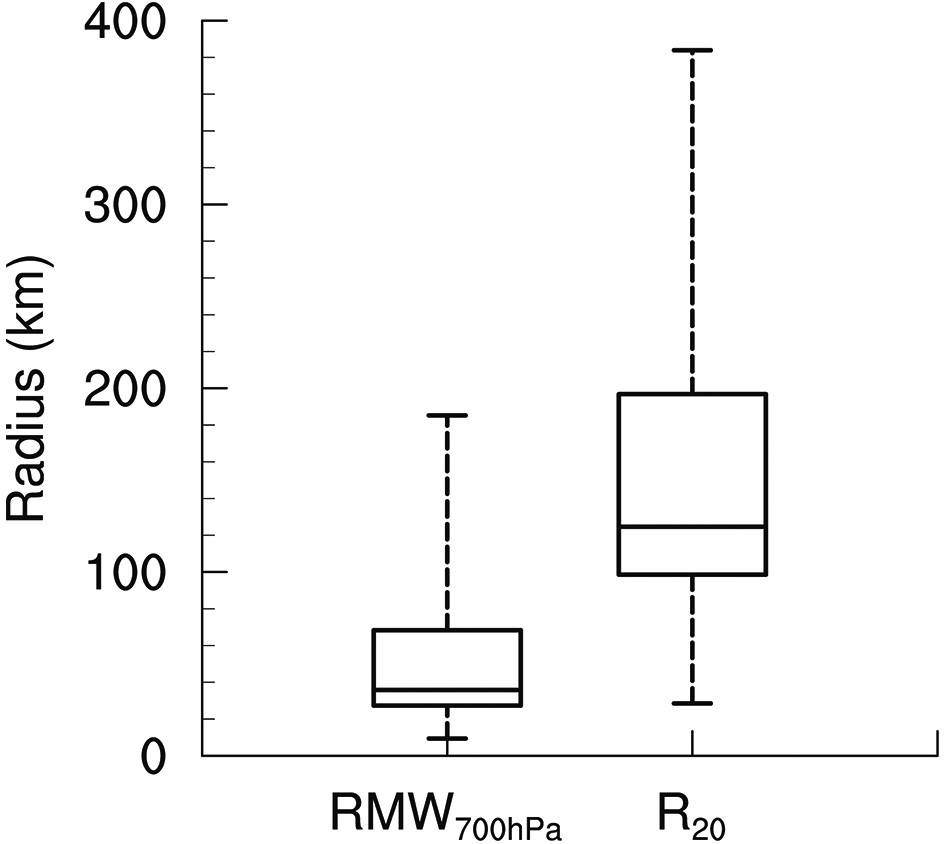 Figure2. Box-and-whisker plots of RMW700 hPa and
Following Guo and Tan (2017), we classify the flight-level TCF into four categories: FS1 (TCF ≤ 0.4); FS2 (0.4 < TCF ≤ 0.6); FS3 (0.6 < TCF ≤ 0.8); and FS4 (TCF > 0.8). The numbers of the flight missions satisfying the four TCF categories are 28, 50, 94, and 57, respectively.

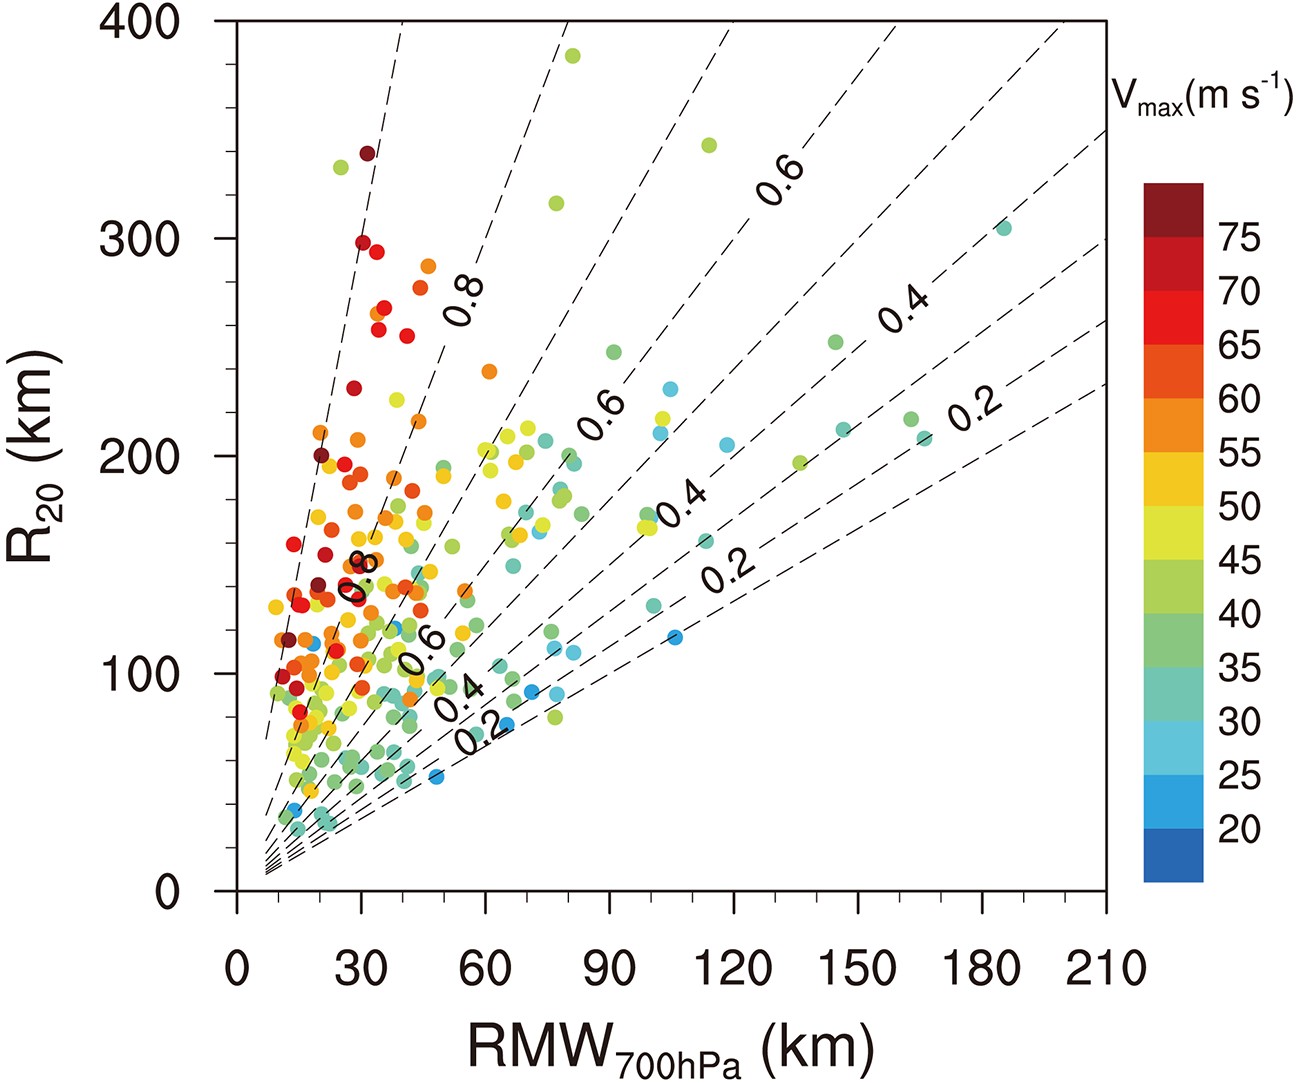 Figure3. Dependence of Vmax (colored dots; m s?1) on RMW700 hPa (km), R20 (km), and the TCF (dashed lines).
The scatter diagrams in Fig. 4 indicate that there is a nonlinear relationship between TCF and the intensity of a TC. We use a curve-fitting method to fit the relationship between TCF and the intensity of a TC. Power functions are found to express the relationship between TCF and Vmax and Pmin reasonably well. The red curve in Fig. 4a shows the best-fit result for the relationship between the flight-level TCF and Vmax, which is given by:
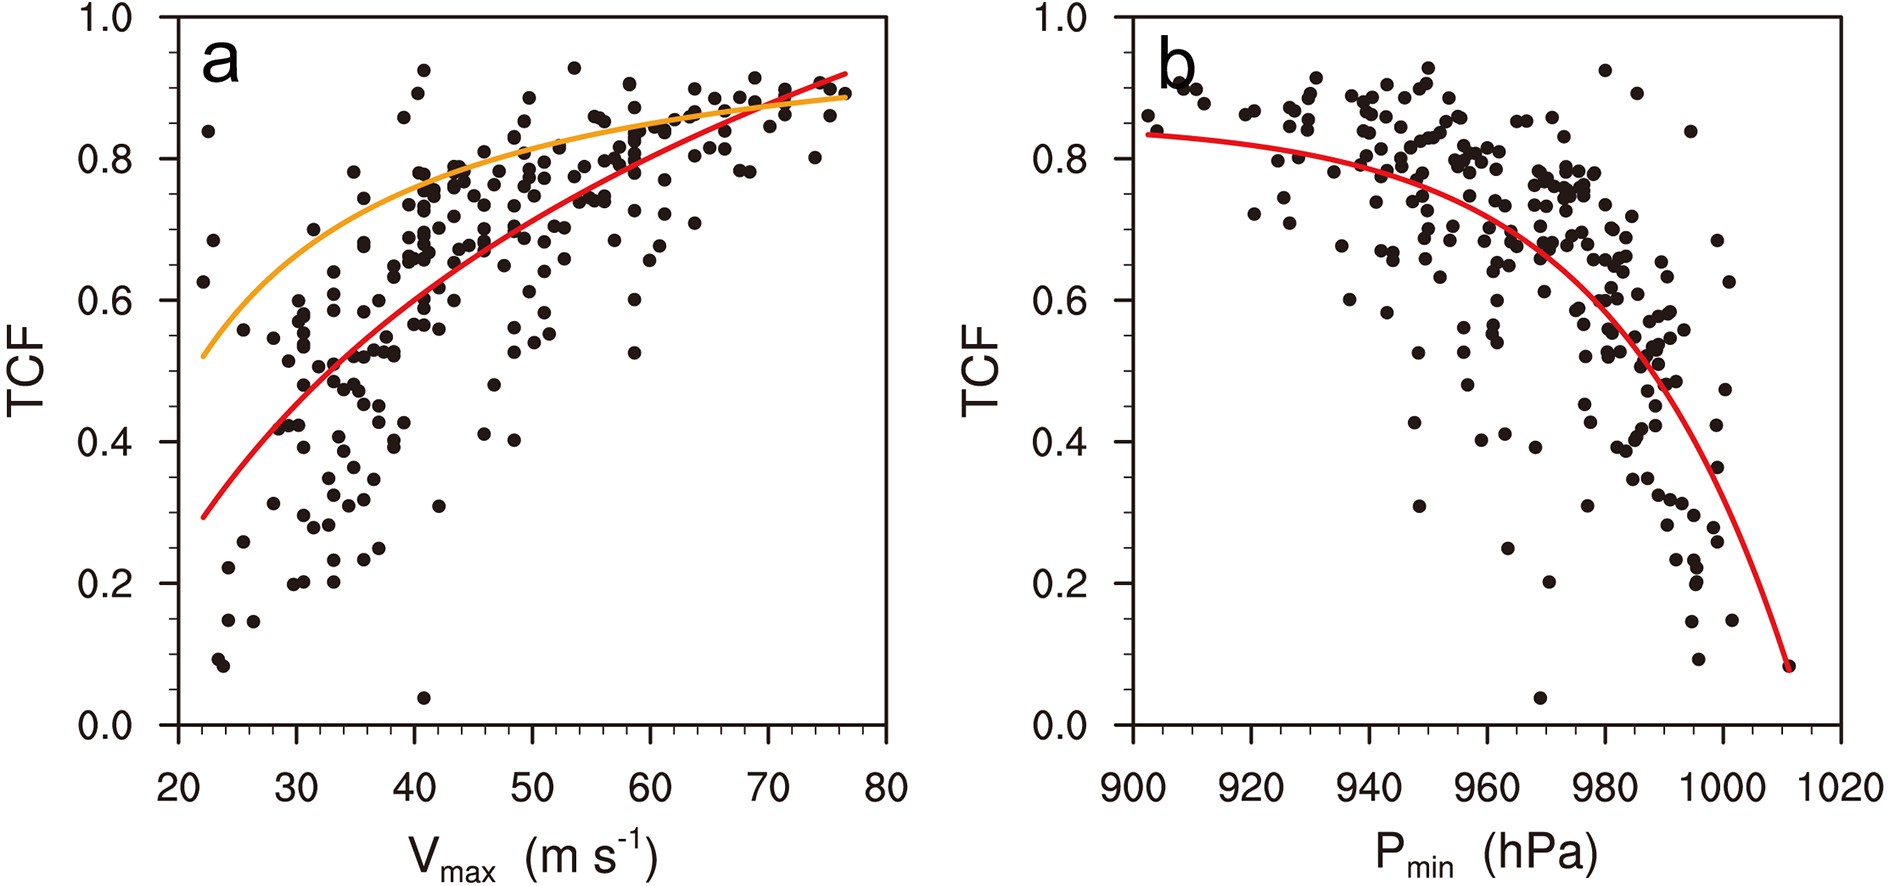 Figure4. (a) Scatter diagram of Vmax (m s?1) versus the TCF. The red curve shows the best-fit result for the relationship between the flight-level TCF and Vmax and the orange curve shows the best-fit result of Guo and Tan (2017). (b) Scatter diagram of Pmin (hPa) and the TCF. The red curve shows the best-fit result.
where

Figure 4b shows the relationship between the flight-level TCF and Pmin, which also suggests that TCF increases with increasing intensity of a TC. The relationship can be fitted with a power function as follows:
where

4.1. Kinematic characteristics
Figure 5a shows the relationships between the flight-level TCF and the difference in the tangential wind velocity at RMW700 hPa and


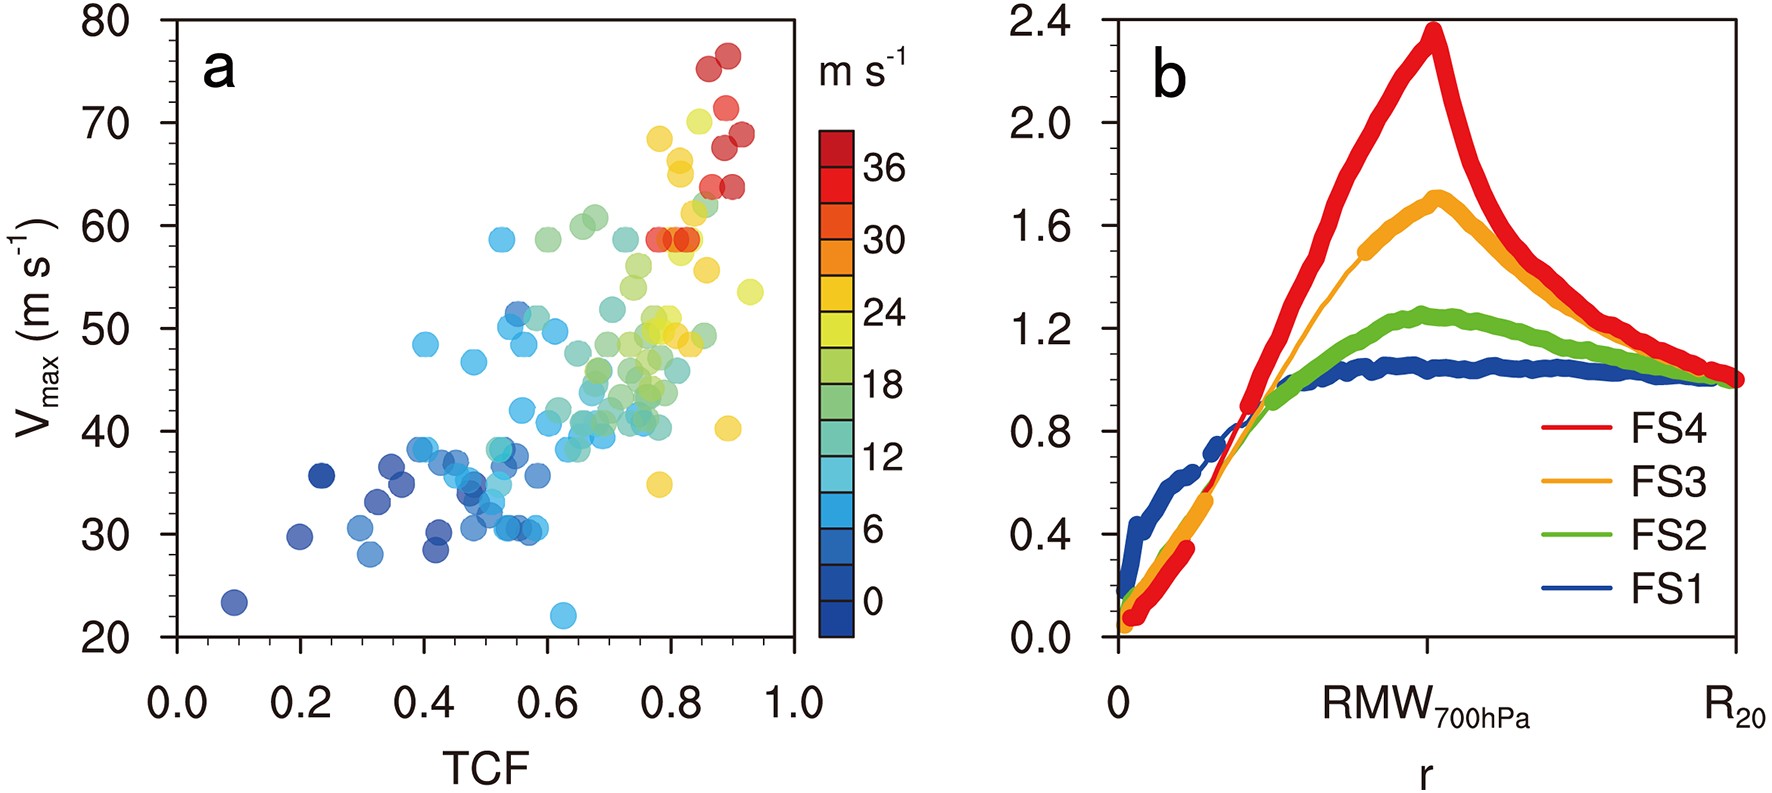 Figure5. (a) Dependence of the difference in the flight-level tangential wind (m s?1) at RMW700 hPa and R20 on the TCF and Vmax. (b) Composites of the normalized flight-level tangential wind corresponding to different categories of TCF. The bold lines indicate that the composite results are statistically significant at the 95% confidence level and the radius is normalized by the RMW700 hPa.
Figure 5b shows the composites of the flight-level tangential wind velocity normalized by the tangential wind at R20 for different categories of TCF. Note that the radius is also normalized by RMW700 hPa. The normalized tangential wind of FS1 hurricanes is statistically significantly stronger than that of FS2, FS3, and FS4 hurricanes within a distance of one-half the RMW700 hPa from the storm center. This possibly reflects the presence of hub convection rather than a visible eye near the center of the relatively weak TCs with a small TCF. The tangential wind at RMW700 hPa increases markedly with an increase in TCF, consistent with the relationship between the TC intensity and the TCF.
Figure 6a shows the relationship between the flight-level TCF and the relative vorticity difference at RMW700 hPa and


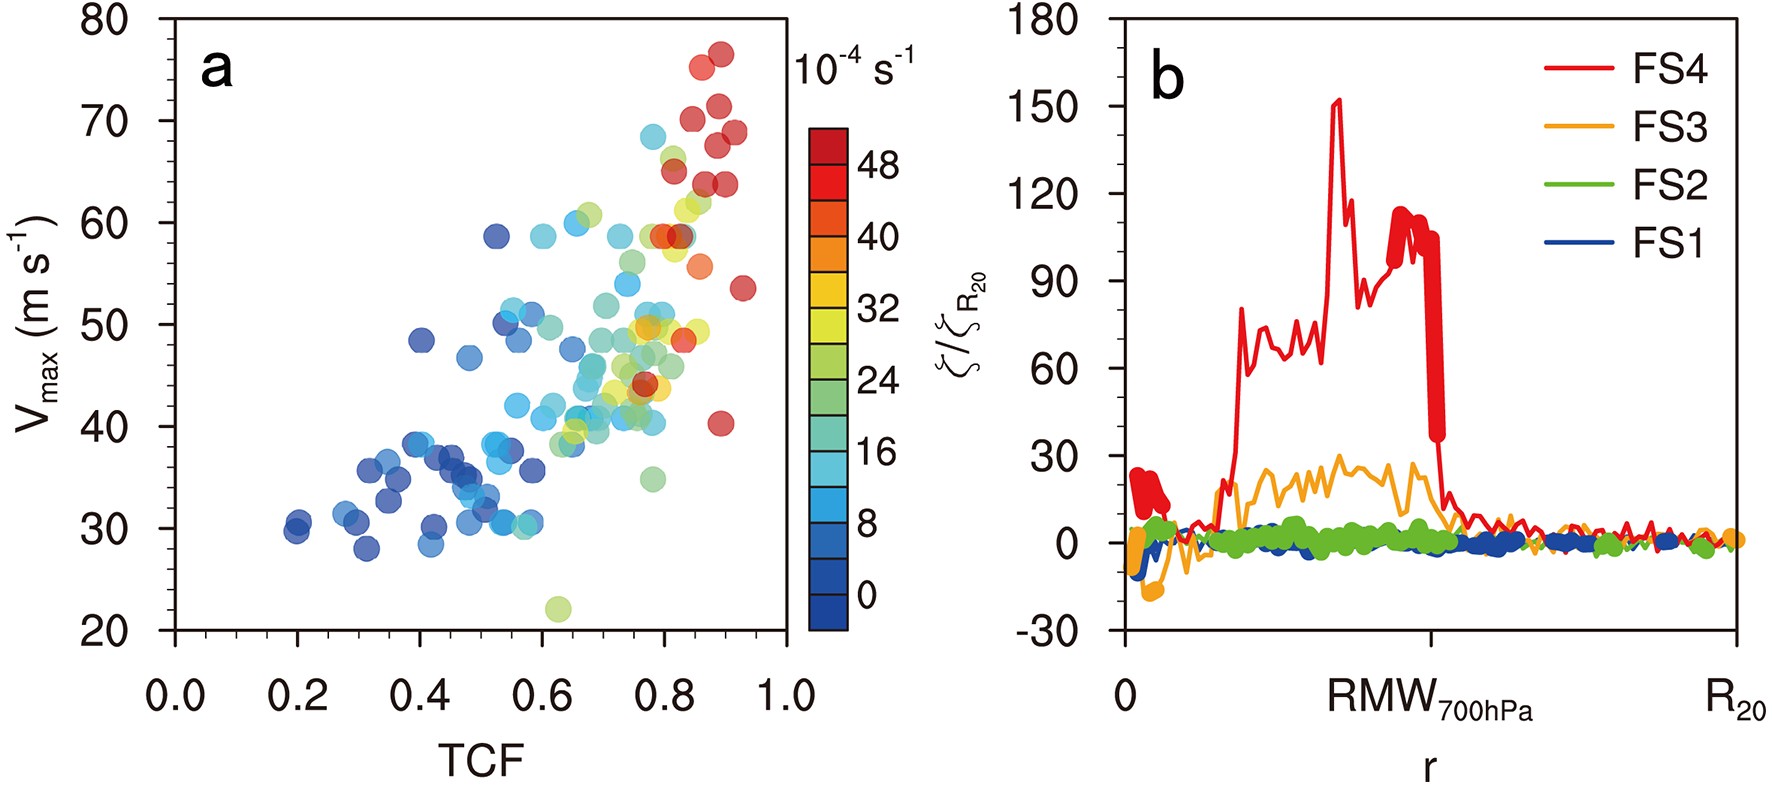 Figure6. (a) Dependence of the difference in the flight-level vertical vorticity (10?4 s?1) at RMW700 hPa and R20 on the TCF and Vmax. (b) Composites of the normalized flight-level vertical vorticity corresponding to different categories of TCF. The bold lines indicate that the composite results are statistically significant at the 95% confidence level and the radius is normalized by the RMW700 hPa.
The difference in absolute angular momentum between RMW700 hPa and


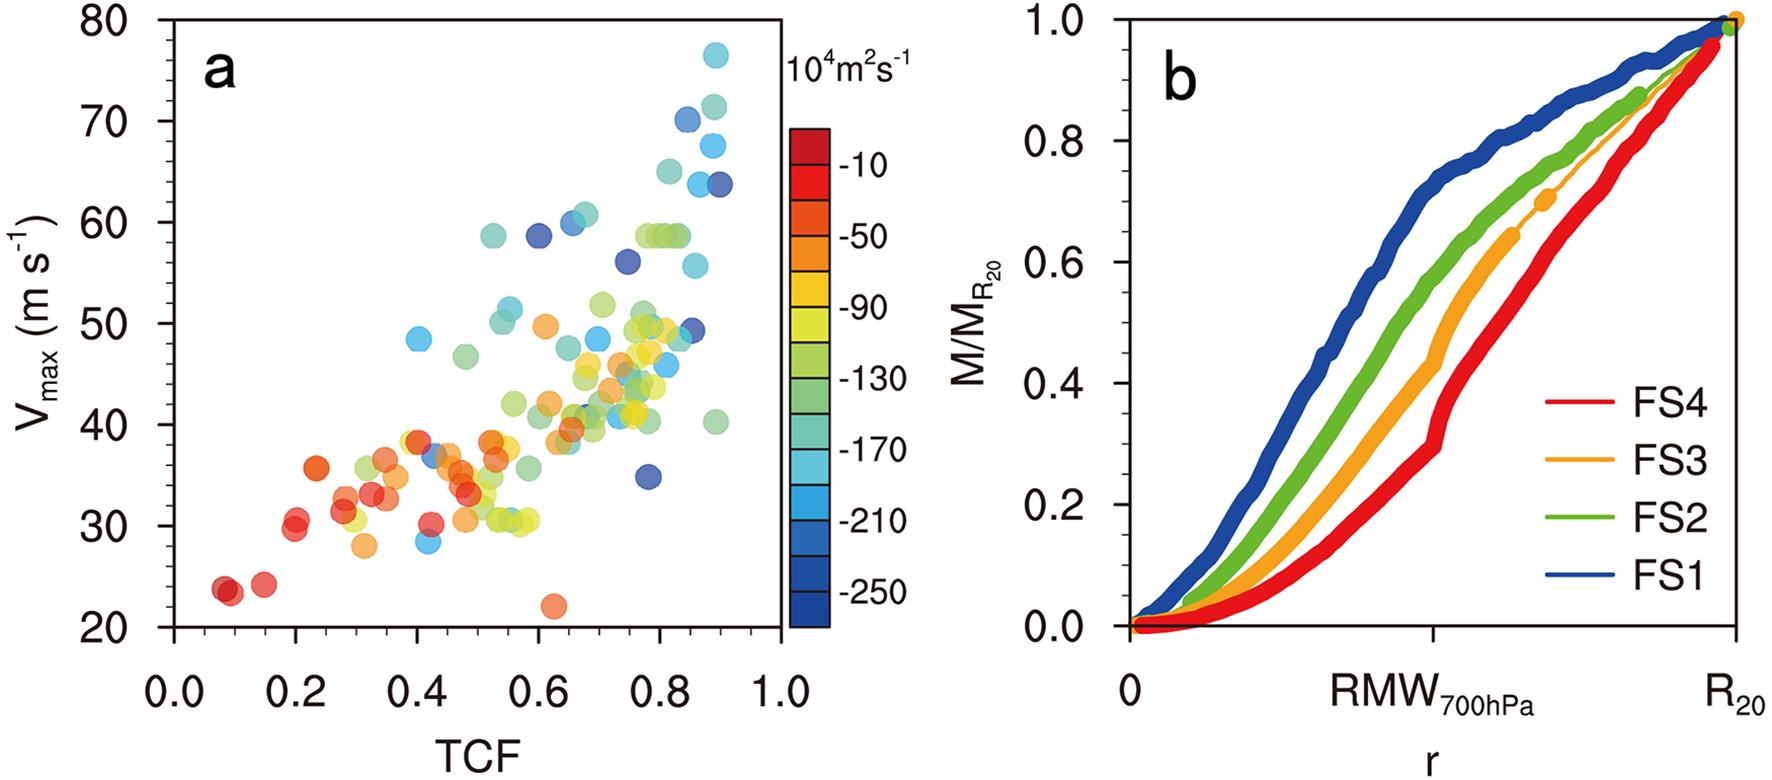 Figure7. (a) Dependence of the difference in the flight-level absolute angular momentum (104 m2 s?1) at RMW700 hPa and
Radial gradients in the potential vorticity play an essential part in the formation of vortex Rossby waves (Montgomery and Kallenbach, 1997). The activity of vortex Rossby waves has striking effects on the intensity of TCs and changes in their structure (Wang, 2002a, b; Li and Wang, 2012a; Li et al., 2014, 2017). The radial extent of the potential vorticity skirt determines the area in which vortex Rossby waves are active. Because the TCF depends on the outer core skirt, an interesting question is whether there is a relationship between the TCF and the region in which vortex Rossby waves form and propagate radially outward. Shapiro and Montgomery (1993) defined an effective beta value [


where


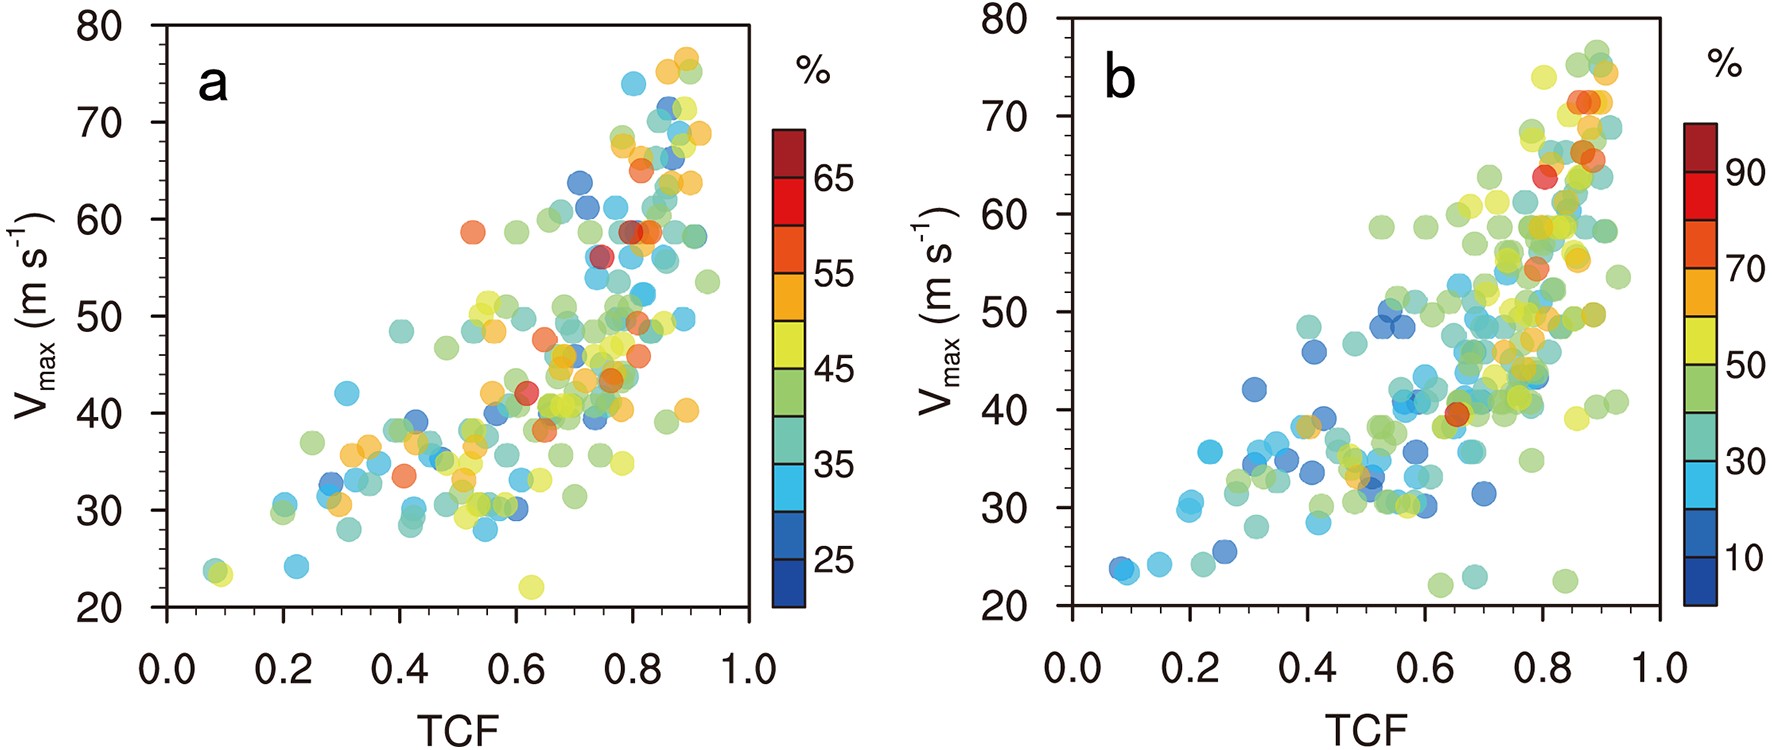 Figure8. Dependence of the proportions of (a) the region of positive quasi-effective beta and (b) the rapid filamentation zone in the region between RMW700 hPa and R20 on the TCF and Vmax.
There is a pronounced deformative region immediately outside the eyewall in the inner core (Rozoff et al., 2006; Wang, 2008; Li and Wang, 2012b). Rozoff et al. (2006) defined the filamentation time (

Rozoff et al. (2006) showed that strong horizontal deformation inhibits deep cellular convection formation, thus forming the moat in the inner core of TCs. The region with

Figure 8b suggests that the proportion of the rapid filamentation zone in the region between RMW700 hPa and

A radius of three or four times the RMW is roughly defined in many studies as the outer boundary of the inner core (Wang, 2008; Li and Wang, 2012a, b; Li et al., 2017), within which inner rainbands are usually observed. However, our result indicates that the relative extent of the rapid filamentation zone varies with the TCF. Therefore defining a fixed radius as the outer boundary of the inner core of a TC with a varying TCF remains arguable. In addition, we suggest that when the RMW is decreasing and the TCF is increasing in intensifying TCs, the rapid filamentation zone tends to broaden. This broadening of the rapid filamentation zone means that more inner rainbands will develop in this region, and more diabatic heating induced by the inner rainbands will be produced. This scenario can contribute to further intensification of the TC (Li et al., 2014), which might be one of the reasons why more intense TCs tend to have a larger TCF (Figs. 3 and 4).
2
4.2. Thermodynamic characteristics
Figure 9a shows that the temperature differences between RMW700 hPa and R20 are statistically significantly correlated with the TCF with a partial correlation coefficient of up to 0.53 at the 95% confidence level. The increase in the difference in temperature with increasing TCF again indicates that more active eyewall convection in more intense TCs with a larger TCF tends to produce stronger diabatic heating. This is also seen in Fig. 9b, which shows higher normalized temperatures near RMW for FS3 and FS4 hurricanes. Figure 9b shows temperature maxima near the center of the TC for FS1, FS2, and FS3 hurricanes, indicating the existence of a warm-core structure. TCs with a larger TCF have a more significant warm core. However, the composite temperature maximum of FS4 hurricanes occurs just inward of the RMW rather than near the center of the TC (Fig. 9b), with the inner core temperature characterized by a warm-ring structure. This feature seems to be consistent with the results of Schubert et al. (2007). They documented that remarkable subsidence tends to occur immediately on the inner side of the eyewall of intense TCs rather than at the center of the eye as a result of the large inertial stability, resulting in significant adiabatic heating.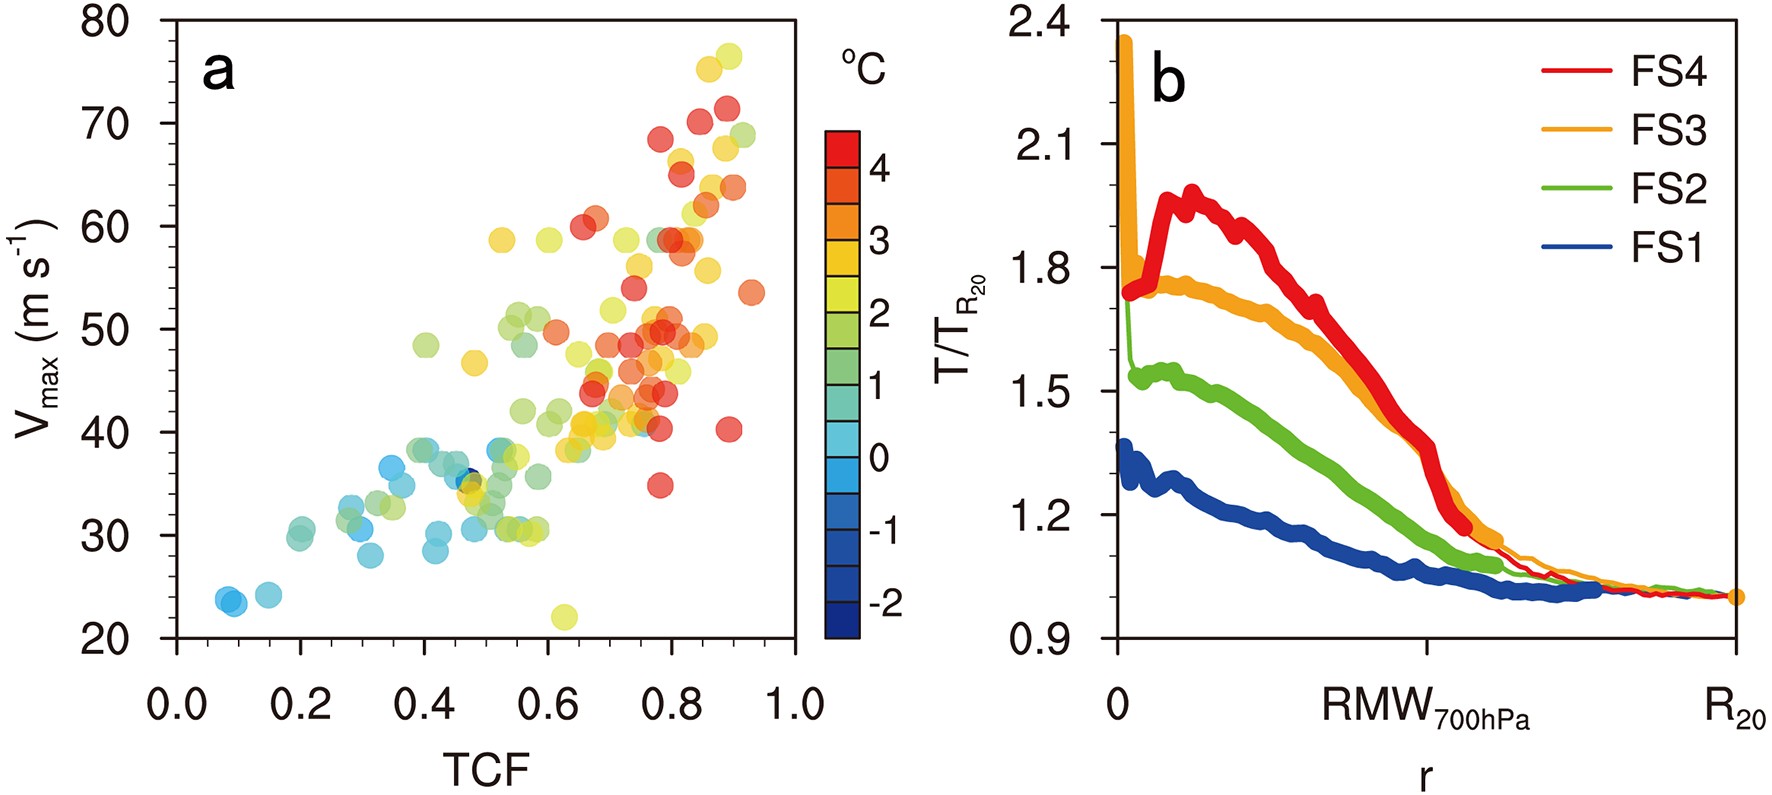 Figure9. (a) Dependence of the difference in the flight-level temperature (°C) at RMW700 hPa and
The humidity differences between RMW700 hPa and

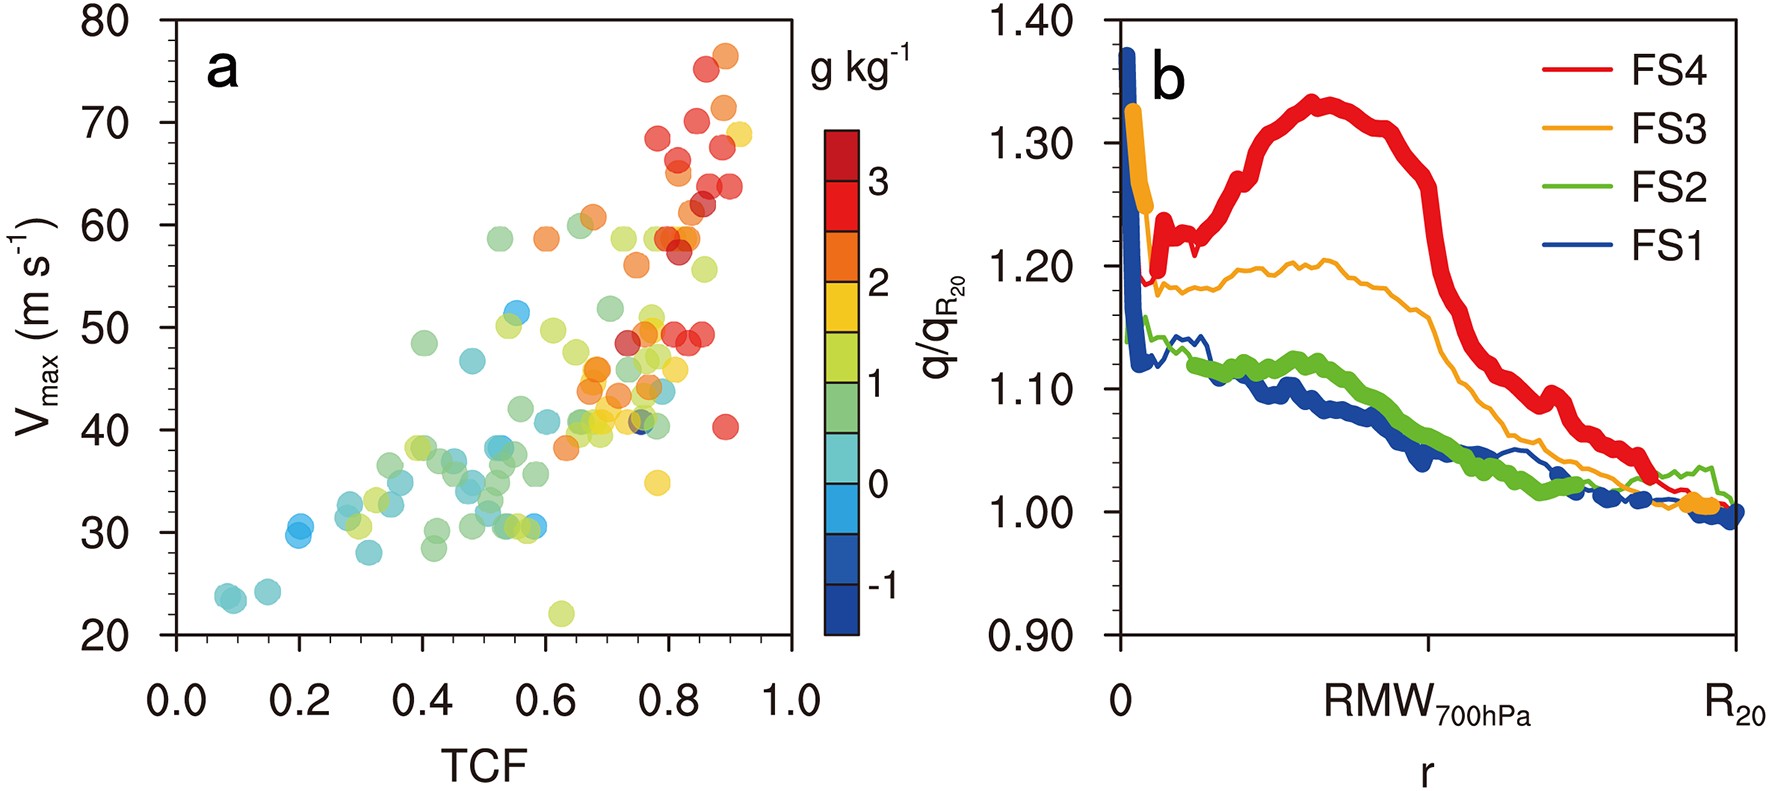 Figure10. (a) Dependence of the difference in the flight-level specific humidity (g kg?1) at RMW700 hPa and
Figure 11a shows that the differences in the equivalent potential temperature (θe) between RMW700 hPa and

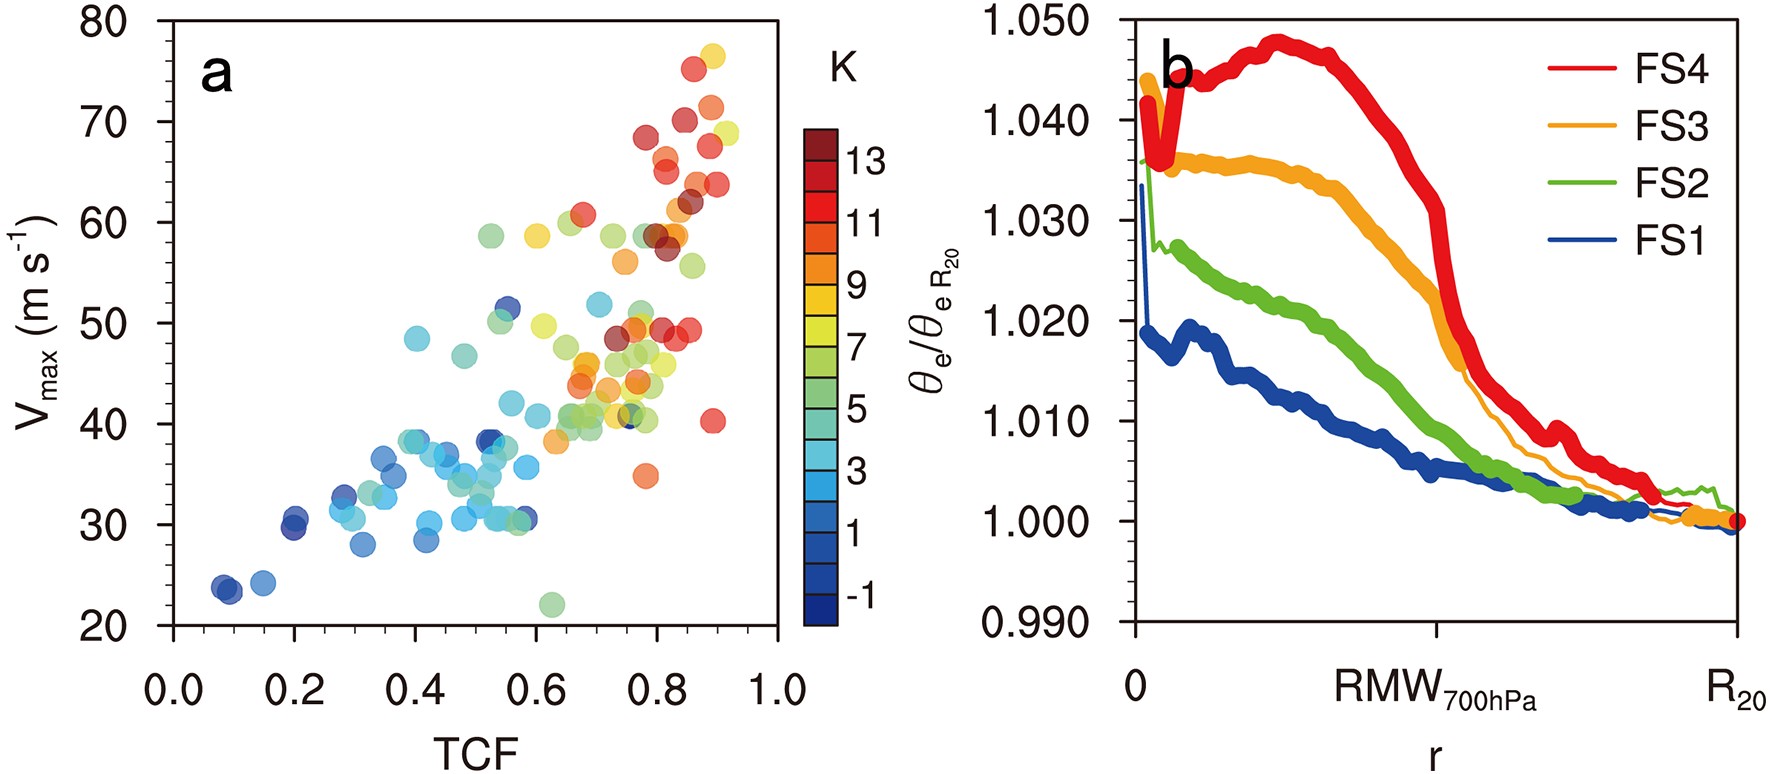 Figure11. (a) Dependence of the difference in the flight-level θe (K) at RMW700 hPa and
Similar to the results in Guo and Tan (2017), we found a strong positive correlation between the flight-level TCF and the intensity of TCs. In particular, the flight-level TCF of most TCs with Vmax > 50 m s?1 exceeds 0.6. Compared to Guo and Tan (2017), however, the flight-level TCF tends to increase much more rapidly than the near-surface TCF with an increasing Vmax.
The kinematic and thermodynamic features associated with the TCs with different flight-level TCF values were also investigated. FS3 and FS4 hurricanes have a ring-like vorticity structure. No significant correlation is found between the flight-level TCF and the comparative extent of the (potential) vorticity-skirt region occupied in the outer core skirt. The proportion of the rapid filamentation zone in the outer core skirt increases with increasing flight-level TCF, indicating that inner rainbands may develop in more extensive regions for TCs with a larger TCF. FS1, FS2, and FS3 hurricanes show a more significant inner warm core, whereas FS4 hurricanes are characterized by a warm-ring structure. The θe differences between RMW700 hPa and

Based on in situ, flight-level observations from aircraft reconnaissance, we show that the TCF can be used to describe the relationship between the intensity of a TC and the entire structure of the wind field. There are several shortcomings regarding the flight-level TCF discussed here. For instance, the TCF calculation is based on observations from several radial flight legs, which may lead to observational undersampling of the TC wind fields. In addition, TCF cannot represent the azimuthally asymmetric wind field structures of TCs in complex environments.
Acknowledgements. We thank two anonymous reviewers for their reviews. We are greatly grateful to Dr. Jonathan L. VIGH for providing the Extended Flight Level Dataset (FLIGHT+) for tropical cyclones. The FLIGHT+ was created by the Research Applications Laboratory at the National Center for Atmospheric Research (NCAR) from data provided by the NOAA Hurricane Research Division of AOML and the U.S. Air Force Reserve. This work was jointly supported by the National Key Research and Development Program of China under Grant 2017YFC1501601, the Key Program of the Ministry of Science and Technology of China under Grant 2017YFE0107700, and the National Natural Science Foundation of China under Grants 41875054, 41730961, 41730960, and 41775065.
