HTML
--> --> -->While some researchers have worked on modeling TC genesis with convection permitting physical schemes (e.g., Davis et al., 2011; Xue et al., 2013), using fine-resolution coupled models that can represent the processes of TC formation and intensification (e.g. Halliwell et al., 2008; Sandery et al., 2010; Doyle et al., 2014) is a key step in improving and extending weather forecasts toward sub-seasonal scales, and facilitating seamless weather?climate research (e.g., Wang and Rui, 1990; Kim et al., 2013; Zhang et al., 2015; Alley, 2019). However, most previous high-resolution model studies on hurricanes used atmosphere-only models. Also, limited computing resources and knowledge of detailed local physics mean that implementing such a numerical system in a global-scale coupled model is currently unlikely or will have limited application. Dynamical downscaling is an efficient approach that has often been used (e.g., Rockel et al., 2008; Hostetler et al., 2011; Gula and Peltier, 2012; Komurcu et al., 2018), especially for a coupled model system, but most dynamical downscaling research has focused on model simulations. Here, we use three sets of high-resolution regional coupled models (RCMs): a 27-km atmosphere coupled with a 9-km ocean (27v9), a 9-km atmosphere coupled with a 9-km ocean (9v9), and a 9-km atmosphere coupled with a 3-km ocean (9v3), combined with dynamically downscaled coupled data assimilation (CDA) initialization to study the predictability of TC genesis.
CDA uses coupled model dynamics and physics to incorporate atmosphere and ocean observational information to pursue balanced and coherent analysis and prediction initialization with a coupled model (Zhang et al, 2007; Sugiura et al., 2008). Starting from climate studies (e.g., Saha et al, 2010; Zhang et al., 2014; Laloyaux et al., 2018), CDA has been applied to initialization of TC statistics and its impact on climate prediction in terms of consistent incorporation of atmospheric and oceanic observations with proper air?sea interactions (Zhang et al., 2014, 2015). To study extended-range predictability and facilitate seamless weather?climate prediction, it is expected that coupled modeling and CDA shall simultaneously resolve higher resolutions and local meso- and small-scale physical processes in increasingly greater detail to assess the impacts on the local living environment and the environment’s vulnerability.
The models used in this study cover a large domain—the whole Asia?Pacific (AP; 16°S?63°N, 38°?178°E) region that accounts for ~24% of the global surface, and hence are able to apply a minimized boundary effect in simulation and prediction for longer time scales (which will be examined in follow-up studies). The dynamically downscaled CDA initialization incorporates background information from coarse-grid global model predictions and detailed local observations into RCMs in a balanced and coherent manner (Zhang et al., 2007). Using this multi-resolution state-of-the-art system that is cloud-permitting, eddy-resolving and able to resolve meso- and small-scale air?sea interactions, in this study we first try to detect the predictability of TC genesis, i.e., the model ability to foretell the TC formation. Inspired by previous studies of TC predictability (e.g., Sippel and Zhang, 2008; Sippel, 2008), here we specifically address three aspects: the onset time, central pressure, and maximum wind speed. Moreover, throughout this study, we try to provide insights on (1) the time scale that is plausible for foretelling West Pacific TC formation in advance, and the source of predictability; and (2) the impacts of coupled model resolution on forecasts of TC genesis, intensity and track, and the implications for sub-seasonal predictions that these impacts bring. Although completely addressing these problems, which are important in understanding issues of regional climate and extended-range forecasts, requires plenty of further study, this paper attempts to open the door for it.
The paper is organized as follows: Following this introduction, section 2 describes the methods, including the three sets of RCMs with different resolutions and the CDA scheme. Section 3 presents the analysis results, including a statistical analysis of a typhoon season and detailed strong-typhoon case studies, as well as some insights into the impact of model resolution on typhoon simulation and prediction. Finally, a summary and discussion are provided in section 4.
The model region of the coupled system covers the AP region (16°S?63°N, 38°?178°E), which includes the Northwest Pacific and the North Indian Ocean. The three coupled model versions with different resolutions are referred to as 27v9, 9v9 and 9v3. The 27v9 and 9v9 WRF and ROMS have 28 and 33 vertical layers, respectively, and the ROMS maximum and minimum water depths are 5300 and 10 m, respectively. The time step for both WRF and ROMS is 60 s, and the coupled time step is 600 s. The 9v3 WRF has the same configuration as the 27v9 and 9v9 WRF (28 vertical layers, revised MM5 Monin?Obukhov surface flux scheme), but with 40 vertical layers and a maximum water depth of 5760 m, and the coupled time step is 600 s, too.
Both the 27v9 and 9v3 coupled models are initialized from the Climate Forecast System Version 2 (CFSv2) reanalysis (Saha et al., 2014) at 0000 UTC 1 January 2016 and spun up for two years with the CFSv2 background boundary conditions, while the 9v9 coupled model serves as a case test tool. A detailed model performance analysis is presented in a companion study, based on simulation results for 2017 (Li et al., 2020①). Here, we only describe aspects relevant to the present study. Both the 27v9 and 9v3 coupled models simulate the intensity and position of midlatitude storm tracks in the area reasonably well. The higher-resolution 9v3 model simulates stronger storm tracks that are more similar to the reanalysis data, although with slightly weaker zonal mean U velocities in the upper troposphere. Both models simulate more TCs than observed and simulate super-strong typhoons poorly (both fail to simulate super-strong typhoons). However, the 9v3 simulations are more accurate. Although the Kuroshio path is reasonably well predicted in both models, the variability in both intensity and position of Kuroshio is larger than that observed in the 9v3 but smaller in the 27v9 simulation. Both the 27v9 and 9v3 coupled models simulate the mesoscale atmosphere?ocean coupling processes well, but simulations from the 9v3 higher-resolution model are more accurate and more detailed as expected. For example, both the 27v9 and 9v3 coupled models simulate the mesoscale atmosphere?ocean coupling processes well, but 9v3’s simulations show more details closer to observations. We can see that the normal velocities of currents across the ASUKA line (an observation section along the TOPEX/POSEIDON orbit south of Shikoku) simulated by the 9v3 model is much better than that of the 27v9 model, characterizing the distribution of the mesoscale eddies and fronts along the Kuroshio Extension region.
The AP-RCMs are initialized using a weakly CDA approach—i.e., within the coupled model framework, the atmosphere and ocean components apply their own data assimilation procedures. After the 2-year spin up of the coupled models, the CDA begins on 0000 UTC 1 January 2018, producing the first set of coupled initial conditions of model forecasts. The atmosphere (ocean) state is then constrained by cycling through the real-time operational atmosphere (ocean) data assimilation [ADA (ODA)] with 6-h (daily) updated observations. The real-time operational forecasts obtain the initial conditions from the corresponding ADA and ODA processes. The real-time operational forecasts also use the atmospheric (oceanic) boundary conditions interpolated from the CFSv2 operational forecast data available every 6 h. The WRF data assimilation (WRF3D-Var; Barker et al., 2004) then also incorporates the local atmospheric observations (Fig. 1) and the data from the Global Telecommunication System using the standard three-dimensional variational (3D-Var) algorithm (Courtier et al., 1994). The assimilation process that updates the atmospheric model states and affects the whole coupled system through flux exchanges at a 6-h assimilation frequency greatly improves the model fit to observations (~35% error reduction and ~40% correlation enhancement) in the 27-km and 9-km WRF models (Fig. 2). The modeled ocean temperature and salinity (TS) are updated daily in two steps. First, the TS profiles are vertically adjusted in each model column by sea surface height (SSH) observations (AVISO, Advanced Very High Resolution Radiometer, from NCDC/NOAA). We designed an SSH filter to improve the model performance of the ocean mesoscale eddies and correct the propagation phase of the midlatitude Rossby wave. The filter uses observed SSH anomalies to constrain the simulated sea surface dynamic height anomaly. In each model grid cell where an SSH anomaly observation exists, the SSH filter will optimize the TS profile by a cost function. The second step is a multiscale 3D-Var (M3D-Var) analysis process that assimilates in-situ TS profile data, which first works horizontally, then loops over the vertical levels. M3D-Var is a multi-scale 3D-Var approach, and we applied seven space scale levels in our forecasting system. This method is partially inherited from the work of Wu et al. (2014). M3D-Var assimilates SST observations and TS profile observations into the initial condition. The SST is from the Operational Sea Surface Temperature and Sea Ice Analysis dataset (e.g., Donlon et al., 2012), downloaded through the Copernicus Marine Environment Monitoring Service. The TS profiles were downloaded every day from the Coriolis GDAC FTP site (
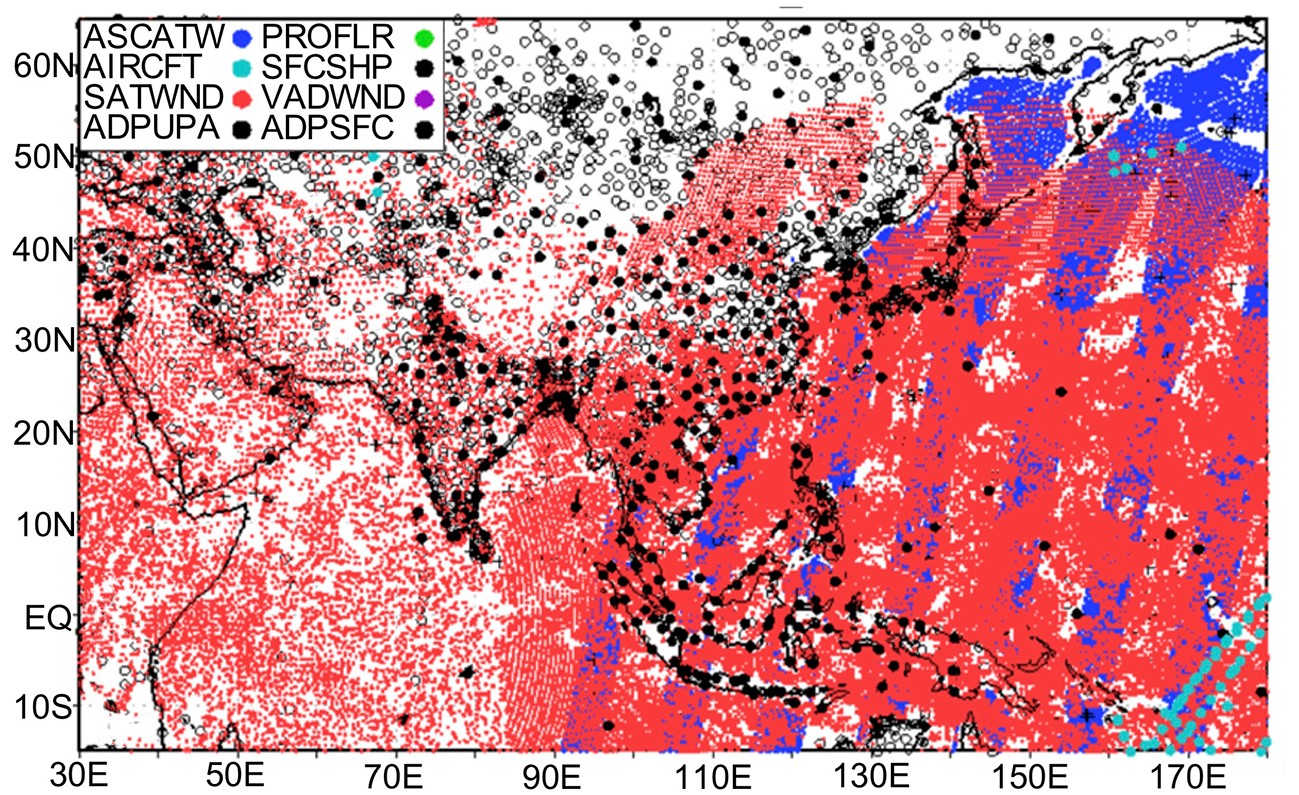 Figure1. Example of the distribution of various local atmospheric observations assimilated into the atmospheric component of the coupled model prediction system.
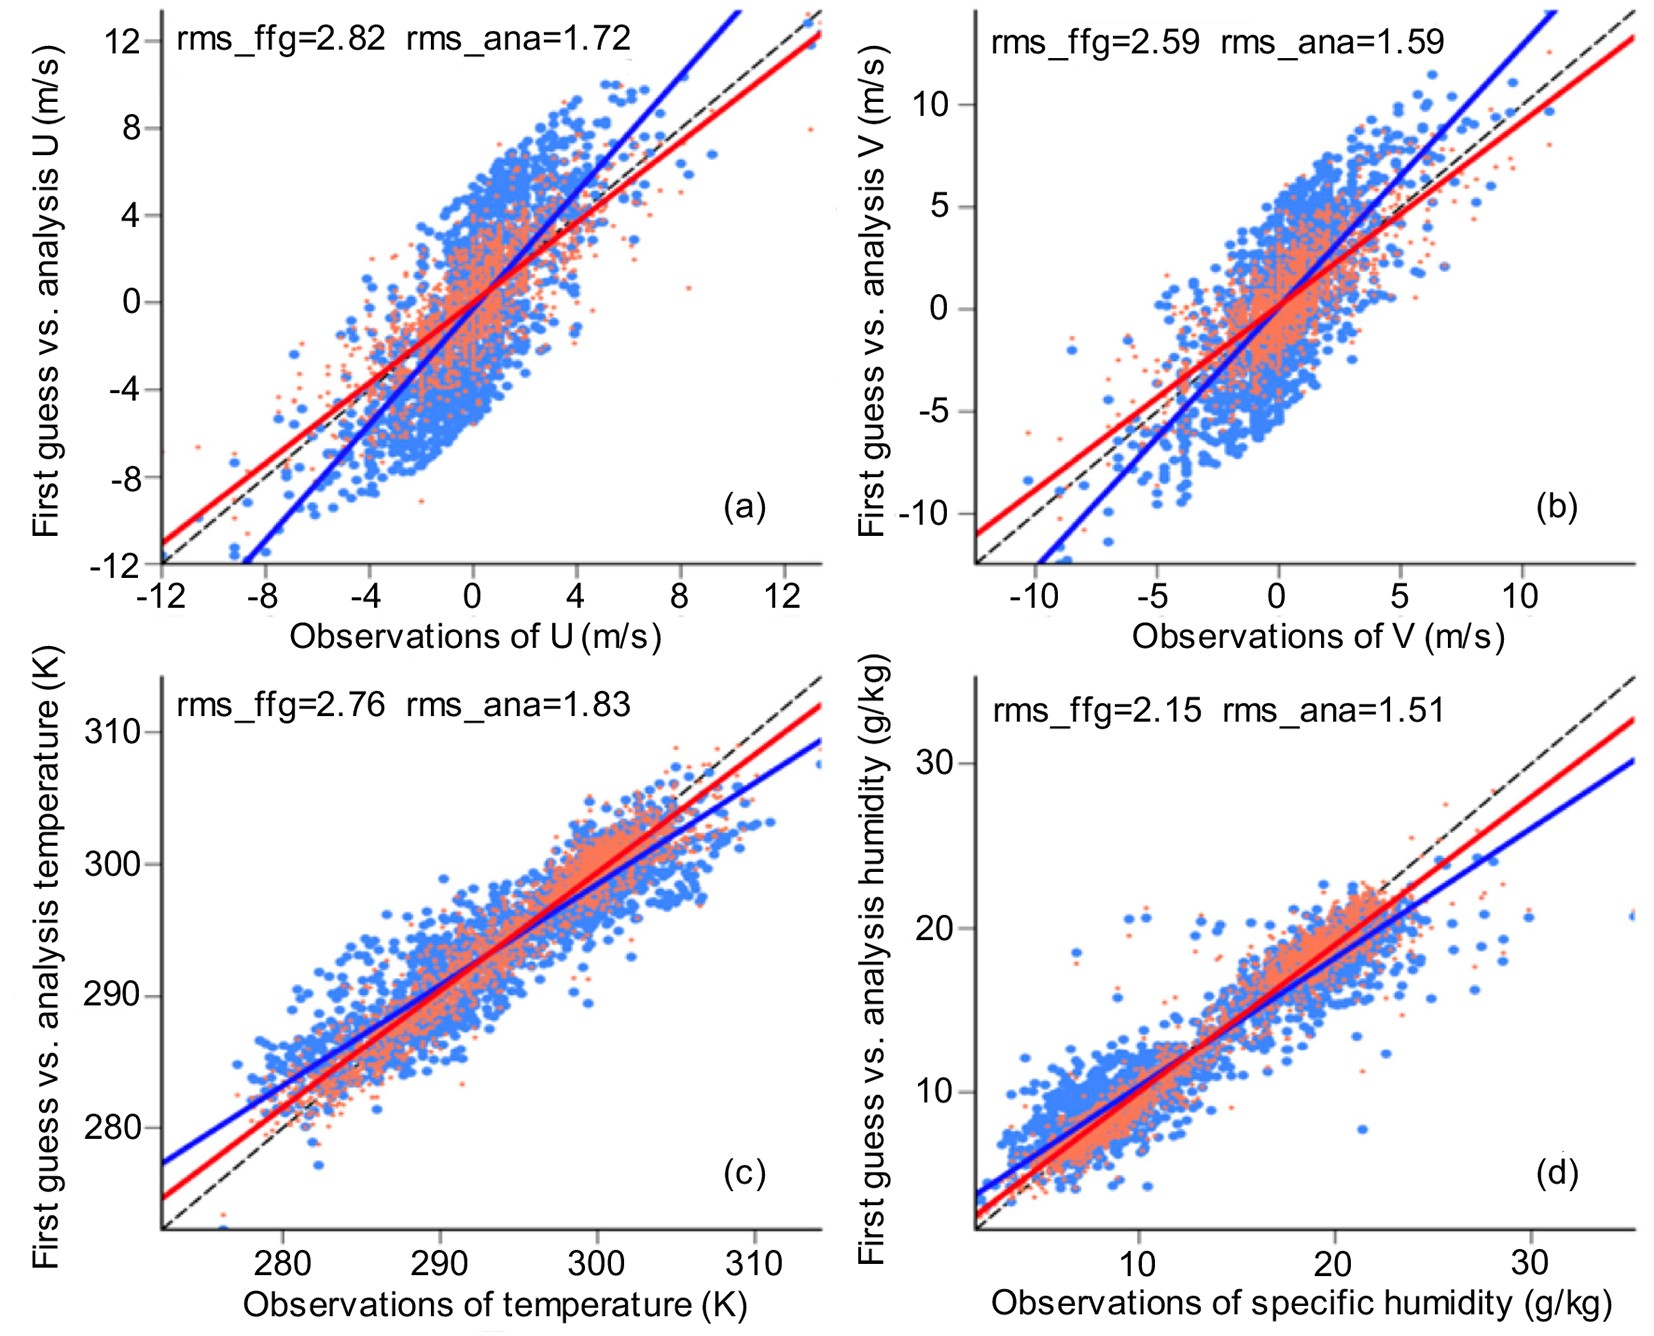 Figure2. Improved fit achieved by analysis of the atmosphere assimilation at 0000 UTC 16 August 2018, for (a) U-component wind (units: m s?1), (b) V-component wind (units: m s?1), (c) temperature (units: K), and (d) specific humidity (units: g kg?1) of ADPSFC shown in Fig. 1. The blue (red) coloring represents the distribution before (after) the analysis.
 Figure3. Example of the reduction in ocean initial condition errors and the improvement in SST forecasts in the 27v9 system obtained using the ODA in the RCP system, indicated by the SST error for (a) CFSv2 and (b) ODA with respect to the AVHRR observations; and the time series of (c) domain-averaged forecast SSTs and (d) domain standard deviation (std) of forecast SSTs. In panels (c) and (d), the black, red and blue lines represent the results for ODA, CFSv2 and AVHRR observations, respectively. Several ODA-initialized coupled forecasts are shown. Numbers represent the date (e.g., 171015 represents 15 October 2017) in panels (c) and (d).
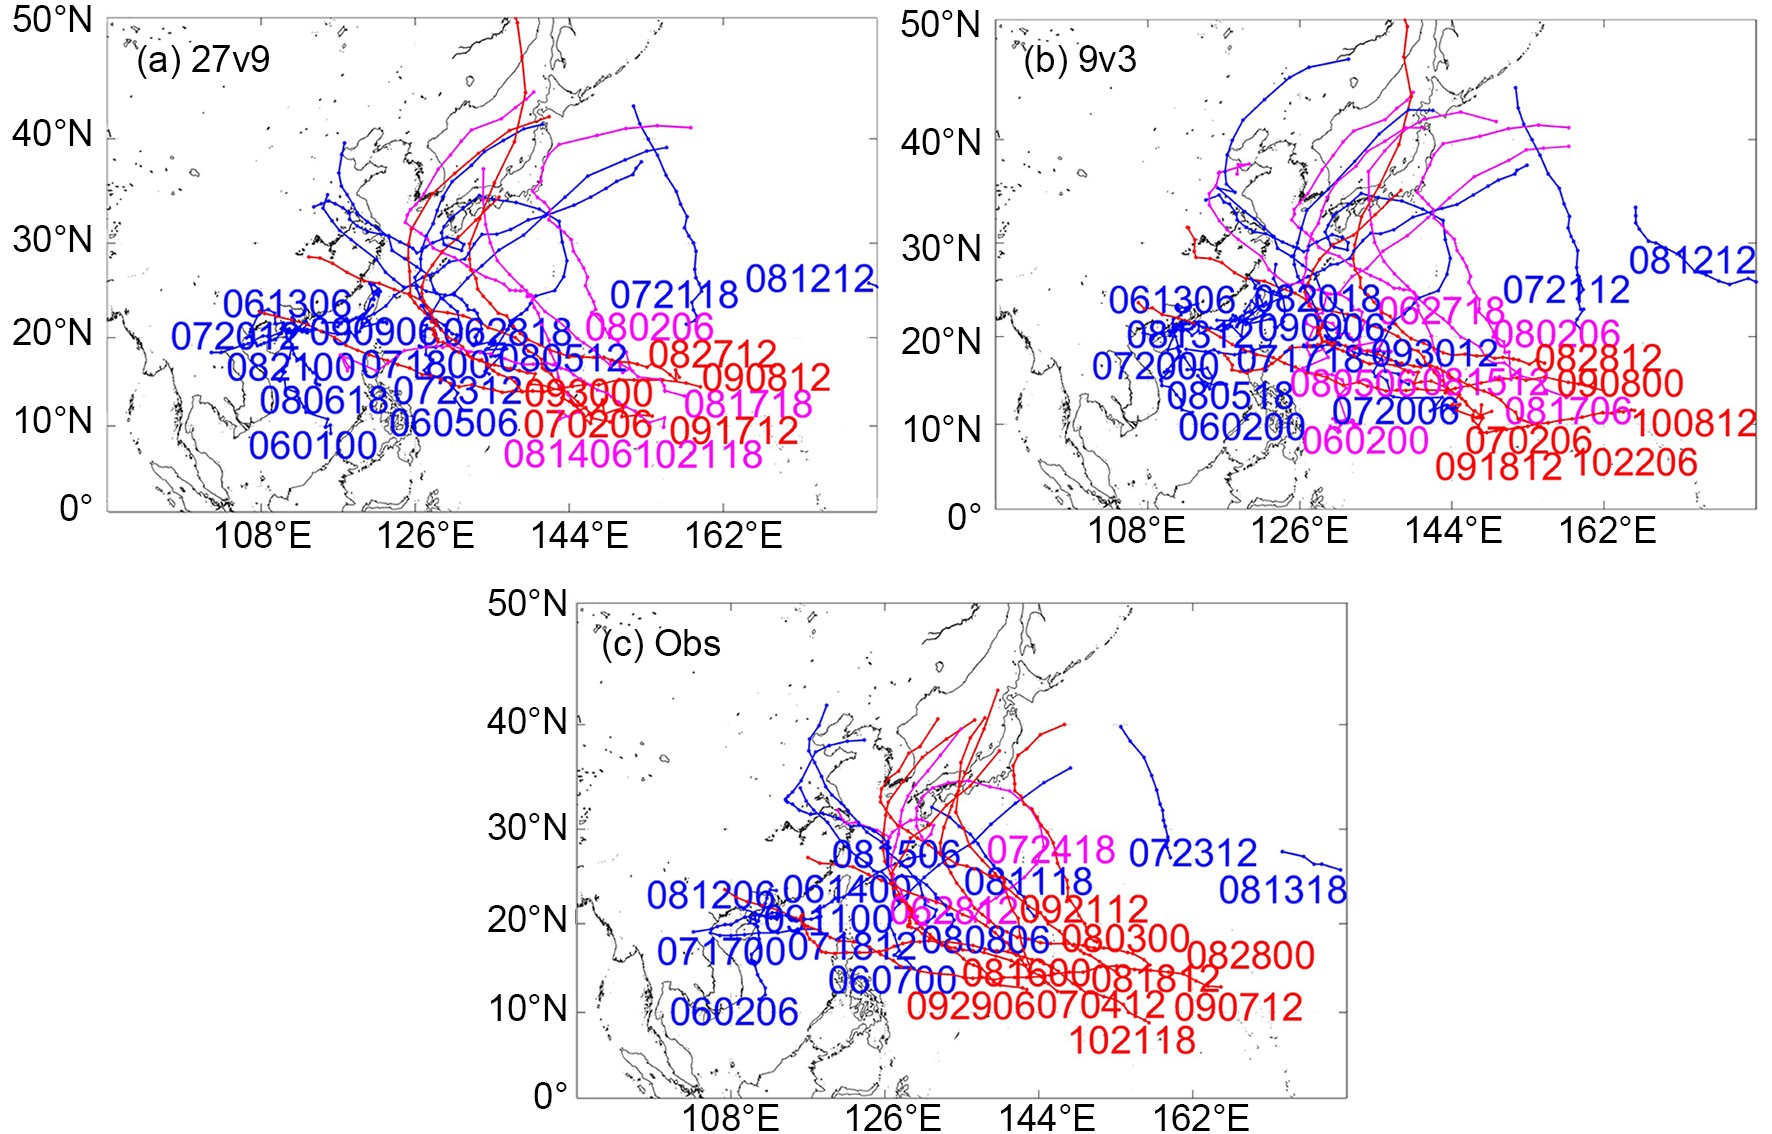 Figure4. Distribution of TC tracks in the 2018 TC season (1 May to 31 October) identified in (a) initial conditions of the 27v9 AP-RCP system (count: 22; 7 TCs > category-3 in red) and (b) satellite observations (count: 23; 8 TCs > category-3 in red). Observed TCs are from IBTrACS (Knapp et al., 2010; Kruk et al., 2010). The algorithm for detecting and tracking the model storms follows the approach of Vitart et al. (1997) and Zhao et al. (2009). The IBTrACS algorithm used in this study first identifies a low-pressure center that is a local minimum SLP within a 400-km radius, co-located with a local maximum of 850 hPa and 700 hPa relative vorticity. Then, it further identifies the low-pressure center as a TC center with the criteria: (1) a maximum 500 hPa relative vorticity and surface wind speed (units: m s?1); (2) positive temperature anomalies (units: °C) at 700, 500 and 300 hPa and the sum ≥ 0.5°C; and (3) 850 hPa averaged speed anomaly > 300 hPa averaged speed anomaly.
Because TCs are an atmospheric response to warm water at the ocean surface (e.g., Emanuel, 1995a, b), properly initialized high-resolution coupled models that resolve detailed air?sea interactions are expected to predict TC genesis at reasonable time scales (Emanuel, 2018). Here, we evaluate the ability of the 27v9 and 9v3 systems to predict TC onset. For each of the 21 (20) TC cases detected in the 27v9 (9v3) initial conditions, we examine the daily forecast before the onset date to evaluate the TC onset prediction ability of the 27v9 (9v3) system. For example, for Typhoon Ewiniar (1804), the genesis time as a tropical depression is 1800 UTC 2 June 2018. We check the forecasts from 0000 UTC 28 May 2018 to 0000 UTC 2 June 2018 to determine whether a TC event with a similar lifetime exists. If it does, we then also calculate the errors in onset time, onset position, onset minimum pressure and onset maximum wind speed as functions of the number of forecast lead days, as shown in Fig. 5. We use the China Meteorological Administration (CMA) typhoon website (
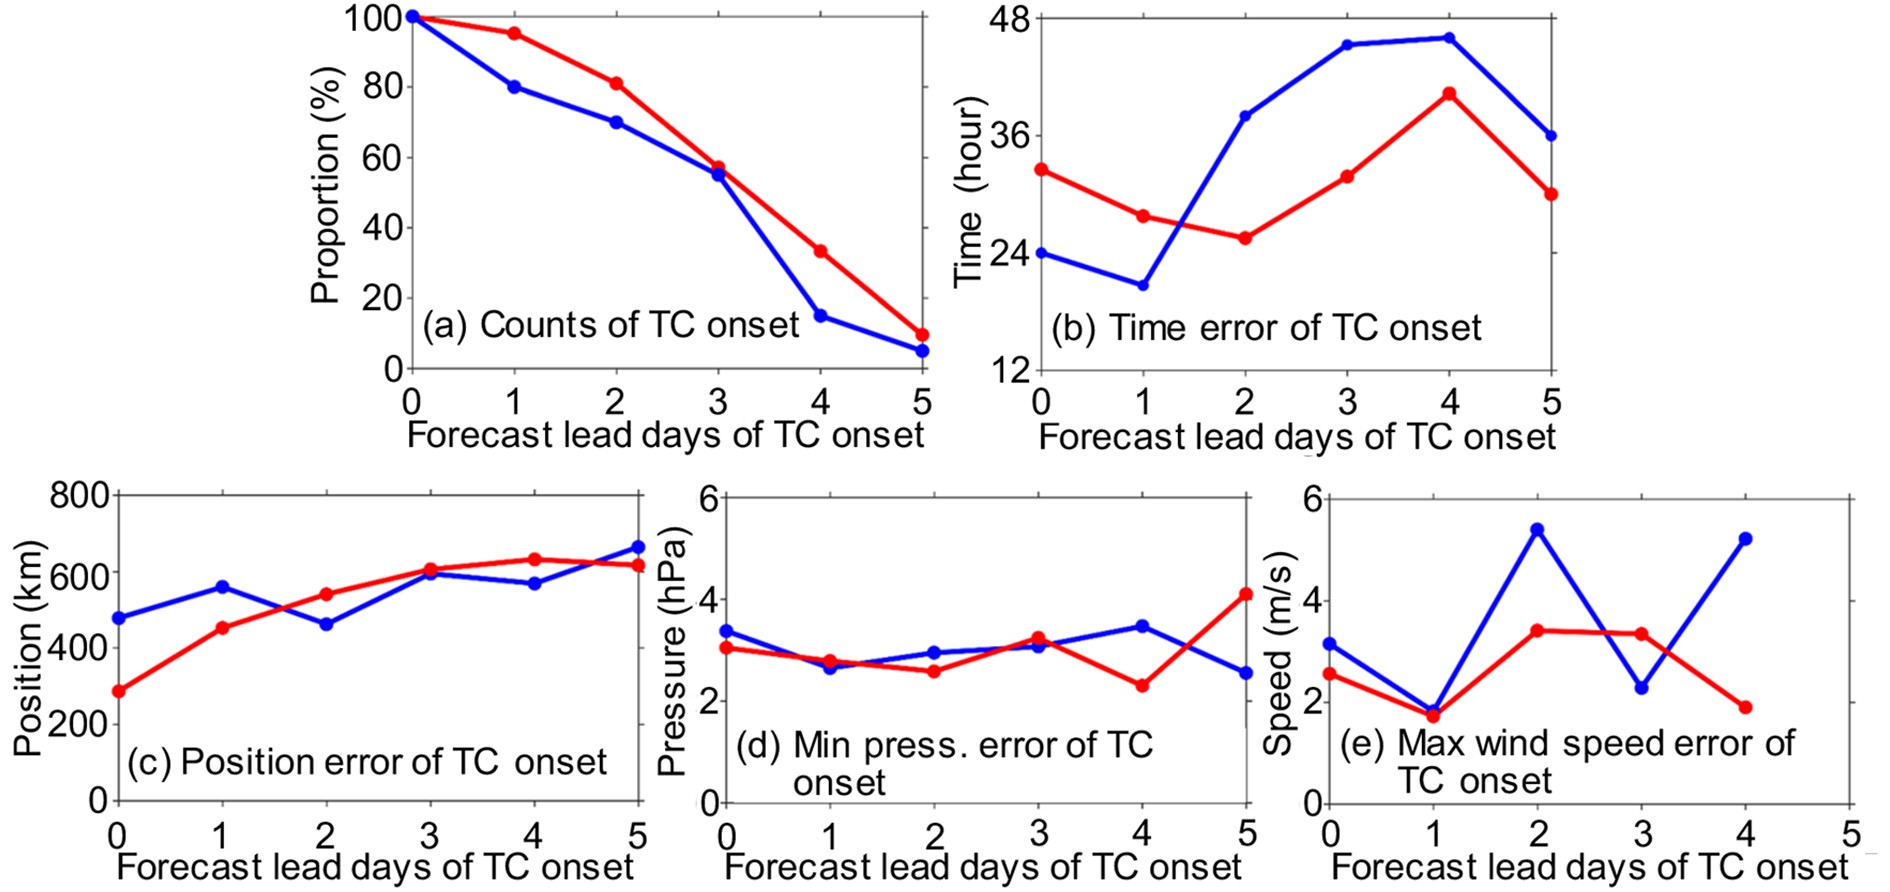 Figure5. Variations in (a) the number of TCs whose genesis is correctly forecast by the 27v9 (blue dots and line) and 9v3 (red dots and line) AP-RCMs, and the corresponding errors in (b) onset time, (c) onset position, (d) onset minimum pressure (units: hPa), and (e) onset maximum wind speed (units: m s?1), as functions of forecast lead days. Statistics are for the 2018 TC season (1 May to 31 October). For each TC, 10 forecasts before the onset date are examined.
Using the 27v9 (9v3) model prediction system, 18 of 21 (19 of 20) predicted TCs, representing 80% (95%) of the total, are accurately predicted (Fig. 5a). However, the number of predicted onsets drops to 60% for both systems at a forecast lead time of 3 days and to 5% (27v9) and 10% (9v3) with a forecast lead time of 5 days. Initially, the RMSEs in onset time are approximately 24 and 30 h (roughly within the uncertainty range between the CMA and JMA data) for the 27v9 and 9v3 systems, respectively, but this error increases with forecast lead time within a 48-h period (Fig. 5b). Similarly, the errors of onset position (Fig. 5c) and maximum wind speed (Fig. 5d) increase with forecast lead time, whereas the onset minimum pressure error remains constant (Fig. 5e). Notably, as shown in Fig. 5a, the number of correctly forecast TC onsets decreases with forecast lead days, and therefore the sampling error shown in all panels of Fig. 5 increases with forecast lead time.
To gain more understanding of the impact of model resolution on the predictability of TC genesis, we further examine the atmosphere and ocean states forecasted by the 27v9 and 9v3 systems. We choose typhoons 1806 (Gaemi) and 1814 (Yagi) as examples for this examination (Fig. 6). The genesis of Gaemi is successfully forecasted by 5 days in advance by both systems with a 36-h (24-h) onset time error in the 27v9 (9v3) system, whereas the genesis of Yagi is successfully forecasted by 5 days in advance only by the 9v3 system (with a 6-h onset time error). Due to the difference of these two TC forecast cases in the 9v3 and 27v9 models, the two systems have a 10% and 5% forecast skill of TC genesis at the 5-day lead time, respectively (Fig. 5a). We find that the 5-day forecasts of both systems have warm surface ocean water (> 26.5°C up to 60 m) over the TC onset areas in both cases, but the atmospheric states have distinct features in the 27v9 and 9v3 systems in both cases. For Gaemi, the 5-day forecasts from both systems have strong low-pressure centers (minimum surface pressure down to 981 hPa in both the 27v9 and 9v3 forecasts) with strong cyclonic circulation (850 hPa maximum vorticity reaches 15.4 × 10?5 s?1 and 47.4 × 10?5 s?1 in the 27v9 and 9v3 forecasts, respectively) but 9v3 forecasts stronger cyclones (Figs. 6a and b). In addition, forecasts from both systems have weak wind shear between the upper and lower troposphere, but the 9v3 forecast is slightly weaker. The area-averaged (roughly 0?500 km around the TC center) difference of wind speed between 250 hPa and 850 hPa is 14 m s?1 in the 27v9 forecast and 12 m s?1 in the 9v3 forecast. For Yagi, the 5-day forecast of the 27v9 system predicts only very weak low pressure (central surface pressure: 990 hPa) and strong upper?lower troposphere wind shear (22 m s?1 area-averaged wind speed difference between 250 hPa and 850 hPa) without a cyclonic vortex (no significant positive vorticity is found nearby; Fig. 6c). The 9v3 forecast has a slightly lower central surface pressure (987 hPa) with a cyclonic circulation (850-hPa maximum vorticity reaches 29.4 × 10?5 s?1) and weak upper?lower troposphere wind shear (13 m s?1 area-averaged wind speed difference between 250 hPa and 850 hPa; Fig. 6d). In these four forecasts, although the 27v9-forecast SST at the Yagi onset location is high (29.5°C), it is lower than in the surrounding area (Fig. 6c) and the model fails to forecast Yagi’s genesis. The remaining three cases (see the other three panels; Figs. 6a, b and d) successfully forecast a warm core, although the forecast central SST values in two of these cases are < 29°C. To get further insights on the influence of different atmosphere and ocean resolutions on the TC formation, we conduct a new 9v9 experiment (9-km WRF coupled with 9-km ROMS) and show the evolution of atmospheric and oceanic states in the 5-day forecasts produced by the 27v9, 9v9 and 9v3 systems before the date of TC onset in Fig. 7. It is shown that, just like the 27v9 case, the 9v9 system can successfully forecast the onset of Typhoon Gaemi (2018) by 5 days in advance but fails to forecast Typhoon Yagi (2018). In the 9v9 system, compared with the 27v9, while some change of atmosphere environment (smaller wind shear and shallow moisture) of Typhoon Yagi (2018) is observed (compare the green line to the black line in Fig. 7c), the SST structure remains the same. This implies that, for this case, the simulated warm core in the surface ocean environment of the 9v3 system plays a critical role for the successful 5-day forecast of Yagi’s onset. Figure 7 also shows that, out of these six forecast cases, all four successful cases at the fifth day forecasts have greater water vapor mixing ratios than the failure cases (panel d), meaning the deep moisture is an important factor in the TC formation (Sippel and Zhang, 2008; Sippel, 2008). It is worth mentioning that such a contrasting atmospheric/oceanic environment structure (weak/strong wind shear with/without deep moisture in 9v3/27v9, as well as with/without an SST warm core in 9v3/27v9) in the Yagi case is also found in other nearby forecast lead times (4-day and 6-day forecasts, for instance). Our case study results may suggest that a warm core at the ocean surface and the corresponding weak wind shear and deep moisture atmosphere environment are more favorable for local convection (e.g., Emanuel, 1986; Sippel and Zhang, 2008). In addition, considering that the 3-km grid spacing is “convection-permitting” while 9-km grid spacing is at the gray-zone of the convection-permitting resolution, systematic examinations of the results of 3-km and 9-km WRF coupled with same-resolution ROMS (3-km, for instance) can demonstrate the benefits of the convection-permitting resolution on TC genesis predictability. Once the constraint of computational resources is relaxed in the future, more case studies can reveal more mechanisms and gain a complete understanding of TC genesis predictability.
 Figure6. Atmosphere and surface ocean states forecast by the (a, c) 27v9 and (b, d) 9v3 AP-RCP systems initialized from the coupled analyzed states with a forecast lead of 5 days. (a, b) Typhoon 1806 Gaemi forecasts initialized using 0000 UTC 9 June as the onset (0000 UTC 14 June as a tropical depression) for (a) 1200 UTC 15 June and (b) 0000 UTC 15 June. (c, d) Typhoon 1814 Yagi forecasts initialized using 0000 UTC 2 August as the onset (0600 UTC 7 August as a tropical depression) for (c) 0000 UTC 7 August and (d) 1800 UTC 6 August. The red asterisk in each panel indicates the location of the corresponding TC center.
 Figure7. Time series of 5-day forecasts of area-averaged (a) SST (unit: °C), (b) SLP (units: hPa), (c) 250?850 hPa wind shear (units: m s?1), (d) 850 hPa water vapor mixing ratio (units: kg kg?1), and (e) 850 hPa vorticity (unit: 10?4 s?1) for Typhoon Gaemi (dashed) and Yagi (solid) produced by the 27v9 (black), 9v9 (green), and 9v3 (red) systems. Each dot in the panels represents a snapshot at the 6-h time interval and the area for conducting the average is defined as a 108-km × 108-km square at the forecasted or expected (in iBTrACs) typhoon center.
Figure 8 shows the forecast RMSE statistics for the 21 (20) TCs detected in the initial states of the 27v9 (9v3) simulations by number of forecast lead days. Generally, both the 27v9 and 9v3 systems accurately predict the TC tracks for ~8 days (50% of the initialized TCs survive, as indicated by the dashed lines; Fig. 8a). Although the errors in minimum center pressure are similar between 27v9 and 9v3 (Fig. 8b), the higher-resolution 9v3 model has a lower maximum wind speed error than the 27v9 system throughout the forecast period (Fig. 8c). The forecast errors of TC position are more complex. The 27v9 and 9v3 systems are similar, but the position errors of the higher-resolution 9v3 system increase after the first 5 days. These results suggest that enhanced model resolution can consistently improve TC intensity forecasts, but the impact of enhanced model resolution on forecasts of TC track evolution tend to be more complex and require further evaluation. We also show the forecast errors of the CMA (
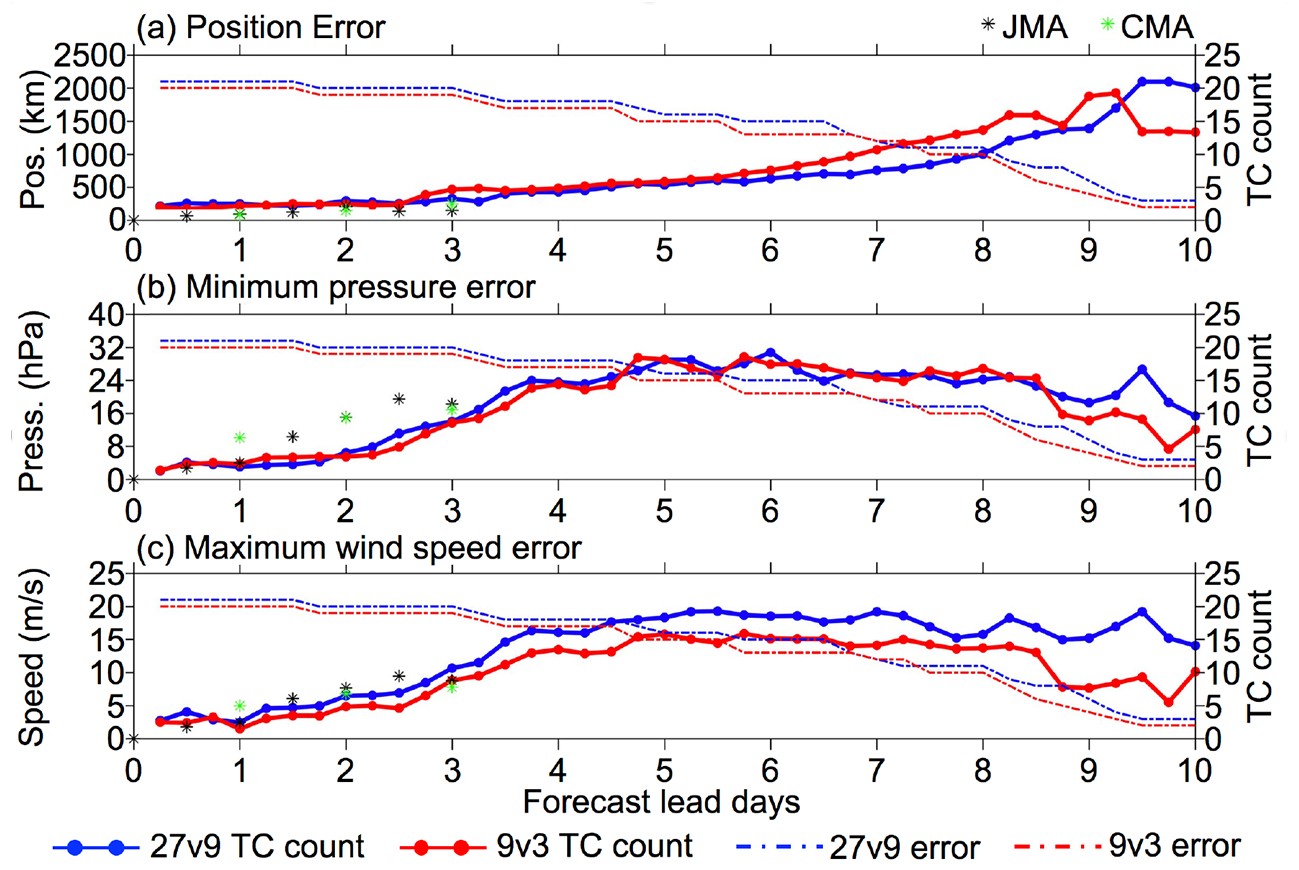 Figure8. Variations in RMSEs of TC (a) position, (b) minimum pressure (units: hPa) and (c) maximum wind speed (units: m s?1) as a function of forecast lead days from the 27v9 (blue) and 9v3 (red) AP-RCP systems. Statistics start from the TC onset date, and the dashed lines in each panel show the TC count at the corresponding forecast time. Black and green asterisks indicate the forecast errors calculated using corresponding forecasted data from the CMA and JMA.
Generally, both the 27v9 and 9v3 AP-RCMs predict TC genesis a few days in advance, with an onset time uncertainty of < 36 h. The higher-resolution 9v3 model describes the interaction between TCs and the environment in greater detail, has a higher forecast skill for TC genesis than the 27v9 model, including more accurate onset TC counts, and smaller errors in TC onset time, position and intensity. A comparison of the lifecycles of modeled TCs against satellite observations reveals that the 9v3 model predictions consistently have smaller intensity errors throughout the TC lifetime. Effects on TC track forecasts are less clear, with the 9v3 model only showing a small improvement at forecast lead times > 5 days.
This work is a preliminary evaluation of the impact of high-resolution coupled models on the predictability of TC genesis for a single typhoon season in the West Pacific. Further work is required to clarify the mechanisms of TC genesis and the subsequent evolution of position and intensity, and enhance forecast accuracy over the lifetime of TCs. The current AP-RCM initialization and predictions follow a natural fashion of atmosphere?land?ocean coupling with conventional atmospheric and oceanic observations, without specific TC initialization with observational TC onset information. Given the importance of accurate initial vortex structures as well as balanced and coherent atmosphere?ocean environmental conditions for TC track and intensity predictions (Fudeyasu et al., 2010a, b), forecast skills for TC tracks and intensity could be improved by using a more advanced initialization scheme (e.g., Zhang et al., 2011; Cha and Wang 2013). However, the physics schemes used in high-resolution coupled models must also be improved (e.g. Davis et al., 2008; Gopalakrishnan et al., 2012). For example, what is the impact of an atmospheric model that can resolve very detailed low-level conditions near land and sea surfaces on TC track and intensity? How can planetary boundary physics in models be improved to provide a more detailed representation of air?sea and air?land interactions? Given that the predictability of TC onset and subsequent track intensity changes is strongly dependent on individual TC properties, how can multiple-resolution coupled prediction systems be used to further study the impact of detailed TC structure predictions on forecasts of its lifecycle, thus understanding the sources of predictability? Answers to these questions are critical to efforts to enhance the forecast accuracy of TC genesis, track and intensity changes in the whole TC lifecycle, thus extending the lead forecasting time beyond 10 days with more accurate predictions of TC statistics. In addition, the current study uses weakly CDA as the coupled model initialization scheme. Future studies can be upgraded to strongly CDA, which could further improve the balance and coherence of coupled model initial conditions (Li and Toumi, 2018; Chen and Zhang, 2019), thus improving the predictability of TC genesis and follow-up track and intensity predictions.
Acknowledgements. We thank the two anonymous reviewers for their thorough examinations and useful and helpful comments on the early version of the manuscript. This research was supported by the National Key Research & Development Program of China (Grant Nos. 2017YFC1404100 and 2017YFC1404104) and the National Natural Science Foundation of China (Grant Nos. 41775100 and 41830964), as well as Shandong Province’s “Taishan” Scientist Project. Data used to produce the figures and analyses in this work are available at:
