HTML
--> --> -->Significant progress has been made over the past few decades in revealing the basic features and underlying physical mechanisms of the MJO (e.g., Weickmann et al., 1985; Ferranti et al., 1990; Sperber, 2003; Kiladis et al., 2005). Previous studies have emphasized the importance of moisture processes and associated moist static energy (MSE) in the initiation, propagation, and intensity of the MJO (Kemball-Cook and Weare, 2001; Maloney, 2009; Andersen and Kuang, 2012; Adames and Wallace, 2014; Pritchard and Bretherton, 2014). For example, the horizontal transportation of moisture/MSE plays a crucial role in both the initiation (Zhao et al., 2013; Maloney and Wolding, 2015) and development (Andersen and Kuang, 2012; Adames and Wallace, 2014) of MJO-related convection. The low-level moistening ahead of the MJO convection results in a relatively unstable stratification that favors the eastward development of the deep convection (Hsu and Li, 2012; Kim et al., 2014).
The El Ni?o–Southern Oscillation (ENSO) is the most dominant coupled ocean–atmosphere phenomenon on the interannual timescale. Numerous studies have demonstrated its significant influences on global climate, mostly through so-called atmospheric bridge mechanisms (e.g., Bjerknes, 1969; Wallace et al., 1998; Alexander et al., 2002; Lau and Nath, 2006; Zhang et al., 2015). The relationship of ENSO with the MJO has also been largely documented. Observations show that El Ni?o events are usually accompanied by active and continuous eastward-propagating MJO events (Kessler et al., 1995; Zhang and Gottschalck, 2002; Zavala-Garay et al., 2005). In the spring and summer of years with developing El Ni?o events, the intraseasonal zonal westerly winds associated with the active MJO can force an eastward extension of the tropical Pacific warm pool edge, and thus contribute to warming sea surface temperature (SST) anomalies (SSTAs) in the central to eastern tropical Pacific (Vecchi and Harrison, 2000; Hendon et al., 2007; Tang and Yu, 2008).
El Ni?o is also able to influence initiation, intensity, propagation, and other basic characteristics of the MJO by modulating the SST distribution (Kim et al., 2010; Kapur and Zhang, 2012; Wang et al., 2019). During the mature and decaying phases of El Ni?o, MJO intensity is normally weakened in the western tropical Pacific (Chen et al., 2015). The frequency of intraseasonal oscillation is higher over the western Pacific, and mainly characterized by northwestward propagation during decaying El Ni?o events in summer (Liu et al., 2016a). Correspondingly, the eastward propagation of the MJO is also weakened at the equator (Lin and Li, 2008). Roughly opposite responses of the MJO can be found for La Ni?a events. In recent years, another type of El Ni?o event has occurred much more frequently with a maximum SSTA center located in the central Pacific (CP) (Larkin and Harrison, 2005; Ashok et al., 2009; Kao and Yu, 2009; Kug et al., 2009; Ren and Jin, 2011; Zhang et al., 2014). In contrast to traditional El Ni?o events, the CP El Ni?o is usually accompanied by enhanced MJO activity and further eastward propagation during its mature and decaying phases (e.g., Gushchina and Dewitte, 2012; Feng et al., 2015; Chen et al., 2016; Hsu and Xiao, 2017).
Among El Ni?o events, so-called super El Ni?o events have extremely warm SSTAs in the tropical Pacific and are of considerable public concern since they can lead to more severe global catastrophic disasters compared to normal El Ni?o events (Smith et al., 1999; Zhang et al., 2016; Geng et al., 2017). Since the late 1970s when satellite observation began, three super El Ni?o events (i.e., 1982/83, 1997/98, and 2015/16) have been well-observed. These three events share similar characteristics in terms of evolution and intensity, and exhibit similar MJO-associated westerly wind anomalies during their development stages (McPhaden, 1999; Levine and McPhaden, 2016; Chen et al., 2017). However, the 2015/16 super El Ni?o event does exhibit some unique characteristics and climate impacts compared to the two prior super El Ni?o events (Jacox et al., 2016; L’Heureux et al., 2017; Paek et al., 2017; Lyu et al., 2018). Considering the different oceanic/atmospheric features of the 2015/16 super El Ni?o event, some MJO features during its mature phase may also differ from the other two super El Ni?o events. We observe that the 2015/16 super El Ni?o event coincides with enhanced MJO activity over the western Pacific, which is very different from the previous super El Ni?o events. This observation deserves further investigation in order to understand the possible reasons for this uniqueness during the boreal winter of the 2015/16 super El Ni?o event.
In this study, we analyze the differences in MJO activity of the 2015/16 super El Ni?o event compared to the previous two super El Ni?o events. Possible physical reasons for the unique MJO feature of the 2015/16 super El Ni?o event are further investigated based on the diagnoses of moisture and MSE budget equations. First, the data and methodology used in this study are described in section 2. Then, the distinct MJO feature associated with the 2015/16 super El Ni?o event is displayed through inter-comparison with the other two super El Ni?o events in section 3. Possible reasons for the unique MJO activity during the 2015/16 El Ni?o are examined in section 4. Finally, conclusions and discussions are summarized in section 5.
2.1. Datasets
In this study, daily mean outgoing longwave radiation data (OLR, Liebmann and Smith, 1996) and monthly global gridded precipitation data (Xie and Arkin, 1997) with horizontal resolution of 2.5° × 2.5° from the National Oceanic and Atmospheric Administration (NOAA) are used to identify convective activity at the intraseasonal and interannual timescales, respectively. Monthly SST data with horizontal resolution of 1° × 1° is obtained from the Hadley Centre Sea Ice and Sea Surface Temperature datasets (HadISST1; Rayner et al., 2003). To understand the physical processes related to MJO development, the three-dimensional dynamic and thermodynamic fields, including daily averaged horizontal winds, vertical pressure velocity, air temperature, specific humidity, and geopotential height, are collected from the European Centre for Medium-Range Weather Forecasts (ECMWF) interim reanalysis (ERA-Interim, Dee et al., 2011). The sensible heat flux (SHF), latent heat flux (LHF), and longwave (LW) and shortwave (SW) radiation fluxes at the bottom and top of the atmosphere from the ERA-Interim reanalysis are also used. The horizontal resolution of all ERA-Interim datasets is 1.5° × 1.5°. We also use the all-season real-time multivariate MJO (RMM) index (Wheeler and Hendon, 2004;2
2.2. Methodology
To extract the MJO-associated intraseasonal variability (30–90 days), a 201-point Lanczos bandpass filter is used (Duchon, 1979). The monthly mean amplitude of the MJO is measured as the square root of the filtered OLR variance within a 3-month running window centered on that calendar month (Hendon et al., 2007). Ni?o3.4 index is used for defining a super El Ni?o event as the intensity of El Ni?o, which is calculated by the standardized area-averaged SSTA in the Ni?o3.4 region (5°S–5°N, 120°–170°W), and the Ni?o3.4 index during the mature phase of super El Ni?o events is usually above the 2 standard deviations. Anomalies were calculated as the departures from the climatological average over the entire study period (1979–2018). The monthly RMM amplitude is calculated by following steps: first calculate the 90 days running averaged of daily RMM amplitude [(RMM12+RMM22)1/2], and then calculate the monthly mean RMM amplitude of every single month.Column-integrated MSE and low-level moisture are important factors for the development and maintenance of the MJO (Maloney, 2009; Hsu and Li, 2012; Sobel and Maloney, 2013; Adames and Wallace, 2014; Kim et al., 2014). The moisture and MSE budget terms are diagnosed to understand the key processes contributing to the distinct MJO activity in the boreal winter of 2015/16. The moisture budget equation at the intraseasonal timescale is based on Eq. (1) (Yanai et al., 1973):
where q is the specific humidity, and V and ω represent horizontal wind and vertical pressure velocity, respectively. Q2 and L denote the apparent moisture sink and latent heat of condensation, and

The MSE budget at intraseasonal timescales is defined by Eq. (2) (Neelin and Held, 1987):
where m denotes MSE, defined by m = CpT+Lq+gz, and Cp is the heat capacity of dry air at constant pressure (1004 J K?1 kg?1), L is the specific latent heat for a unit substance (2.5 × 10⁶ J kg?1), g is the gravitational constant (9.8 m s?2), and z is geopotential height. The left-hand term and first two terms of the right-hand side of Eq. (2) are vertically integrated from 1000 hPa to 100 hPa. The net heat flux terms are calculated as the differences between the top and surface level of the atmosphere.
 Figure1. (a) Time evolutions of the Ni?o3.4 index (°C) for 1982/83 (red), 1997/98 (orange) and 2015/16 (blue) events relative to the climatological state in 1979–2018. Notation of 0 (1) in parentheses on the x-axis represents the El Ni?o developing (decaying) year. (b) Anomalies of monthly RMM index amplitude in the boreal winters of three super El Ni?o events.
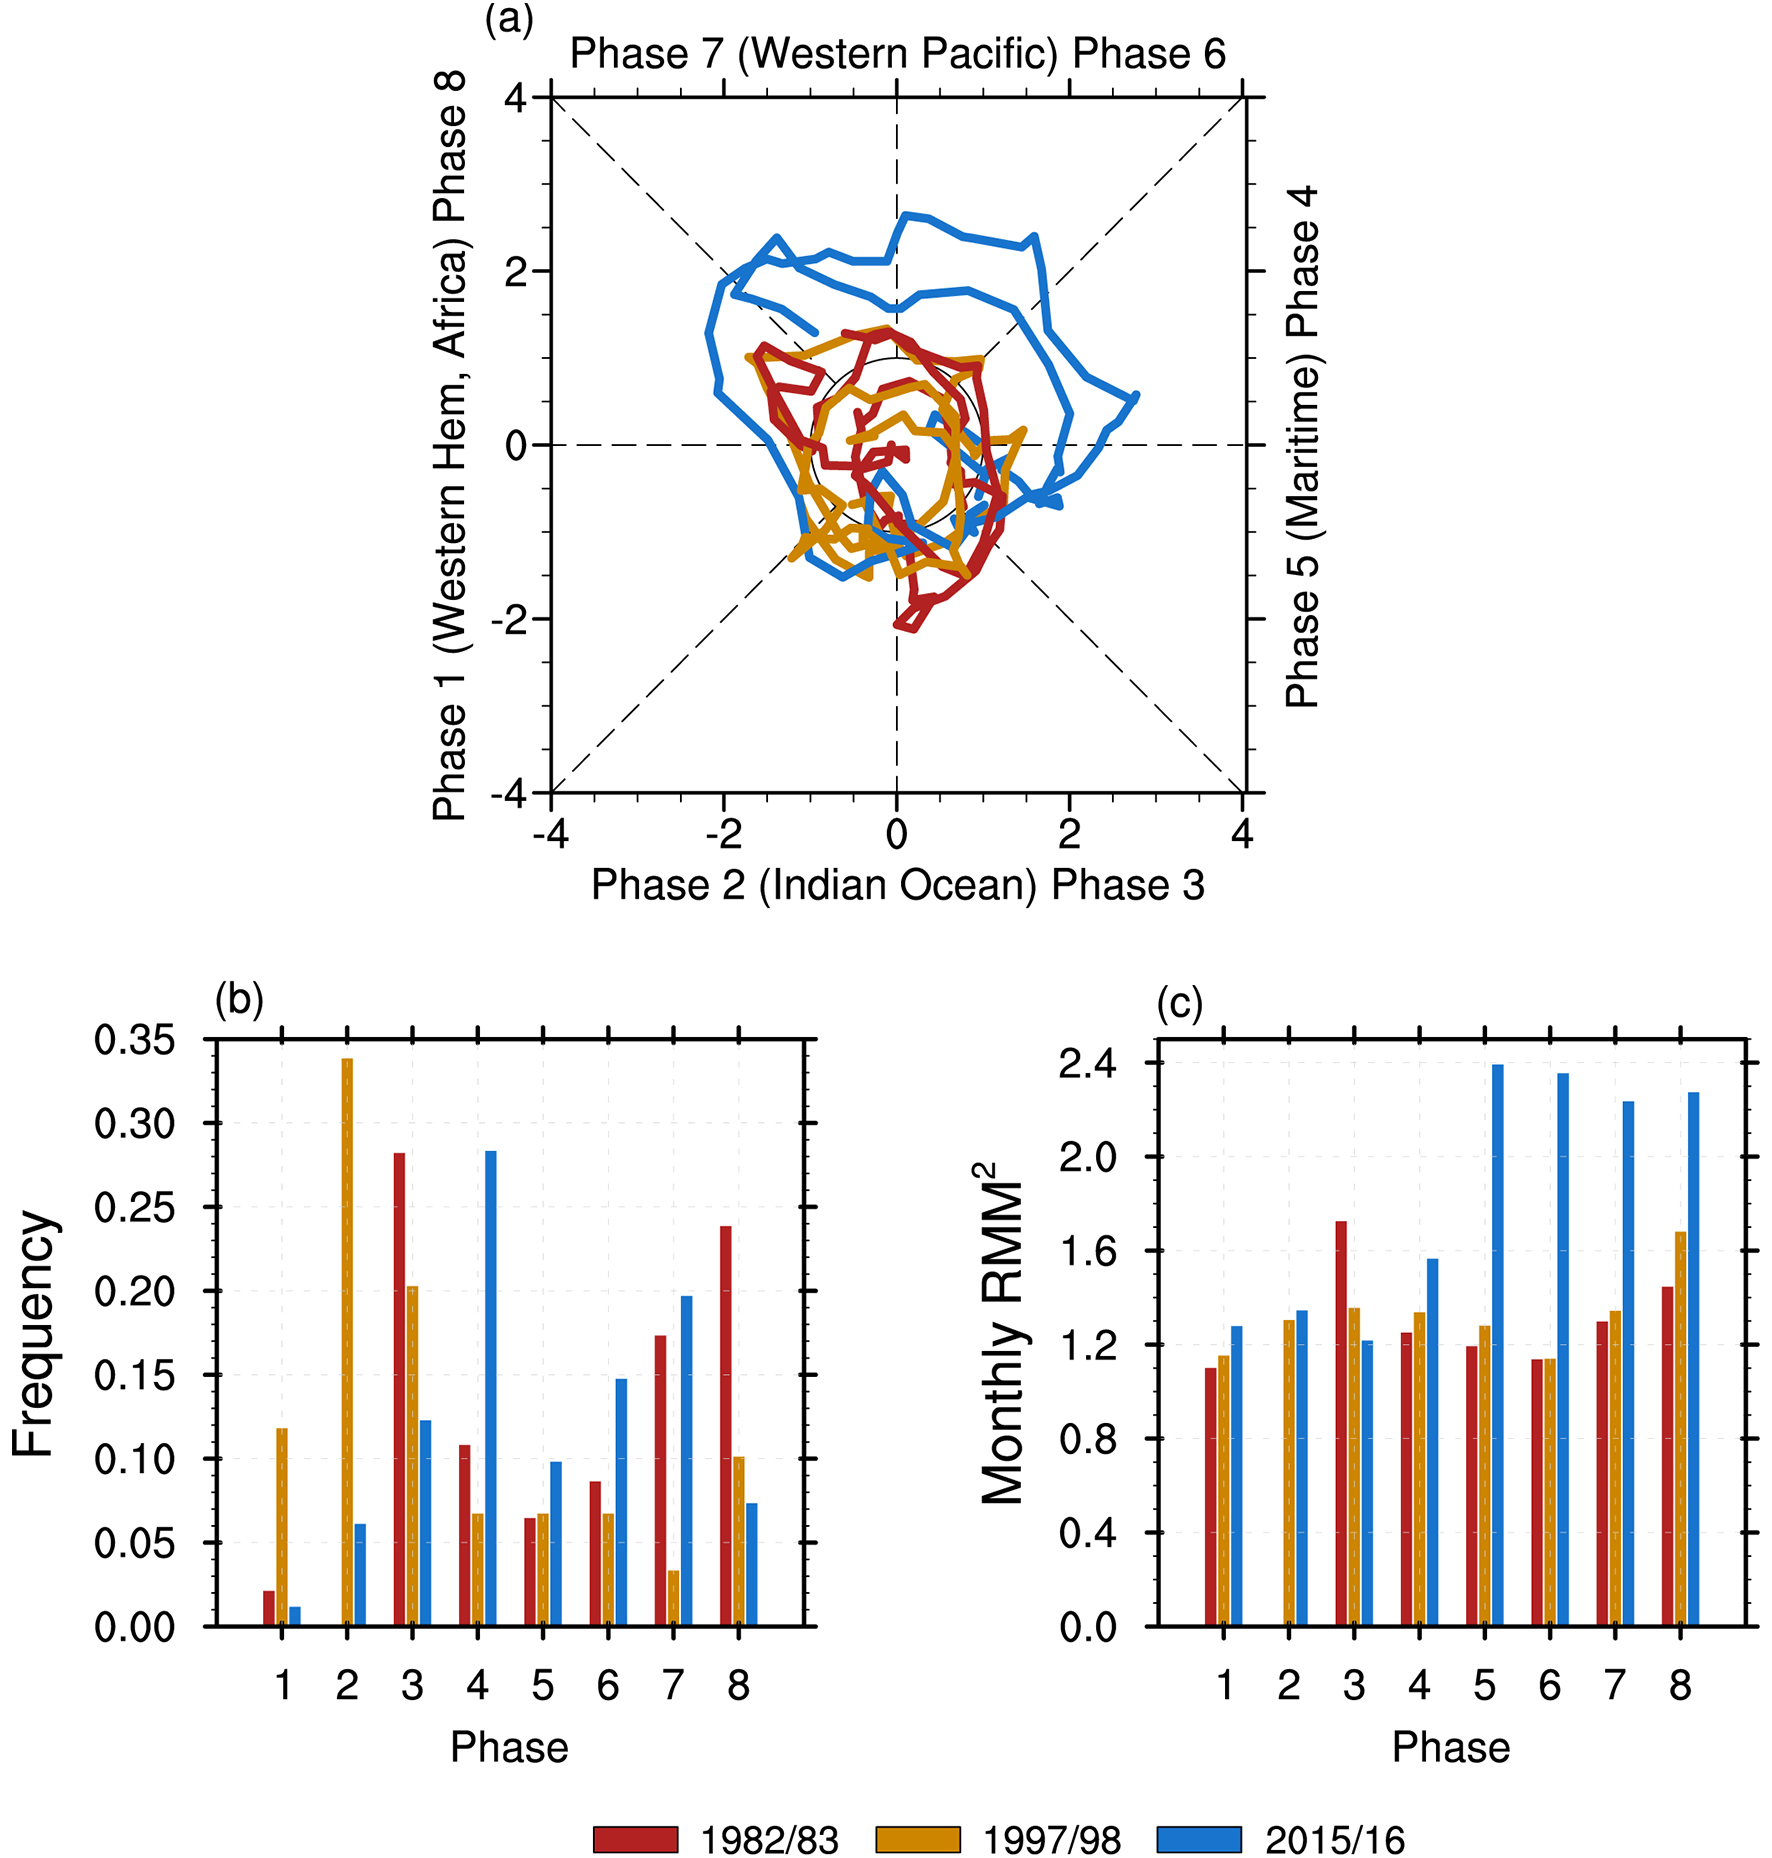 Figure2. (a) MJO phase space diagrams for the boreal winters of 1982/83 (red), 1997/98 (yellow), and 2015/16 (blue). (b) The frequency of each MJO phase during the boreal winters of 1982/83, 1997/98, and 2015/16. (c) Same as (b) but for the MJO intensity.
To clearly identify the key region with significant MJO changes associated with super El Ni?o events, Figure 3 shows the spatial patterns of the MJO-related (30–90 day filtered) convection variability. For the 1982/83 and 1997/98 super El Ni?o events, the MJO intensity is significantly suppressed over most of the tropical Indo-Pacific region (Figs. 3a, b). A slightly weakened MJO can also be seen in the tropical Indian Ocean during the boreal winter of the 2015/16 super El Ni?o, while the MJO is remarkably strengthened over the Maritime Continent and the tropical western Pacific of the Southern Hemisphere (Fig. 3c), which is consistent with the results shown in Fig. 2. The enhanced MJO activity during the 2015/16 super El Ni?o event experienced a maximum over the western Pacific near 10°S, which is climatologically the region with the most vigorous MJO activity. Previous studies have also found similar intraseasonal variability with this enhanced activity (Liu et al., 2016b). The unique change in MJO amplitude during boreal winter of the 2015/16 super El Ni?o event can also be clearly seen when the difference is taken between it and the previous two super El Ni?o events (Figs. 3d–f). The remarkable enhancement of MJO intensity during the 2015/16 super El Ni?o event is observed more consistently over the tropical western Pacific (green boxes in Fig. 3, 120°–170°E, 5°–15°S) relative to the 1982/83 super El Ni?o event (Fig. 3d), the 1997/98 super El Ni?o event (Fig. 3e), and their average (Fig. 3f). This region will be our focus since the largest difference appears here.
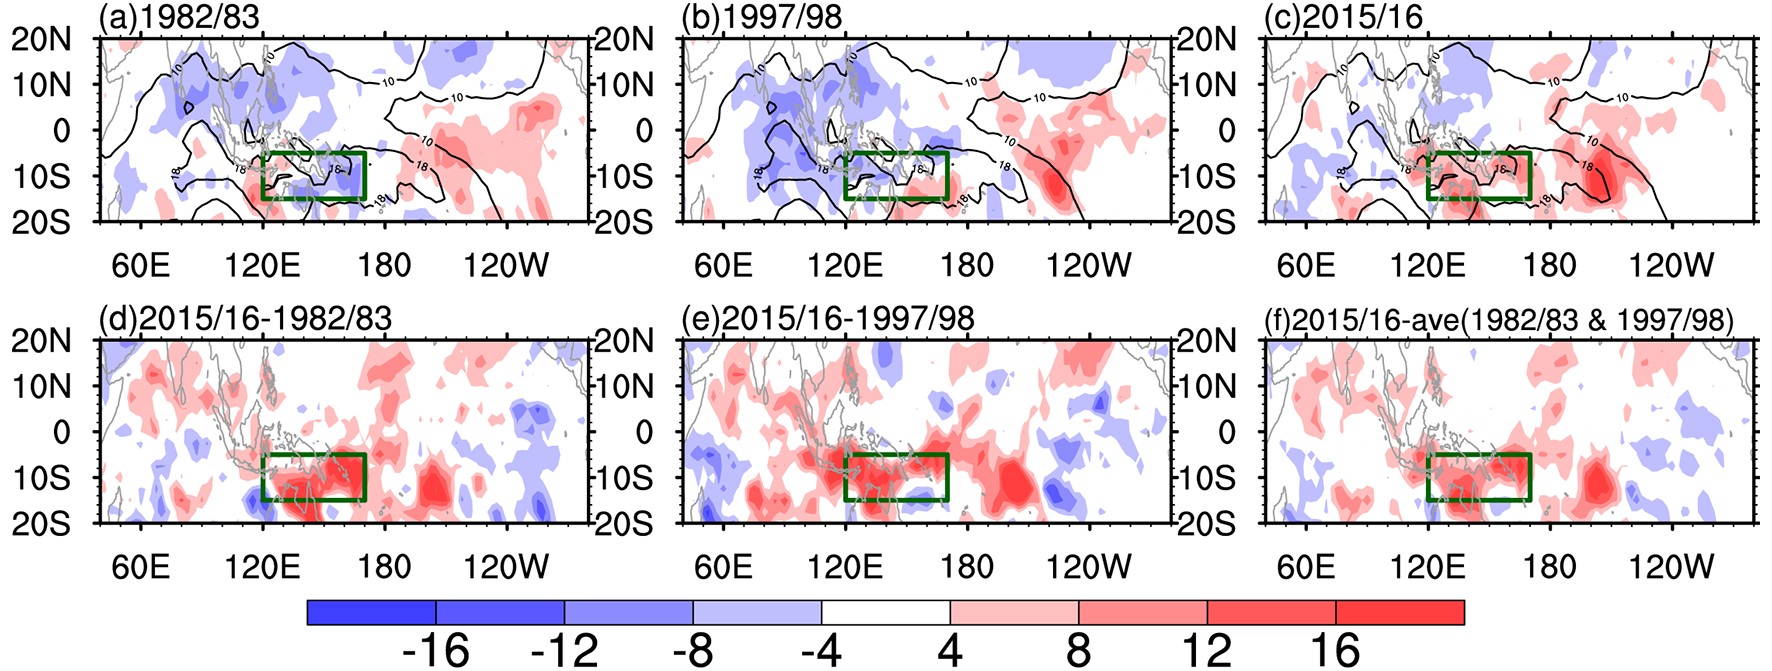 Figure3. Anomalous distributions of 30–90 d filtered OLR standard deviation (shading, W m–2) during the boreal winters of (a) 1982/83, (b) 1997/98, and (c) 2015/16, superimposed on the climatology (contours, W m–2). The corresponding differences between (d) 2015/16 minus 1982/83, (e) 2015/16 minus 1997/98, (f) 2015/16 minus the average of 1982/83 and 1997/98.
Considering modulation of the background oceanic-atmospheric conditions on MJO activity, Figure 4 displays anomalous SST and precipitation patterns associated with the boreal winters of three super El Ni?o events. All three events are characterized by extremely warm SSTAs and above average precipitation over the central to eastern tropical Pacific. Compared to the previous two super El Ni?o events, the warm SSTA center is clearly displaced westward by about 20 degrees of longitude for the 2015/16 super El Ni?o event (Figs. 4a–c). This observation is further supported by the SSTA difference between the 2015/16 case and the average of the other two cases (Fig. 4d). Figure 4d also shows that the precipitation anomalies are stronger in the central Pacific and weaker in the eastern Pacific during the 2015/16 boreal winter compared to the other two cases. In the western Pacific, negative SSTAs and reduced precipitation are evident for the boreal winters of the 1982/83 and 1997/98 super El Ni?o events (Figs. 4a, b). However, slightly negative SSTAs can be found in the western Pacific with very small negative precipitation anomalies during the boreal winter of 2015/16 (Fig. 4c). These observations suggest that the distinct oceanic and atmospheric anomalies in the western Pacific during the boreal winter of the 2015/16 super El Ni?o event (Fig. 4d) provide different background conditions for MJO activity and may possibly lead to unique MJO anomalies in contrast to the previous super El Ni?o events. The possible effects of the background conditions will be investigated in detail in the next section.
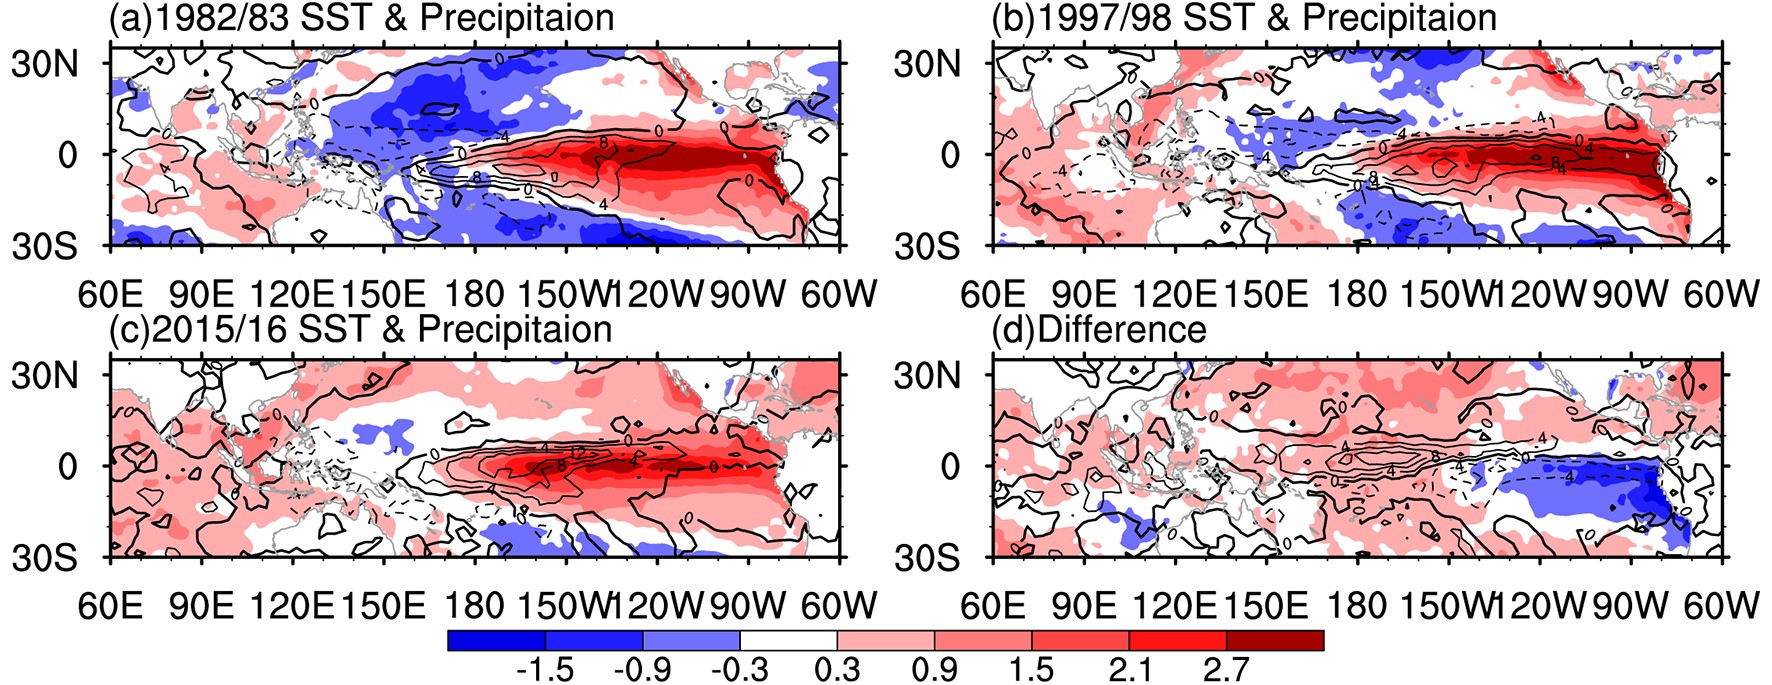 Figure4. Seasonal SST (shading, °C) and precipitation (contours, mm d–1) anomalies in the boreal winters of (a) 1982/83, (b) 1997/98, and (c) 2015/16. (d) Their differences between 2015/16 and the average of 1997/98 and 1982/83.
Composite OLR anomalies at the intraseasonal timescale are used to represent local MJO evolution in the western Pacific. Active MJO events were selected for the composite when the 30–90 day filtered OLR over the western Pacific was greater than 1 standard deviation. The date with the minimum 30–90 day OLR is defined as day 0. As shown in Fig. 5a, the OLR anomalies change their signs from positive to negative around day -10, when the MJO convective signal initiates and develops. For low-level moisture, its maximum tendency also occurs around day -10, leading the MJO convection maximum by about 10 days (Fig. 5b). The phase relationship between the MJO-related convection and moisture suggests an important effect of the leading low-level moisture accumulation on the growth of the MJO convection. Despite similar evolutions of MJO convection and moisture anomalies for all three super El Ni?o events, the amplitude of moisture tendency in the 2015/16 event is about twice as strong as those of the 1982/83 and 1997/98 events (Figs. 5a, b). The enhanced moisture tendency is likely contributing to the strong amplitude of MJO convection in the 2015/16 event (Fig. 5a) during its development stage (from day –10 to 0, when the OLR ranges from zero to its minimum). Focusing on the MJO development period, the moisture tendency is positive and the vertical moisture advection shows a large contribution. Although the horizontal moisture advection is in phase with the moisture tendency, it has a relatively small contribution compared to vertical advection and latent heating processes during the MJO development stage (Figs. 5c–d). Note that the moisture begins discharging through apparent moisture sinking and latent heat of condensation when the MJO convection is established, which is represented as Q2/L in Eq. (1) (Kemball-Cook and Weare, 2001; Kiladis et al., 2005).
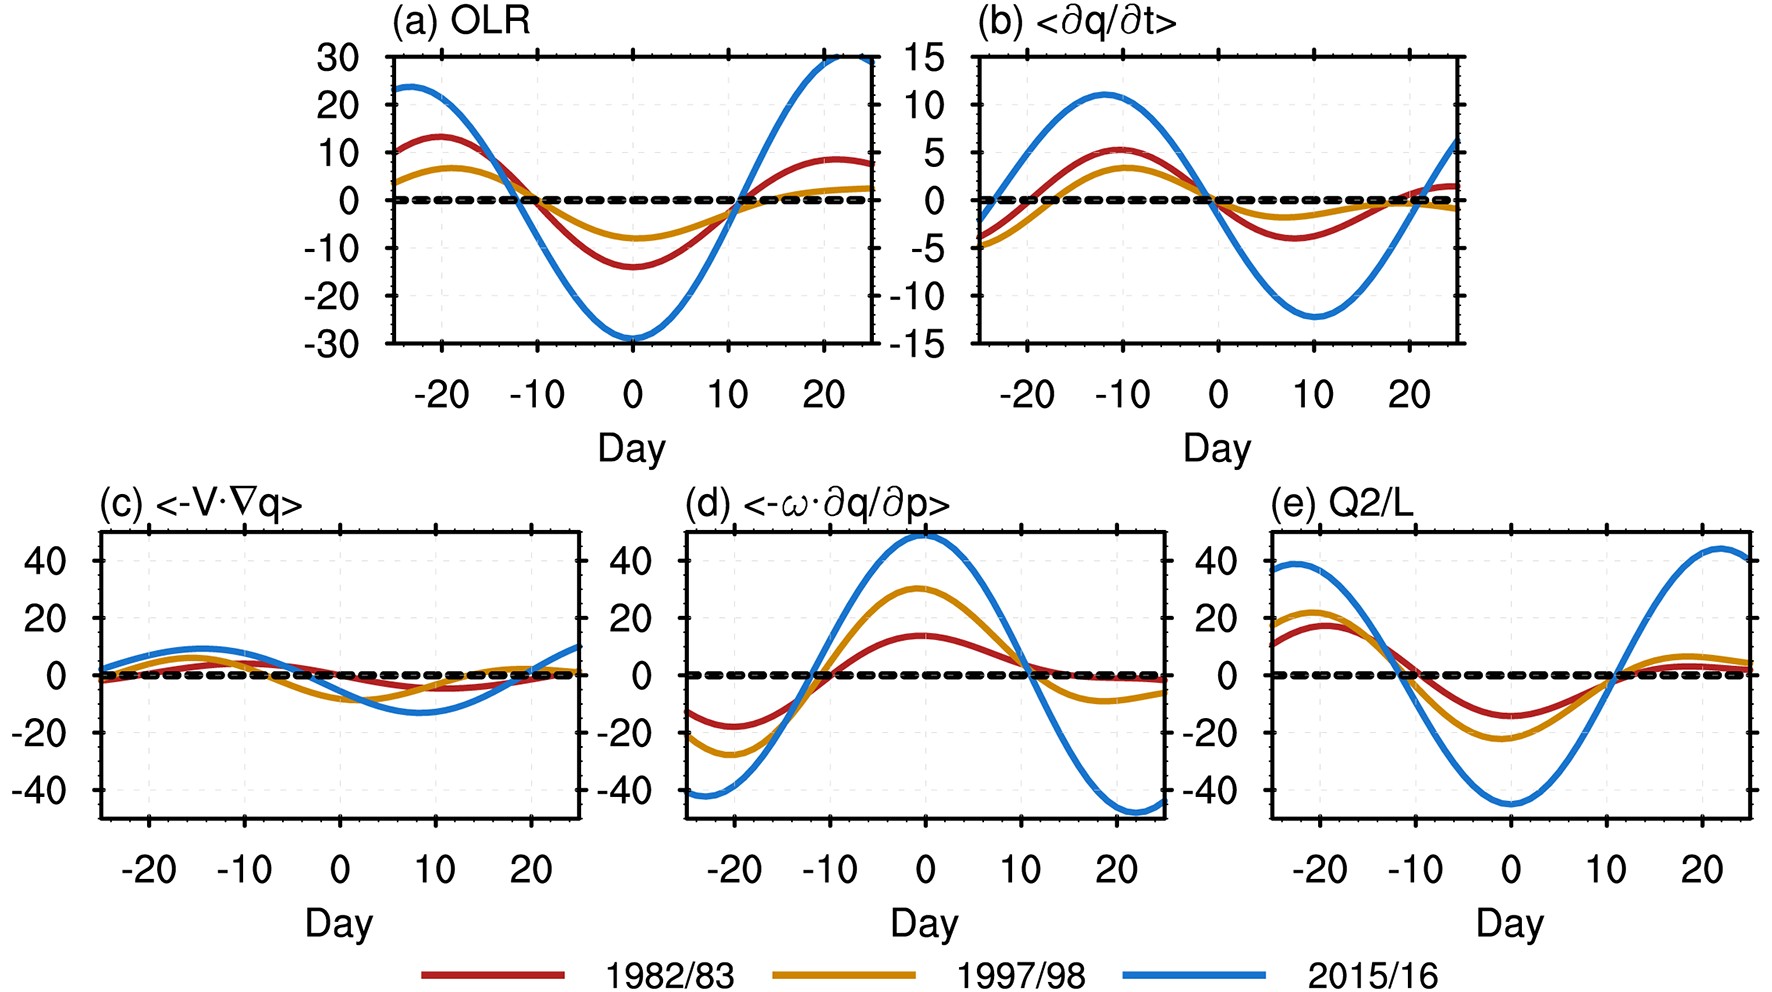 Figure5. Composites of (a) 30–90 day filtered OLR anomaly (W m–2) averaged over the western Pacific region (120°–170°E, 5°–15°S) with day 0 as the occurrence of maximum MJO OLR anomaly. The blue, orange and red lines represent MJO evolutions during the boreal winters of 2015/16, 1997/98 and 1982/83, respectively. (b–e) Same as (a) except for column-integrated (1000–700 hPa) intraseasonal moisture budget terms (10–6 kg m–2 s–1) for (b) moisture tendency, (c) horizontal advection, (d) vertical advection, and (e) residual of the moisture budget.
Figure 6 further compares the moisture budget terms and the contributions of scale interactions to the key processes during day ?10 to day 0, when MJO convection grows quickly. During the developing stage of MJO convection, the moisture tendency

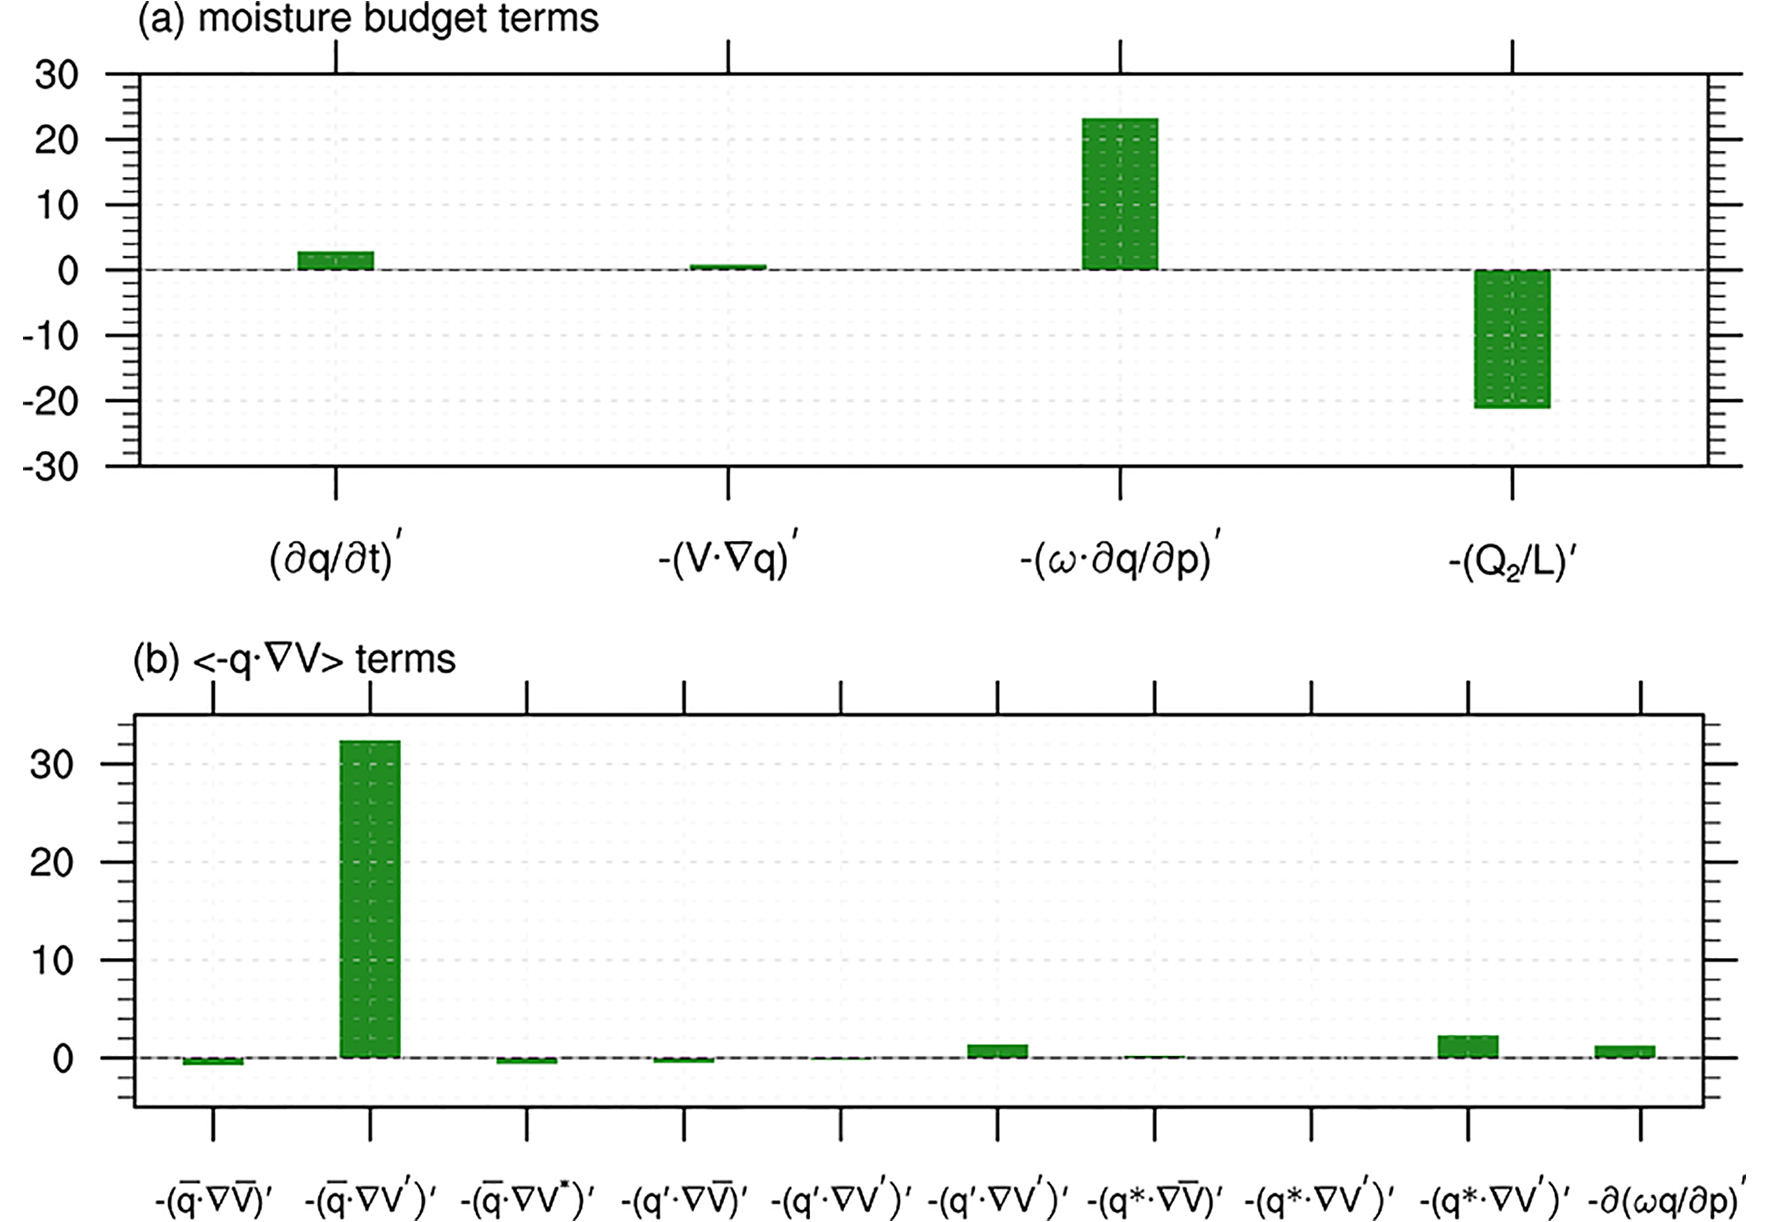 Figure6. Difference in lower troposphere (1000–700 hPa) column-integrated (a) intraseasonal moisture budget terms (10–6 kg m?2 s?1) and (b) individual decomposition terms of
where the right-hand side terms represent horizontal moisture convergence and vertical moisture flux convergence, respectively. To elucidate the importance of scale interactions for vertical moisture advection, q and V are decomposed into low-frequency background state (LFBS, longer than 90 days), intraseasonal component (30–90 days), and higher-frequency disturbances (less than 30 days) as depicted in the following equation:
The overbar, prime, and asterisk indicate LFBS, intraseasonal, and higher-frequency components, respectively. Based on this, the zonal moist convergence can be separated into 9 terms representing the interactions between different timescales:
The diagnostic result of Eq. (5) shows that the El Ni?o-related LFBS moisture converged by the MJO-related horizontal wind anomalies

Figure 7 shows the distributions of LFBS moisture (


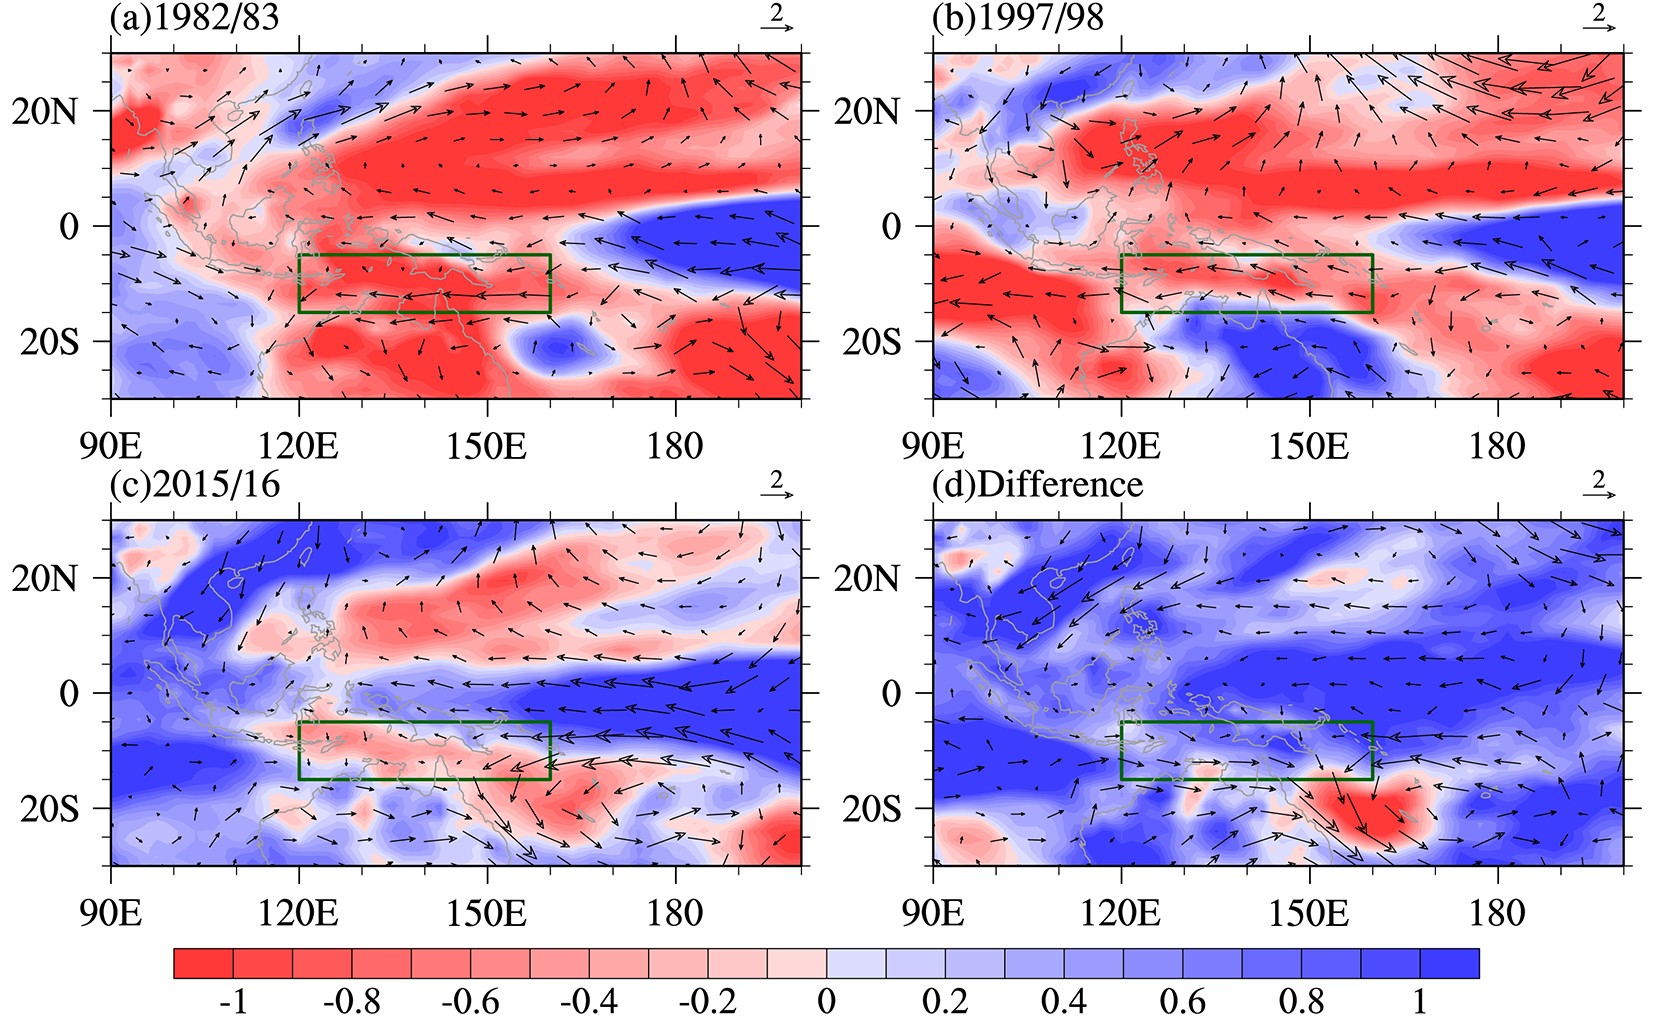 Figure7. Vertically averaged (1000–700 hPa) LFBS moisture (shading, g kg–1) and MJO-related horizontal wind (vectors, m s–1) anomalies for (a) 1982/83, (b) 1997/98, (c) 2015/16 and (d) difference between 2015/16 and the average of 1982/83 and 1997/98 from day –10 to day 0. The green boxes denotes the western tropical Pacific (5°–15°S, 120°–170°E).
In addition to the preconditioning effect of low-level moisture, the positive MSE anomalies associated with the MJO are also argued to be important for the initiation and growth of MJO convection (e.g., Maloney, 2009; Andersen and Kuang, 2012; Zhao et al., 2013; Maloney and Wolding, 2015; Hsu and Xiao, 2017). Although the MSE variability is dominated by the moisture change at the MJO timescale (Maloney, 2009), its budget diagnosis, shown in Eq. (2), could provide additional insights about the effects of radiative heating and surface fluxes on the MJO evolution. We analyze the MSE evolution and its related physical processes for MJO initiation and development during the three super El Ni?o events. Figure 8 shows temporal evolutions of the MSE anomalies averaged over the western Pacific (5°–15°S, 120°–170°E, green box in Fig. 3). A positive MSE tendency is detected during the initiation and development stages of the MJO convection (Fig. 8a), when the OLR anomaly shows a negative tendency from day –20 to 0 (Fig. 5a). For the 2015/16 super El Ni?o event, the MSE tendency is larger than the other two events during the MJO initiation and development stages, resulting in enhanced MSE given the same time period for MJO development (from day –20 to 0), corresponding to the much stronger MJO activity. Evolutions of each column-integrated MSE budget term are displayed in Fig. 9 to inspect their respective contribution. The column-integrated MSE tendency

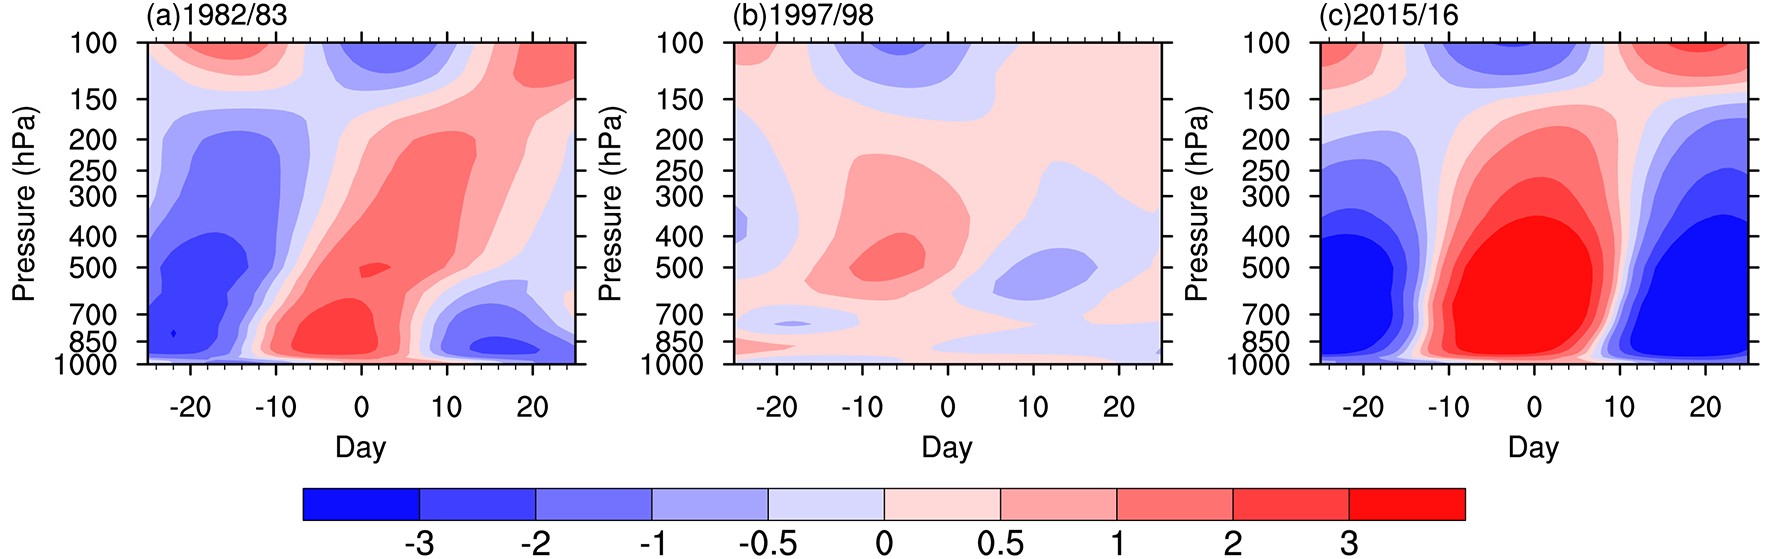 Figure8. Evolutions of intraseasonal MSE anomalies (kJ kg–1) over the western Pacific (120°–170°E, 5°S–15°S) during the boreal winters of (a) 1982/83, (b) 1997/98, and (c) 2015/16. Note the day 0 represents the date of maximum MJO convection.
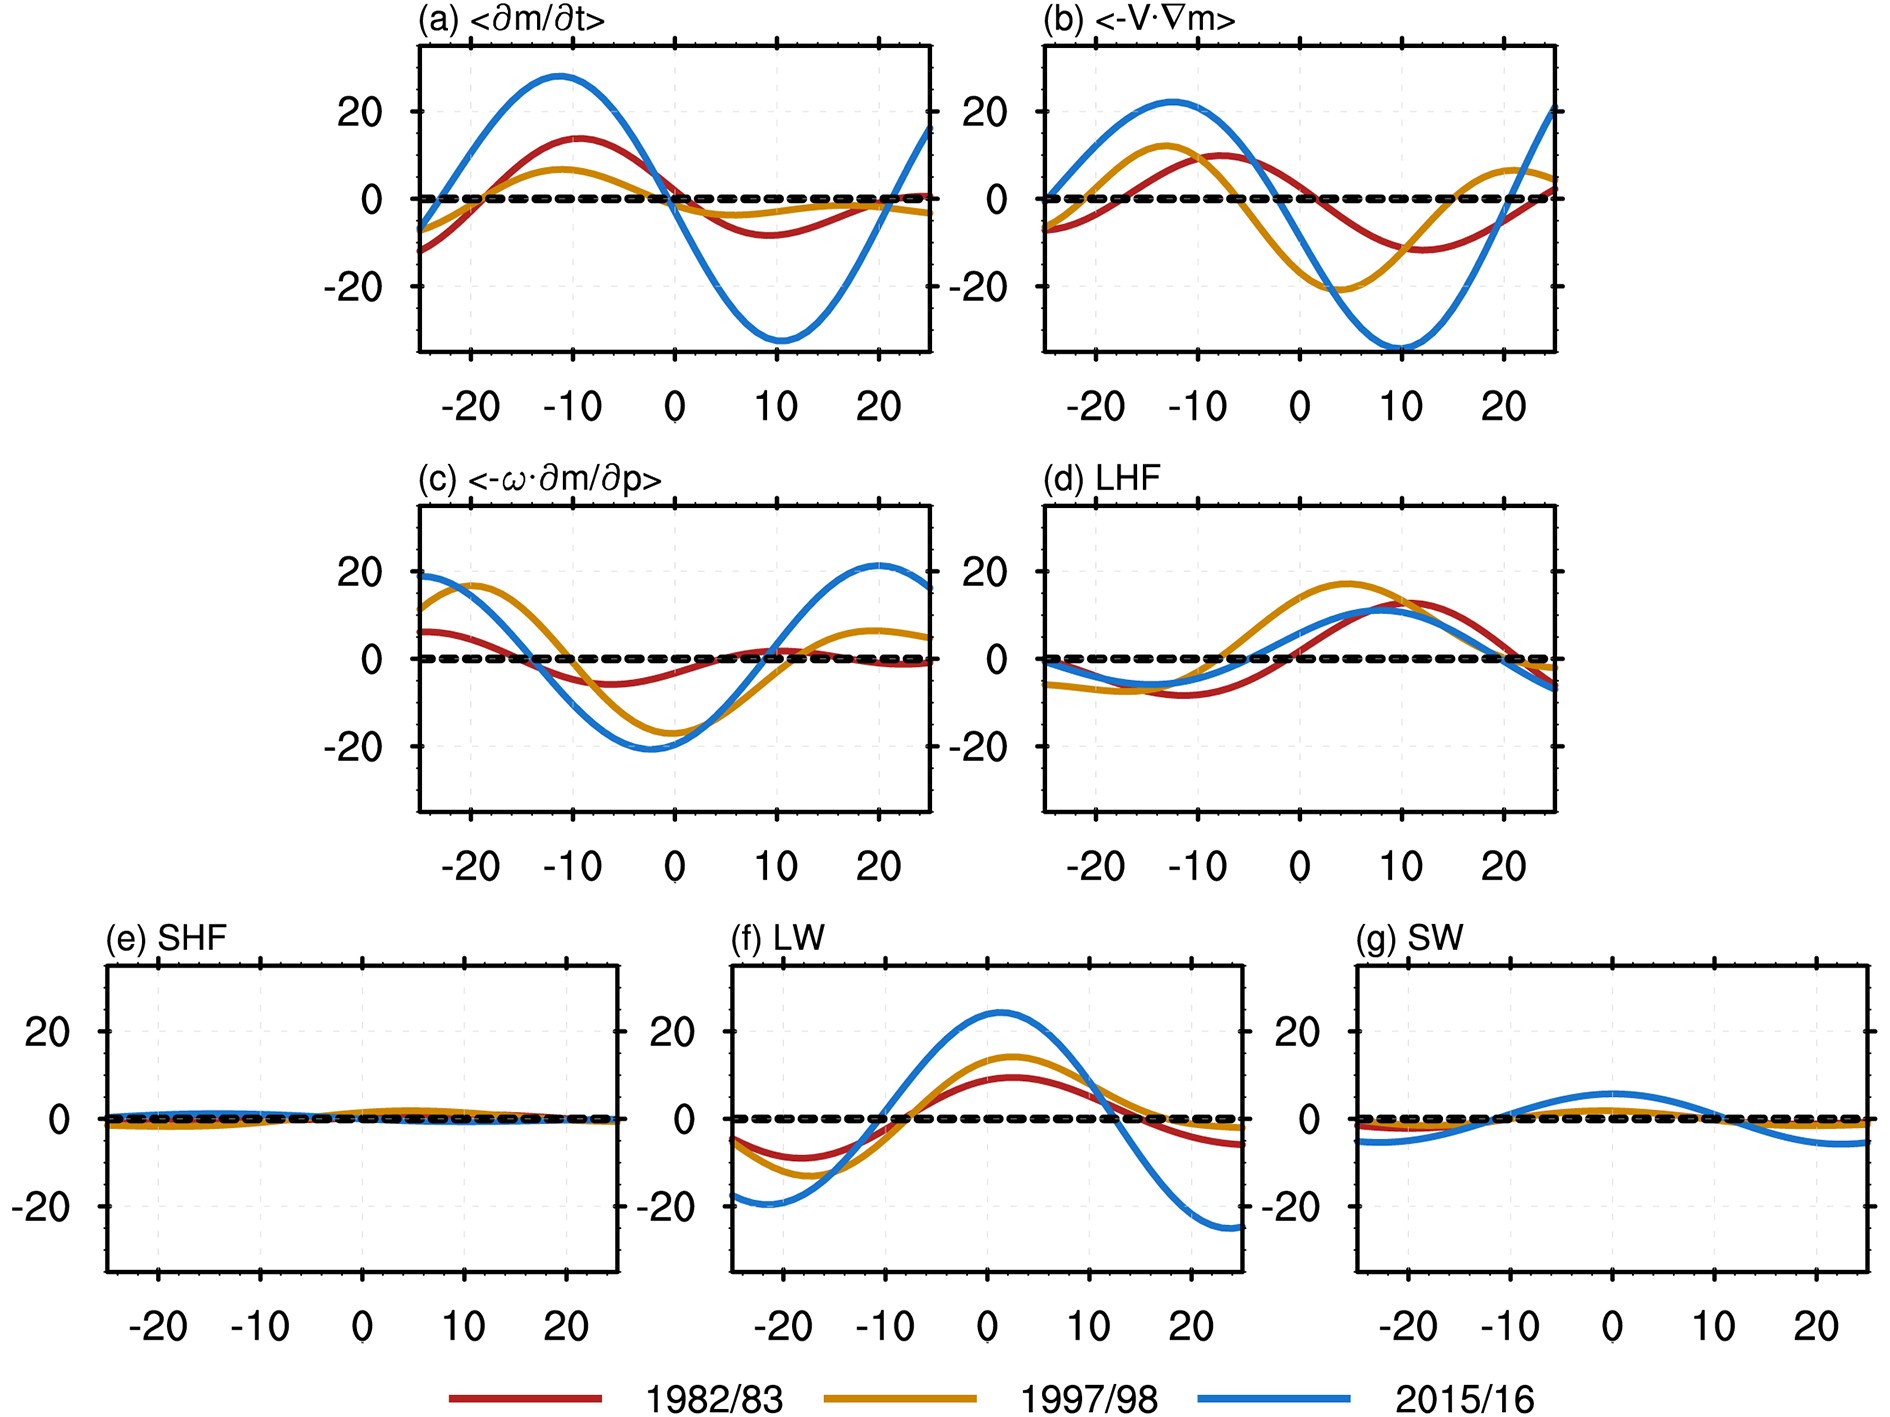 Figure9. Temporal evolutions of the column-integrated (1000–100 hPa) intraseasonal MSE budget terms (W m–2) during the boreal winters of 1982/83 (red line), 1997/98 (orange line), and 2015/16 (blue line) over the western Pacific region (120°–170°E, 5°–15°S). Day 0 denotes the date of the maximum MJO convection.
For a purely quantitative comparison, we show the changes in amplitude of each budget term over the western Pacific during the initiation and development stages of the MJO convection (from day ?20 to day 0). The differences in the MSE budget terms between the 2015/16 super El Ni?o and the other two super El Ni?o events are displayed in Fig. 10a. Note that the sum of the right-hand side terms is approximate to the left-hand side term (i.e., the MSE tendency), suggesting that our calculations are nearly balanced. The growth rate of MSE

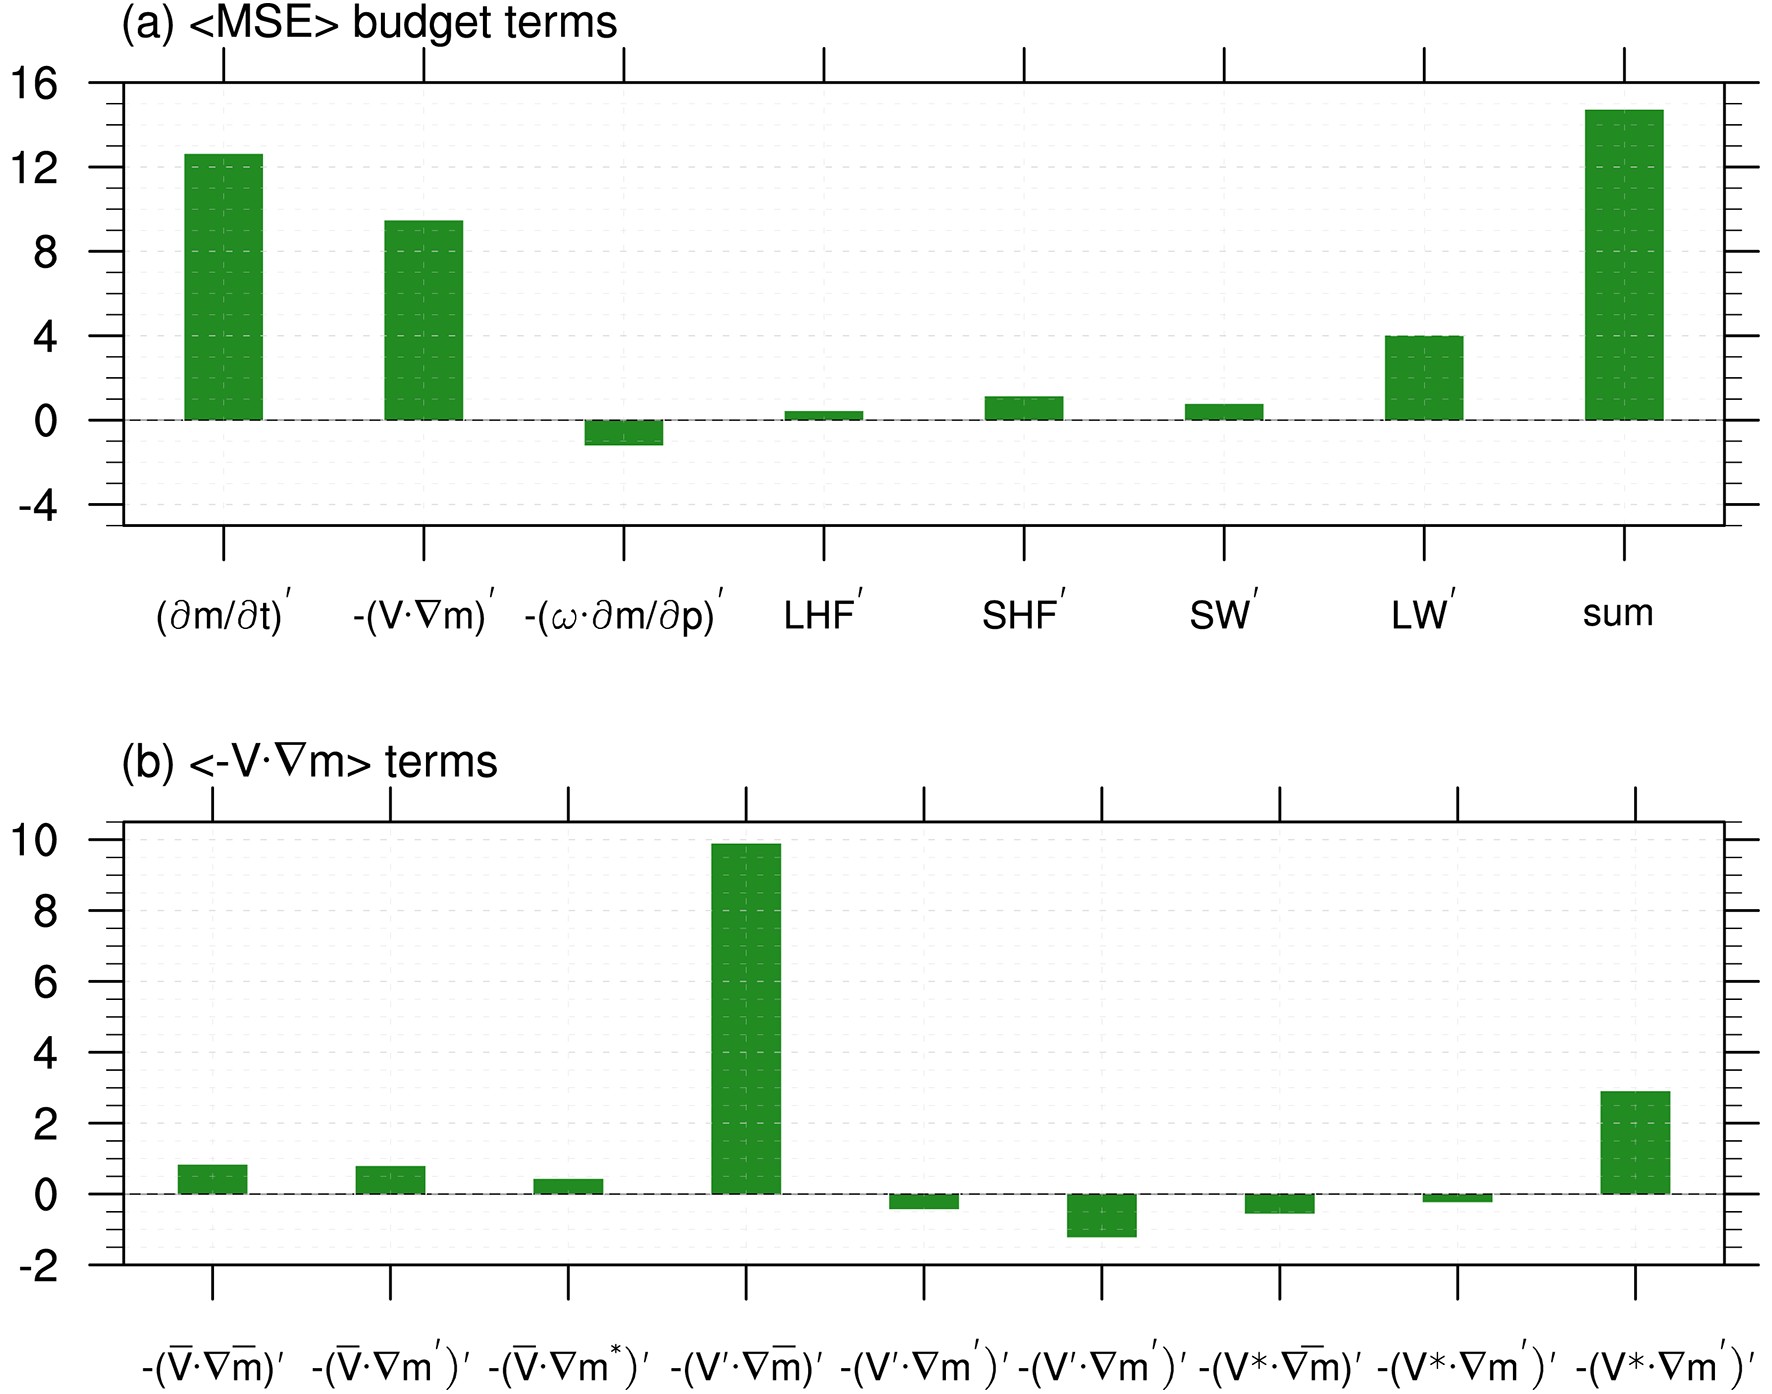 Figure10. Differences of column-integrated (1000–100 hPa) intraseasonal (a) MSE budget terms (W m?2) and (b) individual terms of
The decomposition of different time-scale interactions is the same as with Eqs. (4–5). As shown in Fig. 10b, the increased horizontal MSE advection in the 2015/16 super El Ni?o event is mostly attributable to the strengthened horizontal advection of the LFBS MSE by MJO-related horizontal wind. This result highlights the importance of interaction between the LFBS MSE and the MJO-related horizontal wind anomalies, as also revealed from the low-level moisture diagnosis (Figs. 6b, 7c). Figure 11 displays the vertically (1000–100 hPa) averaged distributions of LFBS MSE and intraseasonal horizontal wind anomalies. The boreal winters of 1982/83 and 1997/98 show negative LBFS MSE anomalies over the western Pacific (Figs. 11a, b), which are related to the below average SST anomalies (CpT) (Figs. 4a, b) and the below average moisture (Lq) (Figs. 7a, b). In contrast, the LBFS MSE is increased over the western equatorial Pacific during boreal winter of the 2015/16 super El Ni?o (Fig 11c), which is closely related to the westward displacement of the warm SSTAs and convection (Fig. 4c). The MJO-related wind anomalies tend to transport the relatively higher MSE toward the western Pacific, causing the increased MSE over the active MJO region (Figs. 11c and d). The MSE diagnostic results suggest that the warmer SSTs and thus low-level moistening during the 2015/16 super El Ni?o event could be the key factors responsible for the stronger MJO through enhancing the MSE over the western Pacific.
 Figure11. Vertically averaged (1000–100 hPa) LFBS MSE anomalies (shading, 1 × 10³ J kg?1) and low-level (1000–700 hPa) MJO-related zonal wind anomalies (vectors, m s?1) for (a) 1982/1983, (b) 1997/1998, (c) 2015/2016, and (d) difference between 2015/16 and the average of 1982/83 and 1997/98 from day ?20 to day 0. The green boxes denote the western tropical Pacific (5°–15°S, 120°–170°E).
In the above analyses, the intraseasonal wind difference is accompanied with the MJO itself. It is not easy to establish a direct relationship between the MJO-related and ENSO-related variability, although the intraseasonal variability can be modulated by the background state. To illustrate direct contribution of the LFBS fields (


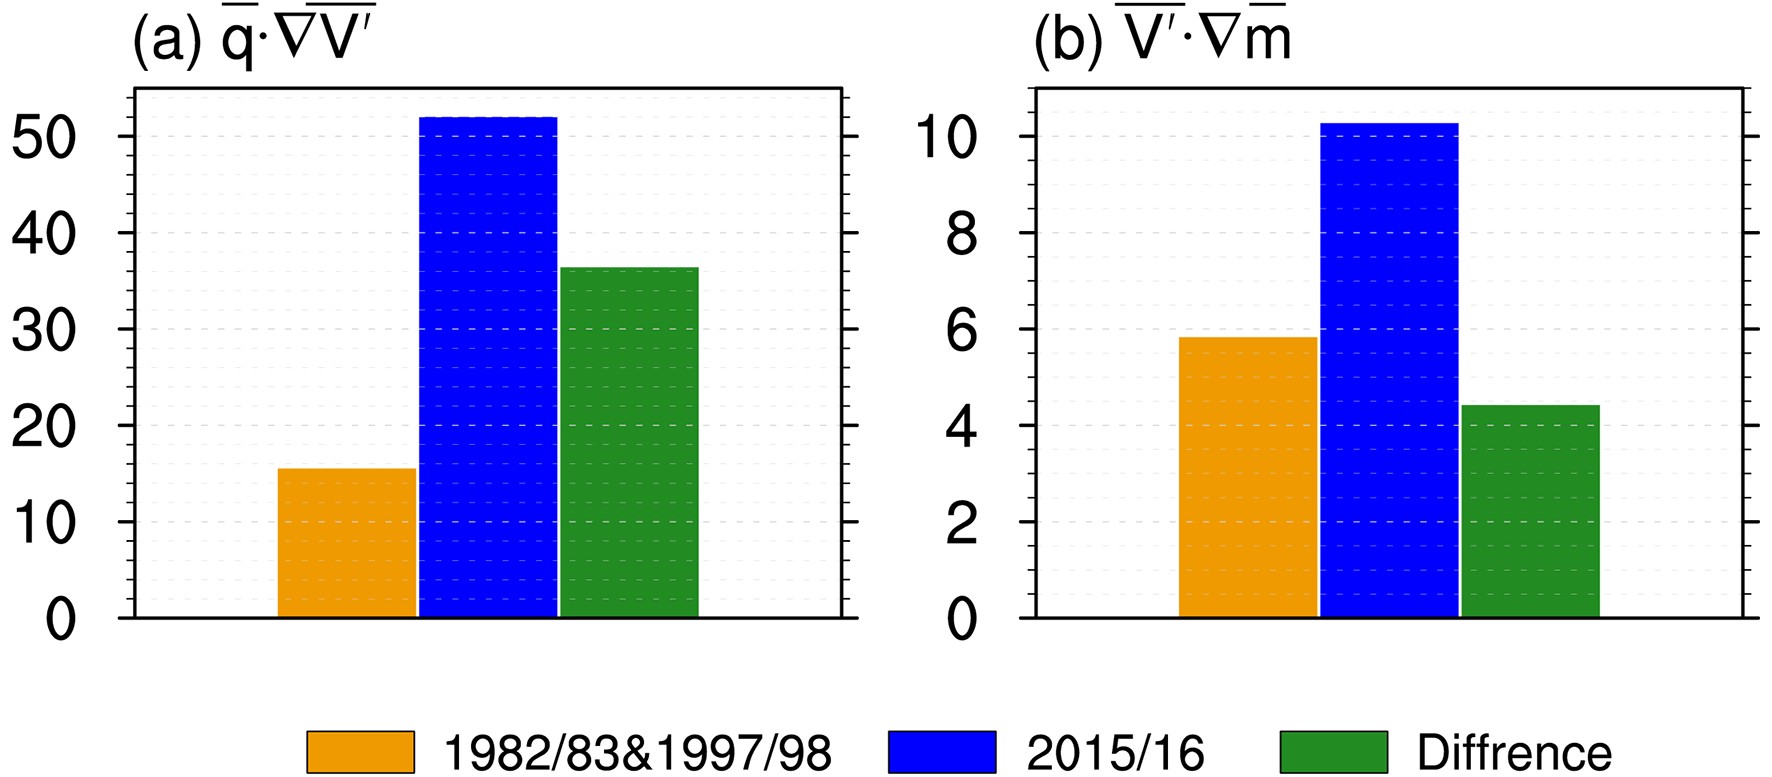 Figure12. Column-integrated intraseasonal (a)


Previous studies have revealed different MJO features, in terms of intensity and propagation, for the eastern Pacific (EP) and central Pacific (CP) El Ni?o. The MJO intensity and El Ni?o amplitude exhibit a certain degree of linear relationship for the EP and CP El Ni?o, respectively (Gushchina and Dewitte, 2012; Feng et al., 2015; Chen et al., 2016; Hsu and Xiao, 2017; Wang et al., 2018). Our study finds that MJO intensity is very sensitive to SSTA zonal location of El Ni?o, even the super El Ni?o (usually regarded as a same type) events have different impact. It highlights that the ENSO zonal structure and SSTA distribution need to be considered due to their possible modulations on MJO development. Only three super El Ni?o events are investigated to observe their differences in this study. However, to which extent the normal El Ni?o spatial SSTA patterns modulate on MJO development remains unclear and deserves further investigation.
Acknowledgements. This work was supported by the National Key R&D Program of China (2018YFC1505804), and the National Nature Science Foundation of China (42088101).
