HTML
--> --> -->| Dataset Profile | |
| Dataset title | Homogenized daily relative humidity series in China during 1960–2017 |
| Time range | Daily surface relative humidity from 1960 to 2017 |
| Geographical scope | Chinese mainland |
| Data format | ".txt" |
| Data volume | 75.64 MB for the daily relative humidity series, 41.14 KB for the station information |
| Data service system | http://www.sciencedb.cn/dataSet/handle/804, DOI: 10.11922/sciencedb.804 |
| Sources of Funding | Chinese Academy of Sciences projects (XDA19030402 and XDA20020201) for Yan & Li and the UK–China Research & Innovation Partnership Fund through the Met Office Climate Science for Service Partnership (CSSP) China as part of the Newton Fund (SFBT & NF). |
| Dataset composition | The dataset contains a station information file named “station information.xlsx” and the homogenized RH file named “homogenized_daily_RH_746stations_1960_2017_uploaded.txt”. |
Undoubtedly, it is beneficial to homogenize station RH series before applying in climatic change and attribution studies. Byrne and O’Gorman (2016) found that RH tended to increase slightly over oceans but had substantially decreased over lands. This decreasing trend appeared more significant since 2000 (Simmons et al., 2010; Willett et al., 2014). However, Dai (2006) found a decreasing trend in RH over oceans, but without a significant trend over lands during 1976–2004. It was noted that the inhomogeneity due to changes of instruments in the early 1970s caused negative jumps in the RH series at 69% of Canadian stations (Vincent et al., 2007). In the US, the RH series suffered inhomogeneity mainly prior to 1950, while showing little trend for the period 1947–2010 (Brown and Degaetano, 2013).
Song et al. (2012) found that RH declined in most of China during 1961–2010, with a sharp decrease after 2003. However, many studies have indicated that the change of observation system from manual to automated should be the main reason for the recent declining of RH, especially in humid areas (Yu and Mou, 2008; Yuan et al., 2010). RH was measured using psychrometers in previous manual observations, but via advanced humidity-sensitive capacitors at automated stations. The former, with the parameterized psychrometric coefficient A adjusted according to former Soviet Union standards, systematically overestimated RH in general in China (Hu, 2004). By evaluating the differences between automatic and manual observations of RH at 131 national base meteorological stations in China during 1997–2006, Zhao et al. (2011) found such systematic biases for 76.2% of the stations. Yu and Mou (2008) estimated that manual observations of RH were, on average, about 3.5% larger than the automatic records, and this bias was especially obvious in warm and humid zones. Zhu et al. (2015) analyzed monthly RH series from 2413 stations in China during 1951–2014 and found that the break points in the RH series were caused mainly by the change from manual to automated observation, relocation, and change of the observing times in a day. Zhao and Zhu (2017) then developed a gridded dataset of monthly RH in China with a 0.5° × 0.5° resolution by using their adjusted station observations. This dataset showed a decreasing trend in the national average RH series since 1951 of about ?0.12% (10 yr)?1. However, according to the recent Blue Paper on Climate Change in China (2019), which used updated homogenized data developed at the National Meteorological Information Center (NMIC), there was no significant trend of RH in China during 1961–2018.
Although previous studies have made efforts to detect and adjust inhomogeneous biases in RH observations, there is not yet a homogenized dataset of station daily RH series in China available for public and research applications. In this study, we present a homogenized daily RH dataset in China, by using the Pettitt test, moving t-test, and Multiple Analysis of Series for Homogenization (MASH; Szentimrey, 1999, 2008). The geographical pattern of trends in RH and the regional mean trend based on the adjusted data are presented and compared with those based on the raw data, in order to understand the influence of inhomogeneous biases. Three stations are analyzed in order to compare with the adjustments based on the RHtest method (Wang and Feng, 2013) with metadata, to help with validating the results. The data and methods used in this study are explained in section 2; the results are presented in section 3; and a summary is provided in section 4.
2.1. Raw daily RH records
The raw daily RH records during 1960–2017 at 819 National Reference and Basic Stations in Chinese mainland were collected from the NMIC of the China Meteorological Administration, available via http://data.cma.cn/. Only 746 stations with fewer than 366 missing records during the whole period were chosen in the present study. Considering different climatic regimes and perceived effects of elevation on the results of homogenization, the stations were divided into two subregions as shown in Fig. 1a. Subregion I includes 293 stations in western China, including the Tibetan Plateau, while Subregion II includes 453 stations in eastern China, in accordance with the basic geographical regionalization by Wang et al. (1998). Figure 1b shows the locations of the three case stations [Hequ (HQ) in Shanxi Province, Guazhou (GZ) in Gansu Province, Tongdao (TD) in Hunan Province], each with nine reference stations used in MASH.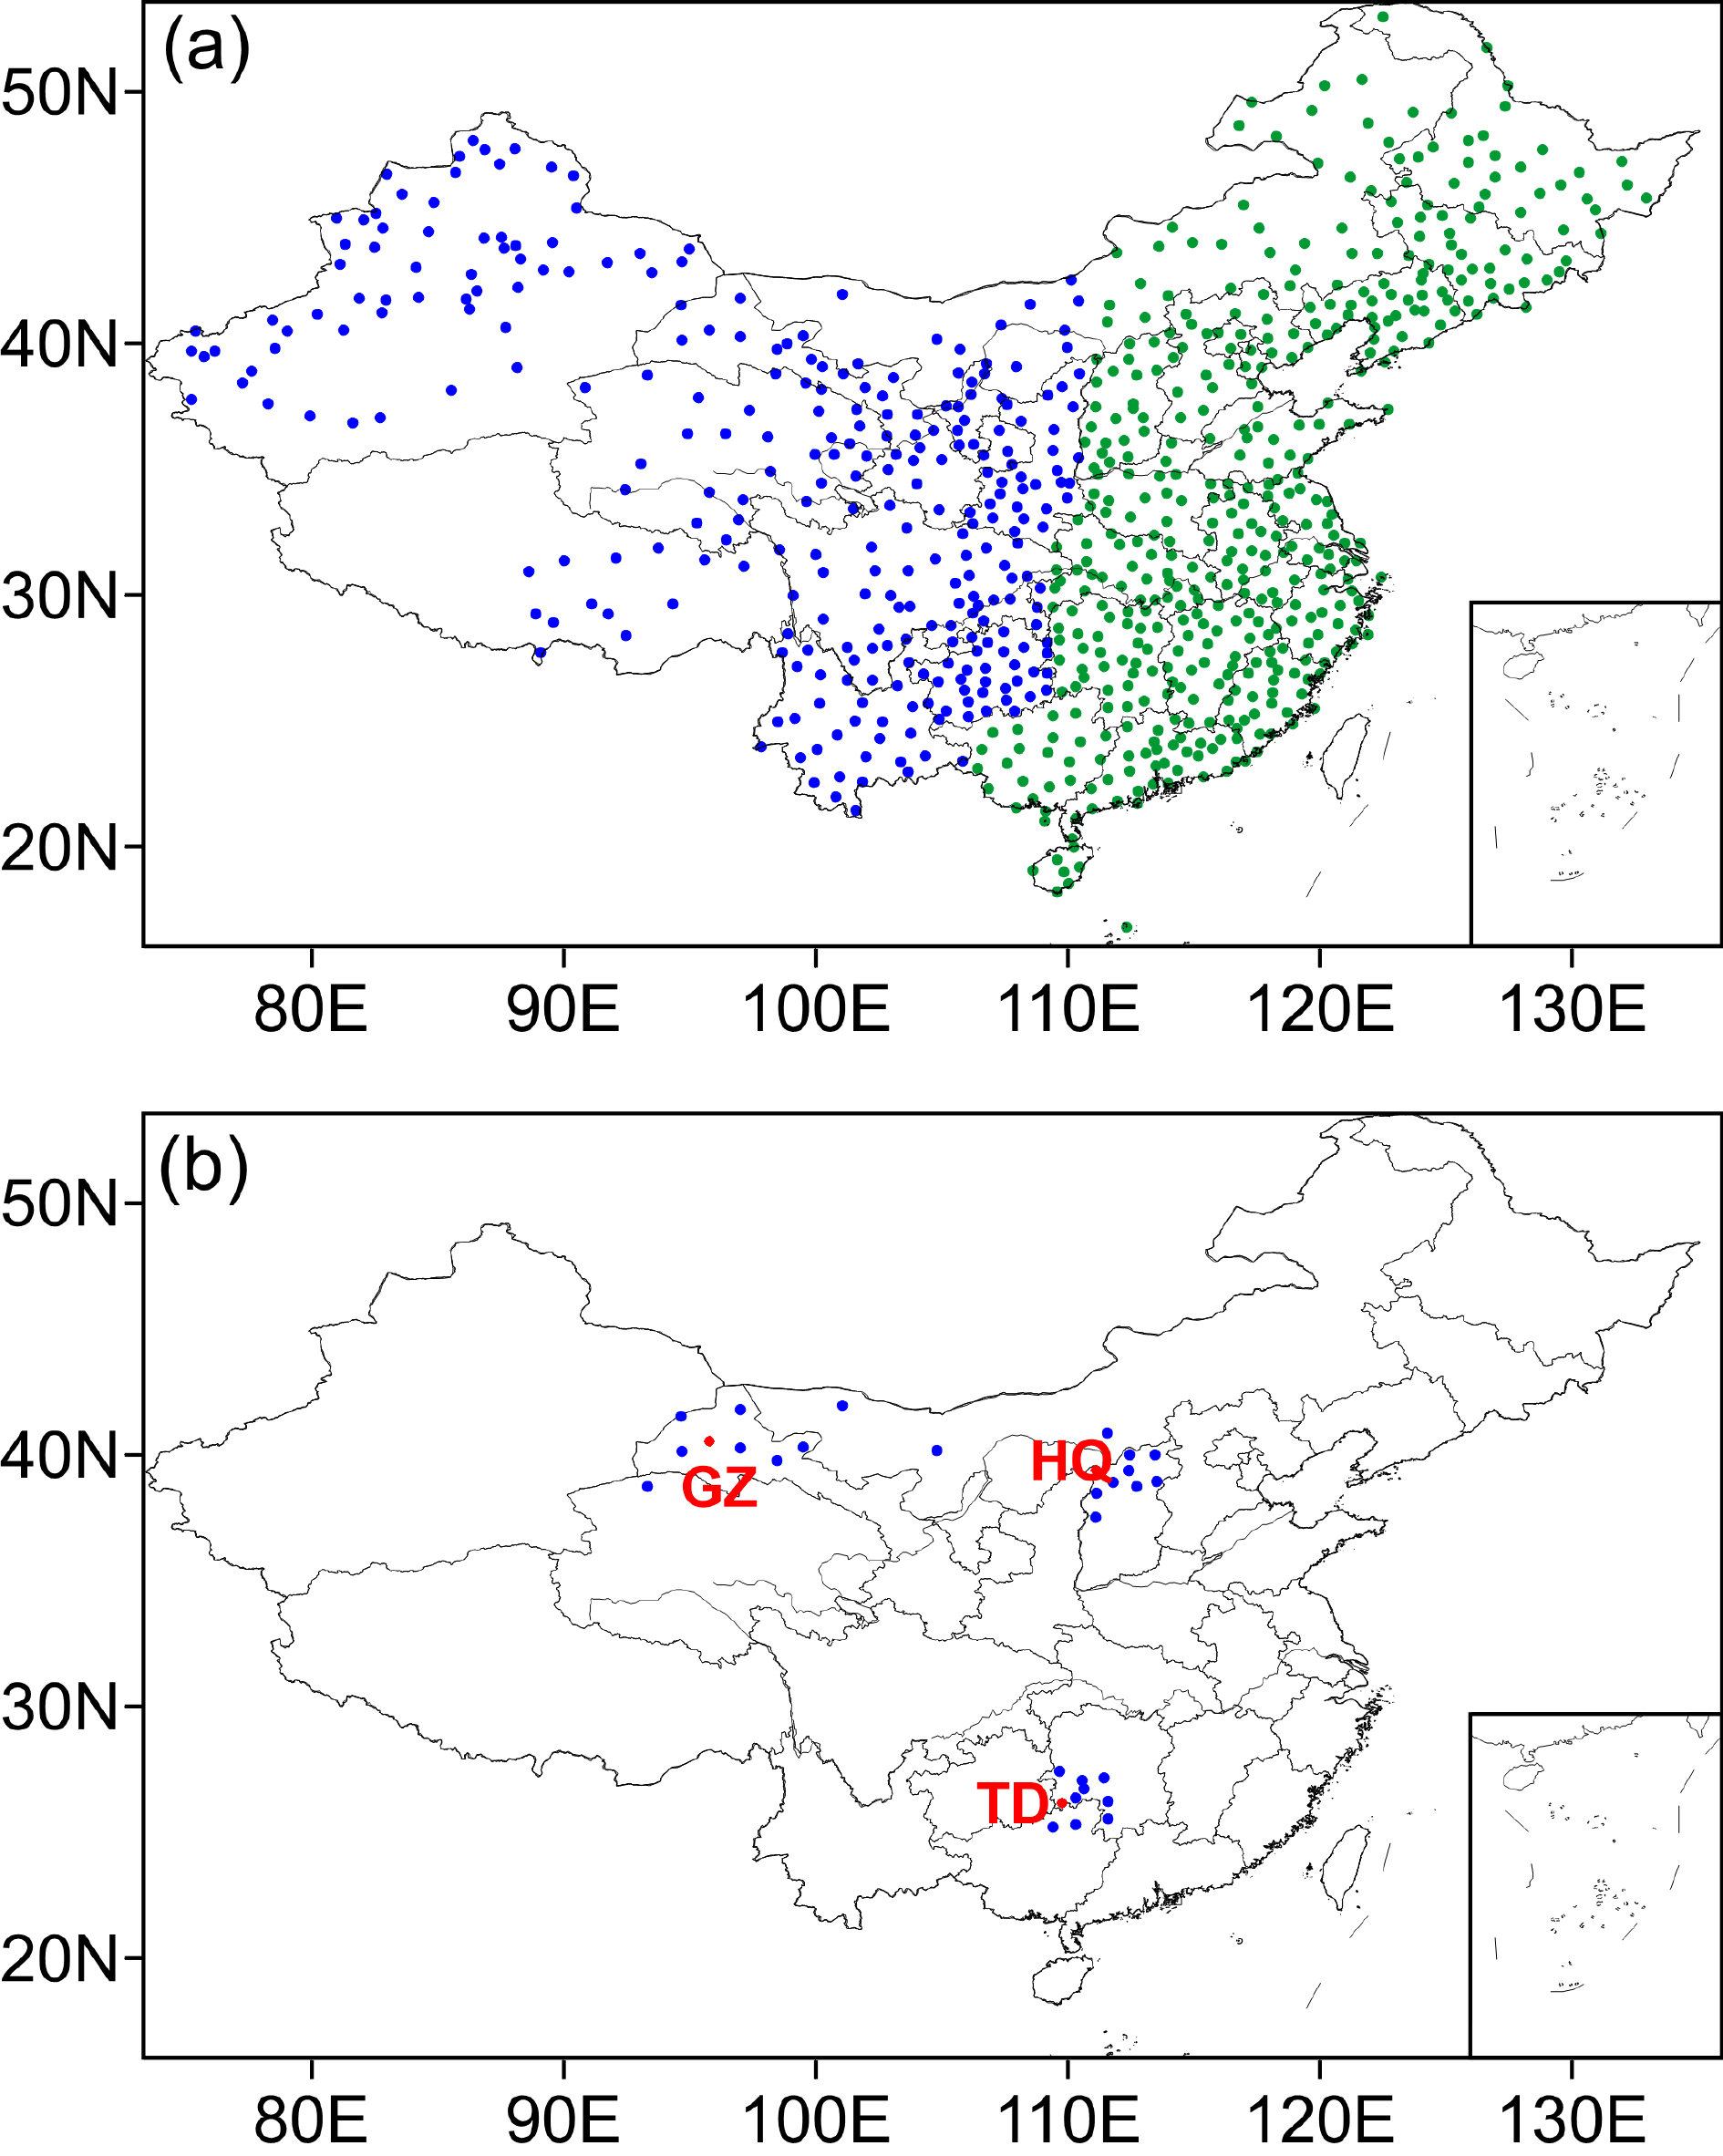 Figure1. (a) Geographical distribution of 746 meteorological stations in China used in this study. The stations in Subregions I/II are marked with blue/green dots. (b) Three case stations (red dots) and nine reference stations (blue dots) for each candidate station as defined in MASH.
There were 12?503 missing daily records involving 481 stations, accounting for 0.08% of all daily records (21?185 days × 746 stations). To facilitate application of the MASH software, we replaced the missing code by the climatological mean value of the same calendar day for the given station. The influence of the few such interpolated values on the result of homogenization was negligible. It is worthwhile noting that the mean climatological values were far from the real RH values of the missing code days in cases of extreme weather. However, in such cases, the interpolated mean values can be identified as outliers and adjusted according to neighboring station records by MASH.
2
2.2. Metadata at three case stations
Many methods of homogenization, such as MASH, can detect and adjust major inhomogeneous biases in climate series with or without the metadata. Nevertheless, the metadata are helpful for validating any adjustments. While most stations’ metadata remain unavailable for the present study, we obtained key information of three case stations, including the times of relocation and the start of automation (Table 1). These will be used to illustrate the reliability of the present results.| Station No. | Latitude | Longitude | Station name | Abbr. | Relocation | Automation |
| 53564 | 39.38°N | 111.15°E | Hequ | HQ | 1974 | 2003 |
| 52424 | 40.53°N | 95.78°E | Guazhou | GZ | 1999 | 2004 |
| 57845 | 26.17°N | 109.78°E | Tongdao | TD | ? | 2003 |
Table1. Documented times of relocation and automation at three case stations.
2
2.3. ERA5
The latest reanalysis dataset from the European Center for Medium-Range Weather Forecasts (ECMWF), ERA5 (Hersbach et al., 2019), is also used for comparative analysis of RH series for the region in the present study. ERA5 assimilates RH data over China according to the document available at2
2.4. Methods
32.4.1. MASH
MASH is a well-developed method for homogenizing climate series (Szentimrey, 1999, 2008), essentially based on mutual comparisons of statistical quantities of series among a number of stations in a climate region. The examined series can be expressed aswhere C is climate, IH is inhomogeneity, and

3
2.4.2. Pettitt test and moving t-test
The Pettitt test is used to identify abrupt change points in the annual mean RH series (AMRHS) during 1960–2017 for each station. It is a non-parametric technique to identify the change point in a time series (Pettitt, 1979), based on the Mann–Whitney two-sample test (rank-based test). The Pettitt test allows the detection of a single sharp shift in a time series (Mallakpour and Gabriele, 2016). It has been widely employed in hydro-climatological studies to detect abrupt change in the mean of the distribution of variables such as temperature (Herrera-Grimaldi et al., 2018), precipitation (Arab Amiri et al., 2017), evapotranspiration (Qiu et al., 2013), and groundwater storage (Yeh, 2018). In the present study, a change point occurs at time t when the statistic KT is significantly different from zero at the 0.1 significance level.We also use the moving t-test (Wei, 2007) to identify whether there are any relatively sharp changes in the AMRHS at a decadal scale. The length of the subsequences used in the moving test is 10 years. If the value of the statistic |ti| reaches a maximum that is significant at a = 0.1, the time (t) is regarded as a potential change point.
The observing system for RH was changed from manual to automatic during 2004–07 for most stations (Zhu et al., 2015). Although such instrumental changes undoubtedly caused inhomogeneous biases, they could be blurred by strong interannual climate variability at individual stations. Therefore, we used a relatively loose significance level (0.1) here for applying the tests to confirm the break point associated with automation. It is noted that homogenization methods such as MASH rarely detect simultaneous break points such as those caused by implementing automation across China in the early 2000s, because these methods are based on mutual comparisons among neighboring stations. Therefore, we first apply the Pettitt test to detect whether the most prominent break point in the AMRHS happened in the early 2000s associated with automation at each station. Then, we apply the moving t-test to further detect possible jumps during 2000–07, which might be overlooked by the Pettitt test, in case a more prominent change happened before the 2000s. The results so far tell the number of stations where implementing automatic observation caused the most prominent break in the observation series. Having preliminarily adjusted the nearly simultaneous automation-related biases based on the Pettitt test and t-test, we apply MASH to all station series in order to detect possible break points due to non-natural changes in the earlier years as well as those likely induced by the preliminary adjustments in the 2000s.
3
2.4.3. Other methods used
The linear trends in the raw and adjusted AMRHS during 1960–2017 are estimated via the least-squares linear fitting method. A trend is considered as statistically significant by the t-test at the 0.05 significance level.3.1. Detection and adjustment of the change point due to automation
The change in the observing system in China from manual to automated took place mostly during 2004–07 (Zhu et al., 2015). Such simultaneous changes are difficult to detect via any homogenization method like MASH, which depend on mutual comparisons among neighboring stations’ observations. Therefore, we firstly applied the Pettitt test and moving t-test to the AMRHS for each station, to judge whether there was a change (break) point in the 2000s.Based on the Pettitt test, 99 stations’ AMRHS have a significant break point (a = 0.1) during the early 2000s, implying that the sharpest change in the RH series for these stations could be due to the change from manual to automated observation. As an example, Fig. 2a shows that the AMRHS of Napo station (Guangxi Province) has a significant break point around 2004 as detected via the Pettitt test. For these stations, we adjusted the sub-series of RH before the change point. The adjustment is calculated as the difference between the mean level of RH of the three years after the change point and that of the three years before the change point. The use of a three-year-mean level in the adjustment helps to reduce the influence of interannual climate variability, while avoiding much of the bias in the long-term trend around the change point (Yan et al., 2010, 2014). Considering that the Pettitt test tends to overlook minor change points in the series, we applied the moving t-test (a = 0.1) to the AMRHSs of the remaining 647 stations. Of those stations, 544 exhibit a significant drop during 2000–07. This drop is assumed to be due to the change from manual to automated observation and therefore also adjusted in the same way as mentioned above. Figure 2b shows an example of the abrupt jump in the AMRHS of Shuangfeng station (Hunan Province) around 2003 as detected via the moving t-test.
 Figure2. (a) Case of Pettitt test statistic vs the AMRHS at Napo station. (b) Case of moving t-test statistic vs the AMRHS at Shuangfeng station, in which the vertical dashed line indicates the significant break point (α = 0.1). (c) Number of stations with a change point during 2000–07. (d) Geographical distribution of the times of change points in the RH series at 643 affected stations. (e) Raw vs adjusted mean AMRHS of the 643 stations.
In total there are 643 station series detected as inhomogeneous in association with the systematic change in the early 2000s, and then adjusted. Figure 2c shows the number of stations with significant change during 2000–07 detected by the Pettitt test or moving t-test. During 2000–07, there are 50–80 stations each year with a change point; in 2004 there are over 150 such stations. Figure 2d shows the geographical distribution of the times (years) of change points at 643 stations during 2000–07, indicating the process of implementation of the automated system across the country around 2004. As Fig. 2e shows, the mean of the adjusted data of the 643 stations is lower than that of the raw data before the change point around 2003–04. The systematic change leads to a sharp decreasing trend in the raw data of about ?0.461% (10 yr)?1. In contrast, the adjusted data have a very minor trend of about 0.026% (10 yr)?1. In short, the present results indicate that the implementation of the automated system caused widespread drops in the RH records and false declining trends at many stations in China, consistent with previous studies (Zhu et al., 2015; Yuan et al., 2010; Zhao et al., 2011). Note that the adjustment so far does not necessarily remove all of the inhomogeneity.
2
3.2. Further homogenization of the daily RH series by MASH
For possible break points due to changes in the local observation system that did not happen simultaneously in a large region, it is reasonable to apply MASH to homogenize the RH series. Having preliminarily adjusted the biased mean level at 643 stations due to the change from manual to automatic observation, we applied MASH to the daily RH series for all stations in the same subregion (I or II). Figure 3a shows the PDF of the non-zero daily adjustments by MASH. Two peaks are around ?0.5% and 0.5%, respectively, indicating the magnitude of most detected biases in the daily RH records due to various local causes. Figure 3b shows the number of total break points in the AMRHS at all the 746 stations during 1960–2017. There are 4395 break points in the RH series at 685 (accounting for 91.82% of all) stations during 1960–2017, detected by MASH. The number of break points in a year remains about 50–80 before the early 2000s, which reflects the extent of influence of non-natural changes, such as relocation, instrumental adjustment, and change of observing rules, in RH observations. This number increases to more than 100 after 2002 until recently. The reasons include: (1) the preliminary adjustment of RH series via the Pettitt test or moving t-test is not sufficiently correct, such that further adjustment is needed according to MASH; (2) relative to the preliminarily adjusted series, some of those unadjusted series become inhomogeneous via mutual comparisons with neighboring stations in MASH; and (3) timely adjustments in the automated observing systems in recent years cause new inhomogeneity. Most of the break points occurred at the stations located in humid and semi-humid zones of China (figures omitted), suggesting that the observation of RH in these zones is more easily biased due to changes in the local observing system, or more easily detected either because change is larger or noise is smaller, than elsewhere in China.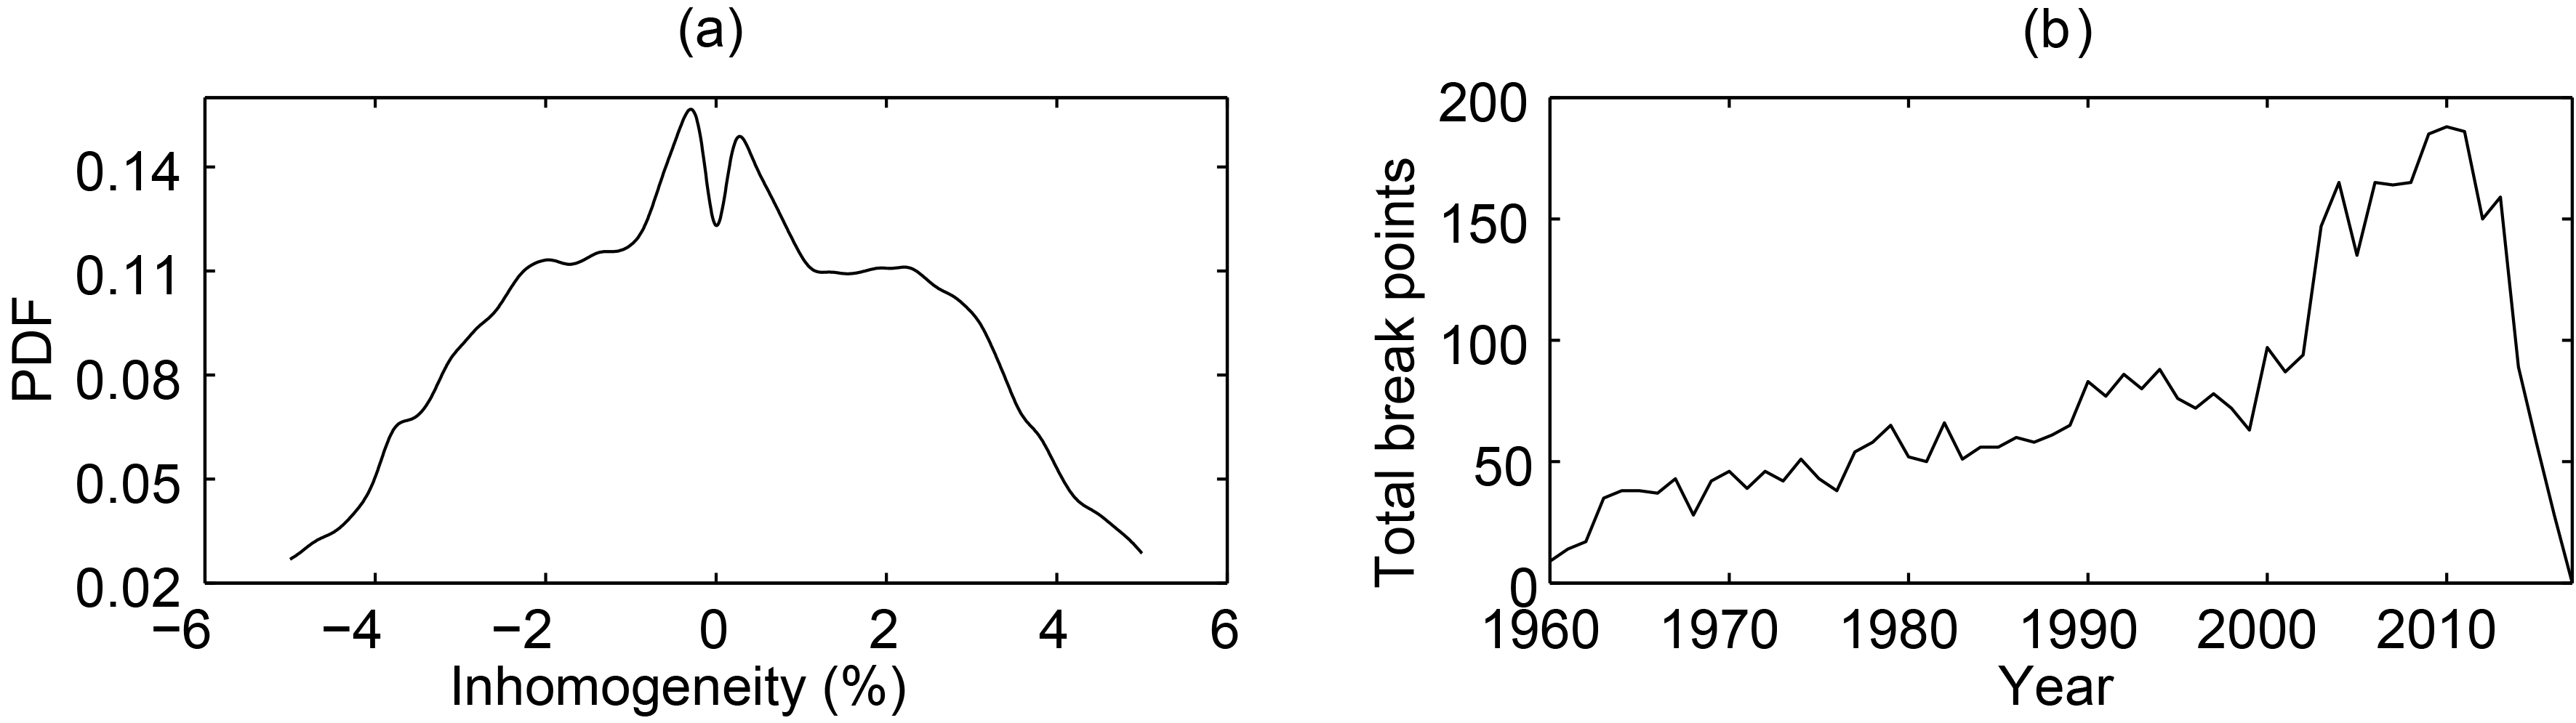 Figure3. (a) Probability density function (PDF) of non-zero daily RH adjustments for all stations estimated by MASH. (b) Number of total break points in the AMRHS of all stations.
Zhu et al. (2015) applied the RHtest method to analyze inhomogeneity in monthly RH series at 2413 stations, with metadata to help judge possible break points. To see whether the present results by MASH (without metadata) are reasonable, we chose three stations as examples. The adjusted AMRHS at these three stations based on MASH and RHtest are compared versus the raw series in Fig. 4. For HQ, it was moved in 1974 with a change of elevation from 32 to 861 m and the observation system was changed to automation in 2003. Both methods found the break point in 1974 in association with the relocation, which caused a sharp rise of RH records in the time series. However, no break was found around 2003, implying that the implementation of the automated system did not induce significant bias in RH records at this station. Compared with the significant increasing trend [1.581% (10 yr)?1] in the raw series, both the adjusted series (based on different methods, MASH and RHtest) exhibit little trend (Table 2). For GZ, relocation happened in 1999 with a distance of 13.12 km and the observation system changed from manual to automated in 2004. Figure 5b shows that the differences between the raw and two adjusted series are minor, indicating limited influence of relocation and automation on RH observation at this site. For TD, the system changed to automated in 2003, leading to a sharp drop in RH, as detected as a break point by both MASH and RHtest. The raw data show a decreasing trend, while both the adjusted series show an increasing trend. However, the present adjustments are larger than those in the previous study for this site. Consequently, the linear trend in the present adjusted series is considerably larger than the previous result (Table 2). Nonetheless, these case analyses demonstrate that the adjusted data tend to exhibit more reasonable estimates of the local climatic trend than the raw data do, albeit there are differences in magnitude of adjustments based on the different methods. Another important point from these case analyses is that the RH records at TD station (in the humid zone) are prone to influence from the change from manual to automated observation (due to overestimated RH records by the early manual observation), while those at HQ and GZ (in arid/semi-arid zones) are not.
| Hequ | Guazhou | Tongdao | |
| Adjusted_MASH | 0.096 | 0.457 | 0.549 |
| Adjusted_RHtest | 0.016 | 0.498 | 0.174 |
| Raw | 1.581* | 0.502 | ?0.685 |
Table2. Linear trends in the raw and adjusted AMRHS for three case stations during 1960–2017 [% (10 yr)?1]. *Significant trend (a = 0.05).
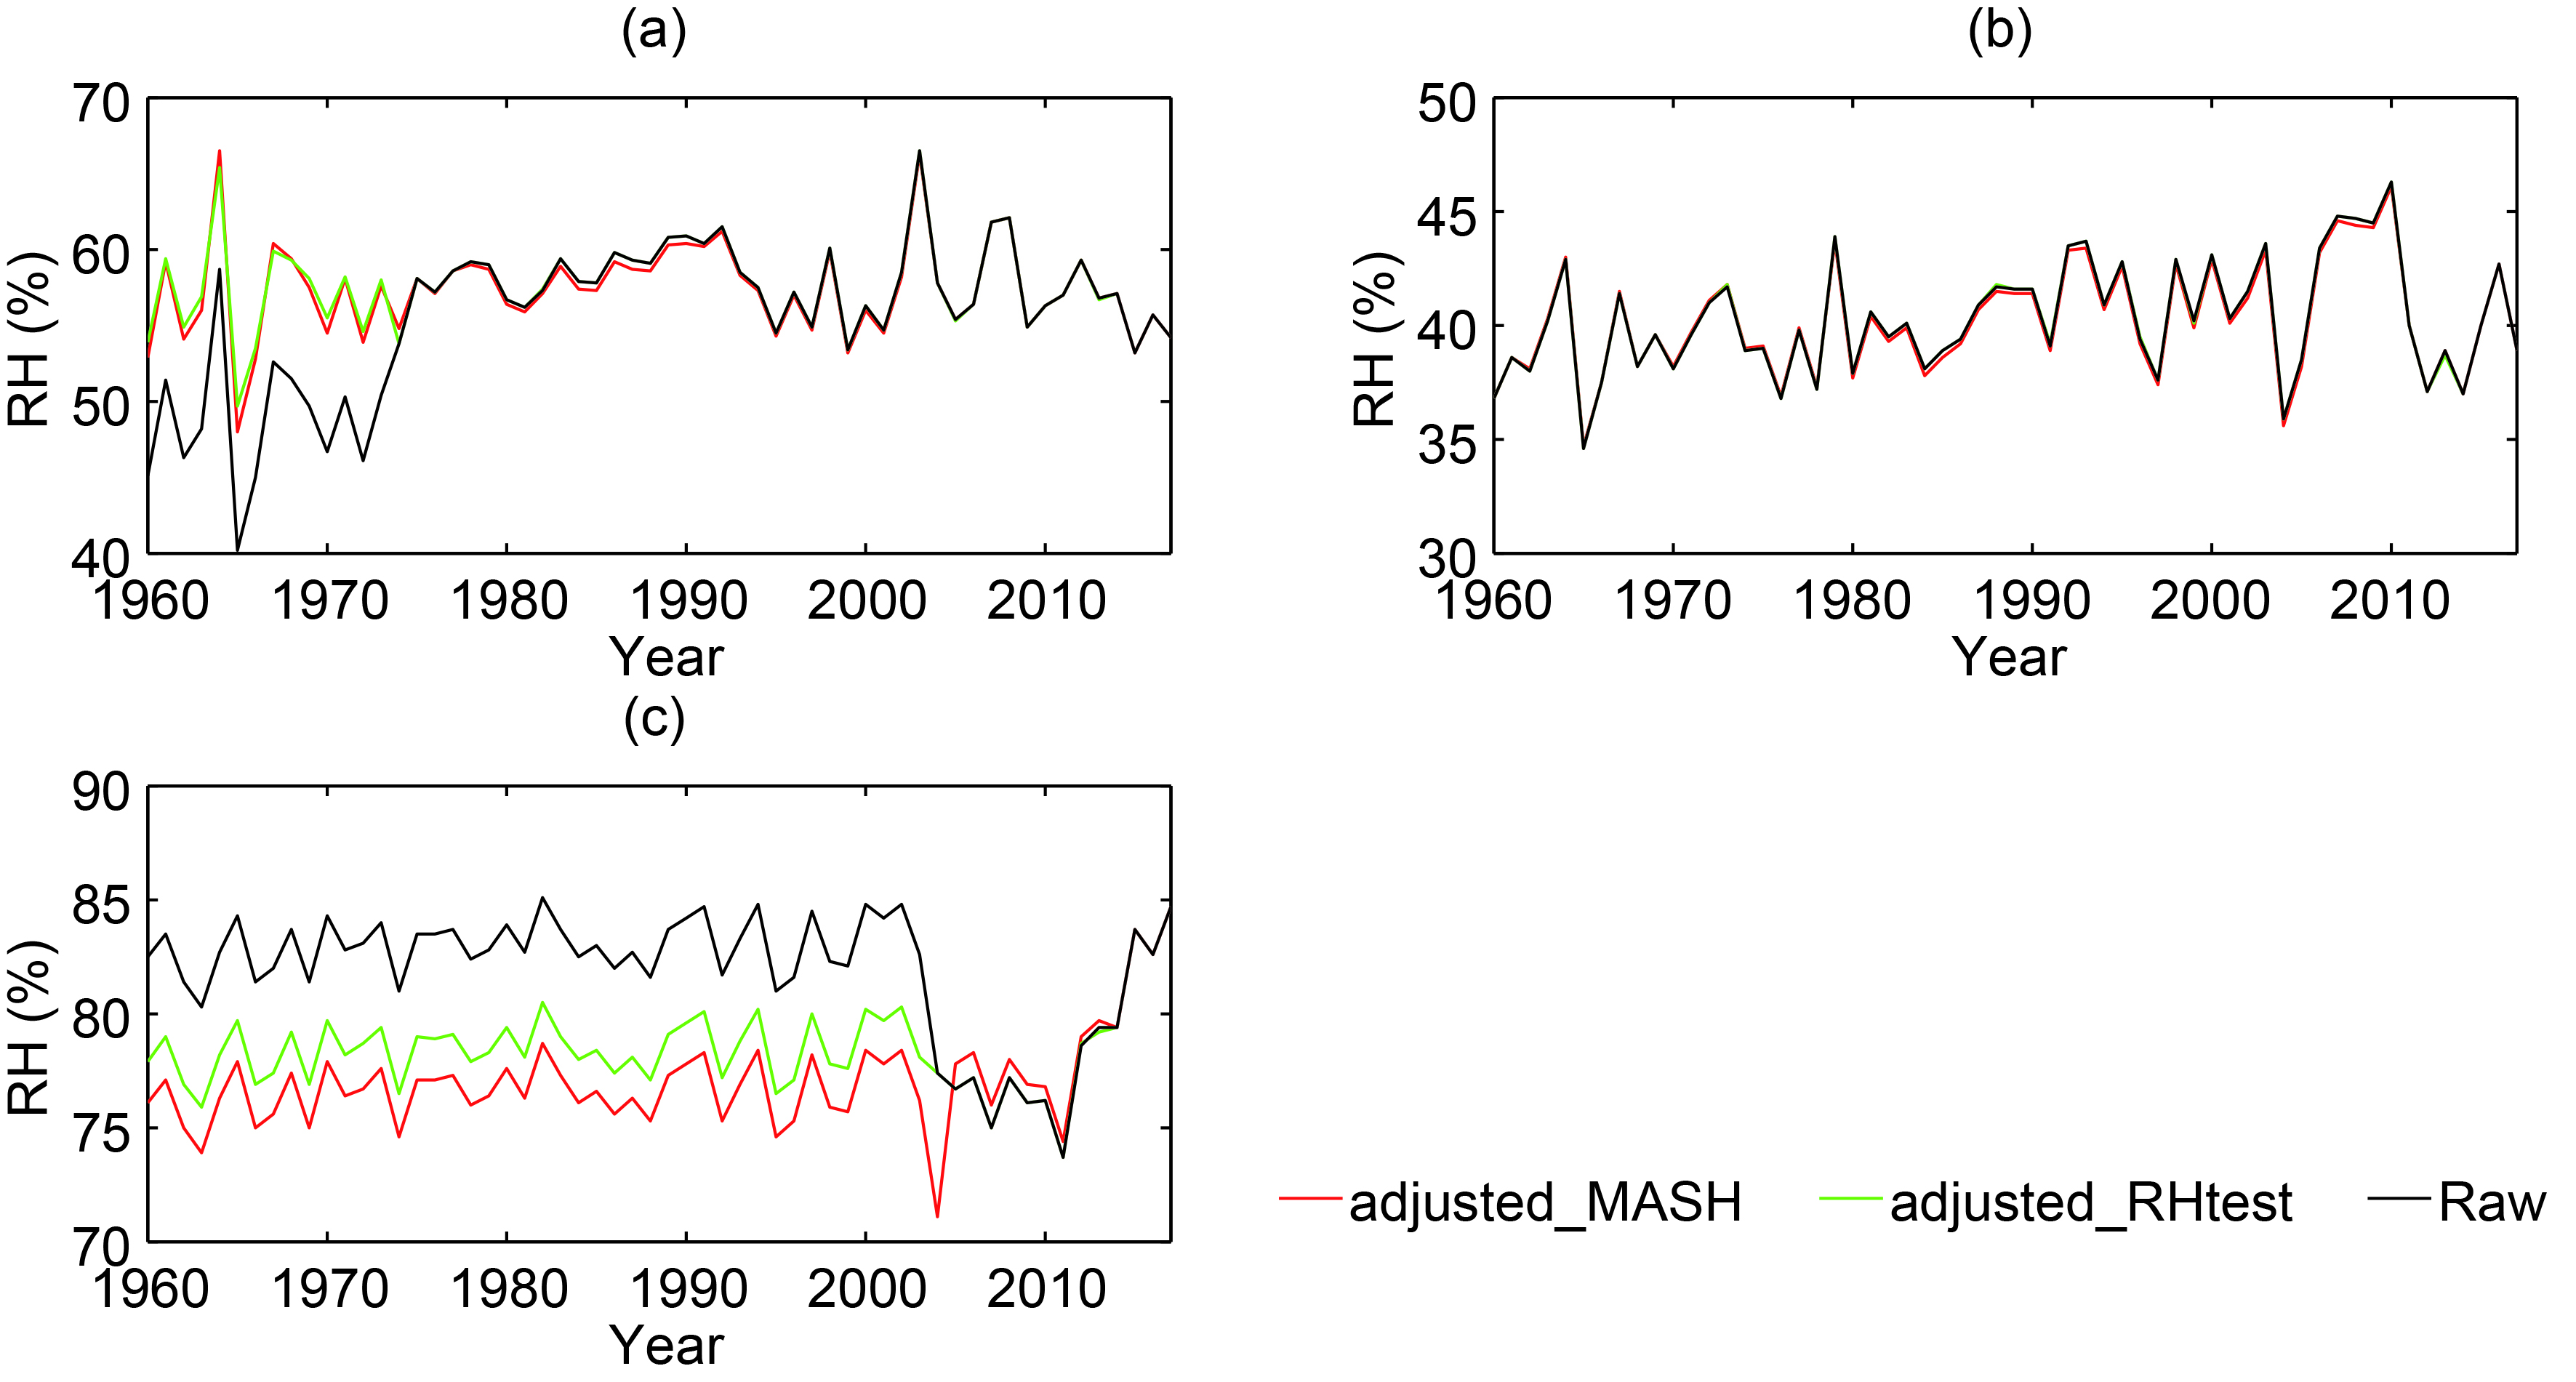 Figure4. Raw annual-mean RH time series at three stations during 1960–2017 versus the adjusted series based on MASH and RHtest. (a) Hequ; (b) Guazhou; (c) Tongdao
 Figure5. Geographical distribution of linear trends [% (10 yr)?1] in the AMRHS at 746 stations during 1960–2017 based on the (a) raw and (b) adjusted data, and (c) their differences. (d) Stations with trend changing from negative to positive after adjustment (red dots) and the remaining stations (blue dots).
In order to show the influence of inhomogeneity on climate trend estimation, the linear trend of the AMRHS over the whole period of 1960–2017 is calculated for each station, and the results based on the raw and adjusted data are compared in terms of the geographical pattern (Fig. 5). The raw data exhibit declining trends across most of China at 591 (79.22% of all) stations, mainly due to a sharp drop in RH induced by the automation in the early 2000s (Fig. 5a). In contrast, the adjusted data show slight increasing trends at 363 (48.66% of all) stations, mainly in South China, Southwest China and Northwest China; and slight decreasing trends at 383 (51.34% of all) stations, mainly in Northeast China, most part of North China, and east part of Northwest China; mainly between ?1% (10 yr)?1 and 1% (10 yr)?1 (Fig. 5b). From the differences of linear trends between the raw and adjusted data (Fig. 5c), the trends at about 80% of all stations are positively adjusted after homogenization. As shown in Figs. 5d and 6, the sign of trend is changed from negative to positive for 296 (39.68% of all) stations, mainly in humid South China.
 Figure6. Number of stations with different trends [% (10 yr)?1] for raw and adjusted_MASH data.
In terms of the regional mean AMRHS of China, the raw data are about 2% larger than the homogenized data from 1960 to 2004, clearly due to the change from the manual to automated system (Fig. 7a). Hence, the raw data series presents a declining trend [?0.414% (10 yr)?1], while the adjusted series shows a very slight trend [0.006% (10 yr)?1]. This result is consistent with that [nearly 0% (10 yr)?1] based on the homogenized monthly RH data obtained from RHtest method (Zhu et al., 2015). Figure 7b compares the anomalous AMRHS (relative to the 1961–90 mean) over China between the raw and two adjusted datasets based on MASH and RHtest (Zhu et al., 2015). The higher level of RH in the raw series during the early years before 2004 is adjusted by both methods. The two adjusted series show similar interannual variability as well as similar long-term trends. The differences between the two adjusted datasets are mainly due to the different methods used, and partly due to the different data used. First, the present study uses daily RH records, while the previous work used monthly data. Second, the present study involves 746 stations with the best quality data, while the previous involved 2413 stations.
 Figure7. (a) Regional mean AMRHS for China during 1960–2017 based on raw data, the adjusted data based on MASH, and the reanalysis data of ERA5 (a constant of 7% is added to facilitate comparison). (b) Anomalous AMRHS based on the raw data and the two adjusted datasets based on MASH and RHtest.
Figure 7a also includes the RH series in China based on ERA5 during 1979–2017 for comparison. As the RH values in the reanalysis are systematically lower than the station observations for this region, we add 7% to the ERA5 series in order to easily compare the different series. It is notable that the ERA5 series shows interannual variations very similar to those in the raw data series, suggesting that the reanalysis reflects the local observation, including, unfortunately, the sharp decrease due to the change from the manual to automated observing system during the early 2000s. This raises a caveat for applying ERA5 to study climate change in RH and relevant variables in this region around that time.
(1) There are 643 station RH series with an abrupt change during 2000–07, as detected by the Pettitt test and moving t-test, mainly due to the change from the manual to automated system. The adjustments made to the early part of these station series due to this change are mainly negative, with a peak of the PDF around ?3%. Consequently, the mean RH series of these stations based on the adjusted data shows a slight trend [0.026% (10 yr)?1], while the raw data show a false decreasing trend [?0.461% (10 yr)?1] mainly due to overestimated RH in the early manual observing period.
(2) By using MASH, we found 4395 more break points in the AMRHS at 685 (91.82% of all) stations during 1960–2017. Most of the break points are located in humid and semi-humid zones, suggesting that observation of RH in these zones is more easily biased due to local system changes. It is suggested by case analyses that the major break points can be well detected by different methods such as MASH and RHtest. Although different methods result in different magnitudes of adjustments, the adjusted series exhibit consistent interannual variability and long-term climate trends, in contrast with the raw data.
(3) The homogenized RH data show very slight trends across China, with a regional mean trend of 0.006% (10 yr)?1 during 1960–2017. This nearly no-trend RH series implies that the water vapor amount in the atmosphere increases in accordance with increasing temperature in this region as a whole. The sign of trend is overturned in the raw dataset [?0.414% (10 yr)?1], reflecting the serious impact of unnatural changes in local observing systems on the RH records. In particular, the sign of the trend in the AMRHS overturns after homogenization at 252 stations, mainly located in humid/semi-humid southeastern China.
(4) The reanalysis dataset ERA5 also shows a sharp decreasing jump in the regional mean RH series for China during the early 2000s, which was undoubtedly due to the use of raw RH observations in the reanalysis system. This raises caveats for applying relevant reanalysis data to study climate change for this region.
Uncertainty remains in the homogenized dataset, essentially because we cannot perfectly reproduce what should be observed during the biased early observations. Methodologically, there are two aspects considered. First, the number of inhomogeneous change points detected by different methods may be different. We applied a relatively strict significance level (0.01) for detecting possible change points when using MASH, to keep as many original records as possible, and thus some less significant biases might remain. However, we applied a loose significance level (0.1) for detecting changes due to the transfer from human observation to automation, because it is physically clear that this caused systematical bias. Second, the adjusted magnitudes for the early observations before the change points can be different. For instance, we applied the difference of mean RH between the two N-year periods (N = 3 for the present study) around the change point as the adjustment for the early records before automation, based on empirical considerations of the non-stationary climate series (Yan et al., 2010). Nevertheless, as Li et al. (2016) pointed out, although different methods produced different homogenized results, those large biases would always be well adjusted and hence the different homogenized datasets show quite consistent climate trends in contrast to those in the original data.
The homogenized RH dataset is open for relevant studies, especially of climate change in this region, available at
Acknowledgements. This work was supported by the Chinese Academy of Sciences (Project Nos. XDA19030402 and XDA20020201) and the UK–China Research & Innovation Partnership Fund through the Met Office Climate Science for Service Partnership (CSSP) China as part of the Newton Fund (SFBT & NF).
Zhongwei YAN: supervising data analysis and finalizing manuscript;
Yani ZHU: RHtest_adjusted RH data and metadata analysis;
Nicolas FREYCHET: discussion of results and comparative analysis with ERA5;
Simon TETT: discussion of results and improving the writing.
Open Access This article is distributed under the terms of the Creative Commons Attribution 4.0 International License (
