 ,, 刘纪伟, 田恬, 严薇, 刘兵, 赵思琪, 胡秋辉, 丁超,南京财经大学食品科学与工程学院/江苏省现代粮食流通与安全协同创新中心/江苏高校粮油质量安全控制及深加工重点实验室,南京 210023
Dynamic Analysis for the Characteristics of Flavor Fingerprints for Brown Rice in Short-Term Storage Under High Temperature Stress
LIU Qiang,, LIU JiWei, TIAN Tian, YAN Wei, LIU Bing, ZHAO SiQi, HU QiuHui, DING Chao,College of Food Science and Engineering, Nanjing University of Finance and Economics/Collaborative Innovation Center for Modern Grain Circulation and Safety/Jiangsu Key Laboratory of Quality Control and Further Processing of Cereals and Oil, Nanjing 210023通讯作者:
责任编辑: 赵伶俐
收稿日期:2020-05-27接受日期:2020-08-18网络出版日期:2021-01-16
| 基金资助: |
Received:2020-05-27Accepted:2020-08-18Online:2021-01-16
作者简介 About authors
刘强,E-mail:

摘要
关键词:
Abstract
Keywords:
PDF (3043KB)元数据多维度评价相关文章导出EndNote|Ris|Bibtex收藏本文
本文引用格式
刘强, 刘纪伟, 田恬, 严薇, 刘兵, 赵思琪, 胡秋辉, 丁超. 高温胁迫下糙米短期储藏气味指纹图谱变化规律的动态分析[J]. 中国农业科学, 2021, 54(2): 379-391 doi:10.3864/j.issn.0578-1752.2021.02.013
LIU Qiang, LIU JiWei, TIAN Tian, YAN Wei, LIU Bing, ZHAO SiQi, HU QiuHui, DING Chao.
开放科学(资源服务)标识码(OSID):

0 引言
【研究意义】我国陆域范围广阔且环境复杂多样,但受到全球气候影响,未来高温等自然灾害极端事件发生的概率上升,这种极端气候事件频发会给粮食在生产、加工及储藏等环节的稳定性带来较大的影响[1]。不同于稻谷储藏,糙米虽然保留了表皮层、胚芽及胚乳部分,但生理结构上缺少了外皮层(稻壳)的保护,当暴露在高温高湿等环境中,短期内其营养品质将会出现严重下降。对此,若能掌握糙米在极端环境下的品质变化规律,探寻糙米储藏品质快速评价新方法,可以为后续科学储藏提供指导性意见。【前人研究进展】气味作为评价糙米的最直接指标,不仅直接影响到消费者购买欲望,更能直接反应其本身所处的生理生化状态。MAHATHEERANONT等[2]对泰国产糙米(Khao Dawk Mali 105)挥发性组分鉴定发现有超过140种物质被检出,验证了气味信息与样品自身理化特性的关联;SHI等[3]对糙米加工过程中香气成分及微观结构进行了分析,结果表明呋喃类和吡嗪类挥发性成分与糙米加工过程密切相关;宋伟等[4]采用电子鼻技术对不同储藏条件下的糙米进行了无损检测,结果表明极性较强的高沸点组分(戊醛、己醛等挥发性羰基化合物)是糙米储藏出现陈化气味的主要来源;王立峰等[5]对不同包装方式下大米储藏挥发性成分分析表明,室温条件下储藏,醛类含量可以用来评价大米的食味和鲜度,但当储藏温度过高时(30℃),包装方式对延缓品质劣变的能力受到显著影响。上述研究主要集中在常规4—30℃温度范围的长期储藏(180 d左右),检测分析的时效性有待进一步提高,特别是储藏前期气味的微弱信号变化能否被有效检出的问题尚未解决。在全球自然环境日益多变的背景下,构建粮食品质早期监测的工艺技术及装备体系将推动我国对未来极端气候的应变能力。气相色谱串联质谱(gas chromatography-mass spectrometry,GC-MS)作为最常用的样品挥发性成分鉴定技术,具有灵敏度高、重复性好、检出限低且无需萃取步骤等特殊优势,广泛用于食品等复杂成分的挥发性化合物定性及定量分析,已在稻谷[6]、小麦[7]、糙米[8]、大米[9]等粮食物料中被证实。另一方面,预处理步骤和质谱分析时间限制了GC-MS技术在食品工业中的广泛应用。气相离子迁移谱(gas chromatograph - ion mobility spectrometer,GC-IMS)作为另一种食品气味挥发表征技术,结合了气相色谱的高分离能力和离子迁移谱的快速响应特性,在单独的气相分离维度基础上,增添了离子迁移信号维度,对应检出信号灵敏度可精确至ppbv级[10]。与GC-MS技术相比,GC-IMS对应的标准物匹配数据库有待进一步扩展,该技术无须样品预处理,能在短时间内获取大量气味检测信号,在气味指纹图谱的精度方面优势明显。现已被证实可用于大米早期霉变检测[11]、松茸气味分析[12]、蜂蜜掺假[13]等领域。因此,综合运用上述两项技术可以分别从样品挥发性组分及其气味指纹图谱方面联合分析糙米短期储藏条件下的微弱信号变化,为准确描述产品状态以及安全性方面提供重要参考。【本研究切入点】现有多数研究仍侧重于粮食储藏期品质变化分析,针对高温等极端环境下糙米短期储藏气味特性的差异有待进一步研究。【拟解决的关键问题】本研究以新鲜糙米为原料,分别采用顶空固相微萃取结合GC-MS技术以及顶空固相进样结合GC-IMS技术分析高温等环境胁迫下糙米挥发性成分及指纹图谱变化,并结合数学判别模式进行区分,探讨基于气味指纹图谱信息的糙米短期储藏阶段区分效果,为环境胁迫下粮食储藏有效期的判定提供理论依据。1 材料与方法
试验于2019年在南京财经大学食品科学与工程学院/江苏省现代粮食流通与安全协同创新中心/江苏高校粮油质量安全控制及深加工重点实验室内进行。1.1 材料与试剂
糙米(品种:南梗46,2018年11月收获,初始湿基水分含量(17.0±0.3)%,整精米率(83.5±2.3)%,容重850 g·L-1),南京远望富硒有限公司;3-辛醇(色谱级),上海源叶生物科技有限公司;氯化钠(分析级),西陇科学股份有限公司。1.2 仪器与设备
CTH1-250B型恒温恒湿箱,施都凯设备公司;固相微萃取头(PDMS/DVB/CAR),美国SUPELCO公司;分析天平(±0.0001 g,LE203E/02),梅特勒-托利多仪器(上海)有限公司;GC-MS(7890A GC-5975CMSD),美国安捷伦科技有限公司;GC-IMS(FlavourSpec?风味分析仪),济南海能仪器股份有限公司;-18℃冰箱,青岛海尔股份有限公司。1.3 方法
1.3.1 糙米储藏 新鲜糙米随机等分6组样品,每份50 g,置于PP材质保鲜盒中,敞口放置于恒温恒湿箱中,储藏环境温湿度条件分别设定成(40±1)℃和(70±10)%,用以模拟高温高湿胁迫环境。取样时间设计为储藏0、5、10、15、20和25 d,取样后立即转移至密封袋中封存,并储藏在-18℃冰箱中备用。1.3.2 GC-MS挥发性成分测定 参考LIU等[14]方法,称取(5.00±0.01)g糙米样本至样品顶空瓶中,加入200 μL内标物(3-辛醇:50 μg·mL-1)以及5.0 g 氯化钠样品加盖封口,将萃取头插入顶空瓶顶空部分(距糙米表面0.5 cm左右),60℃水浴条件下平衡20 min,结束后立即插入GC-MS进样口,使用自动进样器解吸样品(250℃,5 min)并进行检测。气相色谱(GC)条件:进样口温度250℃,不分流进样方式,载气为纯化氦气,柱前压为64 KPa,流量为2 mL·min-1,升温程序:起始温度40℃,保持6 min,3℃·min-1增加到100℃,然后5℃·min-1增加到230℃,230℃维持10 min。质谱(MS)条件:接口温度280℃,电离电压:70 eV(MS-EI),离子源温度230℃,溶剂延长时间2 min,采用全扫描采集模式,质量扫描范围(m/z)30—450 amu。
1.3.3 GC-IMS测定 参考王熠瑶等[15]方法,称取3 g糙米置于20 mL顶空样品瓶中,密闭封口后进行检测。顶空振荡孵育(60℃,500 r/min,15 min),顶空进样针温度为85℃,进样量为500 μL,清洗时间为30 s。色谱柱为FS-SE-54-CB-1(非极性,15 m×0.53 mm×0.5 μm),色谱柱温度为60℃,运行时间为25 min,载气为高纯N2(纯度≥99.999%)。E1在整个运行过程中保持150 mL·min-1的流速,E2流速程序为:初始2.0 mL·min-1,保持2 min后在10 min内线性增至10 mL·min-1,之后在20 min内线性增至100 mL·min-1,接着在25 min内线性增至150 mL·min-1。IMS条件:漂移管长度为5 cm,管内线性电压为400 V·cm-1,漂移管温度为45℃,漂移气为高纯N2(纯度≥99.999%),流速为150 mL·min-1,IMS探测器温度为45℃。
1.4 数据分析与处理
1.4.1 动态主成分分析 主成分分析(principal component analysis,PCA)是一种利用降维的思想,把多指标转化为少数几个综合指标的分析方法。动态主成分分析(dynamic principal component analysis,dPCA)是在主成分分析的基础上,参照文献[16]的方法,进行坐标变换,将高维GC-IMS原始数据转化成低维空间处理,同时考虑变量间交叉相关以及时间序列上相关性,将原始变量静态数据利用动态时间序列构造动态时间数据,实现对过程变量去噪、降维、消除相关性等预处理及特征提取。动态数据扩展方程如公式(1)所示:式中,滞后因子h计算需要根据式(2)中关系函数rnew (h)从静态(h=0)递推得出:
在获取动态数据矩阵X(h)后,转化成标准数据矩阵$\bar{X}$进行分析,并根据公式(3)计算协方差矩阵C、特征向量Iy及特征值λ:
依据特征值从小到大排列,将特征向量作为列向量组成动态PCA处理的特征矩阵U,并对U中各成分进行加权求和,方差累计贡献率CR如公式(4)所示:
根据方差累计百分比确定特征保留个数k,并选取前k个向量作为特征提取数据构建气味指纹图谱。
1.4.2 伪彩色处理 单独样本获取GC-IMS信号后以二维数据矩阵进行记录,并归一化后以灰度图像进行保存。采用RGB空间投影方式,将样本灰度图像映射成伪彩色进行可视化显示。本次试验以纯蓝色(R=0,G=0,B=256)代表最低信号,以纯红色(R=256,G=0,B=0)代表最高信号。
不同样本的信号二维数据矩阵相减所得的差值矩阵可用于谱图差异化分析。差分图像在差值矩阵伪彩色处理基础上,以不同灰度等级进行表述。本试验中,差异可视化谱图的背景为白色,红色越深代表目标图像中的物质浓度越高于参比图像,蓝色越深代表物质的浓度越低于参比图像。
1.4.3 数据统计 GC-MS统计数据结果去除硅烷化合物,保留匹配度大于85%的挥发性物质。采用内标法对各挥发性成分的含量进行计算,匹配NIST数据库进行鉴定。GC-IMS统计数据采用LAV(laboratory analytical viewer)分析软件进行处理。数据伪彩色及降维处理分别采用Reporter插件、Gallery Plot插件以及Dynamic PCA插件。试验数据取3次重复的平均值,采用GraphPad Prism 7进行方差分析,采用单因素方差对不同储藏时间样品的挥发性物质进行差异性分析,当P<0.05时,表示不同储藏时间下样品挥发性物质间差异性显著,当P<0.01时,表示不同储藏时间下样品挥发性物质间差异性极显著,使用Origin 2018软件绘图。储藏取样时采用随机取样法进行分析,消除人为因素造成的试验误差。
2 结果
2.1 高温储藏期间糙米挥发性成分变化
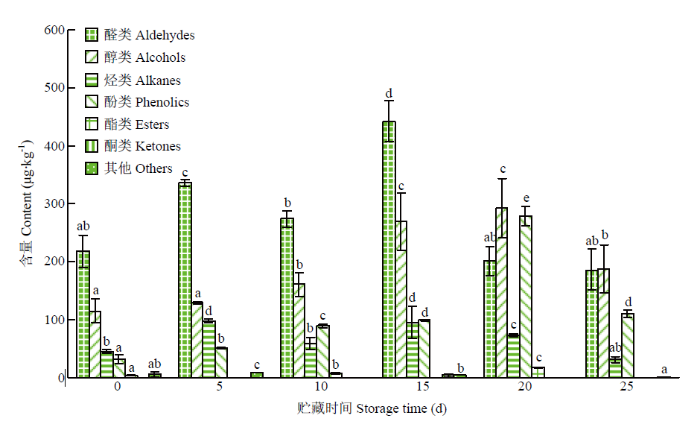
在高温储藏条件下,糙米中挥发性成分主要包括醛类、醇类、酯类、烃类和酚类等,各挥发性成分的具体含量如表1,由表可知,检测出糙米中挥发性成分共42种,其中种类数量最多的是烃类,共有19种,其次是其他类、醛类、醇类及酚类,其他类和醛类各有5种,醇类和酚类各有2种,而酯类、酮类和杂环类种类较少。由图1可以看出,糙米中挥发性成分总含量最高的是醛类和醇类,其次为烃类和酚类。其中,醛类总含量随着储藏时间的延长具有波动性,在储藏时间为15 d时达到最大值,含量为(441.93±35.26)μg·kg-1,在25 d时总含量下降为(186.07±35.55)μg·kg-1。醇类和酚类含量随着储藏时间的延长先上升后下降,在20 d时达到最大值,分别为(292.52±50.84)和(279.20±16.44)μg·kg-1。烃类物质含量随着储藏时间的延长也具有波动性,在5 d时总含量达到最大值,为(97.86±3.02)μg·kg-1,15 d后含量逐渐下降,在25 d时总含量为(30.97±4.80)μg·kg-1。Table 1
表1
表1高温储藏下糙米挥发性成分及含量
Table 1
| 种类 Category | 名称 Name | 储藏时间 Storage time (d) | |||||
|---|---|---|---|---|---|---|---|
| 0 | 5 | 10 | 15 | 20 | 25 | ||
| 醛类 Aldehydes | 正己醛 Hexanal | 81.09±0.53b | 71.28±1.84c | 74.48±10.69bc | 185.18±15.71a | 59.67±9.07d | 12.89±0.72e |
| 苯甲醛 Benzaldehyde | 136.92±28.06d | 225.64±8.43b | 176.47±5.96c | 256.75±19.55a | 126.52±17.77d | 173.18±34.83cd | |
| 庚醛 Heptanal | — | 18.14±0.28 | — | — | — | — | |
| 反-2-辛烯醛 E-2-Octenal | — | 21.82±0.86a | 22.91±1.85a | — | — | — | |
| 反-2-十二烯醛 E-2-Dodecenal | — | — | — | — | 15.34±2.13 | — | |
| 醇类 Alcohols | 己醇 Etnanol | 115.10±20.88ab | 109.93±3.36b | 97.56±17.80ab | 160.09±45.77a | 121.80±19.14ab | — |
| 苯甲醇 Benzyl Alcohol | — | — | 63.06±3.20b | 109.33±2.84a | 44.75±11.25c | 124.43±45.33a | |
| 1-辛烯-3-醇 1-Octen-3-ol | — | 17.56±0.93c | — | — | 125.97±20.45a | 63.11±3.38b | |
| 正十三烷-1-醇 n-Tridecan-1-ol | — | 1.99±0.19 | — | — | — | — | |
| 酯类 Esters | 丙位己内酯 4-Hexanolide | 3.41±1.06 | — | — | — | — | — |
| 丙位壬内酯 γ-Nonanolactone | — | — | 7.61±1.29 | — | — | — | |
| 甲酸辛酯 Octyl Formate | — | — | — | — | 17.58±0.78 | — | |
| 酮类 Ketones | 苯乙酮 Acetophenone | — | — | — | 4.01±2.29 | — | — |
| 烃类 Hydrocarbons | 十二烷 Dodecane | 13.88±6.73c | 19.22±1.22b | 14.50±2.25c | 24.09±7.28ab | 24.43±1.50a | 3.23±0.93d |
| 葵环戊烷 Anemone | 2.14±0.50b | 5.42±0.19a | — | — | — | — | |
| 正十四烷 Tetradecane | 7.90±1.25c | 10.48±0.12b | 14.75±3.56ab | 9.38±2.95bc | 18.25±0.91a | 4.15±0.55d | |
| 长叶烯 d-Longifolene | 13.16±3.92a | 8.26±0.53b | 15.87±0.11a | 7.58±3.32b | 14.29±2.89a | 16.46±2.22a | |
| 环十四烷 Cyclotetradecane | 6.43±1.98b | 6.35±0.29b | — | 7.74±2.25b | 12.04±2.71a | — | |
| 8-己基十五烷 8-Hexylpentadecane | 1.67±0.43b | — | — | 2.87±0.79a | — | — | |
| 苯乙烯 Styrene | — | 14.83±0.28a | 6.97±5.34b | — | — | 3.21±0.10b | |
| 3,7-二甲基葵烷 3,7-Dimethyldecane | — | 5.62±0.22 | — | — | — | — | |
| 3,8-二甲基葵烷 3,8-Dimethyldecane | — | 11.67±1.1+ | — | — | — | — | |
| 壬基环丙烷 Nonylcyclopropane | — | 10.37±0.69a | — | — | — | 3.91±0.01b | |
| 二十烷 Eicosane | — | 4.19±1.70 | — | — | — | — | |
| 7-己基二十二烷 7-Hexyldocosane | — | 1.44±0.59 | — | — | — | — | |
| 1-十一烯 1-Undecene | — | — | 7.25±0.69 | — | — | — | |
| 十五烷 Pentadecane | — | — | — | 1.10±0.20 | — | — | |
| 十六烷 Hexadecane | — | — | — | 10.01±4.79 | — | — | |
| 十一烷 Undecane | — | — | — | 15.38±6.81 | — | — | |
| 1-戊烯 1-Pentene | — | — | — | 2.73±0.68 | — | — | |
| 9-甲基壬烷 9-Methylnonane | — | — | — | 14.41±1.95 | — | — | |
| 三十四烷 Tetradecane | — | — | — | — | 3.70±1.94 | — | |
| 其他 Others | 氯乙酸十一酯 Undecyl Chloroacetate | 6.12±5.12 | — | — | — | — | — |
| 邻二氯苯 1,2-Dichlorobenzene | — | 4.29±1.61 | — | — | — | — | |
| 1,3-二氯苯 1,3-Dichlorobenzene | — | — | — | 4.95±0.01 | — | — | |
| 三氟乙酸十六烷 Hexadecyl Trifluoroacetate | — | 4.87±1.10 | — | — | — | — | |
| (甲氧基乙基)-基硫脲 4 - (Methoxyethyl) - Thiourea | — | — | — | — | 1.19±0.05 | — | |
| 酚类 Phenols | 2,4-二叔丁基苯酚2,4-Di-Tert-Butylphenol | 20.32±4.62e | 40.07±2.57cd | 36.42±4.30d | 51.38±9.86c | 212.01±12.56a | 88.62±3.51b |
| 2-叔丁基苯酚 o-Tert-Butyl Phenol | — | — | 18.55±3.90 | — | — | — | |
| 3-叔丁基苯酚 3-Tert-Butylphenol | — | — | — | 8.91±1.80b | 22.98±0.91a | — | |
| 4-叔丁基苯酚 4-Tert-Butylphenol | — | — | 8.00±0.99 | — | — | — | |
| 杂环 Heterocyclic | 2,6-二叔丁基苯醌2,6-Di-Tert-Butyl-p-Benzoquinone | 11.41±2.93c | 11.36±0.86c | 25.86±4.22b | 38.80±6.99a | 44.20±2.97a | 21.00±2.43b |
新窗口打开|下载CSV
图1
 新窗口打开|下载原图ZIP|生成PPT
图1糙米中各挥发性成分总含量
同一类型柱形图上不同字母表示数据间存在显著性差异(P<0.05)
Fig. 1Total contents of volatile organic compounds in brown rice
Different letters on the bar chart in same type indicate significant differences (P<0.05)
作为储藏糙米中主要的挥发性成分,检测出的醛类物质分别为正己醛、苯甲醛、庚醛、反-2-辛烯醛和反-2-十二烯醛,检测出的醇类物质分别为正己醇、苯甲醇、1-辛烯-3-醇和正十三烷-1-醇。其中正己醛和苯甲醛在整个储藏期均能被检测到,正己醛含量随着储藏时间的延长先减少再增加再减少。由表1可知,在储藏初期,正己醛含量为(81.09±0.53)μg·kg-1,在15 d时达到最大,而在储藏末期正己醛含量急剧下降(P<0.05)。苯甲醛含量在糙米储藏期间同样具有波动性,在储藏15 d时含量达到最大值,而后含量先下降后上升,在25 d时苯甲醛含量为(173.18± 34.83)μg·kg-1。庚醛仅在储藏期为5 d时被检测到,反-2-辛烯醛在储藏5和10 d时被检测到,但之间无显著性差异(P>0.05);反-2-十二烯醛仅在储藏20 d时被检测到。己醇随着储藏时间的延长,其含量先减少后上升,在储藏20 d时含量下降,25 d时未检测到;苯甲醇在前5 d未被检测出,随后其含量随着储藏时间的变化具有波动性,20 d时含量最少,在25 d时含量最大;1-辛烯-3-醇在储藏5、20和25 d时被检测到,而正十三烷-1-醇仅在储藏5 d时被检测到。
由表1可知,在整个储藏期间,烃类物质十二烷、正十四烷和长叶烯一直被检测到,酚类物质2,4-二叔丁基苯酚以及杂环类物质2,6-二叔丁基苯醌也一直被检测出。其中,十二烷和正十四烷随着储藏时间的延长先上升后下降,在25 d时含量达到最小值,分别为(3.23±0.93)和(4.15±0.55)μg·kg-1,长叶烯随着储藏时间的延长表现为先减少后上升,在储藏5 d时达到最小值,而储藏25 d时含量达最大值。2,4-二叔丁基苯酚含量在储藏期间具有波动性,在20 d时达到最大值, 2,6-二叔丁基苯醌含量随着储藏时间的延长表现为先上升后下降,储藏初期含量为(11.41±2.93)μg·kg-1,而储藏25 d时含量为(21.00±2.43)μg·kg-1。此外,环十四烷、苯乙烯在较多时期被检测到,环十四烷在储藏期为20 d时含量达到最大,苯乙烯在储藏时间为5 d时含量达到最大。
2.2 高温储藏期间糙米GC-IMS信号变化
由图2可知,在获取GC-IMS三维信号图谱基础上,进行伪彩色处理后可以直观看出不同挥发性有机物对应的漂移时间和离子迁移时间差异。但总体上,0—25 d储藏期间挥发性组分对应的GC-IMS信号谱相似,定性评价组间差异较为困难,需要进一步提取特征性峰值信号。俯视图的整个图背景为蓝色,横坐标1.0处紫色竖线为反应离子峰(reactive ion peak,RIP峰,处理方式:归一化处理),横、纵坐标分别代表挥发性成分在气相色谱中的保留时间和在离子迁移谱中的迁移时间。单一挥发性成分通过伪彩色数据处理后,以不同色阶的标识点突出显示,其中红色代表信号强度越高,蓝色代表信号强度越低。可以看出,糙米的挥发性有机物随着储存时间逐渐发生变化。图2
 新窗口打开|下载原图ZIP|生成PPT
图2样品的气相离子迁移谱图
伪彩色处理后红色越深表示信号强度越高,蓝色越深表示信号强度越低;不同数字代表GC-IMS数据库参比物质出峰
Fig. 2Gas phase ion migration spectrogram of the samples
Color scale from blue to red represents the signal intensity from -0.25 to 0.850; The different number represents the peak of identified compound based on GC-IMS database
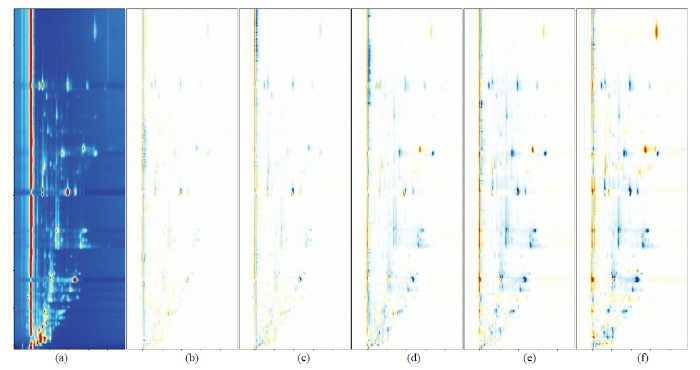
为进一步突出不同储藏条件下高温对糙米气味GC-IMS图谱的变化,采用差异对比模式进行图形可视化及降维处理,差异对比如图3所示。取样品0 d的谱图作为参比,5—25 d样本GC-IMS图谱依次扣减原始参比图,参比后图像中红色代表样本特征信号强度高于原始样,蓝色代表特征信号强度低于原始样。与上图结论相同,通过差异对比图可观察糙米的挥发性有机物随着储存时间逐渐发生变化,挥发性气体在离子迁移过程中,特定挥发性成分对应的保留时间与漂移时间呈现正向非线性关联变化。保留600—780 s时进行漂移的有机物,在15、20和25 d中颜色变化显著,说明保留至最后漂移出来的有机物受储藏时间影响显著。
图3
 新窗口打开|下载原图ZIP|生成PPT
图3样品的气相离子迁移谱图差异图
a:0 d原始参比信号;b:第5天差异信号;c:第10天差异信号;d:第15天差异信号;e:第20天差异信号;f:第25天差异信号
Fig. 3Difference diagram of gas phase ion migration spectrogram of the sample
a: Initial comparative signals in 0 d; b: The differential signals in 5th d; c: The differential signals in 10th d; d: The differential signals in 15th d; e: The differential signals in 20th d; f: the differential signals in 25th d
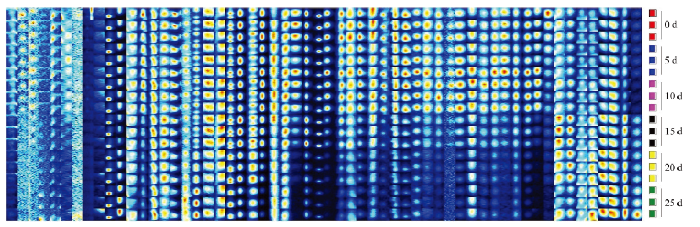
由图4所示,单独一行代表样品的全体GC-IMS信号峰值图,即挥发性有机物GC-IMS特征信号。对比不同储藏时间样品检出的挥发性物质发现,每组样品的完整挥发性有机物信息存在差异,所有物质在各个样品中的相对含量见表2。对比发现,部分物质包括乙醇、2-丁酮、2-戊酮、2-己酮、2-己醇、丁醇、苯甲醛和正己醛等对应的GC-IMS信号强度受储藏时间影响较小,相对含量基本不发生变化,但苯甲醛相对含量在储藏25 d后增加了1.04%,正己醛相对含量在储藏25 d后减少了10.78%,与GC-MS分析结果类似。另一部分挥发性成分包括丁内酯、戊醛、邻甲酚、壬醛、庚醛、戊醇、2-庚酮、己醇、3-甲基-1-戊醇、苯乙醛、E-2-辛醛、2-乙基己醇、2-甲基丙酸、(Z)-3-己烯-1-醇、2-戊基呋喃和辛醛在高温胁迫下储藏10 d时浓度达到最高,随后在15 d开始基本消失,浓度降为最低并保持不变。此外,糙米挥发性成分中乙酸丙酯对应的GC-IMS信号随储藏时间延长而逐渐降低,这表明该成分可作为新鲜糙米的代表性挥发性成分。对比高温胁迫下储藏20和25 d的GC-IMS信号发现,两组信号强度差异较小,表明两组之间挥发性成分及浓度含量差异较小、含量近似。
图4
 新窗口打开|下载原图ZIP|生成PPT
图4气相离子迁移谱图中选取的挥发性有机物的指纹图谱
独立像素图片表示GC-IMS特征吸收峰,红色越深表示信号强度越高,蓝色越深表示信号强度越低,背景设为黑色
Fig. 4Aroma fingerprinting of volatile organic compounds selected from the GC-IMS
The independent pixel represents the GC-IMS characteristic absorption peak. The color scale from blue to red represent the signal intensity from low to high, and black means the background
Table 2
表2
表2样品特征峰对应的化合物及相对含量
Table 2
| 序号Sequence | 化合物 Compound | 储藏时间 Storage time (d) | |||||
|---|---|---|---|---|---|---|---|
| 0 | 5 | 10 | 15 | 20 | 25 | ||
| 1 | 乙醇Etnanol | 8.79±0.30 | 9.15±0.24 | 9.12±0.08 | 9.51±0.28 | 12.09±0.21 | 13.19±0.14 |
| 2 | 3-甲基-3-丁烯-1-醇3-Methyl-3-buten-1-ol | 2.21±0.09 | 2.39±0.05 | 2.62±0.09 | 2.77±0.16 | 3.54±0.06 | 4.49±0.21 |
| 3 | 2-甲基丁醇2-Methybutanol | 1.17±0.05 | 1.27±0.03 | 1.45±0.04 | 1.53±0.03 | 1.92±0.05 | 2.39±0.06 |
| 4 | 戊醇1-Pentanol | 2.80±0.15 | 2.89±0.10 | 2.80±0.08 | 1.80±0.07 | 1.42±0.06 | 1.26±0.10 |
| 5 | 3-甲基-1-戊醇3-Methyl-1-Pentanol | 0.36±0.02 | 0.38±0.04 | 0.40±0.01 | 0.35±0.10 | 0.36±0.02 | 0.43±0.04 |
| 6 | 2-己醇2-Hexanol | 2.77±0.07 | 3.09±0.10 | 3.19±0.12 | 3.50±0.10 | 4.66±0.02 | 5.15±0.11 |
| 7 | 叶醇Z-3-Hexen-1-ol | 0.52±0.02 | 0.60±0.05 | 0.61±0.02 | 0.46±0.02 | 0.37±0.03 | 0.34±0.05 |
| 8 | 己醇1-Hexanol | 0.44±0.04 | 0.42±0.05 | 0.44±0.01 | 0.43±0.03 | 0.44±0.05 | 0.48±0.05 |
| 9 | 甲基丙醇2-Methylpropanol | 0.62±0.04 | 0.58±0.04 | 0.62±0.04 | 0.81±0.03 | 1.04±0.04 | 0.87±0.12 |
| 10 | 1-辛烯-3-醇1-Octen-3-ol | 3.04±0.19 | 3.03±0.09 | 2.49±0.10 | 4.93±0.04 | 5.79±0.20 | 6.63±0.37 |
| 11 | 2-己基己醇2-Ethylhexanol | 1.91±0.12 | 2.22±0.07 | 2.35±0.16 | 1.39±0.11 | 0.94±0.03 | 0.89±0.05 |
| 12 | 壬醇1-Nonanol | 0.46±0.04 | 0.50±0.04 | 0.52±0.02 | 0.55±0.04 | 0.62±0.05 | 0.72±0.07 |
| 13 | 丁醇1-Butanol | 0.60±0.03 | 0.64±0.02 | 0.70±0.03 | 1.02±0.06 | 0.92±0.05 | 1.02±0.07 |
| 14 | 2-甲基丙醇2-Methylpropanol | 0.54±0.03 | 0.53±0.04 | 0.57±0.05 | 0.82±0.03 | 0.85±0.03 | 0.78±0.16 |
| 15 | 2-丁酮2-Butanone | 2.87±0.06 | 3.07±0.08 | 3.03±0.08 | 1.99±0.11 | 2.05±0.03 | 2.31±0.24 |
| 16 | 2-戊酮2-Bentanone | 2.80±0.04 | 3.01±0.04 | 2.97±0.18 | 2.84±0.08 | 3.09±0.04 | 2.86±0.29 |
| 17 | 2-己酮2-Bexanone | 0.72±0.07 | 0.73±0.06 | 0.73±0.04 | 0.66±0.04 | 0.57±0.00 | 0.45±0.04 |
| 18 | 2-庚酮2-Beptanone | 1.68±0.10 | 1.74±0.11 | 1.70±0.03 | 1.00±0.05 | 0.82±0.17 | 0.85±0.18 |
| 19 | 甲基己基甲酮2-Octanone | 2.79±0.15 | 2.72±0.11 | 2.63±0.05 | 2.46±0.17 | 2.61±0.11 | 3.19±0.17 |
| 20 | 2-己酮2-Hexanone | 0.25±0.03 | 0.32±0.04 | 0.28±0.02 | 0.34±0.04 | 0.47±0.03 | 0.62±0.10 |
| 21 | 丙酮Acetone | 18.61±0.76 | 18.66±0.59 | 19.99±0.44 | 21.30±0.57 | 23.81±0.13 | 26.10±1.78 |
| 22 | 正己醛Hexanal | 14.50±0.45 | 14.53±0.57 | 14.63±0.13 | 12.79±0.06 | 8.28±0.49 | 3.72±0.25 |
| 23 | 苯甲醛Benzaldehyde | 7.91±0.21 | 7.90±0.25 | 7.66±0.29 | 9.19±0.02 | 10.51±0.21 | 8.95±0.58 |
| 24 | 辛醛Octanal | 3.87±0.22 | 4.02±0.39 | 4.39±0.11 | 2.62±0.22 | 1.46±0.04 | 1.11±0.05 |
| 25 | 正壬醛n-Nonanal | 5.23±3.37 | 3.25±0.41 | 3.02±0.07 | 3.49±0.08 | 3.51±0.36 | 3.69±0.43 |
| 26 | 戊醛Pentanal | 0.88±0.07 | 0.79±0.14 | 0.80±0.06 | 0.48±0.04 | 0.21±0.04 | 0.14±0.01 |
| 27 | 反-2-辛烯醛E-2-Octenal | 0.84±0.06 | 0.74±0.04 | 0.61±0.03 | 0.48±0.06 | 0.35±0.04 | 0.44±0.11 |
| 28 | 庚醛Heptanal | 2.23±0.06 | 2.15±0.26 | 2.23±0.04 | 1.19±0.05 | 0.58±0.05 | 0.51±0.04 |
| 29 | 苯乙醛Phenylacetaldehyde | 0.38±0.01 | 0.39±0.04 | 0.39±0.05 | 0.28±0.02 | 0.23±0.02 | 0.23±0.02 |
| 30 | 丁内酯Butyrolactone | 0.13±0.03 | 0.15±0.01 | 0.12±0.01 | 0.11±0.02 | 0.14±0.03 | 0.13±0.02 |
| 31 | 乙酸丙酯Propyl acetate | 0.49±0.08 | 0.36±0.06 | 0.27±0.03 | 0.20±0.02 | 0.20±0.01 | 0.14±0.03 |
| 32 | 2-戊基呋喃2-Pentylfuran | 0.93±0.02 | 0.97±0.08 | 1.10±0.05 | 0.85±0.01 | 0.78±0.07 | 0.78±0.03 |
| 33 | 邻苯甲酚o-Cresol | 6.49±0.29 | 6.62±0.54 | 5.32±0.19 | 7.66±0.18 | 5.26±0.39 | 5.02±0.55 |
| 34 | 对氯苯氧异丁酸p-Chlorophenoxyisobutyric acid | 0.19±0.04 | 0.19±0.04 | 0.23±0.02 | 0.18±0.00 | 0.14±0.01 | 0.14±0.02 |
新窗口打开|下载CSV
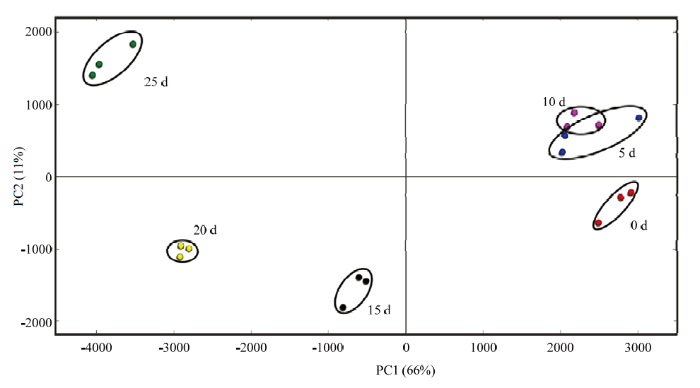
采用动态主成分算法,将高维GC-IMS图谱数据降维压缩后,对信号进行重新投影,在最大程度保留原始信号有效信息的前提下,探讨消除变量间的冗余信息以便特征信号的差异动态分析[17],结果如图5所示。PCA图显示不同样品的差异,样品相隔近则代表差异小,相隔远则代表组分差异明显。由图5可知,数据点大致分布成4簇,储藏时间为0、5和10 d位置较邻近,作为一簇,均与15、20以及25 d三簇区域有明显间距,不同储藏时间的糙米样品特异性较明显,说明0、5和10 d的糙米样品风味比较相似,储藏后期糙米样品和储藏前期的风味差异较大。可以看出,PCA图与指纹图谱信号结论相同,说明糙米的挥发性有机物随着储存时间逐渐发生变化。
图5
 新窗口打开|下载原图ZIP|生成PPT
图5样品的动态主成分分析PCA图
Fig. 5Dynamic principal component analysis (dPCA) of the sample
2.3 GC-MS与GC-IMS定性物质差异性对比
GC-IMS检测物质主要包括醛类、醇类和酮类等,表3对GC-MS和GC-IMS检测物质进行简单比对,发现在醛类物质中,己醛、苯甲醛、庚醛和反-2-辛烯醛在两种方式中都能检测到,反-2-十二烯醛仅由GC-MS检测到,而辛醛、正壬醛、戊醛和苯乙醛仅由GC-IMS检测到;在醇类物质中,己醇和1-辛烯-3-醇在两种方式下都能检测到,正十三烷-1-醇仅由GC-MS检测到,而乙醇、戊醇、叶醇等其他11种醇类仅由GC-IMS检测到;在酮类物质中,GC-MS方式下仅检测出苯乙酮1种,其余酮类物质均由GC-IMS检测得到。可以看出,两种检测方式下定性物质类别差异明显,两种方式结合能更充分地说明糙米在高温储藏时气味指纹图谱规律。Table 3
表3
表3两种检测方式下定性物质差异对比
Table 3
| 序号 Sequence | 物质 Substance | GC-MS | GC-IMS |
|---|---|---|---|
| 1 | 正己醛Hexanal | + | + |
| 2 | 苯甲醛Benzaldehyde | + | + |
| 3 | 庚醛Heptanal | + | + |
| 4 | 反-2-辛烯醛E-2-Octenal | + | + |
| 5 | 反-2-十二烯醛E-2-Dodecenal | + | - |
| 6 | 辛醛Octanal | - | + |
| 7 | 正壬醛n-Nonanal | - | + |
| 8 | 戊醛Pentanal | - | + |
| 9 | 苯乙醛Phenylacetaldehyde | - | + |
| 10 | 乙醇Etnanol | - | + |
| 11 | 3-甲基-3-丁烯-1-醇3-Methyl-3-buten-1-ol | - | + |
| 12 | 2-甲基丁醇2-Methybutanol | - | + |
| 13 | 戊醇1-Pentanol | - | + |
| 14 | 3-甲基-1-戊醇3-Methyl-1-Pentanol | - | + |
| 15 | 2-己醇2-Hexanol | - | + |
| 16 | 叶醇Z-3-Hexen-1-ol | - | + |
| 17 | 己醇1-Hexanol | + | + |
| 18 | 甲基丙醇2-Methylpropanol | - | + |
| 19 | 1-辛烯-3-醇1-Octen-3-ol | + | + |
| 20 | 2-己基己醇2-Ethylhexanol | - | + |
| 21 | 壬醇1-Nonanol | - | + |
| 22 | 丁醇1-Butanol | - | + |
| 23 | 2-甲基丙醇2-Methylpropanol | - | + |
| 24 | 正十三烷-1-醇n-Tridecan-1-ol | + | - |
| 25 | 2-甲基丙醇2-Methylpropanol | - | + |
| 26 | 2-丁酮2-Butanone | - | + |
| 27 | 2-戊酮2-Bentanone | - | + |
| 28 | 2-己酮2-Bexanone | - | + |
| 29 | 2-庚酮2-Beptanone | - | + |
| 30 | 甲基己基甲酮2-Octanone | - | + |
| 31 | 2-己酮2-Hexanone | - | + |
| 32 | 丙酮Acetone | - | + |
| 33 | 苯乙酮Acetophenone | + | - |
新窗口打开|下载CSV
3 讨论
糙米自身含有多种生物活性物质,但外层缺乏致密的稻壳保护,储藏过程中极易产生自由基和过氧化产物,如O2、OH、1O2和H2O2[18,19]。新鲜糙米内部的物质代谢仍然活跃,脂肪酸等化学成分将持续反应生成氢过氧化物,并最终裂解成挥发性醇类、醛类、酯类等小分子物质。高温储藏将推动籽粒脂质的分解,内部的不饱和脂肪酸也会加速氧化成挥发性酮类和醛类[20],明晰这种气味指纹图谱的变化规律,能直接用于评价储藏期间糙米的稳定性[21]。原理上,高温会直接导致稻谷籽粒12条“淀粉-蔗糖”代谢关联基因表达下调,引起关联酶活性变化,加速籽粒的陈化速率[22]。而多数水稻生产地纬度低且降水量充足,夏季温度能长期保持在38—41℃,极容易造成样品糊化、质构及风味的劣变[23]。此外,由高温导致的储藏湿度上升更需要重视,研究表明稻谷产后霉菌/酵母含量与环境湿度关联高达85%,远超过与储藏温度和加工方式的关联性[24]。本研究对高温胁迫下的糙米静态储藏发现,短期储藏25 d内样品挥发性即出现征兆性变化,该规律可结合特征提取数据进行区分,证实了从气味挥发角度来监测糙米储藏品质变化的可行性。糙米挥发性成分中正己醛和苯甲醛含量在高温储藏期间呈现先增加后减少的趋势,而醇类物质含量先下降后上升。适量的醛类物质具有淡水果香气,但含量过高时,会产生令人不愉悦的腐败味[25],而糙米中水果香、芳香和花香主要来源于酯类和醇类[26],储藏前期醛类物质含量的增加以及醇类物质含量的减少,说明储藏期间糙米风味受到影响,品质逐渐降低。而醛类后期的减少以及醇类后期的增加,可能是因为醇脱氢酶和醇酰基转移酶催化反应加快所导致[27]。正己醛作为亚油酸的关键氧化代谢产物,在高温储藏条件下仍是糙米气味的重要组分[28]。此外,其他不饱和脂肪酸如亚麻酸极容易在高温等极端条件下,快速降解为2-己烯醛,并进一步转化成正己醛[29]。本研究中,采用离子迁移谱定性比对表明主要成分醛类物质苯甲醛相对含量在储藏25 d时降低10.78 %,和GC-MS检测结果一致。
顶空进样结合GC-IMS方法可以实现糙米高温储藏不同时间段的准确区分。与GC-MS检测结果类似,GC-IMS检测匹配出的物质也主要包括醛类、醇类和酮类等。但经过气相串联离子迁移谱后,检测的物质种类相对更多,出现了如乙醇、戊醇、辛酸、2-丙酮等挥发性产物(表3)。谷航等[11]证实了GC-IMS技术在气味指纹图谱方面优势明显,可以用于大米早期霉变的检测;PETERSEN等[30]研究表明正戊醇是脂氧合酶催化不饱和脂肪酸的初级代谢产物,而壬醛、辛醛等物质含量主要被油酸的自氧化影响[31]。在本研究中,采用GC-MS技术并未定量出戊醇、壬醛和辛醛等物质的含量,而GC-IMS结果表明该类物质已出现在储藏过程中,证实了两种检测方式的精密度上有所差别。
GC-MS和GC-IMS作为两种典型的气味成分分析方式,在糙米挥发性成分定性定量方面优势不同。姜雯霞等[8]利用顶空固相微萃取(HS-SPME)技术结合气相-质谱法(GC-MS)对发芽糙米常温储藏下挥发性组分及其浓度进行分析发现,发芽糙米挥发性成分主要包括烃类、醛类和酯类,其次是醇类和酸类;LIU等[14]研究不同储藏条件下糙米的挥发性成分变化,发现储藏温度和储藏时间对糙米挥发物含量影响较大,而对挥发物种类影响较小,其中正己醛、庚醛、壬醛、苯甲醛等可作为储藏糙米品质的评价指标。WANG等[10]得出,GC-MS作为目前权威的挥发性组分定性和定量标准方法,也是我国轻工行业中醇类(QB/T 4849-2015)、酯类(QB/T 4850-2015)等检测的标准方法。但受前处理复杂且检测周期的限制,造成检测时效性有待进一步提高[32];而GC-IMS对物质,甚至是同分异构体,识别的准确性和灵敏度高,无需前处理,重复性好,但数据处理手段较为单一,标准误匹配数据库有待扩展,目前仍主要集中在定性方面。对比发现,GC-IMS检测方式下醛类、酮类、酸类等物质种类多于GC-MS检测,部分文献中报道的壬醛、辛醛、戊醇、己醇等挥发性物质也在本研究中被检出。GC-IMS技术在糙米储藏周期快速评价方面优势明显,而GC-MS技术在糙米挥发性组分及浓度含量检测方面说服力更强。后续研究可进一步探讨两种检测方式在环境胁迫下的糙米物质代谢规律,对应的数据结合分析手段也将推动气味检测技术在农产品领域的进一步应用。
本研究以恒温恒湿为条件,与实际动态温湿度变化有一定差异。从应用角度来看,常规粮食储运研究中采用静态储藏方法,温度、湿度设定较为单一,得出的研究结论与实际储藏存在偏差;但从理论分析来看,实际环境变化多样且无重复,试验结论重复性较差。陈银基等[33]分析的动态温湿度对储藏稻谷品质影响也是在收集环境温湿度数据基础上,提取典型温湿度值进行模拟试验。LIN等[34]根据台湾地区温度变化简要分成35℃(白天)/30℃(夜间)分阶段模拟储藏,与实际动态储藏仍存在差异。目前多数研究仍采用静态试验用以消除试验过程中不必要的误差,在阐明高温等胁迫条件下粮食生理生化干扰机制方面说服力更强。后续研究建议综合考虑环境温度、湿度、光照以及通风等环境因子的干扰,动态分析糙米储藏过程中的品质变化和气味挥发规律,并结合糙米脂肪酸代谢及基因差异表达方面,系统性阐明温度等胁迫因子对糙米挥发性物质合成及释放的分子调控机制。
4 结论
GC-MS共检测到高温胁迫下糙米储藏早期的42种挥发性成分,总含量最高的是醛类和醇类,其次为烃类和酚类,主要挥发性成分己醛含量在储藏25 d时减少了68.2 μg·kg-1,苯甲醛含量在25 d时增加了36.26 μg·kg-1。采用GC-IMS技术结合dPCA特征数据提取模式,可对高温胁迫下不同储藏时间的糙米样品进行有效区分,分类效果良好。结合GC-MS和GC-IMS分析结果发现,糙米的挥发性有机物主要有醛类、醇类、酮类和少量的酸类等,糙米的挥发性有机物随着储存时间逐渐变化,部分化合物如正己醛、苯甲醛、己醇、戊醇可作为糙米储藏期内评判新鲜程度的特征化合物。从气味角度出发,结合GC-MS和GC-IMS检测技术可以实现对高温胁迫下糙米短期储藏品质特性的无损评价。参考文献 原文顺序
文献年度倒序
文中引用次数倒序
被引期刊影响因子
URL [本文引用: 1]
URL [本文引用: 1]
DOI:10.1021/jf000885yURLPMID:11262027 [本文引用: 1]

Volatile components of uncooked Khao Dawk Mali 105 brown rice were extracted using indirect steam distillation under reduced pressure and controlled temperature in order to prevent cooking. Analysis of the fresh extract by capillary gas chromatography-mass spectrometry revealed that there were >140 volatile constituents. Among these, 70 volatiles were identified, including 2-acetyl-1-pyrroline (2AP), a key aroma compound of cooked rice. Further study concentrated on an improved method for the quantification of 2AP in uncooked brown rice. The method was simplified by utilizing a solvent extraction procedure. Quantitative analysis was performed using a capillary gas chromatographic system employing a flame ionization detector with the aid of a more selective column, CP-Wax 51, for amines. This improved chromatographic system had remarkable detection sensitivity for 2AP in the rice extracts so that 2AP in an extract of only 0.5 g of uncooked Khao Dawk Mali 105 brown rice could be detected.
DOI:10.1016/j.lwt.2018.09.018URL [本文引用: 1]
DOI:10.7506/spkx1002-6630-201024079URL [本文引用: 1]
Brown rice stored at different conditions was analyzed by using an electronic nose (PEN3) from Airsense Company in Germany. Response values of PEN3 were subjected to principal component analysis (PCA) and linear discrimination analysis (LDA). Results indicated that electronic nose could identify brown rice samples stored at different temperatures and moisture by PCA and LDA methods. In addition, brown rice samples stored in different temperatures and O2 concentrations also could be well distinguished using LDA method, but the total contribution rate of LDA was lower than that of PCA. The water content and temperature had more significant effect on the response values of electronic nose than oxygen concentration. A crossinteraction was also observed between water content and temperature. The Loadings analysis proved that sensors W5C and W1S in the electronic nose PEN3 have an important impact during the detection, which could provide the guidance to optimize and screen matrix arrangement for better performance of electronic nose.
DOI:10.3864/j.issn.0578-1752.2017.13.016URL [本文引用: 1]
【Objective】 To provide data support and a theoretical basis for small packaging rice preservation, rice was packaged in different ways. Edible quality (texture quality, pasting properties) and volatile components of rice were measured during storage, through judging the changes of rice quality, the suitable packaging method was used to carry on the preservation of rice. 【Method】In this study, “No. 99japonica rice” was used as the experimental materials. Rice were packaged in woven, natural airtight anoxia and vacuum and stored in artificial climate chamber at temperatures of 15℃, 25℃, 30℃ under 60% RH for 180 d. Edible quality and volatile components were analyzed per month. 【Result】With the extension of storage time, the elasticity and recovery of cooking rice decreased gradually, and the hardness and adhesion showed a trend of first increasing and then decreasing. The setback value increased gradually while the breakdown value first increased and then decreased, thermal paste stability became worse and easy to aging with the extension of storage time under three types of packing. There were 41 kinds of volatile compounds in fresh rice were detected, including hydrocarbons, alcohols, aldehydes, ketones, esters, organic acids and heterocyclic compounds. The content of aldehydes could be used to evaluate the taste and freshness of rice. The content of aldehydes in rice by woven bag was the highest after 180 d of storage, which accounted for more than 20% of the volatile constituents, followed by natural airtight hypoxia packaging, and there was minimum content of aldehydes in rice by vacuum packaging. 2-pentyl furan was oxidation product of linoleic acid which was only 0.30% in fresh rice, however, the content rose sharply by woven bag with the extension of storage time. The contents of aldehydes and 2-pentyl furan were greatly influenced by packaging methods, the order of the preservation effect was vacuum>natural sealed hypoxia>woven bag. However, storage quality of rice had also deterioration in high storage temperature even with vacuum packaging. 2-pentyl furan was detected in every period under three types of packing, hexaldehyde content in woven bag, natural sealed hypoxia and vacuum packaging was 1.82%, 1.55%, 1.16%, respectively. aldehyde C-9 content in woven bag, natural sealed hypoxia and vacuum packaging was 4.75%, 3.94%, 2.77%, 2-pentyl furan content in woven bag, natural sealed hypoxia and vacuum packaging was 2.27%, 1.85%, 1.43%, respectively. Thus it was deduced that woven bag packaging of rice produce more apparent the peculiar smell of the oil oxidation and aging is the worst, followed by natural airtight hypoxia packaging. Vacuum can effectively delay the rate of aging rice quality.【Conclusion】Deterioration is inevitable during the storage process. In the respect of hardness, elasticity, viscosity, resilience and gelatinization properties, rice quality after storage was inferior than fresh rice. Vacuum packaging was beneficial to rice for rice storage can effectively delay the rice deterioration. The content of aldehydes can be used to evaluate the freshness of rice. Aldehyde content in three types of packing both grew after 180 d of storage, with aldehyde content increased significantly in woven bag packaging. Aldehydes volatile components in rice, hexanal, nonanal and 2-pentyl furan can reflect the rice storage quality.
DOI:10.7506/spkx1002-6300-200920059URL [本文引用: 1]
Headspace solid phase microextraction (HS-SPME) was employed for gas chromatography-mass spectrometric (GC-MS) analysis of volatile components in paddy in this study. The optimal HS-SPME conditions such as extraction time, temperature, sample amount and equilibration time were explored prior to quantitative investigations of volatile components in paddy, which were 50 min, 80 ℃, 20 g and 60 min, respectively. The volatile compounds in paddy consisted of alcohols, aldehydes, ketones, esters, hydrocarbons, organic acids, and heterocyclic components, etc. Aldehydes were the main volatile compounds, among which hexanal accounted for the highest percentage at 13.31% in average, followed by nonanal with an average percentage of 7.93%.
[本文引用: 1]
[本文引用: 1]
[本文引用: 2]
[本文引用: 2]
[本文引用: 1]
[本文引用: 1]
DOI:10.1016/j.foodchem.2019.126158URLPMID:32014672 [本文引用: 2]
Rapid, nondestructive, high-throughput testing and screening of volatile ingredients plays an important role in food flavor analysis. Gas chromatography-ion mobility spectrometry (GC-IMS) is a powerful technique for the separation and sensitive detection of volatile organic compounds. It has a fast response, high sensitivity, easy operation, and low cost. In this article, a brief introduction to the working principle of GC-IMS is presented. A summary of recent studies of different food flavor analysis applications is also provided, including food classification and adulteration, the evaluation of food freshness and spoilage, off-flavor detection, monitoring the processing of food products, and evaluation of aroma changes during food storage. Finally, future directions of GC-IMS are proposed.
[本文引用: 2]
[本文引用: 2]
DOI:10.1016/j.foodchem.2019.03.124URLPMID:31000053 [本文引用: 1]
The flavor fingerprint of Tricholoma matsutake Singer was developed and volatile compounds were investigated by HS-GC-IMS fingerprinting combining with PCA. A total of 25 typical target compounds were identified. The differences of flavor compounds in pileus and stipe of Tricholoma matsutake Singer from different areas were observed. After drying, the concentration of C8 compounds, including 3-octanone, 3-octanol, 1-octen-3-one and 1-octanol, decreased, while the concentration of methanol and 1-pentanol increased. Subsequently, PCA was performed based on the signal intensity of the identified violate compounds, and the results clearly showed that the samples in a relatively independent space would be well distinguished. Combining the signal intensity of the identified violate compounds by HS-GC-IMS and PCA, the samples from different portions of Tricholoma matsutake Singer and different areas were distinguished. The results showed that the flavor fingerprint of Tricholoma matsutake Singer were established by HS-GC-IMS and PCA based on the identified volatile compounds.
DOI:10.1021/acs.analchem.7b03748URLPMID:29298045 [本文引用: 1]
This work describes a simple approach for the untargeted profiling of volatile compounds for the authentication of the botanical origins of honey based on resolution-optimized HS-GC-IMS combined with optimized chemometric techniques, namely PCA, LDA, and kNN. A direct comparison of the PCA-LDA models between the HS-GC-IMS and (1)H NMR data demonstrated that HS-GC-IMS profiling could be used as a complementary tool to NMR-based profiling of honey samples. Whereas NMR profiling still requires comparatively precise sample preparation, pH adjustment in particular, HS-GC-IMS fingerprinting may be considered an alternative approach for a truly fully automatable, cost-efficient, and in particular highly sensitive method. It was demonstrated that all tested honey samples could be distinguished on the basis of their botanical origins. Loading plots revealed the volatile compounds responsible for the differences among the monofloral honeys. The HS-GC-IMS-based PCA-LDA model was composed of two linear functions of discrimination and 10 selected PCs that discriminated canola, acacia, and honeydew honeys with a predictive accuracy of 98.6%. Application of the LDA model to an external test set of 10 authentic honeys clearly proved the high predictive ability of the model by correctly classifying them into three variety groups with 100% correct classifications. The constructed model presents a simple and efficient method of analysis and may serve as a basis for the authentication of other food types.
[本文引用: 2]
[本文引用: 1]
[本文引用: 1]
[本文引用: 1]
[本文引用: 1]
[本文引用: 1]
[本文引用: 1]
DOI:10.1034/j.1399-3054.1998.1040435.xURL [本文引用: 1]
[本文引用: 1]
[本文引用: 1]
DOI:10.1021/acs.jafc.7b03901URL [本文引用: 1]
DOI:10.1016/S0963-9969(03)00013-9URL [本文引用: 1]
Abstract
The pasting properties of rice flour following storage of the grain for up to 16 months were investigated. Storage produced changes in the RVA pasting curves of the flour as a varietal, time and temperature dependent phenomenon. The data confirm that viscograms from samples stored at 4 and 37°C provide a valid comparison of the effects of ageing on pasting behaviour. The most significant change in the pasting curve was the decrease in BD over time and the gradual disappearance of a clearly defined peak in aged samples. Chemical (β-mercaptoethanol) and enzyme treatments (hemicellulase, cellulase and protease) of flour obtained from aged rice produced various changes in the RVA viscograms. The most notable effect was produced by protease treatment which increased PV and decreased FV of flours from aged (higher temperature storage) rice samples. Aged samples treated in this way showed a peak and trough as normally seen in fresh rice. Thus, protein appears as a key component in the ageing process.DOI:10.1016/j.fm.2013.08.016URL [本文引用: 1]
We studied the survival and growth patterns of Bacillus cereus, mesophilic aerobic bacteria (MAB), and molds and yeasts (MY) on rough and milled brown and white Korean rice stored at 12 and 21 degrees C and 43, 68, and 85% relative humidity (RH) for up to 24 wk. The initial populations of MAB present on rough rice, brown rice, and white rice were 7.7, 5.7, and 3.3 log CFU/g, respectively, and remained constant or decreased (P <= 0.05) by 0.7-1.8 log CFU/g during storage. The initial populations of B. cereus on the three types of laboratory-inoculated rice were 3.1-3.8 log CFU/g and remained constant (P > 0.05) during storage, regardless of degree of milling, storage temperature, and RH. The initial populations of MY on rough rice, brown rice, and white rice were 6.2, 4.2, and 2.1 log CFU/g, respectively. At 12 degrees C and 85% RH, the MY increased significantly (P <= 0.05) only on brown rice; however, at 21 degrees C and 85% RH, MY increased (P <= 0.05) on all types of rice during storage. These observations will be useful when assessing conditions affecting survival of B. cereus and determining environmental conditions necessary to prevent growth of potentially mycotoxigenic molds on various types of milled rice during storage. (C) 2013 Elsevier Ltd.
DOI:10.1016/j.aca.2012.06.006URL [本文引用: 1]
Food flavor compounds due to the complexity of food as a matrix, and usually their very low concentrations in a product, as well as their low odor thresholds, create a challenge in their extraction, separation and quantitation. Food flavor volatiles represent compounds of different polarity, volatility and chemical character, which determine method of extraction for their isolation from food. Microextraction techniques, mainly SPME and SBSE have been used for food flavor compounds analysis for two decades. Microextraction methods other than SPME and SBSE are seldom used despite their analytical potential. The review discusses the nature of food flavor compounds, and different approaches to food flavor analysis. It summarizes the use of microextraction methods in food flavor compounds analysis based on papers published in the last 5 years, and discusses the potential of microextraction methods in this field. (C) 2012 Elsevier B.V.
[本文引用: 1]
[D].
[本文引用: 1]
[D].
[本文引用: 1]
DOI:10.1016/j.jfda.2017.04.005URLPMID:29389563 [本文引用: 1]
The authenticity determination of white rice is crucial to prevent deceptive origin labeling and dishonest trading. However, a non-destructive and comprehensive method for rapidly discriminating the geographical origins of white rice between countries is still lacking. In the current study, we developed a volatile organic compound based geographical discrimination method using headspace solid-phase microextraction coupled to gas chromatography-mass spectrometry (HS-SPME/GC-MS) to discriminate rice samples from Korea and China. A partial least squares discriminant analysis (PLS-DA) model exhibited a good classification of white rice between Korea and China (accuracy = 0.958, goodness of fit = 0.937, goodness of prediction = 0.831, and permutation test p-value = 0.043). Combining the PLS-DA based feature selection with the differentially expressed features from the unpaired t-test and significance analysis of microarrays, 12 discriminatory biomarkers were found. Among them, hexanal and 1-hexanol have been previously known to be associated with the cultivation environment and storage conditions. Other hydrocarbon biomarkers are novel, and their impact on rice production and storage remains to be elucidated. In conclusion, our findings highlight the ability to rapidly discriminate white rice from Korea and China. The developed method maybe useful for the authenticity and quality control of white rice.
[本文引用: 1]
URL [本文引用: 1]
DOI:10.1016/j.foodchem.2014.09.082URLPMID:25442558 [本文引用: 1]
The volatile fractions of six Italian high-quality rice cultivars were investigated by HS-SPME-GC-MS to define fingerprinting and identify chemical markers and/or indices of ageing and aroma quality. In particular, four non-aromatic (Carnaroli, Carnise, Cerere and Antares) and two aromatic (Apollo and Venere) rices, harvested in 2010 and 2011, were monitored over 12months. Twenty-five aroma components were considered and, despite considerable inter-annual variability, some of them showed similar trends over time, including 2-(E)-octenal as a marker of ageing for all cultivars, and heptanal, octanal and 2-ethyl hexanol as cultivar-specific indicators. The area ratios 2-acetyl-1-pyrroline/1-octen-3-ol, for Venere, and 3-methyl-1-butanol/2-methyl-1-butanol, for Apollo, were also found to act as ageing indices. Additional information on release of key-aroma compounds was also obtained from quantitation and its dependence on grain shape and chemical composition. Heptanal/1-octen-3-ol and heptanal/octanal ratios were also defined as characterising the aroma quality indices of the six Italian rice cultivars investigated.
URL [本文引用: 1]
URL [本文引用: 1]
URL [本文引用: 1]
DOI:10.1021/jf101575jURLPMID:20839801 [本文引用: 1]
The present study was performed to understand the effects of high temperature (HT) during filling on the expression of storage proteins and the quality of rice grains. HT (35/30 degrees C day/night) reduced the weight, amylose content, and flour gel consistency of grains. It increased the accumulation of all classes of storage proteins at early filling stage but decreased the accumulation of prolamins at maturation. For albumins, the expressions of cyclophilin 2, peroxiredoxin, and HSP16.9 were differentially enhanced by HT. For globulins, HT decreased the accumulation of globulin but increased that of glyoxalase I and peroxiredoxin. HT enhanced the transcription of genes for glutelins, prolamins, globulins, and protein disulfide isomerase at early filling stage but decreased the expression of these genes at a later stage. Low amounts of prolamins and globulins, as well as low pH value, were found in sound, immature, and dead kernels grown under HT. The relationships among HT, storage proteins, and grain quality are discussed.
