 ,, 邢光南, 王吴彬, 赵团结, 盖钧镒,南京农业大学大豆研究所/国家大豆改良中心/农业部大豆生物学与遗传育种重点实验室/作物遗传与种质创新国家重点实验室/江苏省现代作物生产协同创新中心,南京 210095
A Comparative Study on Linkage and Association QTL Mapping for Seed Isoflavone Contents in a Recombinant Inbred Line Population of Soybean
LIU ZaiDong, MENG Shan, HE JianBo,, XING GuangNan, WANG WuBin, ZHAO TuanJie, GAI JunYi,Soybean Research Institute, Nanjing Agricultural University/National Center for Soybean Improvement/Key Laboratory of Biology and Genetic Improvement of Soybean (General), Ministry of Agriculture/State Key Laboratory for Crop Genetics and Germplasm Enhancement/Jiangsu Collaborative Innovation Center for Modern Crop Production, Nanjing 210095通讯作者:
责任编辑: 李莉
收稿日期:2019-09-9接受日期:2020-01-2网络出版日期:2020-05-16
| 基金资助: |
Received:2019-09-9Accepted:2020-01-2Online:2020-05-16
作者简介 About authors
刘再东,E-mail:2714699171@qq.com。
孟珊,E-mail:mshan84@163.com。

摘要
关键词:
Abstract
Keywords:
PDF (2930KB)元数据多维度评价相关文章导出EndNote|Ris|Bibtex收藏本文
本文引用格式
刘再东, 孟珊, 贺建波, 邢光南, 王吴彬, 赵团结, 盖钧镒. 大豆重组自交系群体异黄酮含量QTL连锁定位与关联定位的比较研究[J]. 中国农业科学, 2020, 53(9): 1756-1772 doi:10.3864/j.issn.0578-1752.2020.09.006
LIU ZaiDong, MENG Shan, HE JianBo, XING GuangNan, WANG WuBin, ZHAO TuanJie, GAI JunYi.
0 引言
【研究意义】异黄酮是一类重要的次级代谢产物,在大豆和其他豆类植物中含量较为丰富。异黄酮作为一种抗菌剂可以防御病原体和害虫对植物的入侵[1,2],医学研究显示人体每天摄入异黄酮可以预防前列腺癌、乳腺癌和骨质疏松症等疾病[3,4]。据报道,与大豆籽粒蛋白质和油脂含量相比,异黄酮总含量较低,仅为416—6 808 μg·g-1[5]。因此,培育高异黄酮含量大豆品种有利于食品和保健产业。【前人研究进展】大豆籽粒中可分离出12种异黄酮组分,依据苯环配基差异可归为三大类:大豆苷类异黄酮、染料木苷类异黄酮和黄豆苷类异黄酮,三类异黄酮的含量比例通常保持在4﹕5﹕1[6]。每类异黄酮再结合葡萄糖、乙酰葡萄糖和丙二酰葡萄糖形成相应的糖苷[2],其中,葡萄糖苷和乙酰葡萄糖苷在高效液相色谱(high performance liquid chromatography,HPLC)分析中含量较低,通常认为它们是样品预处理期间丙二酰葡萄糖苷的降解产物[7]。三类异黄酮的功能也存在一定差异。大豆苷类异黄酮的代谢产物雌马酚可以治疗乳腺癌,染料木苷类异黄酮作为某种酶的诱导剂有助于治疗动脉硬化[8],黄豆苷类异黄酮可以抑制成骨细胞的增殖以治疗骨质疏松症[9,10]。目前,多数研究报道了大量大豆籽粒异黄酮含量QTL(quantitative trait locus)分布于所有大豆染色体上[11,12,13,14,15,16,17,18]。LIANG等[11]利用包含474个家系的重组自交系群体,检测到6个异黄酮含量QTL,分布在大豆4条染色体上。WANG等[13]利用重组自交系群体检测到34个异黄酮含量QTL,其中23个QTL为新发现位点,在Satt186与Satt226间的QTL qGTD2_1在4个环境中均被检测到,表型变异解释率为3.4%—11.0%。ZHANG等[16]检测到22个异黄酮含量QTL,分布在大豆8条染色体上,表型变异解释率为4.5%—7.9%,同时检测到3对异黄酮含量上位性QTL,其中,qEGp1和qEGw1影响黄豆黄苷含量,qETISOp1影响大豆异黄酮总含量。ZENG等[19]使用单因素方差分析和按性状分型的方法同时分析了加性以及加性与环境互作QTL。GUTIERREZ-GONZALEZ等[20,21,22]使用混合模型复合区间作图法(MCIM)鉴定了一些在不同环境中均能稳定影响异黄酮含量的主效QTL。LI等[23]基于大豆重组自交系群体检测到48个加性QTL,表型变异解释率为3.0%—29.8%,其中,与黄豆苷类、染料木苷类和总异黄酮含量有关的8个QTL均被定位于A1连锁群的相同区域内,且表型变异解释率均大于14.0%,并经不同群体定位分析得以验证。PEI等[24]利用包含3 541个SLAF标记的高密度遗传图谱,在4个环境中检测到24个异黄酮含量QTL,其中,包括与染料木苷、丙二酰大豆苷、丙二酰染料木苷和总异黄酮含量相关的各1个新的QTL,另外还检测到9个上位性QTL。CAI等[25]通过构建高密度遗传图谱,于多环境下检测到15个异黄酮含量QTL,分布在大豆10条染色体上。异黄酮含量是由许多微效QTL控制的复杂数量性状,其中大部分QTL难以定位到遗传连锁图谱上,此外异黄酮含量在不同环境中的表型变异也是不稳定的[18,19,20]。目前,关于异黄酮相关基因、与异黄酮合成关键酶相互作用的转录因子的研究已有不少报道[26,27,28],朱莹等[26]克隆了一个与大豆异黄酮合成相关的R2R3类型MYB转录因子GmMYB184,验证了该转录因子对异黄酮合成途径关键基因的转录激活活性及其在异黄酮合成中的正向调控作用。CHU等[27]利用关联分析方法检测到与异黄酮含量显著相关的28个SNP标记及一个候选基因GmMYB29,并证明GmMYB29通过激活IFS2(异黄酮合酶2)和CHS8(查尔酮合成酶8)启动子,进而调控异黄酮含量。VADIVEL等[28]研究表明转录因子GmMYB176通过激活CHS8的表达进而调控异黄酮的合成。【本研究切入点】全面解析异黄酮含量的遗传结构有助于了解大豆籽粒异黄酮含量的遗传模式并培育高异黄酮含量大豆新品种。获得可靠稳定的QTL是分子标记辅助育种的第一个重要步骤,由于不同的QTL检测方法对异黄酮含量的遗传解析效果不尽相同,因此,有必要比较不同定位方法以便使用更高效的统计模型在多种环境中检测异黄酮含量QTL。连锁定位MCIM方法基于多环境表型数据,不仅可以检测加性QTL和上位性QTL,还能够检测与环境互作QTL[29]。PAN等[30]基于大豆重组自交系群体全基因组SNP分子标记和开花期数据,比较了不同QTL定位方法和不同标记类型在QTL定位中的应用效果。结果显示基于SNP连锁不平衡区块(SNP linkage disequilibrium block,SNPLDB)标记的限制性两阶段多位点全基因组关联分析(restricted two-stage multi- locus genome-wide association analysis,RTM-GWAS)方法[31,32]不仅能检测较多的QTL,而且能合理估计QTL表型变异解释率,更适用于重组自交系群体。因此,连锁定位MCIM方法和关联定位RTM-GWAS方法的联合分析可能为全面解析异黄酮含量QTL提供新思路。【拟解决的关键问题】本研究在5个环境中,同时采用连锁定位MCIM方法和关联定位RTM-GWAS方法解析重组自交系群体NJRSXG异黄酮总含量(total isoflavone content,SIFC)、大豆苷类异黄酮总含量(total daidzin group content,TDC),染料木苷类异黄酮总含量(total genistin group content,TGC)和黄豆苷类异黄酮总含量(total glycitin group content,TGLC)4个异黄酮含量性状的遗传结构,并鉴定其加性QTL、上位性QTL以及与环境互作QTL。1 材料与方法
1.1 材料与田间试验
以先进2号(异黄酮含量高)和赶泰-2-2(异黄酮含量低)为亲本,采用单粒传法衍生了包含147个家系的重组自交系群体NJRSXG。到2009年种植时,该群体处于F2:8:14世代。供试材料为NJRSXG群体及其亲本,田间试验分别于2009、2010和2011年夏季在南京农业大学江浦农学试验站进行(长江以北),其中2009年夏季同时在南京农业大学溧水大豆试验点进行(长江以南)。另外,2010年在江浦同时进行了晚播试验,播种日期比同年正常日期推迟一个月,一些非生物胁迫如光照、时间和土壤水分在正常播种和晚播材料之间存在显著差异。因此,涉及5个环境,试验设计均采用完全随机区组设计,2次重复,穴播,每穴作为一个小区,每穴定苗8株,穴距0.8 m。每个小区内随机挑选100粒干燥成熟种子用于异黄酮含量测定。
1.2 异黄酮含量测定
参考王春娥等[33]方法进行异黄酮提取与含量测定。使用FOSS 1095 Knifetec研磨器将每份种子样品磨成细粉。样品分为2份,一份用于含水量测定(105℃,≥5 h);另一份用于提取异黄酮。将15 mg样品于2 mL微型离心管中,加入1.5 mL 80%(v/v)甲醇,50℃超声辅助提取1 h,冷却至室温后,将提取物以12 000 r/min离心10 min。将上清液通过Whatman 0.45-μm 25-mm PTFE有机相针式滤器过滤,取10 μL滤液使用Agilent Zorbax SB-C18色谱柱(4.6 mm×150 mm, 5 μm)通过Agilent 1100反相HPLC进行分析,柱温为50℃,流速为2.0 mL·min-1。流动相A为0.1%(v/v)乙酸,流动相B为100%甲醇。梯度洗脱为:0—2 min(27%B),2—3 min(27%—36%B),3—6 min(36%B),6—7min(36%—33%B),7—13 min(33%B),13—14 min(33%—27%B)和14—15 min(27%B)。检测波长为254 nm(DAD检测器,Agilent,美国)。采用外标法定量异黄酮,使用12种异黄酮标准品。以每克干大豆籽粒异黄酮含量为指标(单位为μg·g-1)。共定量了4个异黄酮含量性状,分别为异黄酮总含量(SIFC)、大豆苷类异黄酮总含量(TDC)、染料木苷类异黄酮总含量(TGC)和黄豆苷类异黄酮总含量(TGLC)。SIFC为TDC、TGC和TGLC之和。TDC为大豆苷元(Daidzein)、大豆苷(Daidzin)、乙酰基大豆苷(6’-O-acetyldaidzin)和丙二酰基大豆苷(6’-O-malonyldaidzin)含量之和。TGC为染料木苷元(Genistein)、染料木苷(Genistin)、乙酰基染料木苷(6’-O-acetylgenistin)和丙二酰基染料木苷(6’-O-malonylgenistin)含量之和。TGLC为黄豆苷元(Glycitein)、黄豆苷(Glycitin)、乙酰基黄豆苷(6’-O-acetylglycitin)和丙二酰基(6’-O- malonylglycitin)黄豆苷含量之和。
1.3 遗传连锁图谱构建
NJRSXG群体遗传连锁图由国家大豆改良中心和中国科学院遗传与发育生物研究所共同构建[34]。使用来自SoyBase(http://soybase.org)的937个SSR标记,以及设计的540个EST-SSR和231个BAC-SSR,共1 732个分子标记筛选多态性,获得447个差异标记位点。最后使用JoinMap软件[35]将400个标记(285个SSR、74个EST-SSR和68个BAC-SSR)整合到一张连锁图谱中。遗传连锁图谱由23个连锁群组成,全长1 447.9 cM,标记平均间距为3.9 cM,标记顺序与大豆公共遗传连锁图谱[36]基本一致。1.4 统计分析
根据如下线性模型进行多环境联合方差分析:$y_{ijk}=\mu+e_i+r_{j(i)}+g_k+(ge)_{ik}+\varepsilon_{ijk}$
其中,μ为群体平均数,ei为第i个环境效应,rj(i)为第i个环境内第j个区组的效应,gk为第k个基因型效应,(ge)ik为基因型与环境互作效应,εijk为随机误差。使用SAS软件[37]的PROC GLM进行联合方差分析,其中,环境、区组(环境)、基因型、基因型与环境互作,均视为随机效应。
多环境性状遗传率估计为$h^2=\sigma_g^2/(\sigma_g^2+\sigma_{ge}^2/t+\sigma^2/st)$,单环境性状遗传率估计为$h^2=\sigma_g^2/(\sigma_g^2+\sigma^2/s)$,其中,$\sigma_g^2$、$\sigma_{ge}^2$和$\sigma^2$分别为基因型方差、基因型与环境互作方差和误差方差,t为环境个数,s为重复数。遗传变异系数(genetic coefficient of variation,GCV)为$\sigma_g/\mu $。使用SAS软件PROC VARCOMP程序获得相应方差组分估计。
1.5 QTL定位
采用混合线性模型复合区间作图法(MCIM)进行加性QTL、上位性QTL以及与环境互作加性和上位性QTL检测。利用QTLNetwork软件进行MCIM方法计算,以排列测验1 000次的F值为统计检验阈值检测QTL,基因组扫描窗口大小为10 cM,步长为1 cM,其他参数保持默认。同时,还采用HE等[31,32]发展的限制性两阶段多位点全基因组关联分析(RTM-GWAS)方法,检测异黄酮含量关联标记位点,QTL检测显著水平设0.01。RTM-GWAS方法基于多位点模型,同时能够检测与环境互作QTL。比较来自不同作图方法的结果时,若不同方法定位到的某两QTL间的遗传距离小于5 cM,则认为此两QTL是相同的,该位点被不同方法同时检测到[38,39,40]。2 结果
2.1 异黄酮组分性状的表型变异
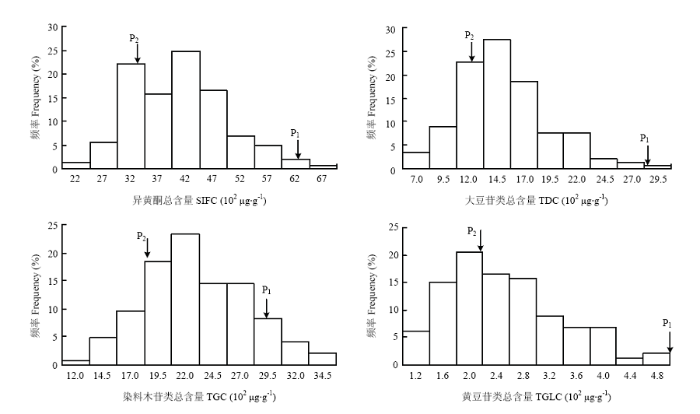
次数分布表及频率分布图显示4个异黄酮含量性状呈连续性变化,为数量性状特征(表1和图1)。NJRSXG群体2个亲本间存在显著差异,母本先进2号是异黄酮含量极高的大豆栽培品种,异黄酮总含量(SIFC)为6 302 μg·g-1,而父本赶泰-2-2的异黄酮总含量仅为3 401 μg·g-1。整体来看,群体在低值、高值2个方向上都出现了超亲分离,4个异黄酮含量性状低值方向的超亲分离趋势均强于高值方向(其中TGLC在高值方向未发现有超亲分离现象)。多环境联合方差分析显示,家系间异黄酮含量性状变异远大于家系与环境互作的变异,即使后者差异显著,但F值不大,表明这些异黄酮含量性状在不同环境中表现相对一致。异黄酮含量性状遗传率极高,异黄酮总含量(SIFC)的遗传率为94.1%,大豆苷类异黄酮总含量(TDC)、染料木苷类异黄酮总含量(TGC)和黄豆苷类异黄酮总含量(TGLC)的遗传率为92.7%—95.4%。Table 1
表1
表1异黄酮含量(102 μg·g-1)的次数分布
Table 1
| 性状 Trait | 组中值及频数 Midpoint and frequency | N | P1 | P2 | 平均值 Mean | 变幅 Range | GCV (%) | h2 (%) | |||||||||
|---|---|---|---|---|---|---|---|---|---|---|---|---|---|---|---|---|---|
| SIFC | 22 | 27 | 32 | 37 | 42 | 47 | 52 | 57 | 62 | 67 | |||||||
| 2 | 8 | 32 | 23 | 36 | 24 | 10 | 7 | 3 | 1 | 146 | 63.0 | 34.0 | 40.6 | 21.9—67.7 | 20.9 | 94.1 | |
| TDC | 7.0 | 9.5 | 12.0 | 14.5 | 17.0 | 19.5 | 22.0 | 24.5 | 27.0 | 29.5 | |||||||
| 5 | 13 | 33 | 40 | 27 | 11 | 11 | 3 | 2 | 1 | 146 | 28.4 | 12.8 | 15.1 | 7.3—29.5 | 26.9 | 95.4 | |
| TGC | 12.0 | 14.5 | 17.0 | 19.5 | 22.0 | 24.5 | 27.0 | 29.5 | 32.0 | 34.5 | |||||||
| 1 | 7 | 14 | 27 | 34 | 21 | 21 | 12 | 6 | 3 | 146 | 28.9 | 19.1 | 23.1 | 12.6—35.6 | 19.5 | 92.7 | |
| TGLC | 1.2 | 1.6 | 2.0 | 2.4 | 2.8 | 3.2 | 3.6 | 4.0 | 4.4 | 4.8 | |||||||
| 9 | 22 | 30 | 24 | 23 | 13 | 10 | 10 | 2 | 3 | 146 | 5 .8 | 2.2 | 2.5 | 1.1—5.0 | 32.3 | 94.0 | |
新窗口打开|下载CSV
图1
 新窗口打开|下载原图ZIP|生成PPT
图1异黄酮含量(102 μg·g-1)的频率分布
SIFC:异黄酮总含量;TDC:大豆苷类异黄酮总含量;TGC:染料木苷类异黄酮总含量;TGLC:黄豆苷类异黄酮总含量。下同
Fig. 1Frequency distribution of isoflavone content (102 μg·g-1)
SIFC: Total isoflavone content; TDC: Total daidzin group content; TGC: Total genistin group content; TGLC: Total glycitin group content. The same as below
异黄酮含量性状间具有不同程度相关性(表2)。4个异黄酮组分性状,异黄酮总含量(SIFC)、大豆苷类异黄酮总含量(TDC)、染料木苷类异黄酮总含量(TGC)和黄豆苷类异黄酮总含量(TGLC)之间均呈正相关,SIFC与TDC、TGC相关系数分别为0.95和0.97,而与TGLC之间的相关性略低,相关系数为0.39。TDC、TGC和TGLC之间的相关性相对较低,相关系数分别为0.26和0.32,表明大豆苷类和染料木苷类异黄酮的生物合成和遗传变异相似,这两种成分对异黄酮总含量有显著影响,而黄豆苷类异黄酮的合成和变异有其自身的特点,这也暗示具有高度显著相关性的不同性状的一些QTL可能共享相同的基因组区域。
Table 2
表2
表2异黄酮含量性状间相关系数
Table 2
| 性状Trait | SIFC | TDC | TGC |
|---|---|---|---|
| TDC | 0.95** | ||
| TGC | 0.97** | 0.87** | |
| TGLC | 0.39** | 0.26** | 0.32** |
新窗口打开|下载CSV
2.2 异黄酮含量的连锁定位
MCIM方法共检测到4个异黄酮总含量(SIFC)加性QTL和15个异黄酮组分含量(TDC、TGC和TGLC)的加性QTL(表3)。加性效应的总贡献率为15.9%(TGLC)—27.3%(TGC),上位性效应的总贡献率为1.0%(SIFC)—15.4%(TGLC)。而性状遗传率远大于其加性和上位性QTL的总贡献率,表明许多未被定位到的QTL贡献了大部分遗传率。单个QTL的表型变异解释率为0.2%—10.6%,其中qSifc-14-1和qTgc-14-1的贡献率均超过10.0%,并且被定位在相同标记区间GNE186b—Satt020内(表4)。此外,MCIM方法检测到与SIFC相关的1对上位性QTL,与其余3个组分含量性状相关的共15对上位性QTL,其表型变异解释率为0.2%—4.6%。Table 3
表3
表3异黄酮含量MCIM方法遗传解析
Table 3
| 性状 Trait | 基因型变异 h2 Genotype variation (%) | 基因型×环境变异 h2 Genotype×Env. variation (%) | ||||
|---|---|---|---|---|---|---|
| 总计Total | Add.QTL | Epi.QTL | 总计Total | Add.QTL×Env. | Epi.QTL×Env. | |
| SIFC | 94.1 | 25.8 (4) | 1.0 (1) | 3.9 | 0.5 | 0.1 |
| TDC | 95.4 | 23.7 (5) | 12.0 (6) | 3.1 | 0.6 | 0.7 |
| TGC | 92.7 | 27.3 (6) | 5.4 (4) | 5.0 | 1.4 | 0.8 |
| TGLC | 94.0 | 15.9 (4) | 15.0 (5) | 3.3 | 0.8 | 0.9 |
新窗口打开|下载CSV
Table 4
表4
表4MCIM方法检测的异黄酮含量QTL
Table 4
| 性状 Trait | QTL | 连锁群 Group | 位置 Position(cM) | 标记区间 Marker interval | 区间长度 Interval length (cM) | h2Add (%) | 互作QTL Epistatic QTL | h2Epi (%) | 参考文献 Reference |
|---|---|---|---|---|---|---|---|---|---|
| SIFC | qSifc-03-1 | 3 | 32.4 | Satt521—GNE324 | 11.1 | 4.2 | [11,14] | ||
| qSifc-10-1 | 10 | 33.6 | GNE061—GNB130 | 4.0 | qSifc-17-1 | 1.0 | |||
| qSifc-14-1 | 14 | 13.9 | GNE186b—Satt020 | 2.9 | 10.6 | [15] | |||
| qSifc-17-1 | 17 | 20.4 | Sat_022—Satt186 | 10.2 | qSifc-10-1 | 1.0 | [11] | ||
| qSifc-18-1 | 18 | 1.4 | Sat_210—Sat_168 | 1.1 | 4.4 | [41] | |||
| qSifc-19-1 | 19 | 38.1 | Satt481—GNE091 | 0.1 | 6.6 | [13] | |||
| TDC | qTdc-01-1 | 1-1 | 9.1 | Sat_353—Satt532b | 3.4 | qTdc-10-1 | 1.3 | ||
| qTdc-02-1 | 2 | 57.1 | BF070293—Satt634 | 0.9 | qTdc-02-2 | 2.7 | |||
| qTdc-02-2 | 2 | 23.8 | Satt282—Satt124c | 18.2 | qTdc-02-1 | 2.7 | |||
| qTdc-03-1 | 3 | 67.3 | Satt584—GNE333 | 2.2 | qTdc-10-2 | 3.4 | |||
| qTdc-03-2 | 3 | 20.1 | Satt339—Satt660 | 1.3 | 3.1 | ||||
| qTdc-08-1 | 8-2 | 2.2 | Satt089—Satt455b | 0.6 | 3.8 | ||||
| qTdc-08-2 | 8-2 | 82.3 | Satt409—GNE376 | 10.3 | 2.3 | [18] | |||
| qTdc-10-1 | 10 | 22.1 | Satt153—Satt188 | 6.3 | qTdc-01-1 | 1.3 | |||
| qTdc-10-2 | 10 | 1.8 | GNB134—Sat_282 | 1.2 | qTdc-03-1 | 3.4 | |||
| qTdc-10-3 | 10 | 29.9 | GNE262—GNE057 | 0.9 | qTdc-17-1 | 1.2 | |||
| qTdc-12-1 | 12 | 17.2 | GNE229—Satt192 | 9.3 | qTdc-16-1 | 0.5 | [18,21-22] | ||
| qTdc-14-1 | 14 | 0.0 | Satt304—Sat_191a | 3.4 | qTdc-15-1 | 3.3 | |||
| qTdc-14-2 | 14 | 13.9 | GNE186b—Satt020 | 2.9 | 8.7 | ||||
| qTdc-15-1 | 15-2 | 0.0 | Satt651—Satt691 | 20.2 | qTdc-14-1 | 3.3 | [15] | ||
| qTdc-16-1 | 16 | 52.1 | Sat_151—Satt529 | 0.2 | qTdc-12-1 | 0.5 | [22] | ||
| qTdc-17-1 | 17 | 99.8 | Satt002—GNE158 | 12.5 | qTdc-10-3 | 1.2 | |||
| qTdc-18-1 | 18 | 1.0 | Satt038—Sat_210 | 1.4 | 5.8 | ||||
| TGC | qTgc-02-1 | 2 | 2.0 | GNE278—Satt141 | 9.4 | qTgc-19-3 | 3.3 | ||
| qTgc-03-1 | 3 | 31.4 | Satt521—GNE324 | 11.1 | 4.1 | ||||
| qTgc-03-2 | 3 | 5.4 | Sat_306—Sat_239 | 3.9 | qTgc-08-1 | 0.2 | |||
| qTgc-08-1 | 8-1 | 3.4 | Satt177a—Sat_406 | 12.5 | qTgc-03-2 | 0.2 | [14-15] | ||
| qTgc-10-1 | 10 | 2.8 | GNB134—Sat_282 | 1.2 | qTgc-19-2 | 1.1 | |||
| qTgc-10-2 | 10 | 33.6 | GNE061—GNB130 | 4.0 | qTgc-17-1 | 0.8 | |||
| qTgc-13-1 | 13 | 21.4 | GNB007—Satt362 | 4.3 | 2.5 | ||||
| qTgc-14-1 | 14 | 13.9 | GNE186b—Satt020 | 2.9 | 10.3 | ||||
| qTgc-17-1 | 17 | 23.4 | Sat_022—Satt186 | 10.2 | qTgc-10-2 | 0.8 | [12-13] | ||
| qTgc-18-1 | 18 | 19.4 | GNE001b—Satt324 | 21.4 | 3.9 | ||||
| qTgc-19-1 | 19 | 58.5 | Satt232—Satt681 | 8.4 | 0.2 | ||||
| qTgc-19-2 | 19 | 48.1 | GNE091—GNE397b | 14.7 | qTgc-10-1 | 1.1 | |||
| qTgc-19-3 | 19 | 38.1 | Satt481—GNE091 | 0.1 | 6.3 | qTgc-02-1 | 3.3 | [13,21-22] | |
| TGLC | qTglc-01-1 | 1-1 | 9.1 | Sat_353—Satt532b | 3.4 | qTglc-14-1 | 3.6 | [41] | |
| qTglc-02-1 | 2 | 14.0 | Satt483—Satt579 | 0.2 | qTglc-14-2 | 2.4 | |||
| qTglc-05-1 | 5 | 47.2 | Satt619a—GNE055 | 1.7 | qTglc-12-1 | 3.6 | |||
| qTglc-05-2 | 5 | 12.6 | GNE041—Satt174 | 3.8 | qTglc-12-2 | 1.2 | [21] | ||
| qTglc-06-1 | 6 | 78.8 | Satt079—GNB215a | 13.0 | 5.3 | [15,21] | |||
| qTglc-08-1 | 8-2 | 4.8 | GNE072b—Satt525 | 3.9 | 4.5 | [13,41] | |||
| qTglc-10-1 | 10 | 50.9 | Satt259—Satt455a | 10.9 | 2.9 | qTglc-17-1 | 4.6 | ||
| qTglc-12-1 | 12 | 15.2 | GNE229—Satt192 | 9.3 | qTglc-05-1 | 3.6 | [14] | ||
| qTglc-12-2 | 12 | 40.8 | GNE351—Satt279 | 15.1 | qTglc-05-2 | 1.2 | [14] | ||
| qTglc-14-1 | 14 | 3.4 | Sat_191a—Sat_355 | 0.6 | qTglc-01-1 | 3.6 | |||
| qTglc-14-2 | 14 | 11.3 | Satt556—GNE421 | 2.0 | qTglc-02-1 | 2.4 | |||
| qTglc-17-1 | 17 | 80.8 | Sat_220—Satt397 | 7.1 | 3.2 | qTglc-10-1 | 4.6 | [15-16,22] |
新窗口打开|下载CSV
MCIM方法检测到与SIFC相关的4个加性QTL,分布在第3、14、18和19染色体上,QTL表型贡献率为4.2%—10.6%,合计25.8%(表4)。其中,qSifc-14-1的贡献率在5种环境中均超过10.0%。仅发现1对上位性QTL,表型贡献率为1.0%。上位性QTL的贡献率仅占SIFC遗传率(94.1%)的微小部分,未检测到的QTL总贡献率约为67.3%。检测到与TDC相关的5个加性QTL,分布于第3、8、14和18染色体上,QTL表型贡献率为2.3%—8.7%,合计23.7%。对每个单环境进行分析,也检测到了qTdc-14-2,表型贡献率为8.7%。共检测到6对上位性QTL,分布于9条染色体上,总贡献率为12.4%。加性QTL的总贡献率几乎是上位性QTL的2倍。检测到的QTL总贡献率为36.1%,未检测到的QTL解释了超过一半的表型变异。与TGC相关的6个加性QTL分布在第3、13、14、18和19染色体上,表型贡献率为0.2%—10.3%,总计27.3%。其中,qTgc-14-1的贡献率为10.3%,且在5种环境中都发现了该位点。同时检测到4对上位性QTL,分布在6条染色体上,总贡献率为5.4%。加性QTL的总贡献率远大于上位性QTL,两者累积为32.7%,未检测到的QTL解释了约60.0%的表型变异。检测到与TGLC相关的4个加性QTL,分布在第6、8、10和17染色体上。表型贡献率为2.9%—5.3%,总计15.9%。在7条染色体上检测到5对上位性QTL,总贡献率为15.4%。加性效应的总贡献率与上位性效应几乎相同,2种贡献率的总和为31.3%,小于未被定位的QTL总贡献率。
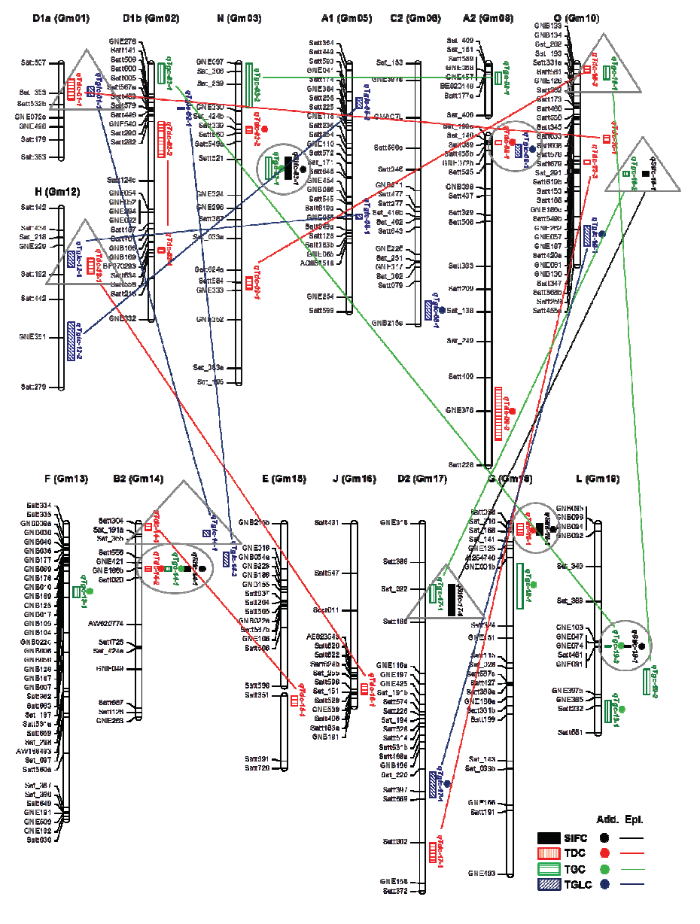
图2显示了异黄酮总含量(SIFC)及3个组分总含量(TDC、TGC和TGLC)性状中重叠的QTL或基因组区域。第3染色体上的Satt521—GNE324、第8染色体上的Satt089—Satt525、第14染色体上的GNE186b—Satt020、第18染色体上的Satt038—Sat_168及第19染色体上的Satt481—GNE091区间是主要的加性QTL区域,每个区域均包含不同性状的QTL,与SIFC相关的4个加性QTL全部位于主要区域内。第14染色体上的GNE186b—Sat020区域最为重要,位于该区域的3个加性QTL,qSifc-14-1、qTdc-14-2和qTgc-14-1在对应性状中均具有最高的贡献率,3个QTL的加性效应均为负,表明低异黄酮含量亲本赶泰-2-2为提高SIFC,TDC和TGC含量各提供了一个等位基因。而第1染色体上的Sat_353—Satt532b、第10染色体上的GNB134—Sat_282和GNE061—GNB130、第12染色体上的GNE229—Satt192、第14染色体上的Satt304—Sat_355和第17染色体上的Sat_022—Satt186标记区间是主要上位性QTL区域,每个区域内主要包括SIFC和TGC的上位性QTL,或者TDC和TGLC的上位性QTL。值得注意的是在11个主要QTL区域,除加性QTL区域内qTgc-19-3同时具备上位性外,其余区域内的QTL只有加性或上位性效应。
图2
 新窗口打开|下载原图ZIP|生成PPT
图2异黄酮含量加性和上位性QTL
环形代表主要的加性QTL区域,三角形代表主要的上位性QTL区域,连接2个QTL的直线代表上位性效应
Fig. 2Additive and epistatic QTLs for the isoflavone content
Circle represent the major additive QTL region and triangle represents the major epistatic QTL region. The straight line linking two QTLs is defined as the epistatic effect
2.3 异黄酮含量多位点关联分析
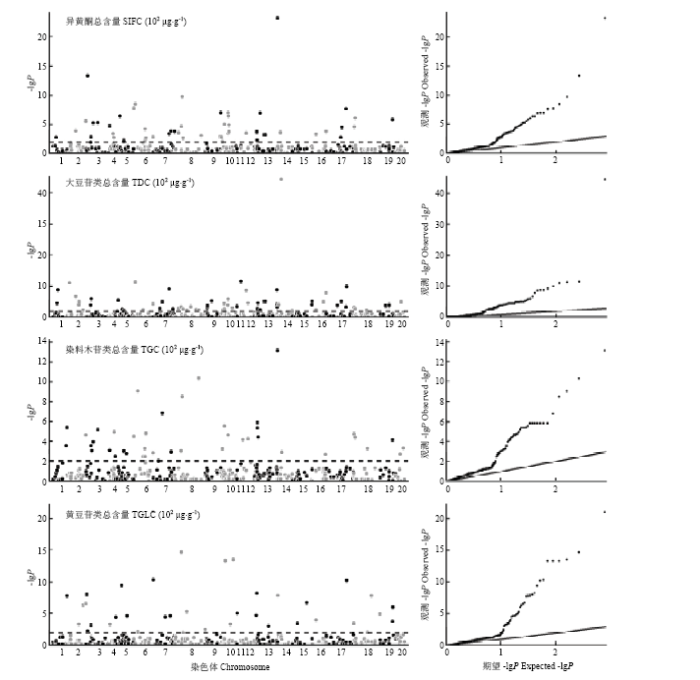
利用限制性两阶段多位点全基因组关联分析(RTM-GWAS)方法分别检测到51、66、42和36个与异黄酮总含量(SIFC)、大豆苷类异黄酮总含量(TDC)、染料木苷类异黄酮总含量(TGC)和黄豆苷类异黄酮总含量(TGLC)关联的标记位点(图3),总表型变异解释率(包括位点主效和位点与环境互作效应)分别为44.4%、52.5%、39.7%和45.6%(表5),其中位点主效表型变异解释率为34.9%(TGC)—47.0%(TDC),位点与环境互作效应表型变异解释率为2.3%(TGLC)—5.5%(TDC)。可见,异黄酮含量主要由主效位点控制,与环境互作效应相对较小,这与MCIM方法结果一致。图3
 新窗口打开|下载原图ZIP|生成PPT
图3异黄酮含量关联分析
Fig. 3Association mapping of isoflavone content
Table 5
表5
表5异黄酮含量关联标记/QTL
Table 5
| 性状 Trait | 标记/QTL Marker/QTL | 连锁群 Group | 位置 Position (cM) | Model a -lgP | QTL | QTL×Env. b | ||
|---|---|---|---|---|---|---|---|---|
| -lgP | R2 (%) | -lgP | R2 (%) | |||||
| SIFC | GNE332 | 2 | 78.5 | 5.5 | 21.8 | 1.3 | - | - |
| Sat_239 | 3 | 6.3 | 13.3 | 31.4 | 2.0 | - | - | |
| Satt339 | 3 | 20.1 | 2.8 | 32.0 | 2.0 | 1.9 | 0.2 | |
| Satt521 | 3 | 29.4 | 5.2 | 21.8 | 1.3 | 3.5 | 0.3 | |
| Satt718 | 4 | 13.2 | 3.4 | 19.1 | 1.1 | - | - | |
| Satt225 | 5 | 19.1 | 6.4 | 26.3 | 1.6 | - | - | |
| GNE397a | 6 | 5.2 | 8.5 | 27.3 | 1.7 | 2.9 | 0.2 | |
| Sat_418b | 6 | 47.1 | 4.1 | 17.3 | 1.0 | - | - | |
| GNE072b | 8-2 | 4.8 | 9.8 | 29.0 | 1.8 | 2.4 | 0.2 | |
| Satt460 | 10 | 13.8 | 5.0 | 31.0 | 1.9 | 3.1 | 0.3 | |
| Satt549b* | 10 | 29.7 | 7.0 | 15.3 | 0.9 | 5.4 | 0.4 | |
| GNE262* | 10 | 29.9 | 3.4 | 3.7 | 0.2 | - | - | |
| GNE057* | 10 | 30.9 | 6.4 | 3.0 | 0.2 | - | - | |
| GNE187* | 10 | 32.6 | 4.8 | 18.4 | 1.1 | - | - | |
| Satt420a* | 10 | 33.1 | 3.7 | 8.6 | 0.5 | - | - | |
| Satt192 | 12 | 20.5 | 3.5 | 22.2 | 1.3 | - | - | |
| Satt030 | 13 | 91.6 | 23.3 | 89.2 | 6.3 | - | - | |
| Satt556 | 14 | 10.3 | 3.6 | 29.1 | 1.8 | - | - | |
| Sat_168 | 18 | 2.5 | 4.5 | 15.5 | 0.9 | - | - | |
| Sat_141 | 18 | 5.7 | 6.0 | 6.2 | 0.3 | - | - | |
| GNE397b | 19 | 52.8 | 5.8 | 17.7 | 1.1 | - | - | |
| LC QTL | 15 | 27.4 | ||||||
| SC QTL | 30 | 12.3 | ||||||
| 总Total | 51 (3/4;1/2) | 45 | 39.7 | 21 | 4.7 | |||
| TDC | GNE498 | 1-1 | 19.6 | 8.8 | 35.4 | 1.8 | - | - |
| Satt506 | 2 | 10.4 | 11.1 | 67.0 | 3.7 | - | - | |
| Sat_424b | 3 | 18.6 | 3.9 | 14.4 | 0.7 | 5.2 | 0.3 | |
| Satt660 | 3 | 21.4 | 6.0 | 15.5 | 0.7 | - | - | |
| GNE397a | 6 | 5.2 | 11.4 | 34.3 | 1.8 | 4.6 | 0.3 | |
| Satt684 | 7 | 67.1 | 9.2 | 28.8 | 1.5 | 2.9 | 0.2 | |
| Sat_199a | 8-2 | 0.0 | 3.2 | 4.1 | 0.2 | - | - | |
| Satt333 | 8-2 | 40.2 | 3.3 | 23.0 | 1.1 | - | - | |
| Satt188* | 10 | 28.4 | 3.9 | 3.0 | 0.1 | - | - | |
| Satt549b* | 10 | 29.7 | 5.9 | 13.6 | 0.7 | 2.4 | 0.2 | |
| GNE001a | 11 | 20.6 | 11.6 | 34.2 | 1.8 | 2.7 | 0.2 | |
| Satt192* | 12 | 20.5 | 8.7 | 18.1 | 0.9 | 3.4 | 0.2 | |
| Satt146 | 13 | 88.7 | 8.8 | 34.6 | 1.8 | - | - | |
| Satt653 | 13 | 90.2 | 4.2 | 22.3 | 1.1 | - | - | |
| Sat_191a* | 14 | 3.4 | 4.1 | 3.0 | 0.1 | - | - | |
| GNE186b | 14 | 13.9 | 44.6 | 134.5 | 8.6 | 5.1 | 0.3 | |
| GNB191* | 16 | 56.7 | 7.9 | 34.7 | 1.8 | - | - | |
| Satt669 | 17 | 85.3 | 9.9 | 33.8 | 1.7 | - | - | |
| Sat_210 | 18 | 1.4 | 3.1 | 9.4 | 0.4 | - | - | |
| Sat_141 | 18 | 5.7 | 2.7 | 4.0 | 0.2 | - | - | |
| Sat_421 | 20 | 21.9 | 5.0 | 23.0 | 1.1 | - | - | |
| LC QTL | 12 | 27.7 | ||||||
| SC QTL | 48 | 19.3 | ||||||
| 性状 Trait | 标记/QTL Marker/QTL | 连锁群 Group | 位置 Position (cM) | Model a -lgP | QTL | QTL×Env. b | ||
| -lgP | R2 (%) | -lgP | R2 (%) | |||||
| 总Total | 66 (4/5;4/12) | 60 | 47.0 | 30 | 5.5 | |||
| TGC | GNE332 | 2 | 78.5 | 4.6 | 20.1 | 1.4 | - | - |
| Satt339 | 3 | 20.1 | 3.6 | 17.5 | 1.2 | - | - | |
| Satt521 | 3 | 29.4 | 3.9 | 34.5 | 2.4 | - | - | |
| GMAC7L | 6 | 16.6 | 9.1 | 20.1 | 1.4 | - | - | |
| Sat_148 | 7 | 37.6 | 6.8 | 31.1 | 2.2 | 3.1 | 0.3 | |
| GNE072b | 8-2 | 4.8 | 8.5 | 15.6 | 1.0 | 5.1 | 0.4 | |
| Sat_193* | 10 | 6.4 | 3.2 | 7.6 | 0.5 | - | - | |
| Satt460 | 10 | 13.8 | 5.5 | 27.7 | 1.9 | 3.0 | 0.3 | |
| Satt549b* | 10 | 29.7 | 4.6 | 12.2 | 0.8 | 2.0 | 0.2 | |
| Satt442 | 12 | 28.0 | 4.3 | 26.4 | 1.8 | 2.0 | 0.2 | |
| GNB125 | 13 | 11.1 | 5.4 | 15.6 | 1.0 | - | - | |
| Satt030 | 13 | 91.6 | 13.1 | 68.6 | 5.2 | - | - | |
| Satt020 | 14 | 16.7 | 2.9 | 39.2 | 2.8 | 2.0 | 0.2 | |
| Sat_210 | 18 | 1.4 | 4.7 | 17.0 | 1.1 | - | - | |
| LC QTL | 12 | 23.5 | ||||||
| SC QTL | 28 | 11.4 | ||||||
| 总Total | 42 (2/6; 2/8) | 40 | 34.9 | 18 | 4.8 | |||
| TGLC | Satt147 | 1-2 | 18.5 | 7.7 | 11.1 | 1.1 | 2.8 | 0.4 |
| Sat_306 | 3 | 2.4 | 8.0 | 15.9 | 1.6 | - | - | |
| Satt354 | 5 | 26.1 | 9.4 | 16.1 | 1.6 | 3.1 | 0.4 | |
| GNE055* | 5 | 47.8 | 4.6 | 9.6 | 1.0 | - | - | |
| GNB215a | 6 | 79.8 | 21.0 | 46.4 | 5.0 | 2.3 | 0.3 | |
| GNB022b | 7 | 0.0 | 10.4 | 22.3 | 2.3 | - | - | |
| Sat_140 | 8-2 | 1.6 | 14.7 | 33.4 | 3.5 | - | - | |
| Satt576 | 10 | 16.7 | 13.3 | 30.4 | 3.1 | - | - | |
| Satt259* | 10 | 50.9 | 13.5 | 29.3 | 3.0 | - | - | |
| Satt332 | 11 | 5.1 | 5.0 | 11.6 | 1.1 | - | - | |
| GNB177 | 13 | 8.3 | 8.2 | 16.9 | 1.7 | - | - | |
| Satt304* | 14 | 0.0 | 7.8 | 15.7 | 1.5 | - | - | |
| Satt651 | 15-2 | 0.0 | 6.7 | 13.9 | 1.4 | - | - | |
| Satt669* | 17 | 85.3 | 10.2 | 21.0 | 2.1 | - | - | |
| Sat_143 | 18 | 73.6 | 7.8 | 14.6 | 1.4 | - | - | |
| GNE493 | 18 | 108.5 | 4.9 | 10.9 | 1.0 | - | - | |
| LC QTL | 15 | 31.3 | ||||||
| SC QTL | 21 | 12.0 | ||||||
| 总Total | 36 (2/4;4/10) | 36 | 43.3 | 7 | 2.3 | |||
新窗口打开|下载CSV
RTM-GWAS方法检测的51个异黄酮总含量(SIFC)位点中,45个位点主效显著,21个位点与环境互作效应显著,17个位点2种效应皆显著。51个位点覆盖了MCIM方法检测的4个加性QTL中的3个,分别为qSifc-03-1、qSifc-14-1和qSifc-18-1,覆盖率为75%。然而,这3个QTL在RTM-GWAS中的贡献率相对较小,其中对应qSifc-14-1的Satt556标记位点表型变异解释率最高,也仅为1.8%,但在MCIM中其解释率高达10.6%。而RTM-GWAS方法检测结果中第13染色体上标记位点Satt030的表型变异解释率最高,为6.3%。此外,RTM-GWAS方法检测的位点还覆盖了MCIM方法检测的一个上位性QTL。与大豆苷类异黄酮总含量(TDC)关联的66个位点中,60个位点主效显著,30个位点与环境互作效应显著,28个位点2种效应皆显著。66个位点覆盖了MCIM方法检测的5个加性QTL中的4个,以及4个上位性QTL,加性QTL的覆盖率高达80%。标记位点GNE186b的表型变异解释率最高,为8.6%,该位点对应的qTdc-14-2加性效应遗传率也最高,为8.7%。然而qTdc-18-1加性效应遗传率也较高为5.8%,但是与其对应的标记位点Sat_210表型变异解释率仅为0.4%。与染料木苷类异黄酮总含量(TGC)关联的42个位点中,40个位点主效显著,18个位点与环境互作效应显著,16个位点两种效应皆显著。42个位点仅覆盖了MCIM方法检测的6个加性QTL中的2个,分别为标记位点Satt521对应的qTgc-03-1和Satt020对应的qTgc-14-1。qTgc-14-1的加性效应遗传率最高,为10.3%,而标记位点的Satt020的表型变异解释率相对较低,为2.8%。另外,RTM-GWAS方法检测的位点还覆盖了MCIM方法检测的两个上位性QTL。与黄豆苷类异黄酮总含量(TGLC)关联的36个位点主效全部显著,其中有7个位点与环境互作效应显著。36个位点覆盖了MCIM方法检测的4个加性QTL中的2个,分别为标记位点GNB215a对应的qTglc-06-1和Sat_140对应的qTglc-08-1。qTglc-06-1的加性效应遗传率最高,为5.3%,与其对应的标记位点GNB215a的表型变异解释率也最高,为5.0%。Sat_140的表型变异解释率也较高,为3.5%。另外,RTM-GWAS方法检测的位点还覆盖了MCIM方法检测的4个上位性QTL。
2.4 大豆籽粒异黄酮含量候选基因
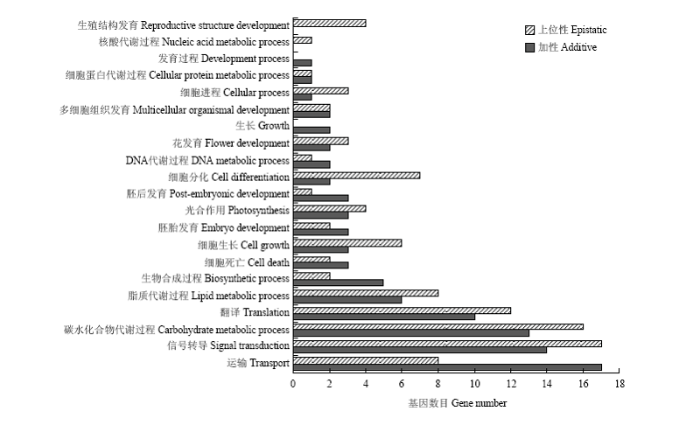
异黄酮含量的主要候选基因可以根据11个主要加性和上位性QTL区域推测。最终在主要加性QTL区域和主要上位性QTL区域分别检测到93和100个候选基因。基因富集分析结果显示这193个候选基因涉及21个生物学过程,主要与运输、信号转导、碳水化合物代谢等过程相关,表明控制异黄酮含量的基因体系包含与多种生物代谢过程相关的一系列基因(图4)。值得注意的是,在最重要的第14染色体加性QTL区域GNE186b—Satt020,3个基因Glyma14g33227、Glyma14g33244和Glyma14g33715的功能与异黄酮代谢有关,其中Glyma14g33715参与了类黄酮生物合成过程。图4
 新窗口打开|下载原图ZIP|生成PPT
图4大豆籽粒异黄酮含量候选基因生物学过程分布
Fig. 4Biological process distribution of candidate genes for soybean seed isoflavone content
3.1 与前人QTL定位结果的比较
整合在NJRSXG群体遗传图谱中的一些BAC- SSR标记不能锚定在大豆公共连锁图谱上,因此,必须使用前人和本研究中共有的标记来比较结果,当2个位点的物理距离小于2 Mb时,该位点被认为是相同的QTL。本研究19个异黄酮含量QTL中,9个QTL为新位点。其中黄豆苷类异黄酮总含量(TGLC)QTL qTglc-06-1的标记区间为Satt079—GNB215a,而根据大豆的公共遗传图谱[36],在GUTIERREZ-GONZALEZ等研究中[21],qGLY6_2的左侧标记Satt319与Satt079相距约4 cM。KASSEM等[41]在第8染色体上鉴定到的QTL位点gly2,位于Sat_129(位置,84.08 cM)和Satt097(122.05 cM)内,而本研究中qTglc-08-1的右侧标记Satt525(96.97cM)位于该区间内。GUTIERREZ-GONZALEZ等[22]报道了第17染色体上,在Satt186和Sat_086(118.66 cM)之间定位的QTL位点gly-D2_2,而在本研究中检测到的qTglc-17-1的标记区间Satt397(69.30 cM)—Satt_220(128.73 cM)覆盖gly-D2_2,该位点具有候选基因DFR2的一个拷贝[21]。YANG等[14]在第3染色体上定位到SIFC的一个QTL位点QDZGT4,其临近的标记Satt521与本研究中qSifc-03-1的左侧标记相同,而另一个位于第12染色体上的QTL位点QGC7与本研究检测到的qTglc-12-1处于相同的标记区间内。根据大豆公共图谱,YOSHIKAWA等[15]定位到一个SIFC的QTL位点OT_2,与其相邻的标记Satt066位置是78.8 cM,而qSifc-14-1的右侧标记Satt020(72.10 cM)与其相距约6 cM,其中,与TGLC相关的一个QTL位点NGl_3与本研究中的qTglc-06-1位置重叠,而qTdc-08-2与其定位到的OD_2相距较远,为2个不同的位点。此外,GUTIERREZ-GONZALEZ等[20,21,22]和ZENG等[19]也检测到异黄酮含量的上位性QTL,本研究16对上位性QTL中,无任意1对与前人结果一致。然而其中10个上位性QTL(如qTdc-12-1和qTdc-15-1)的位置与前人定位的加性QTL位置一致(表4),这是否具有实际意义还需要进一步验证。3.2 异黄酮含量QTL体系
本研究中异黄酮含量的遗传方差由广义遗传率(来自方差分析)估计,方差来源于3部分,加性QTL效应,上位性QTL效应和未被定位的QTL效应。未被定位到的QTL的存在有如下原因:首先,未定位到的QTL确实为一些效应非常小的微效QTL,这种假设符合前人提出的“数量性状的主基因加多基因模型”[42]。另一方面,MCIM方法未定位到的QTL可能在其他作图群体或NJRSXG的改良群体中被检测到。因此,遗传学家必须使用具有较大样本量和高密度分子标记的不同群体来鉴定可靠的QTL,并以多种策略将连锁分析和关联分析相结合[43,44,45]。4个异黄酮含量性状未定位到的总QTL解释率为59.3%—67.3%,占一半以上的遗传变异,这表明未被定位到的QTL在异黄酮含量的遗传中起主导作用,这将会给育种实践带来一定困难。但是,2个新的加性QTL(qSifc-14-1和qTgc-14-1)解释了超过相应性状10.0%的遗传变异,且还位于相同区域,该区域具有候选基因Glyma14g33227、Glyma14g33244和Glyma14g33715,且该主要遗传区域经关联分析研究得到验证,它可为异黄酮总含量(SIFC)和染料木异黄酮总含量(TGC)的分子标记辅助育种提供重要信息。此外,异黄酮总含量(SIFC)、大豆苷类异黄酮总含量(TDC)和染料木异黄酮总含量(TGC)的加性效应都远大于对应的上位性效应,而在黄豆苷类异黄酮总含量(TGLC)中,加性与上位性效应相当,表明黄豆苷类异黄酮的生物合成依赖于复杂的代谢网络,其合成途径在很大程度上仍然是未知的[46]。
异黄酮是源自苯丙烷类和类黄酮途径的次级代谢产物,可被包括非生物和生物胁迫在内的多种环境因素诱导[46],因此有必要设计多环境试验,从而经多环境联合分析以确定异黄酮的可靠遗传区域。除利用MCIM方法进行数据联合分析外,本研究还在5个环境下分别检测加性QTL(数据略),在19个加性QTL中,单个环境中共鉴定到了12个。第14染色体主要加性QTL区域GNE186b—Satt020上的3个QTL(qSifc-14-1、qTdc-14-2和qTgc-14-1),在5个环境中均被检测到,表明该遗传区域对SIFC、TDC和TGC的表型变异有稳定的遗传贡献。在4个、3个、2个和1个环境中检测到的QTL数量分别为0、3、1和5,说明这些QTL的效应可能是由某些特定的环境胁迫引起的。
目前,在大豆异黄酮基因的研究方面,已知不少与异黄酮合成有关的基因,应用分子生物学手段一些基因的功能已得到验证,本研究在第14染色体GNE186b—Satt020区域内定位到2个新的加性QTL(qSifc-14-1和qTgc-14-1),并预测同区域内的3个基因Glyma14g33227、Glyma14g33244和Glyma14g33715的功能与异黄酮代谢有关,其中Glyma14g33715参与了类黄酮生物合成过程,而关于这三个基因的详细功能仍是未知的,有待进一步研究。
3.3 连锁定位与关联定位的比较和互补
MCIM方法检测的位点往往也能为RTM-GWAS方法所检测到,位点表型贡献率与MCIM方法相当或相对较小,RTM-GWAS方法同时也检测到了其他大效应和小效应位点。MCIM方法共检测到与4个异黄酮含量性状(SIFC、TDC、TGC和TGLC)相关的6、17、13和12个QTL,而RTM-GWAS方法分别检测到51、66、42和36个与对应性状关联的标记位点。与连锁定位MCIM方法相比,关联定位RTM-GWAS方法能够检测到更多的异黄酮含量QTL,且覆盖了MCIM方法检测的19个加性QTL中的11个。MCIM方法检测的加性QTL总表型变异解释率较低,为15.9%—27.3%,而RTM-GWAS方法所检测位点的总表型变异解释率为39.7%—52.5%。然而,RTM-GWAS方法尚不能检测上位性QTL,从MCIM方法检测的4个异黄酮含量性状的上位性QTL可以看出,异黄酮含量上位性QTL的效应较小,例如,异黄酮总含量(SIFC)上位性QTL贡献率仅为1.0%,染料木异黄酮总含量(TGC)上位性QTL贡献率为5.4%,并且异黄酮总含量(SIFC)、大豆苷类异黄酮总含量(TDC)和染料木异黄酮总含量(TGC)的加性效应均远大于上位性效应。因此,对于本研究的4个异黄酮含量性状,RTM-GWAS方法可以获得更为全面的遗传解析结果。
整合连锁定位与关联定位用于异黄酮含量的遗传解析,不仅利用连锁定位方法主效位点检测功效高的优点,而且还能利用RTM-GWAS方法位点检测功效高、遗传解析较为全面的优势,2种方法相互验证,从而对分析结果做出更加准确的推断。
4 结论
NJRSXG群体重组自交系中,异黄酮总含量(SIFC)、大豆苷类异黄酮总含量(TDC)、染料木异黄酮总含量(TGC)和黄豆苷类异黄酮总含量(TGLC)均出现超亲分离现象。利用混合模型复合区间作图法(MCIM)检测到了4个异黄酮含量性状的共19个加性QTL和16对上位性QTL,其中2个新发现的加性QTL解释了超过相应性状10.0%的遗传变异。利用限制性两阶段多位点全基因组关联分析方法(RTM-GWAS)检测到51、66、42和36个与SIFC、TDC、TGC和TGLC关联的标记位点,与4个异黄酮含量性状MCIM结果有4、8、4和6个位点存在重叠,位点覆盖率为25%—80%。连锁定位方法MCIM在主效位点的检测上具有较高的功效,而关联定位方法RTM-GWAS检测的QTL更多,总遗传贡献率更高,但尚不能检测上位性QTL,连锁定位和关联定位2种方法结合能相对全面地检测异黄酮含量QTL,2种方法定位结果可相互验证补充,从而对异黄酮含量遗传构成做出较为全面的推断。大豆籽粒异黄酮含量由大量QTL/基因控制。参考文献 原文顺序
文献年度倒序
文中引用次数倒序
被引期刊影响因子
DOI:10.1104/pp.107.097865URLPMID:17416637 [本文引用: 1]

Isoflavonoids are thought to play an important role in soybean (Glycine max) resistance to Phytophthora sojae. This was addressed by silencing two genes for their biosynthesis and a third gene controlling their elicitation. Silencing of genes for isoflavone synthase (IFS) or chalcone reductase (CHR) was achieved in soybean roots through an Agrobacterium rhizogenes-mediated RNAi approach. Effectiveness of silencing was followed both by quantitative reverse transcriptase-polymerase chain reaction and high-performance liquid chromatography analyses. Silencing either IFS or CHR led to a breakdown of Rps-mediated resistance to race 1 of P. sojae in 'W79' (Rps 1c) or 'W82' (Rps 1k) soybean. Loss of resistance was accompanied by suppression of hypersensitive (HR) cell death in both cultivars and suppression of cell death-associated activation of hydrogen peroxide and peroxidase. The various results suggest that the 5-deoxyisoflavonoids play a critical role in the establishment of cell death and race-specific resistance. The P. sojae cell wall glucan elicitor, a potent elicitor of 5-deoxyisoflavonoids, triggered a cell death response in roots that was also suppressed by silencing either CHR or IFS. Furthermore, silencing of the elicitor-releasing endoglucanase (PR-2) led to a loss of HR cell death and race-specific resistance to P. sojae and also to a loss of isoflavone and cell death responses to cell wall glucan elicitor. Taken together, these results suggest that in situ release of active fragments from a general resistance elicitor (pathogen-associated molecular pattern) is necessary for HR cell death in soybean roots carrying resistance genes at the Rps 1 locus, and that this cell death response is mediated through accumulations of the 5-deoxyisoflavones.
DOI:10.1016/s0021-9673(00)01077-3URLPMID:11355838 [本文引用: 2]
An improved method for extraction and analysis of isoflavones from soy protein, soy foods and nutritional supplements is presented. The method uses acetonitrile extraction without acidification, with apigenin as internal standard. Samples extracted in acetonitrile-water are diluted to 50% acetonitrile and directly injected for gradient HPLC separation on a C18 reversed-phase column. This method saves significant time during sample preparation and improves accuracy and precision. Conventional and rapid HPLC analysis methods compatible with the extraction scheme were developed. During development of the methods, unexpected minor forms of malonyl and acetyl isoflavones were discovered in extracts of soy proteins and in pure isoflavone standard preparations. By LC-triple MS, these peaks have identical composition to the respective 6''-O-malonyl- and 6''-O-acetyl-isoflavones from which they form. These minor forms are believed to be malonyl and acetyl isoflavones where the site of attachment is a hydroxyl other than the 6'-OH of the glucose. These compounds can represent significant minor isoflavone components of foods, which contain high concentrations of malonyl or acetyl isoflavones.
DOI:10.1301/nr.2003.janr.1-33URLPMID:12638461 [本文引用: 1]
Soy isoflavones have been a component of the diet of certain populations for centuries. The consumption of soy generally has been considered beneficial, with a potentially protective effect against a number of chronic diseases; because of their estrogenic activity, however, negative effects of isoflavones have been postulated. This review examines the literature associated with the safety of soy isoflavones, including dietary soy isoflavone exposure data of populations with high soy intakes, human studies in which soy protein or isoflavones were provided, and toxicologic studies investigating the potential genotoxicity, carcinogenicity, and reproductive and developmental toxicity of soy isoflavones. Whereas results in some studies are limited or conflicting, when viewed in its entirety, the current literature supports the safety of isoflavones as typically consumed in diets based on soy or containing soy products.
DOI:10.1038/pcan.2009.10URLPMID:19597532 [本文引用: 1]
The aim of this study was to evaluate the effect of supplementing healthy men with soy isoflavones on the serum levels of sex hormones implicated in prostate cancer development. A total of 28 Japanese healthy volunteers (18 equol producers and 10 equol non-producers) between 30 and 59 years of age were given soy isoflavones (60 mg daily) supplements for 3 months, and the changes in their sex hormone levels were investigated at the baseline and after administration. The serum and urine concentrations of daidzein, genistein, and the levels of equol in the fasting blood samples and 24-h stored urine samples were also measured. All 28 volunteers completed the 3-month supplementation with isoflavone. No changes in the serum levels of estradiol and total testosterone were detected after 3-month supplementation. The serum levels of sex hormone-binding globulin significantly increased, and the serum levels of free testosterone and dihydrotestosterone (DHT) decreased significantly after 3-month supplementation. Among the 10 equol non-producers, equol became detectable in the serum of two healthy volunteers after 3-month supplementation. This study revealed that short-term administration of soy isoflavones stimulated the production of serum equol and decreased the serum DHT level in Japanese healthy volunteers. These results suggest the possibility of converting equol non-producers to producers by prolonged and consistent soy isoflavones consumption.
URL [本文引用: 1]
【Objective】 There are numbers of germplasm accessions of soybean, including both cultivated soybean (Glycine max (L.) Merr.) and wild soybean (Glycine soja Sieb. et Zucc.), available in China where the former were domesticated from the latter. It is a basic work to characterize the genetic variability and evolutionary peculiarity of the soybean germplasm in breeding for isoflavone contents. 【Method】 The 895 accessions, including 580 landraces, 106 released cultivars, 209 wild materials from various ecological regions in China with 88 released cultivars from abroad as reference, a total of 983 accessions were tested for their 12 isofavone contents by using rapid high performance liquid chromatography technique. 【Result】 A large variation in total isoflavone (TISF) and its components both in cultivated and wild soybeans in China was observed. The ranges of TISF in wild accessions, landraces and released cultivars were 927.29-7 932.94, 259.38-7 725.45 and 489.67-5 968.90 μg?g-1, with their averages of 2 994.51 μg?g-1, 3 241.33 μg?g-1, and 2 704.83 μg?g-1, respectively. In average, with the long term artificial selection, the total genistin group content (TG, especially 6’-O-malonylgenistin) and total glycitin group content (TGL, especially 6’-O-acetyl- and 6’-O- malonylglycitin) increased, while the total daidzin group content (TD, especially 6’-O-acetyldaidzin) decreased obviously, which led TISF in released cultivars lower than that in wild soybean. There existed also great variabibility of isoflavone contents in wild and cultivated soybeans within each eco-region as was that in the whole country. The TISF of cultivated soybeans was negatively correlated both with longitude (r =-0.264) and latitude (r=-0.380) at P<0.01 significance level, while no such correlation was found in wild soybeans, which indicated that the differential directions of artificial selection acted on the cultivated soybeans among geographic regions caused the correlation between genotypes and geographic sites in the cultivated soybean different from that of the wild soybeans. From the 983 accessions, elite ones, such as ZYD3621 (TISF 7 932.94 μg?g-1), N3188 (TISF 7 725.45 μg?g-1), N20793 (TGL 5 122.21 μg?g-1), etc. were screened out for isflavone breeding. 【Conclusion】 The evolutionary peculiarity of isoflavone content and its components from the wild species to cultivated landrace and to the released cultivars of soybean in China elucidated that the average of TISF, TG and TGL of G. max was higher than that of G. soja, while the average of TD of G. max was lower than that of G. soja. There existed great variation in total isoflavone and its components both in the whole country and in each eco-region in both wild and cultivated soybeans. Elite germplasm accessions with high isoflavone components in G. soja and G. max were screened out for breeding purposes.
DOI:10.1021/jf00044a016URL [本文引用: 1]
DOI:10.1080/01635589609514470URLPMID:8875551 [本文引用: 1]
Plant compounds with estrogenic activity may play a role in cancer prevention, moderation of menopausal symptoms, and other health effects. To facilitate research on these possible actions, the literature was reviewed for quantitative data on the levels of known phytoestrogens (daidzein, genistein, coumestrol, formononetin, and biochanin A) in food plants. For comparative purposes, all phytoestrogen levels were recalculated on a wet weight basis. Details on analytic procedures are given as well. High-performance liquid chromatography was the method most often used to analyze these compounds in foods. Most significant sources of isoflavone and coumestan phytoestrogens include soybeans, soy flour, soy flakes, isolated soy protein, traditional soy foods such as tofu and soy drinks, second-generation say foods, sprouts, and other legumes. Finally, medians among reported values of phytoestrogen content are provided for some of the most commonly eaten foods with quantitative data available. These may be used to calculate dietary intake of daidzein, genistein, coumestrol, formononetin, and biochanin A.
DOI:10.1111/j.1582-4934.2012.01542.xURLPMID:22304296 [本文引用: 1]
A number of cardioprotective effects, including the reduced oxidation of the low-density lipoprotein (LDL) particles, have been attributed to dietary soy isoflavones. Paraoxonase 1 (PON1), an enzyme mainly synthesized in the liver, may exhibit anti-atherogenic activity by protecting LDL from oxidation. Thus, dietary and pharmacological inducers of PON1 may decrease cardiovascular disease risk. Using a luciferase reporter gene assay we screened different flavonoids for their ability to induce PON1 in Huh7 hepatocytes in culture. Genistein was the most potent flavonoid with regard to its PON1-inducing activity, followed by daidzein, luteolin, isorhamnetin and quercetin. Other flavonoids such as naringenin, cyanidin, malvidin and catechin showed only little or no PON1-inducing activity. Genistein-mediated PON1 transactivation was partly inhibited by the oestrogen-receptor antagonist fulvestrant as well as by the aryl hydrocarbon receptor antagonist 7-ketocholesterol. In contrast to genistein, the conjugated genistein metabolites genistein-7-glucuronide, genistein-7-sulfate and genistein-7,4'-disulfate were only weak inducers of PON1 transactivation. Accordingly, dietary genistein supplementation (2?g/kg diet over three?weeks) in growing rats did not increase hepatic PON1 mRNA and protein levels as well as plasma PON1 activity. Thus, genistein may be a PON1 inducer in cultured hepatocytes in vitro, but not in rats in vivo.
DOI:10.1007/s10354-010-0811-4URLPMID:20714813 [本文引用: 1]
Phytoestrogens, especially genistein, have been shown to have bone beneficial effects in vitro and in vivo. However, the effect of glycitein on bone cells is not known. The aim of this study was to investigate the effects of glycitein on osteoclast differentiation and apoptosis in vitro.
DOI:10.1271/bbb.65.1211URLPMID:11440142 [本文引用: 1]
Glycitein, as one of the three major isoflavones in soybeans, directly but significantly (about 5%) suppressed the proliferation of MC3T3-E1 and stimulated bone-related protein (alkaline phosphatase (ALP) and osteocalcin (OC)) expression. These results indicate that glycitein suppresses the proliferation of osteoblasts and promotes differentiation from its progenitor.
DOI:10.1016/S1671-2927(09)60197-8URL [本文引用: 2]
DOI:10.1186/1471-2164-15-680URLPMID:25124843 [本文引用: 1]
Mapping expression quantitative trait loci (eQTL) of targeted genes represents a powerful and widely adopted approach to identify putative regulatory variants. Linking regulation differences to specific genes might assist in the identification of networks and interactions. The objective of this study is to identify eQTL underlying expression of four gene families encoding isoflavone synthetic enzymes involved in the phenylpropanoid pathway, which are phenylalanine ammonia-lyase (PAL; EC 4.3.1.5), chalcone synthase (CHS; EC 2.3.1.74), 2-hydroxyisoflavanone synthase (IFS; EC1.14.13.136) and flavanone 3-hydroxylase (F3H; EC 1.14.11.9). A population of 130 recombinant inbred lines (F5:11), derived from a cross between soybean cultivar 'Zhongdou 27' (high isoflavone) and 'Jiunong 20' (low isoflavone), and a total of 194 simple sequence repeat (SSR) markers were used in this study. Overlapped loci of eQTLs and phenotypic QTLs (pQTLs) were analyzed to identify the potential candidate genes underlying the accumulation of isoflavone in soybean seed.
DOI:10.1371/journal.pone.0118447URLPMID:25738957 [本文引用: 2]
Soybean (Glycine max (L.) Merr.) isoflavone is important for human health and plant defense system. To identify novel quantitative trait loci (QTL) and epistatic QTL underlying isoflavone content in soybean, F5:6, F5:7 and F5:8 populations of 130 recombinant inbred (RI) lines, derived from the cross of soybean cultivar 'Zhong Dou 27' (high isoflavone) and 'Jiu Nong 20' (low isoflavone), were analyzed with 95 new SSR markers. A new linkage map including 194 SSR markers and covering 2,312 cM with mean distance of about 12 cM between markers was constructed. Thirty four QTL for both individual and total seed isoflavone contents of soybean were identified. Six, seven, ten and eleven QTL were associated with daidzein (DZ), glycitein (GC), genistein (GT) and total isoflavone (TI), respectively. Of them 23 QTL were newly identified. The qTIF_1 between Satt423 and Satt569 shared the same marker Satt569 with qDZF_2, qGTF_1 and qTIF_2. The qGTD2_1 between Satt186 and Satt226 was detected in four environments and explained 3.41%-10.98% of the phenotypic variation. The qGTA2_1, overlapped with qGCA2_1 and detected in four environments, was close to the previously identified major QTL for GT, which were responsible for large a effects. QTL (qDZF_2, qGTF_1 and qTIF_2) between Satt144-Satt569 were either clustered or pleiotropic. The qGCM_1, qGTM_1 and qTIM_1 between Satt540-Sat_244 explained 2.02%-9.12% of the phenotypic variation over six environments. Moreover, the qGCE_1 overlapped with qGTE_1 and qTIE_1, the qTIH_2 overlapped with qGTH_1, qGCI_1 overlapped with qDZI_1, qTIL_1 overlapped with qGTL_1, and qTIO_1 overlapped with qGTO_1. In this study, some of unstable QTL were detected in different environments, which were due to weak expression of QTL, QTL by environment interaction in the opposite direction to a effects, and/or epistasis. The markers identified in multi-environments in this study could be applied in the selection of soybean cultivars for higher isoflavone content and in the map-based gene cloning.
DOI:10.1007/s13258-011-0043-zURL [本文引用: 2]
DOI:10.1270/jsbbs.60.243URL [本文引用: 2]
DOI:10.1007/s12041-014-0371-2URLPMID:25189227 [本文引用: 2]
Soybean isoflavones play diverse roles in human health, including cancers, osteoporosis, heart disease, menopausal symptoms and pabulums. The objective of this study was to identify the quantitative trait loci (QTL) associated with the isoflavones daidzein (DC), genistein (GeC), glycitein (GlC) and total isoflavone contents (TIC) in soybean seeds. A population of 184 F2:10 recombinant inbred lines derived from a 'Xiaoheidou' x 'GR8836' cross was planted in pot and field conditions to evaluate soybean isoflavones. Twenty-one QTL were detected by composite interval mapping. Several QTL were associated with the traits for DC, GeC, GlC and TIC only. QDGeGlTIC4_1 and QDGlTIC12_1 are reported first in this study and were associated with the DC, GeC, GlC and TIC traits simultaneously. The QTL identified have potential value for marker-assisted selection to develop soybean varieties with desirable isoflavone content.
DOI:10.1111/pbr.12298URL [本文引用: 1]
DOI:10.2135/cropsci2004.0672URL [本文引用: 2]
DOI:10.1007/s00122-009-0994-5URL [本文引用: 3]
Soybean isoflavones are valued in certain medicines, cosmetics, foods and feeds. Selection for high-isoflavone content in seeds along with agronomic traits is a goal of many soybean breeders. The aim of the study was to identify the quantitative trait loci (QTL) underlying seed isoflavone content in soybean among seven environments in China. A cross was made between ‘Zhongdou 27’, a soybean cultivar with higher mean isoflavone content in the seven environments (daidzein, DZ, 1,865μgg−1; genistein, GT, 1,614μgg−1; glycitein, GC, 311μgg−1 and total isoflavone, TI, 3,791μgg−1) and ‘Jiunong 20’, a soybean cultivar with lower isoflavone content (DZ, 844μgg−1; GT, 1,046μgg−1; GC, 193μgg−1 and TI, 2,061μgg−1). Through single-seed-descent, 130 F5-derived F6 recombinant inbred lines were advanced. A total of 99 simple-sequence repeat markers were used to construct a genetic linkage map. Seed isoflavone contents were analyzed using high-performance liquid chromatography for multiple years and locations (Harbin in 2005, 2006 and 2007, Hulan in 2006 and 2007, and Suihua in 2006 and 2007). Three QTL were associated with DZ content, four with GT content, three with GC content, and five with TI content. For all QTL detected the beneficial allele was from Zhongdou 27. QTL were located on three (DZ), three (GC), four (GT) and five (TI) molecular linkage groups (LG). A novel QTL was detected with marker Satt144 on LG F that was associated with DZ (0.0014>P>0.0001, 5%<R 2<11%; 254<DZ<552μgg−1), GT (0.0027>P>0.0001; 4%<R 2<9%; 262<GT<391μgg−1), and TI (0.0011>P>0.0001; 4%<R 2<15%; 195<TI<871μgg−1) across the various environments. A previously reported QTL on LG M detected by Satt540 was associated with TI across four environments and TI mean (0.0022>P>0.0001; 3%<R 2<8%; 182<TI<334μgg−1) in China. Because both beneficial alleles were from Zhongdou 27, it was concluded that these two QTL would have the greatest potential value for marker-assisted selection for high-isoflavone content in soybean seed in China.
DOI:10.1007/s00122-011-1673-xURL [本文引用: 3]
Seeds of soybean [Glycine max (L.) Merr.] accumulate more isoflavones than any tissue of any plant species. In other plant parts, isoflavones are usually released to counteract the effects of various biotic and abiotic stresses. Because of the benefits to the plant and positive implications that consumption may have on human health, increasing isoflavones is a goal of many soybean breeding programs. However, altering isoflavone levels through marker-assisted selection (MAS) has been impractical due to the small and often environmentally variable contributions that each individual quantitative trait locus (QTL) has on total isoflavones. In this study, we developed a Magellan x PI 437654 F(7)-RIL population to construct a highly saturated non-redundant linkage map that encompassed 451 SNP and SSR molecular markers and used it to locate genomic regions that govern accumulation of isoflavones in the seeds of soybean. Five QTLs were found that contribute to the concentration of isoflavones, having single or multiple additive effects on isoflavone component traits. We also validated a major locus which alone accounted for up to 10% of the phenotypic variance for glycitein, and 35-37% for genistein, daidzein and the sum of all three soybean isoflavones. This QTL was consistently associated with increased concentration of isoflavones across different locations, years and crosses. It was the most important QTL in terms of net increased amounts of all isoflavone forms. Our results suggest that this locus would be an excellent candidate to target for MAS. Also, several minor QTLs were identified that interacted in an additive-by-additive epistatic manner, to increase isoflavone concentration.
DOI:10.1186/1471-2229-10-105URLPMID:20540761 [本文引用: 4]
Soybean (Glycine max [L] Merr.) seed isoflavones have long been considered a desirable trait to target in selection programs for their contribution to human health and plant defense systems. However, attempts to modify seed isoflavone contents have not always produced the expected results because their genetic basis is polygenic and complex. Undoubtedly, the extreme variability that seed isoflavones display over environments has obscured our understanding of the genetics involved.
DOI:10.1007/s00122-009-1109-zURL [本文引用: 3]
A major objective for geneticists is to decipher genetic architecture of traits associated with agronomic importance. However, a majority of such traits are complex, and their genetic dissection has been traditionally hampered not only by the number of minor-effect quantitative trait loci (QTL) but also by genome-wide interacting loci with little or no individual effect. Soybean (Glycine max [L.] Merr.) seed isoflavonoids display a broad range of variation, even in genetically stabilized lines that grow in a fixed environment, because their synthesis and accumulation are affected by many biotic and abiotic factors. Due to this complexity, isoflavone QTL mapping has often produced conflicting results especially with variable growing conditions. Herein, we comparatively mapped soybean seed isoflavones genistein, daidzein, and glycitein by using several of the most commonly used mapping approaches: interval mapping, composite interval mapping, multiple interval mapping and a mixed-model based composite interval mapping. In total, 26 QTLs, including many novel regions, were found bearing additive main effects in a population of RILs derived from the cross between Essex and PI 437654. Our comparative approach demonstrates that statistical mapping methodologies are crucial for QTL discovery in complex traits. Despite a previous understanding of the influence of additive QTL on isoflavone production, the role of epistasis is not well established. Results indicate that epistasis, although largely dependent on the environment, is a very important genetic component underlying seed isoflavone content, and suggest epistasis as a key factor causing the observed phenotypic variability of these traits in diverse environments.
DOI:10.1007/s11032-017-0768-8URL [本文引用: 1]
DOI:10.1016/j.cj.2017.10.004URL [本文引用: 1]
DOI:10.1007/s00122-017-3018-xURLPMID:29159422 [本文引用: 1]
Fifteen stable QTLs were identified using a high-density soybean genetic map across multiple environments. One major QTL, qIF5-1, contributing to total isoflavone content explained phenotypic variance 49.38, 43.27, 46.59, 45.15 and 52.50%, respectively. Soybeans (Glycine max L.) are a major source of dietary isoflavones. To identify novel quantitative trait loci (QTL) underlying isoflavone content, and to improve the accuracy of marker-assisted breeding in soybean, a valuable mapping population comprised of 196 F7:8-10 recombinant inbred lines (RILs, Huachun 2?×?Wayao) was utilized to evaluate individual and total isoflavone content in plants grown in four different environments in Guangdong. A high-density genetic linkage map containing 3469 recombination bin markers based on 0.2?×?restriction site-associated DNA tag sequencing (RAD-seq) technology was used to finely map QTLs for both individual and total isoflavone contents. Correlation analyses showed that total isoflavone content, and that of five individual isoflavone, was significantly correlated across the four environments. Based on the high-density genetic linkage map, a total of 15 stable quantitative trait loci (QTLs) associated with isoflavone content across multiple environments were mapped onto chromosomes 02, 05, 07, 09, 10, 11, 13, 16, 17, and 19. Further, one of them, qIF5-1, localized to chromosomes 05 (38,434,171-39,045,620?bp) contributed to almost all isoflavone components across all environments, and explained 6.37-59.95% of the phenotypic variance, especially explained 49.38, 43.27, 46.59, 45.15 and 52.50% for total isoflavone. The results obtained in the present study will pave the way for a better understanding of the genetics of isoflavone accumulation and reveals the scope available for improvement of isoflavone content through marker-assisted selection.
DOI:10.3724/SP.J.1006.2018.00185URL [本文引用: 2]
DOI:10.3724/SP.J.1006.2018.00185URL [本文引用: 2]
DOI:10.1371/journal.pgen.1006770URLPMID:28489859 [本文引用: 2]
Isoflavones comprise a group of secondary metabolites produced almost exclusively by plants in the legume family, including soybean [Glycine max (L.) Merr.]. They play vital roles in plant defense and have many beneficial effects on human health. Isoflavone content is a complex quantitative trait controlled by multiple genes, and the genetic mechanisms underlying isoflavone biosynthesis remain largely unknown. Via a genome-wide association study (GWAS), we identified 28 single nucleotide polymorphisms (SNPs) that are significantly associated with isoflavone concentrations in soybean. One of these 28 SNPs was located in the 5'-untranslated region (5'-UTR) of an R2R3-type MYB transcription factor, GmMYB29, and this gene was thus selected as a candidate gene for further analyses. A subcellular localization study confirmed that GmMYB29 was located in the nucleus. Transient reporter gene assays demonstrated that GmMYB29 activated the IFS2 (isoflavone synthase 2) and CHS8 (chalcone synthase 8) gene promoters. Overexpression and RNAi-mediated silencing of GmMYB29 in soybean hairy roots resulted in increased and decreased isoflavone content, respectively. Moreover, a candidate-gene association analysis revealed that 11 natural GmMYB29 polymorphisms were significantly associated with isoflavone contents, and regulation of GmMYB29 expression could partially contribute to the observed phenotypic variation. Taken together, these results provide important genetic insights into the molecular mechanisms underlying isoflavone biosynthesis in soybean.
DOI:10.3389/fpls.2019.00562URLPMID:31130975 [本文引用: 2]
Isoflavonoids are a group of plant natural compounds synthesized almost exclusively by legumes, and are abundant in soybean seeds and roots. They play important roles in plant-microbial interactions and the induction of nod gene expression in Rhizobia that form nitrogen-fixing nodules on soybean roots. Isoflavonoids also contribute to the positive health effects associated with soybean consumption by humans and animals. An R1 MYB transcription factor GmMYB176 regulates isoflavonoid biosynthesis by activating chalcone synthase (CHS) 8 gene expression in soybean. Using a combination of transcriptomic and metabolomic analyses of GmMYB176-RNAi silenced (GmMYB176-Si), GmMYB176-overexpressed (GmMYB176-OE), and control soybean hairy roots, we identified a total of 33 differentially expressed genes (DEGs) and 995 differentially produced metabolite features (DPMF) in GmMYB176-Si hairy roots, and 5727 DEGs and 149 DPMFs in GmMYB176-OE hairy roots. By a targeted approach, 25 isoflavonoid biosynthetic genes and 6 metabolites were identified as differentially regulated in GmMYB176-OE and GmMYB176-Si soybean hairy roots. Taken together, our results demonstrate the complexity of isoflavonoid biosynthesis in soybean roots and suggest that a coordinated expression of pathway genes, substrate flux and product threshold level may contribute to the dynamic of the pathway regulation.
DOI:10.1093/bioinformatics/btm143URLPMID:17459962 [本文引用: 1]
Understanding how interactions among set of genes affect diverse phenotypes is having a greater impact on biomedical research, agriculture and evolutionary biology. Mapping and characterizing the isolated effects of single quantitative trait locus (QTL) is a first step, but we also need to assemble networks of QTLs and define non-additive interactions (epistasis) together with a host of potential environmental modulators. In this article, we present a full-QTL model with which to explore the genetic architecture of complex trait in multiple environments. Our model includes the effects of multiple QTLs, epistasis, QTL-by-environment interactions and epistasis-by-environment interactions. A new mapping strategy, including marker interval selection, detection of marker interval interactions and genome scans, is used to evaluate putative locations of multiple QTLs and their interactions. All the mapping procedures are performed in the framework of mixed linear model that are flexible to model environmental factors regardless of fix or random effects being assumed. An F-statistic based on Henderson method III is used for hypothesis tests. This method is less computationally greedy than corresponding likelihood ratio test. In each of the mapping procedures, permutation testing is exploited to control for genome-wide false positive rate, and model selection is used to reduce ghost peaks in F-statistic profile. Parameters of the full-QTL model are estimated using a Bayesian method via Gibbs sampling. Monte Carlo simulations help define the reliability and efficiency of the method. Two real-world phenotypes (BXD mouse olfactory bulb weight data and rice yield data) are used as exemplars to demonstrate our methods.
DOI:10.1007/s00122-018-3174-7URLPMID:30167759 [本文引用: 1]
Eighty-six R1 QTLs accounting for 89.92% phenotypic variance in a soybean RIL population were identified using RTM-GWAS with SNPLDB marker which performed superior over CIM and MLM-GWAS with BIN/SNPLDB marker. A population (NJRIKY) composed of 427 recombinant inbred lines (RILs) derived from Kefeng-1?×?NN1138-2 (MGII?×?MGV, MG maturity group) was applied for detecting flowering date (R1) quantitative trait locus (QTL) system in soybean. From a low-depth re-sequencing (~?0.75?×), 576,874 SNPs were detected and organized into 4737 BINs (recombination breakpoint determinations) and 3683 SNP linkage disequilibrium blocks (SNPLDBs), respectively. Using the association mapping procedures &quot;Restricted Two-stage Multi-locus Genome-wide Association Study&quot; (RTM-GWAS), &quot;Mixed Linear Model Genome-wide Association Study&quot; (MLM-GWAS) and the linkage mapping procedure &quot;Composite Interval Mapping&quot; (CIM), 67, 36 and 10 BIN-QTLs and 86, 14 and 23 SNPLDB-QTLs were detected with their phenotypic variance explained (PVE) 88.70-89.92% (within heritability 98.2%), 146.41-353.62% (overflowing) and 88.29-172.34% (overflowing), respectively. The RTM-GWAS with SNPLDBs which showed to be more efficient and reasonable than the others was used to identify the R1 QTL system in NJRIKY. The detected 86 SNPLDB-QTLs with their PVE from 0.02 to 30.66% in a total of 89.92% covered 51 out of 104 R1 QTLs in 18 crosses in SoyBase and 26 out of 139 QTLs in a nested association mapping population, while the rest 29 QTLs were novel ones. From the QTL system, 52 candidate genes were annotated, including the verified gene E1, E2, E9 and J, and grouped into 3 categories of biological processes, among which 24 genes were enriched into three protein-protein interaction networks, suggesting gene networks working together. Since NJRIKY involves only MGII and MGV, the QTL/gene system among MG000-MGX should be explored further.
DOI:10.1007/s00122-017-2962-9URLPMID:28828506 [本文引用: 2]
The innovative RTM-GWAS procedure provides a relatively thorough detection of QTL and their multiple alleles for germplasm population characterization, gene network identification, and genomic selection strategy innovation in plant breeding. The previous genome-wide association studies (GWAS) have been concentrated on finding a handful of major quantitative trait loci (QTL), but plant breeders are interested in revealing the whole-genome QTL-allele constitution in breeding materials/germplasm (in which tremendous historical allelic variation has been accumulated) for genome-wide improvement. To match this requirement, two innovations were suggested for GWAS: first grouping tightly linked sequential SNPs into linkage disequilibrium blocks (SNPLDBs) to form markers with multi-allelic haplotypes, and second utilizing two-stage association analysis for QTL identification, where the markers were preselected by single-locus model followed by multi-locus multi-allele model stepwise regression. Our proposed GWAS procedure is characterized as a novel restricted two-stage multi-locus multi-allele GWAS (RTM-GWAS, https://github.com/njau-sri/rtm-gwas ). The Chinese soybean germplasm population (CSGP) composed of 1024 accessions with 36,952 SNPLDBs (generated from 145,558 SNPs, with reduced linkage disequilibrium decay distance) was used to demonstrate the power and efficiency of RTM-GWAS. Using the CSGP marker information, simulation studies demonstrated that RTM-GWAS achieved the highest QTL detection power and efficiency compared with the previous procedures, especially under large sample size and high trait heritability conditions. A relatively thorough detection of QTL with their multiple alleles was achieved by RTM-GWAS compared with the linear mixed model method on 100-seed weight in CSGP. A QTL-allele matrix (402 alleles of 139 QTL?×?1024 accessions) was established as a compact form of the population genetic constitution. The 100-seed weight QTL-allele matrix was used for genetic characterization, candidate gene prediction, and genomic selection for optimal crosses in the germplasm population.
DOI:10.3724/SP.J.1006.2018.01274URL [本文引用: 2]
Genome-wide association studies (GWAS) have been widely used for genetic dissection of quantitative trait loci (QTL), and the previous GWAS procedures were concentrated on finding a handful of major loci, while the plant breeders are more likely interested in exploring the whole QTL system for both forward selection and background control. We proposed the restricted two-stage multi-locus genome-wide association analysis (RTM-GWAS, https://github.com/njau-sri/rtm-gwas/) for a relatively thorough detection of QTL and their multiple alleles. Firstly, RTM-GWAS groups the tightly linked sequential SNPs into linkage disequilibrium blocks (SNPLDBs) to form genomic markers with multiple haplotypes as alleles. Secondly, it utilizes two-stage association analysis based on a multi-locus multi-allele model to save computer space for focusing on genome-wide QTL identification along with their multiple alleles. Compared with the previous GWAS methods, RTM-GWAS takes the trait heritability as the upper limit of detected genetic contribution, which can avoid a large amount of false positives for a precise detection of the QTL system of the trait. The QTL-allele matrix as a compact form of the population genetic constitution can be used to design optimal genotypes, to predict optimal crosses in plant breeding, and to study the genetic properties of the population as well as the novel and newly emerged alleles. In the present study, we first introduced the function and usage of the RTM-GWAS analytical programs, and then used the experimental data from a research program on soybean to illustrate the application details of the RTM-GWAS.
DOI:10.3724/SP.J.1006.2010.02062URL [本文引用: 1]
A rapid, precise, and stable quantifying method of isoflavone components is the key to quality soy–food processing and genetic improvement of quality soybeans. A quick procedure used Agilent 1100 high performance liquid chromatograph (HPLC) system with the diode array detection (DAD) and Zorbax SB-C18 packed column (5 μm, 4.6 ID × 150 mm) using external standards of isoflavone components, including daidzein,daidzin, 6”-O-acetyldaidzin, 6”-O-malonyldaidzin,genistein, genistin,6”-O-acetylgenistin, 6”-O-malonylgenistin, glycitein, glycitin,6”-O-acetylglycitin and 6”-O-malonylglycitin was established for measuring the 12 isoflavones in soybean seeds and its processing products. The procedure includes the following key points: 80% methanol aqueous solution under ultrasonication for 1 h at 50℃ was chosen; for separation of the 12 isoflavone components within 15 min, the mobile phase of 0.1% acetic acid (V/V) aqueous solvent A and 100% methanol solvent B with the flow rate of 2.0 mL min–1, injection volume at 10 μL, column temperature at 36℃ and detection wavelength at 254 nm were selected; and the linear gradient extraction of 0–2 min, 27% B (V/V)→2~3 min, 27~38% B→3–10 min, 38% B→10–12 min, 38–39% B→12–14 min, 39% B→14–15 min, 39%–27% B was adopted. The procedure was linear (R2 = 0.9976–0.9999), precise (CV or RSD ranged from 0.90% to 3.35% for 2 232 samples from NJRIKY), accurate [recoveries were more than 99.00% for the different concentrations of the 12 isoflavones (CV of 0.22%–1.40%)], robust (inter-day CV of 0.24%–3.95%) and rapid (less than 15 min for 12 isoflavones resolved). The procedure was verified to be effective by a large sample determination of isoflavone components in soybean seed, soymilk and tofu using the soybean population of NJRIKY. The data indicated that the isoflavones were 3 695.00 μg g–1 in seed, among them 14.85% (548.88 μg g–1) were transferred to the residual, 85.15% (3 146.12 μg g–1) to soymilk, but only 17.32% (639.89 μg g–1) to tofu while 67.83% (2 506.23 μg g–1) to whey under the traditional tofu processing with CaSO4 as coagulant. The 12 isoflavone components in soymilk was somewhat less than those in seeds with 6”-O-Malonylgenistin the highest in the both, while in tofu 6”-O-Acetylgenistin and 6”-O-Acetylglycitin were deficient but with high contents of genistein and daidzein. In addition, there was an enlarged genetic variation of the 12 isoflavone components among the lines, indicating the increased genetic potential for quality improvement due to recombination between Kefeng 1 and Nannong 1138-2.
[D].
[本文引用: 1]
[D].
[本文引用: 1]
DOI:10.1111/j.1365-313X.1993.00739.xURL [本文引用: 1]
DOI:10.1007/s00122-004-1602-3URL [本文引用: 2]
A total of 391 simple sequence repeat (SSR) markers designed from genomic DNA libraries, 24 derived from existing GenBank genes or ESTs, and five derived from bacterial artificial chromosome (BAC) end sequences were developed. In contrast to SSRs derived from EST sequences, those derived from genomic libraries were a superior source of polymorphic markers, given that the mean number of tandem repeats in the former was significantly less than that of the latter (P<0.01). The 420 newly developed SSRs were mapped in one or more of five soybean mapping populations:
 Minsoy
 × Noir 1, Minsoy × Archer, Archer × Noir 1, Clark × Harosoy, and A81-356022 × PI468916. The JoinMap software package was used to combine the five maps into an integrated genetic map spanning 2,523.6cM of Kosambi map distance across 20 linkage groups that contained 1,849 markers, including 1,015 SSRs, 709 RFLPs, 73 RAPDs, 24 classical traits, six AFLPs, ten isozymes, and 12 others. The number of new SSR markers added to each linkage group ranged from 12 to 29. In the integrated map, the ratio of SSR marker number to linkage group map distance did not differ among 18 of the 20 linkage groups; however, the SSRs were not uniformly spaced over a linkage group, clusters of SSRs with very limited recombination were frequently present. These clusters of SSRs may be indicative of gene-rich regions of soybean, as has been suggested by a number of recent studies, indicating the significant association of genes and SSRs. Development of SSR markers from map-referenced BAC clones was a very effective means of targeting markers to marker-scarce positions in the genome.
[本文引用: 1]
DOI:10.1007/s001220100645URL [本文引用: 1]
Despite the large impact of powdery mildew in wheat cultivated areas, little has been done to study powdery mildew resistance by QTL analysis up to now. The objective of the present paper is to present how the genetic basis of powdery mildew resistance in the resistant wheat line RE714 have been studied by QTL analysis at the adult plant stage over the course of 3 years, and at the vernalized seedling plant stage, and a comparison between the results obtained. Two segregating populations (DH and F2:3) were derived from the cross between the resistant line (RE714), and a susceptible line (Hardi); these were analysed for powdery mildew resistance at the adult plant stage in the field under natural infection conditions in 1996, 1997 and 1998. The DH population was also tested for powdery mildew resistance at the vernalized seedling stage with four different isolates of powdery mildew. At the adult plant stage, a total of three QTLs (on chromosomes 5D, 4A and 6A) and five QTLs (on chromosomes 5D, 6A, 7A and 7B) were found for the DH and F2:3 populations, respectively. The genetic control of resistance was found to be polygenic but involved a major QTL (on chromosome 5D), which was detected each year and which explained a high proportion of the variability observed (28.1%–37.9%). At the vernalized seedling stage, two QTLs were found (on chromosomes 5D and 7B) and the QTL detected on chromosome 5D was common to the four isolates tested. The comparison between the two development stages showed that the QTL on chromosome 5D was detected in all the different environments tested and again explained a high proportion of the variability. Different molecular interpretations of this QTL have also been discussed.
DOI:10.1534/genetics.104.031948URLPMID:15654092 [本文引用: 1]
The majority of biological traits are genetically complex. Mapping the quantitative trait loci (QTL) that determine these phenotypes is a powerful means for estimating many parameters of the genetic architecture for a trait and potentially identifying the genes responsible for natural variation. Typically, such experiments are conducted in a single mapping population and, therefore, have only the potential to reveal genomic regions that are polymorphic between the progenitors of the population. What remains unclear is how well the QTL identified in any one mapping experiment characterize the genetics that underlie natural variation in traits. Here we provide QTL mapping data for trichome density from four recombinant inbred mapping populations of Arabidopsis thaliana. By aligning the linkage maps for these four populations onto a common physical map, the results from each experiment were directly compared. Seven of the nine QTL identified are population specific while two were mapped in all four populations. Our results show that many lineage-specific alleles that either increase or decrease trichome density persist in natural populations and that most of this genetic variation is additive. More generally, these findings suggest that the use of multiple populations holds great promise for better understanding the genetic architecture of natural variation.
DOI:10.3724/SP.J.1006.2008.00361URL [本文引用: 1]
Globular stink bug [Megacota cribraria (Fabricius)] is one of the important pests for soybean [Glycine max (L.) Merr.] in the central and southern China. However, very few reports on soybean resistant to M. cribraria were found in the literature. The objectives of the present study were to find QTLs associated with resistance to M. cribraria in soybean and to analyze the stability of mapped QTLs among years by using two RIL populations, NJRIKY (or KY) and NJRIWT (or WT) derived from the crosses of Kefeng 1 × Nannong 1138-2 and Wan 82-178 × Tongshanbopihuangdoujia, respectively. The 184 lines of KY and 142 lines of WT were tested and the percentage of black mildew on stem and purple spots on leaves was used as indicator to evaluate their resistance to M. cribraria under natural infestation during 2004–2006. There existed significant differences among lines in the two RIL populations during the three years, with heritability of 66.5%–88.8% in KY and 61.3%–84.8% in WT. The composite interval mapping (CIM) of the software Windows QTL Cartographer Version 2.5 was used to map QTLs. The linkage group D1a and C2 in KY and the linkage group H and D1b in WT were found to be related with resistance to L. indicata. The QTL qRMC-d1a-1 on Linkage group D1a was detected consistently associated with reaction to M. cribraria in KY during the three years, which accounted for 7.6%–31.4% of phenotypic variation; the QTL qRMC-c2-1 on linkage group C2 was detected in 2005–2006, which accounted for less phenotypic variation than the former one; the resistance alleles were from Nannong 1138-2. There appeared significant interactions between qRMC-d1a-1 and qRMC-h-1 in KY in 2005 and 2006. The QTL qRMC-h-1 on linkage group H was detected also consistently associated with reaction to M. cribraria in WT during the three years, which accounted for 16.3%–36.2% of phenotypic variation; the QTL qRMC-d1b-2 on linkage group D1b was detected in 2004-2005, which accounted for less phenotypic variation than the former one; the resistant alleles were from Tongshanbopihuangdoujia. Therefore, different QTLs conferred resistance to M. cribraria in KY and WT basically although the two QTLs in the latter population were also identified in one year in the former population. The fact that the QTLs were repeatedly detected in different environments indicated the resistance was controlled stably by the main QTLs. Based on the results, it is inferred that the markers linked to the detected QTLs should be useful for marker-assisted selection for resistance to M. cribraria in soybean.
DOI:10.1007/s00122-006-0361-8URL [本文引用: 1]
DNA marker maps based on single populations are the basis for gene, loci and genomic analyses. Individual maps can be integrated to produce composite maps with higher marker densities if shared marker orders are consistent. However, estimates of marker order in composite maps must include sets of markers that were not polymorphic in multiple populations. Often some of the pooled markers were not codominant, or were not correctly scored. The soybean composite map was composed of data from five separate populations based on northern US germplasm but does not yet include ‘Essex’ by ‘Forrest’ recombinant inbred line (RIL) population (E×F) or any southern US soybean cultivars. The objectives were, to update the E×F map with codominant markers, to compare marker orders among this map, the Forrest physical map and the composite soybean map and to compare QTL identified by composite interval maps to the earlier interval maps. Two hundred and thirty seven markers were used to construct the core of the E×F map. The majority of marker orders were consistent between the maps. However, 19 putative marker inversions were detected on 12 of 20 linkage groups (LG). Eleven marker distance compressions were also found. The number of inverted markers ranged from 1 to 2 per LG. Thus, marker order inversions may be common in southern compared to northern US germplasm. A total of 61 QTL among 37 measures of six traits were detected by composite interval maps, interval maps and single point analysis. Seventeen of the QTL found in composite intervals had previously been detected among the 29 QTL found in simple interval maps. The genomic locations of the known QTL were more closely delimited. A genome sequencing project to compare Southern and Northern US soybean cultivars would catalog and delimit inverted regions and the associated QTL. Gene introgression in cultivar development programs would be accelerated.
[本文引用: 1]
[本文引用: 1]
DOI:10.1371/journal.pgen.1002221URLPMID:21829395 [本文引用: 1]
Aluminum (Al) toxicity is a primary limitation to crop productivity on acid soils, and rice has been demonstrated to be significantly more Al tolerant than other cereal crops. However, the mechanisms of rice Al tolerance are largely unknown, and no genes underlying natural variation have been reported. We screened 383 diverse rice accessions, conducted a genome-wide association (GWA) study, and conducted QTL mapping in two bi-parental populations using three estimates of Al tolerance based on root growth. Subpopulation structure explained 57% of the phenotypic variation, and the mean Al tolerance in Japonica was twice that of Indica. Forty-eight regions associated with Al tolerance were identified by GWA analysis, most of which were subpopulation-specific. Four of these regions co-localized with a priori candidate genes, and two highly significant regions co-localized with previously identified QTLs. Three regions corresponding to induced Al-sensitive rice mutants (ART1, STAR2, Nrat1) were identified through bi-parental QTL mapping or GWA to be involved in natural variation for Al tolerance. Haplotype analysis around the Nrat1 gene identified susceptible and tolerant haplotypes explaining 40% of the Al tolerance variation within the aus subpopulation, and sequence analysis of Nrat1 identified a trio of non-synonymous mutations predictive of Al sensitivity in our diversity panel. GWA analysis discovered more phenotype-genotype associations and provided higher resolution, but QTL mapping identified critical rare and/or subpopulation-specific alleles not detected by GWA analysis. Mapping using Indica/Japonica populations identified QTLs associated with transgressive variation where alleles from a susceptible aus or indica parent enhanced Al tolerance in a tolerant Japonica background. This work supports the hypothesis that selectively introgressing alleles across subpopulations is an efficient approach for trait enhancement in plant breeding programs and demonstrates the fundamental importance of subpopulation in interpreting and manipulating the genetics of complex traits in rice.
DOI:10.1371/journal.pone.0009958URLPMID:20376361 [本文引用: 1]
Aluminum (Al) toxicity is a major worldwide constraint to crop productivity on acidic soils. Al becomes soluble at low pH, inhibiting root growth and severely reducing yields. Maize is an important staple food and commodity crop in acidic soil regions, especially in South America and Africa where these soils are very common. Al exclusion and intracellular tolerance have been suggested as two important mechanisms for Al tolerance in maize, but little is known about the underlying genetics.
DOI:10.3724/SP.J.1006.2010.01100URL [本文引用: 1]
QTL mapping has emerged based on the development and integration of molecular genetics and quantitative genetics. Along with the establishment and improvement of QTL mapping procedures, a great number of studies of QTL mapping in various crop species have been carried out. QTLs detected with high accuracy can be used for marker-assisted selection and map-based cloning, while the false-positive QTLs are meaningless, even mislead their usefulness. In the present study, the recombinant inbred line (RIL) populations were simulated based on four kinds of genetic models, including Model I, additive QTL; Model II, additive and epistatic QTLs; Model III, additive QTL and QTL×Environment interaction, and Model IV, additive, epistatic QTLs and QTL×Environment interaction. Two sets of RIL data for each of the four models were obtained, in a total of eight sets of RIL data designated as M-1~M-8. Six QTL mapping procedures, i.e. CIM (Composite interval mapping), MIMF (forward search of multiple interval mapping) and MIMR (regression forward selection of multiple interval mapping) of WinQTL Cartographer Version 2.5, ICIM (Inclusive composite interval mapping) of IciMapping Version 2.0, MQM (multiple-QTL model) of MapQTL Version 5.0, and NWIM (interval mapping) of QTLnetwork Version 2.0 were used for detecting QTLs of the eight sets of RIL data. The results showed: (1) Different mapping procedures fit different genetic models. CIM and MQM were only suitable for Model I data. MIMR, MIMF and ICIM were only suitable for Model I and Model II data. Only NWIM was suitable for all four models’ data. Therefore, the data from different genetic models corresponded to different optimal QTL mapping procedures. (2) Since the genetic model of the practical experimental data was unknown, a multiple model mapping strategy should be taken, i.e. a full model scanning with complex model procedure, such as QTLnetwork 2.0, followed by verification with another procedure corresponding to the scanning results.
[本文引用: 2]
