 ,, 吴尚蓉, 陈仲新, 张宁丹中国农业科学院农业资源与农业区划研究所/农业农村部农业遥感重点实验室,北京 100081
Spatio-Temporal Variations of Winter Wheat Planting Frequency and Their Analysis of Influencing Factors in Henan Province
LI FangJie, REN JianQiang,, WU ShangRong, CHEN ZhongXin, ZHANG NingDanInstitute of Agricultural Resources and Regional Planning, Chinese Academy of Agricultural Sciences/Key Laboratory of Agricultural Remote Sensing, Ministry of Agriculture and Rural Affairs, Beijing 100081通讯作者:
责任编辑: 杨鑫浩
收稿日期:2019-08-29接受日期:2019-11-18网络出版日期:2020-05-16
| 基金资助: |
Received:2019-08-29Accepted:2019-11-18Online:2020-05-16
作者简介 About authors
李方杰,E-mail:li_fangjie@126.com。

摘要
关键词:
Abstract
Keywords:
PDF (12543KB)元数据多维度评价相关文章导出EndNote|Ris|Bibtex收藏本文
本文引用格式
李方杰, 任建强, 吴尚蓉, 陈仲新, 张宁丹. 河南省冬小麦种植频率时空变化及影响因素分析[J]. 中国农业科学, 2020, 53(9): 1773-1794 doi:10.3864/j.issn.0578-1752.2020.09.007
LI FangJie, REN JianQiang, WU ShangRong, CHEN ZhongXin, ZHANG NingDan.
0 引言
【研究意义】区域作物分布时空变化信息不仅直接反映农户作物种植选择行为,而且可以反映大范围农业耕地资源利用情况,上述信息已经逐步成为国家制定粮食政策和经济计划的重要依据[1,2]。基于多年高精度连续作物空间分布遥感信息,开展区域作物种植频率时空变化分析研究,不仅对粮食主产区作物种植面积稳定、农业管理政策科学制定和保障国家粮食安全具有重要意义,而且对开展农业土地利用对土壤质量的影响研究也具有较好的促进作用[3]。此外,开展区域作物种植频率主要影响因素分析研究,不仅可以加深对农业土地利用变化机理机制和驱动因素的理解,也可以促进区域土地利用决策模型科学构建,进一步提高农业土地利用趋势预测和国家农业政策科学制定的能力,对保证国家主要农产品有效供给、保障国家粮食安全等方面具有重要理论价值和现实意义[4,5,6]。【前人研究进展】从作物分布时空变化研究看,以往大多区域作物分布时空变化分析主要依靠行政单元统计数据,且主要集中在种植面积数量变化、空间分布特征及其影响因素等分析研究,对基于遥感获取的作物分布信息利用存在一定不足。尽管部分****也对作物分布遥感信息加以利用,但大多只采用了一定间隔年份的作物分布信息进行直接对比分析,缺少对连续多年作物空间分布时空变化及其动因的深入细致分析[7,8]。因此,有必要进一步利用连续多年作物分布信息开展区域作物种植面积变化分析研究。近几十年来,随着空间信息技术发展,特别是作物遥感分类和面积提取技术的不断进步,利用遥感技术获取连续多年大范围作物空间分布信息成为可能,这为作物分布时空变化分析研究提供更加丰富的信息源[9,10,11]。目前,国内外利用遥感进行作物面积提取的遥感数据源以多光谱影像为主,且中低、中高和高分辨率遥感数据均得到了较好应用。其中,中低分辨率遥感数据(如MODIS数据等)在大范围作物面积提取中发挥了重要作用[12,13,14]。作物面积提取利用的遥感分类方法主要包括计算机自动分类(如监督分类和非监督分类)、基于遥感解译模型的分类(如阈值法、决策树等)、基于地块和纹理等信息的分类方法以及多元信息融合的分类等[15,16,17]。其中,基于时序植被指数和物候特征的决策树作物分类方法由于操作简单,运算速度快,可实现区域作物种植面积的准确提取,已经成为当前作物面积提取和作物监测中的常用方法之一[18,19,20],且CART分类回归树算法是应用较多的作物面积提取算法[21,22]。【本研究切入点】随着我国耕地资源利用管理和农业种植结构调整优化要求的逐步提高,部分****在农作物种植面积时空变化分析中也开展了农作物种植频率相关研究[3,23],但大多只集中在作物种植频率空间分布特征的描述方面,对某一地区多年农作物种植频率(crop planting frequency,CPF)时空变化及其成因缺乏深入研究,而上述研究不仅可为农业土地利用变化研究中分析作物种植面积变化提供一种新思路,而且是对我国已经开展的农业土地利用变化相关研究有益补充,也是进一步提高我国耕地资源利用效率和精细化管理水平的必然需求[24,25]。【拟解决的关键问题】针对目前农作物种植面积时空变化分析研究中对农作物种植频率时空变化及其影响因素研究不足的现状,本文以我国重要的冬小麦生产基地河南省为研究区,深入开展该省多年历史冬小麦种植频率(winter wheat planting frequency,WWPF)时空变化及其影响因素分析研究,进一步明晰区域作物种植频率变化成因和主要影响因素顺序,以期为进一步提升农业生产效率提供指导,为区域农业土地利用变化研究、区域作物种植结构调整优化和农业土地利用政策制定中开展作物种植面积变化分析提供技术方法和思路借鉴,为区域土地利用决策模型构建提供基础理论支撑。1 材料与方法
1.1 研究区概况
河南省是我国冬小麦重要生产基地,该省地理位置在北纬31.38°—36.37°、东经110.35°—116.65°(图1)。全省总面积为16.70万平方公里,耕地面积为8.13万平方公里。河南省处在我国二三阶梯的过渡带,地势总体特征为西部海拔高,东部海拔低,全省属于暖温带向亚热带过渡的大陆性季风气候,年平均气温约在12.1—15.7℃,年平均降水量约为532.50—1 380.60 mm,年均日照时间约1 850—2 500 h,全年无霜期约为180—240 d,主要农作物种植制度为冬小麦-夏玉米一年两熟制度。其中,省域内冬小麦一般是10月上中旬播种,10月中下旬出苗,11月上中旬进入分蘖期;从12月上中旬至次年2月上中旬冬小麦处于越冬阶段;次年2月下旬冬小麦开始返青,3月中下旬为拔节期,4月中旬处于孕穗期,5月上旬处于抽穗开花期,5月中下旬处于灌浆乳熟期,5月下旬至6月上旬处于成熟收获阶段。图1
 新窗口打开|下载原图ZIP|生成PPT
图1研究区示意图
Fig. 1Schematic map of research area
1.2 数据及预处理
1.2.1 MODIS数据及预处理 本研究使用的遥感数据是美国NASA生产的16 d合成250 m空间分辨率MOD13Q1植被数据产品,该产品由NASA LP DAAC工作组网站(https://lpdaac.usgs.gov/lpdaac/products)获取,研究区覆盖的数据轨道号为h27v05,数据覆盖时间为每年冬小麦播种到成熟期范围内(第273天至次年第177天)17幅数据产品,研究中共获得2001—2015年共15年255幅数据产品。下载获得的EVI数据预处理主要包括数据提取、投影转换、裁切、数据拼接和波段合成(layer stack)等。其中,数据提取和投影转换应用MRT工具(MODIS Reprojection Tool),由Sin投影转换为Albers投影,对裁剪后的影像按照时间顺序进行波段合成,最终得到每年包含17个波段的2001—2015年EVI时间序列影像共15幅,其中每个波段分别标记为B1、B2、…、B17。尽管MOD13Q1数据集为16 d最大值合成数据,一定程度上可减少部分云污染和气溶胶对EVI真实值的影响,但仍然不能完全去除大气条件和土壤背景等对数据质量的影响,导致EVI在时间序列上出现异常值或波动,从而影响作物EVI时序遥感特征参数准确提取。因此,本研究采用Savitzky-Golay(S-G)滤波平滑技术对预处理后时序EVI数据进行平滑处理,从而有效地去除多时相EVI遥感数据中异常值或波动,最终获取较高质量的EVI时序数据[26]。
1.2.2 样点数据 本研究使用的样点数据除部分来自地面样点外,还有其他部分样点数据来源于Google Earth高分辨率影像。利用Google Earth高分辨率影像获取样点过程中,在遵循样点均匀分布的原则基础上,利用目视判读的方法进行整个研究区冬小麦及其他地物样本点选取,地面样点和Google Earth高分辨率影像中选择的冬小麦和其他地物样点数据如表1所示。研究中从每年全部样点数据中随机选取一定数量的冬小麦和非冬小麦训练样本,用于提取地物时序特征。另外,每年选取验证样点1 500个(含冬小麦样本850个,非冬小麦样本650个)用于后期作物分布提取结果的精度验证。
Table 1
表1
表1河南省冬小麦分布提取样点数量(2001—2015年)
Table 1
| 年份 Year | 地面样点 Ground samples | Google Earth样点 Google Earth samples | 训练样点 Training samples | ||||||
|---|---|---|---|---|---|---|---|---|---|
| 冬小麦 Winter wheat | 非冬小麦 Non-winter wheat | 总计 Total | 冬小麦 Winter wheat | 非冬小麦 Non-winter wheat | 总计 Total | 冬小麦 Winter wheat | 非冬小麦 Non-winter wheat | 总计 Total | |
| 2001 | — | — | — | 1145 | 1073 | 2218 | 295 | 423 | 718 |
| 2002 | — | — | — | 1165 | 1118 | 2283 | 315 | 468 | 783 |
| 2003 | — | — | — | 1155 | 1101 | 2256 | 305 | 451 | 756 |
| 2004 | — | — | — | 1095 | 1150 | 2245 | 245 | 500 | 745 |
| 2005 | — | — | — | 1100 | 1117 | 2217 | 250 | 467 | 717 |
| 2006 | 39 | 42 | 81 | 1129 | 1081 | 2210 | 318 | 473 | 791 |
| 2007 | 53 | 54 | 107 | 1027 | 1026 | 2053 | 230 | 430 | 660 |
| 2008 | 44 | 41 | 85 | 1027 | 1024 | 2051 | 221 | 415 | 636 |
| 2009 | 47 | 45 | 92 | 1043 | 1115 | 2158 | 240 | 510 | 750 |
| 2010 | 45 | 45 | 90 | 1015 | 1105 | 2120 | 210 | 500 | 710 |
| 2011 | 51 | 53 | 104 | 1049 | 1022 | 2071 | 250 | 425 | 675 |
| 2012 | 57 | 58 | 115 | 1073 | 1057 | 2130 | 280 | 465 | 745 |
| 2013 | 62 | 60 | 122 | 1023 | 999 | 2022 | 235 | 409 | 644 |
| 2014 | 69 | 71 | 140 | 998 | 1006 | 2004 | 217 | 427 | 644 |
| 2015 | 71 | 70 | 141 | 984 | 995 | 1979 | 205 | 415 | 620 |
新窗口打开|下载CSV
1.2.3 气象和土壤数据 本研究所使用的气象数据来源于中国气象数据网(http://data.cma.cn/),站点主要包括河南省内19个基本站及周边部分气象站点共45个(图1),气象指标包括旬平均气温、旬降水量和旬日照时数,数据覆盖时间是2001—2015年每年冬小麦播种期间10月上旬至10月中旬。在此基础上,采用反距离权重法(IDW)对气象站点数据进行空间插值,插值空间分辨率为250 m。研究中,利用作物分布提取结果对空间插值信息进行掩膜并进行分县统计。本研究采用的分县统计土壤指标主要来自中国科学院南京土壤研究所耕地土壤数据[27,28],指标包括土壤容重、碳酸钙、阳离子交换量、粘粒含量、pH、砂粒含量、粉粒含量、有机碳含量、全钾含量、全氮含量、全磷含量以及土层厚度共12个。上述获得分县统计的气象指标和土壤指标分别用于研究时段各年冬小麦种植期间气候适宜度评价以及研究区土壤质量综合评价。
1.2.4 其他数据 本研究涉及的辅助数据主要包括河南省行政区划矢量数据(县、市和省级)以及2001—2015年河南省历史分县统计数据。其中,分县统计数据指标包括耕地面积、有效灌溉面积等。2001—2015年河南省县级耕地面积和有效灌溉面积统计数据主要用于计算各县有效灌溉面积比例。另外,本研究数据还包括河南省耕地分布数据以及河南省高程数据,高程数据主要用于坡度信息的计算。
1.3 研究方法
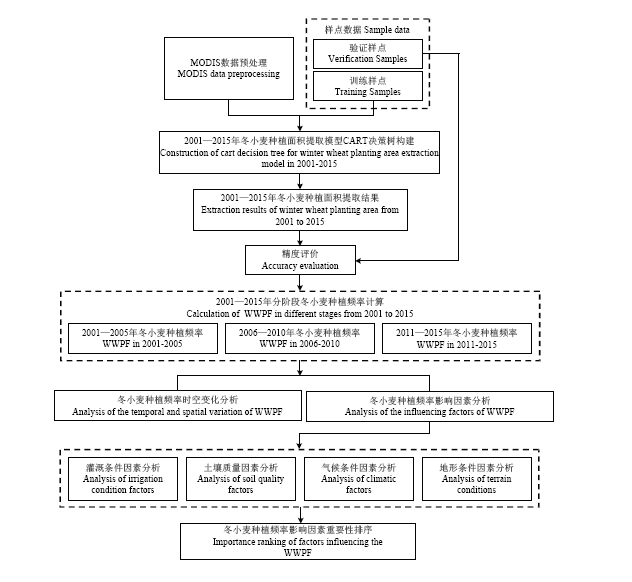
1.3.1 总体技术路线 本研究以时序MODIS EVI为主要遥感数据源,研究时段为2001年至2015年。首先,对MODIS数据进行预处理,利用CART决策树算法构建冬小麦种植面积提取模型,从而获得2001—2015年河南省冬小麦种植面积空间分布信息,并利用冬小麦验证样点数据对作物识别精度进行验证。在此基础上,将研究区以5年为间隔划分为3个时段[29],即第一阶段(2001—2005年)、第二阶段(2006—2010年)以及第三阶段(2011—2015年),开展不同时期冬小麦种植频率计算和种植频率时空变化分析。最后,利用相关分析、主成分分析和线性回归分析等数理统计方法对不同时期研究区种植频率变化的影响因素进行分析,最终确定研究区冬小麦种植频率变化主要影响因素的重要性排序。主要技术流程如图2所示。图2
 新窗口打开|下载原图ZIP|生成PPT
图2总体技术路线
Fig. 2Overall technical route
1.3.2 区域冬小麦空间分布信息提取 本研究冬小麦空间分布信息提取主要采用广泛应用的分类回归树算法(classification and regression tree,CART),利用的遥感数据是每年冬小麦生长期间MODIS EVI时序数据。其中,CART算法在1984年由BREIMAN等[30]最早提出,基本原理是通过对已知多变量数据构建预测准则,进而根据其他变量值对一个变量进行预测,通过循环分析而形成二叉树形式的决策树结构。研究过程中,在利用S-G滤波技术对MODIS EVI时序遥感数据进行平滑基础上,采用ENVI软件中的CART扩展工具对滤波后时序遥感植被指数进行决策树分类。主要过程是利用选取的训练样点数据建立作物识别和分类规则,然后进行研究区地物决策树分类运算,获得冬小麦空间分布信息。
1.3.3 区域冬小麦空间分布信息提取精度评价 在利用CART决策树算法获取研究区多年冬小麦空间分布信息结果基础上,本研究开展作物空间分布结果的精度评价。作物分类识别精度主要采用总体精度和Kappa系数指标进行评价。研究中,将冬小麦和其他地物的验证样点数据与分类提取结果建立混淆矩阵,计算总体精度与Kappa系数,总体精度和Kappa系数均在0—1之间,其值越接近1,说明提取精度越高。
1.3.4 区域冬小麦种植频率定义与计算 一般来说,基于多年作物面积提取结果获取的作物种植频率空间信息是农业土地利用中作物种植选择结果的直接反映,主要表达一定时段内农业土地利用中目标作物类型出现的频率或几率,它不仅可以用于确定一个区域内农作物的主产区或核心区域,对国家确定主要农作物产品的有效供给具有决定性作用,而且一定程度上也可以反映区域内耕地利用强度[31,32]。本研究中,冬小麦种植频率被定义为一定年份时段内冬小麦种植年数占总年数的比值。在计算冬小麦空间种植频率的过程中,本研究将研究年份内(2001—2015年)每一年冬小麦面积提取结果中的冬小麦属性设置为1,非冬小麦属性设置为0,然后将所计算年份区间内的冬小麦种植面积提取结果进行叠加,得到冬小麦种植频次,将冬小麦种植频次除以总年份数,即得到一定年份时段内空间冬小麦种植频率C。
式中,c(j)为某一年j像元的冬小麦种植频率,m、n 分别为遥感影像行、列号。
式中,c(j)i为第i年j像元的冬小麦种植频率,Mij表示第i年j像元属性值;N表示总年份数(N≥2),本研究中N=5。通过多个时段的作物种植频率比较,可以获得河南省区域作物种植频率时空变化信息。研究过程中,本文将研究区内的冬小麦分为2001—2005、2006—2010以及2011—2015年3个阶段,分别计算3个阶段内冬小麦的种植频率,最终获得研究区3个不同时期冬小麦种植频率分布图。
1.3.5 区域冬小麦种植频率与影响因素分析
(1)冬小麦种植频率主要影响因素选择与获取
一般认为,影响作物种植的因素主要包括自然环境因素和社会经济因素两个方面[33]。其中,自然环境因素主要包括气候、水文、地质、土壤、地形等,这些要素与作物种植适宜度间关系密不可分;社会经济因素直接影响农作物生产和空间布局,主要包括劳动力、基础设施建设水平、居民收入和政策变化等因素。研究过程中,本文重点考虑河南省冬小麦种植和生长主要受土壤质量、灌溉条件、气候条件和地形等因素影响,选择了有效灌溉面积比例、土壤质量综合指数、气候适宜度、坡度和高程等因素进行冬小麦种植频率时空变化分析。其中,有效灌溉面积比例指标主要反映一个地区的灌溉条件状况,对区域内作物种植选择、面积数量和作物种植结构等具有重要影响,该指标可以通过有效灌溉耕地面积占耕地总面积的比重进行计算[34]。土壤质量综合指数(soil quality comprehensive index,SQCI)是反映区域内土壤中物质含量水平和维持生物生产能力的综合度量指标,该指标可作为作物种植选择和作物生长过程中判断土壤条件好坏的重要依据。气候适宜度指标主要用于反映某种作物整个生育期或各个生育阶段(如播种后至某生育期)光、温、水等农业气候资源满足作物生长发育条件要求的程度。主要影响因素具体计算和评价方法如下:
首先,确定土壤质量综合指数。土壤质量由土壤的物理、化学和生物学等多个指标组成,但在区域范围内一般把土壤的理化指标作为土壤质量的评价指标[35]。考虑到单一土壤指标因素无法衡量土壤综合质量,因此,本研究采用土壤质量综合评价中应用最广泛的主成分分析法(principle components analysis,PCA)对研究区土壤质量进行综合评价,从而获得土壤质量综合指数。在此基础上,进行土壤综合质量对作物种植频率变化的影响分析研究。研究中,结合研究区土壤特征和指标获取的可操作性,选择了土壤容重、土壤碳酸钙含量、土壤阳离子交换量、土壤粘粒含量、土壤pH、土壤砂粒含量、土壤粉粒含量、土壤有机碳含量、土壤全钾含量、土壤全氮含量、土壤全磷含量以及土层厚度共12个与作物生长密切相关理化指标对土壤综合质量进行定量评价[36]。其中,土壤质量综合指数构建及其计算方法如下:第一,在对土壤理化指标利用Z-Score标准化方法进行标准化基础上,对12个土壤理化指标进行主成分分析。第二,通过主成分累积贡献大小选择主成分个数,根据主成分因子载荷矩阵特征值得到各主成分的表达式。第三,在计算各主成分得分基础上,计算土壤质量综合得分,即土壤质量综合指数。一般来说,土壤质量综合得分值越高,说明土壤质量越好[37]。其中,综合得分计算公式如下:
式中,F为综合得分(土壤质量综合指数,SQCI),V1、V2…Vi为各主成分贡献率,f1、f2…fi为各主成分得分。
其次,计算区域气候适宜度。河南省是我国传统的冬小麦主产区,该地区一般年份的气候条件均较适宜冬小麦整个生育期作物生长和产量形成,但本研究分析的冬小麦种植频率更多的是土地利用中农户作物种植行为选择结果的体现。其中,作物种植选择行为除了受区域自然条件、气候条件、种植制度、种植习惯和种植比较效益等因素影响外,作物播种期气候条件适宜度是作物主产区农地经营者播种行为决策中起决定作用的关键因素之一,因此,本文重点研究冬小麦播种期气候适宜程度及其对冬小麦种植频率变化的影响。研究中,综合考虑温度、降水和日照3个基本气象要素,结合前人研究成果,在冬小麦播种期温度适宜度、降水适宜度和日照适宜度评价基础上,对研究区冬小麦播种期气候适宜度开展综合评价。主要过程包括:第一,在获取河南省及周边研究年份冬小麦播种期(即10月上中旬)旬平均温度、旬降水和旬日照等气象站点数据基础上,通过对空间插值气象要素进行作物分布掩膜和分县统计,得到研究区各县旬平均温度、降水、日照数据。第二,在参考马树庆[38]、蒋定生[39]、黄璜[40]等人研究的温度、降水和日照等适宜度评价研究成果基础上,分别建立研究时段历年冬小麦播种期温度适宜度函数、降水适宜度函数、日照适宜度函数以及最终的气候适宜度模型。第三,利用研究区冬小麦播种期内旬温度、旬降水和旬日照数据,完成研究时段的冬小麦播种期气候条件评价。冬小麦播种期气候因子适宜度公式如下:
式中,X可以取T、R和L,分别表示旬温度、旬降水和旬日照;Sx(y)可以表示冬小麦播种期气候因子适宜度(温度适宜度、降水适宜度和日照适宜度),n=1、2表示旬序,bj表示权重,S(X(yj))表示各旬气象因子适宜度。本研究主要采用相关系数法计算各旬温度、降水和光照适宜度的权重系数。首先,计算各旬适宜度指数之间的相关系数矩阵,然后根据各个生育期包含的旬计算每一旬与本生育期内其他几旬相关系数的平均值,以其平均值占本生育期内所有旬的相关系数平均值总和的比值,作为该旬在该生育期的权重系数,即bj[41]。具体参数如表2所示。
Table 2
表2
表2冬小麦播种期气候因子适宜度计算主要参数表
Table 2
| 指标名称 Indicator name | 输入参数 Input parameter | 计算公式 Computational formulas | 备注 Remarks |
|---|---|---|---|
| 旬温度适宜度 Ten days temperature suitability | 温度适宜度S(T) Temperature suitability S(T) | $S(T)=[(T-T_1)(T_2-T)^B]/[(T_0-T_1)(T_2-T_0)^B]\\B= (T_2-T_0)/(T_0-T_1)$ | T是旬平均温度,T1、T2、T0分别是该时段生长发育下限温度、上限温度和最适温度,分别取值4、33、15[42] T is the ten days average temperature, T1, T2, T0 are the lower limit temperature, upper limit temperature and the most suitable temperature for growth and development in this period, taking 4, 33, 15 respectively [42] |
| 旬降水适宜度 Ten days precipitation suitability | 降水适宜度S(R) Precipitation suitability S(R) | $S(R)=\begin{cases} R/ R_{0} & R<R_{0} \\ R_{0}/R & R> R_{0} \end{cases}$ | R为旬平均降水量(mm),R0为作物生理需水量,研究中,10月上旬和中旬R0分别11mm和9.1mm[42] R is tens day average precipitation (mm), R0 is the physiological water demand of crops, in the first ten days and the middle ten days of October, R0 is 11mm and 9.1mm respectively [42] |
| 旬日照适宜度 Ten days sunshine suitability | 日照适宜度S(L) Sunshine suitability S(L) | $S(L)=\begin{cases} e^{-[(L-L_{0})/b]^{2}} & L<L_{0} \\ l & L\geq L_{0} \end{cases}$ | L表示实际日照时数(小时),L0表示日照百分率为70%的日照时数,b为常数,文中L0=7.69,b=4.15[42] L represents the actual sunshine hours (hours), L0 is the sunshine hours with the sunshine percentage of 70%, and b is a constant. In this paper, L0 = 7.69, b = 4.15 [42] |
新窗口打开|下载CSV
为了反映温度、降水和日照3个因素对冬小麦适宜性的综合影响,本研究建立了河南省冬小麦播种期气候适宜度模型,主要计算公式如下:
式中,y表示年序,S(y)表示某一年冬小麦播种期气候适宜度,ST(y)、SR(y)、SL(y)分别表示冬小麦播种期温度适宜度、降水适宜度和日照适宜度。
(2)冬小麦种植频率与主要影响因素间关系分析
在获得灌溉条件、土壤质量、气候条件和地形等主要影响因素指标基础上,本研究开展冬小麦种植频率与有效灌溉面积比例、土壤肥力综合指标、气候适宜度以及坡度和高程等主要影响因素间相关分析,从而实现冬小麦种植频率与上述影响因子间相关性和密切程度的客观评价。其中,评价因素间相关性好坏的指标主要包括Pearson correlation相关系数和显著性P值。研究中,主要对河南省18个市(126个县)冬小麦种植频率与主要影响因素进行了相关分析。通过查阅相关系数显著性检验表,在0.01水平下,当样本量为18时,相关系数r绝对值≥0.5897,认为2个因素间相关关系显著;当样本量为126,相关系数r绝对值≥0.2287时,认为2个因素间相关关系显著;当样本量为378,相关系数r绝对值≥0.1310时,认为2个因素间相关关系显著。
(3)冬小麦种植频率主要影响因素重要性评价
为评价灌溉条件、土壤质量、气候条件和地形等主要影响因素对冬小麦种植频率影响的重要程度,本研究利用多元线性回归分析对上述影响因素进行重要性排序。其中,将2001—2015年河南省分县平均有效灌溉面积比例、土壤综合质量指数、冬小麦播种期气候适宜度以及各县冬小麦种植平均坡度和冬小麦种植平均高程作为自变量,将2001—2015年河南省各县冬小麦种植频率作为因变量进行多元线性回归分析。考虑到各个自变量影响因素的单位不同,为消除自变量单位不统一对拟合结果的影响,利用Z-Score标准化方法对各个自变量进行标准化处理。最终,利用多元线性回归分析中的标准回归系数便可衡量每个自变量对因变量的影响程度大小。一般来说,标准化系数的绝对值越大,该自变量对因变量的影响程度就越大。
2 结果
2.1 冬小麦提取精度评价及面积变化分析
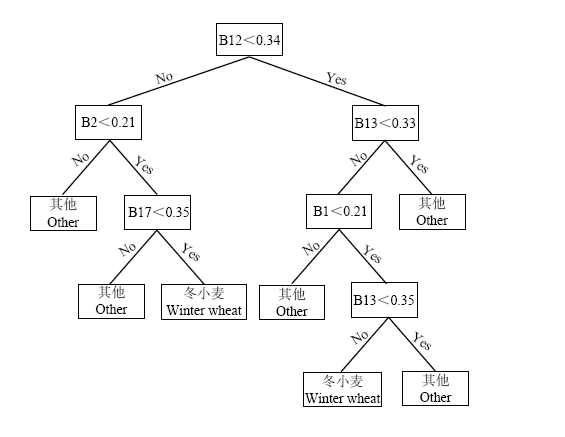
2.1.1 冬小麦种植面积遥感提取精度评价 本文基于均匀分布的冬小麦和其他地物训练样本数据,利用CART工具对2001—2015年滤波后的河南省时序植被指数遥感数据进行决策树构建,在得到决策树规则的基础上,通过执行决策树,最终获得了15年河南省冬小麦种植面积空间分布信息。受篇幅限制,本文仅列部分年份决策树规则和部分年份冬小麦空间分布提取结果,具体如图3—图4所示。图3
 新窗口打开|下载原图ZIP|生成PPT
图3河南省冬小麦分布提取CART决策树(2010年)
Fig. 3CART Decision Tree of winter wheat planting area extraction in Henan province (2010)
图4
 新窗口打开|下载原图ZIP|生成PPT
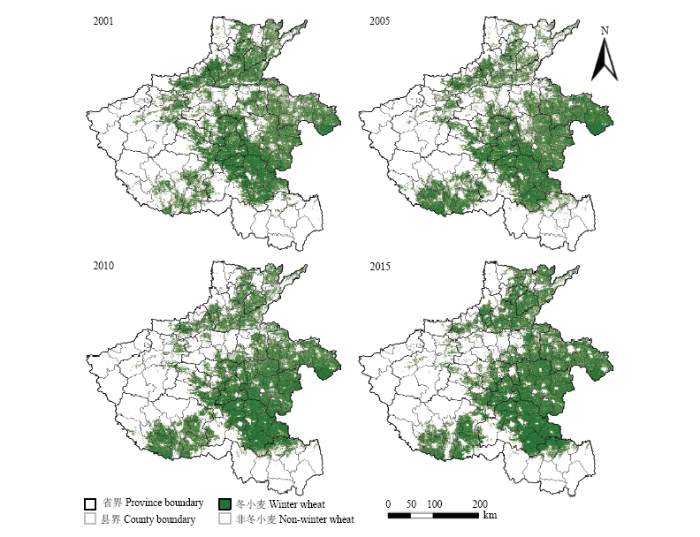
图4河南省部分年份冬小麦空间分布提取结果
Fig. 4Extraction results of spatial distribution of winter wheat in Henan province
通过河南省2001—2015年历年冬小麦种植面积空间分布结果(图4)可以看出,该省冬小麦空间分布广泛,并且在东部、中部、北部的平原区以及南阳盆地等区域形成聚集,上述地区冬小麦种植面积和产量在河南省冬小麦生产中均占有很大权重和重要地位,为河南省冬小麦种植结构稳定和国家粮食安全发挥了重要作用。而豫西丘陵地区、南阳盆地北部以及淮南山丘地区因水土流失严重、地形复杂,并且豫西丘陵地区干旱缺水,旱薄地面积大,导致冬小麦生长发育条件适宜性较差,因此冬小麦空间分布相对零散且数量较少。
为了验证提取结果在空间位置上的准确性,利用从样本数据中随机选取的历年冬小麦及其他地类验证样点数据,通过混淆矩阵得到15年提取结果的总体精度(图5)。从整体看,2001—2015年河南省冬小麦面积提取结果的总体精度在85.78%—95.45%,平均总体精度为90.39%。Kappa系数在0.82—0.92,分类结果与验证样点间具有较好的一致性,说明本研究基于CART决策树算法获取的多年连续冬小麦空间分布结果达到较高精度水平,可满足省域内冬小麦面积变化分析和种植频率变化分析的数据要求。
图5
 新窗口打开|下载原图ZIP|生成PPT
图5河南省不同年份冬小麦遥感识别精度结果
Fig. 5Accuracy result of winter wheat recognition by remote sensing in Henan province in different years
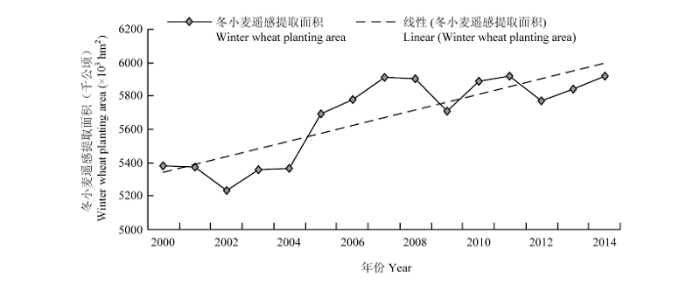
2.1.2 冬小麦种植面积变化情况分析 根据冬小麦遥感提取面积变化情况(图6)可以看出,2001—2015年间河南省冬小麦种植面积整体呈波动上升趋势。其中,2001—2003年冬小麦种植面积为下降趋势,由2001年的5 383.30×10³ hm2减少到2003年的5 232.11 ×10³ hm2。2003年到2008年呈现持续增加趋势。其中,2003—2005年增长较为缓慢,增幅为2.59%,2005—2008年冬小麦种植面积大幅度增加,增幅为10.19%,主要原因是受国家农业种植补贴逐渐增加并不断普及的影响,农业生产者种植积极性提高,导致冬小麦面积逐年增加[43]。
图6
 新窗口打开|下载原图ZIP|生成PPT
图6河南省冬小麦遥感提取面积(2001—2015)
Fig. 6Remote sensing extraction area of winter wheat in Henan province (2001-2015)
2008—2015年冬小麦种植面积呈现波动持平状态。其中,2010年和2013年冬小麦种植面积处于2个向下波动的极值点,冬小麦种植面积减少主要受种植比较效益和气象条件等因素影响。一方面,部分农民放弃冬小麦种植而选择种植效益更高的经济作物,如蔬菜、春花生、西瓜、大蒜等[44,45]。另一方面,上述2年小麦播种期间气象条件对冬小麦播种面积减少也造成一定影响。通过历史气象资料(http://henan. weather.com.cn/)分析可知,2009年秋季冬小麦播种前期,部分地区降水偏少造成小麦播种底墒不足,一些灌溉条件较差的地块冬小麦播种受到一定影响。另外,播种期间,省内局部地区降水偏多导致土壤过湿,一定程度上也影响了部分冬小麦的播种;2012年秋季冬小麦播种期间,豫北、豫西南等地局部土壤偏湿和豫西、豫东及豫南等地局部出现一定旱情,这对当年的冬小麦播种也造成了一定不利影响。此外,随着各地城镇化、工业化进程的逐步推进,部分耕地被建设用地取代,从而造成冬小麦种植面积的减少。
根据各市冬小麦遥感提取种植面积可知,15年间冬小麦种植面积整体呈增加趋势的地区主要包括南阳、商丘、信阳、周口、驻马店等城市,分别增加272.59、135.87、166.87、225.63、109.26×10³ hm2,增长比例分别为65.47%、21.16%、357.18%、30.01%、12.38%。15年间,郑州、洛阳、济源、焦作等地区冬小麦种植面积呈明显的下降趋势,各城市分别减少104.00、139.97、16.26和77.48×10³ hm2,减少比例分别为66.51%、72.47%、63.03%和38.35%。
2.2 冬小麦不同时期种植频率时空变化分析
根据种植频率计算公式(1)—(2)分别计算得到2001—2005年、2006—2010年以及2011—2015年3个阶段河南省冬小麦种植频率空间分布信息,如图7所示。从图中可以看出,2001—2015年河南省冬小麦种植核心地带主要分布在河南省北部、中部、东部以及南阳盆地区,这些地区均具有较高的冬小麦种植频率,而豫南等非冬小麦种植核心地带则具有相对较低的冬小麦种植频率。从不同阶段来看,一些城市周边(如信阳市、南阳市以及周口市的北部、郑州等)和淮河干流以南地区种植频率较低的区域在不断减少。主要原因一方面是由于上述地区社会经济水平和城镇化水平不断提高,城市扩建侵占农用地导致城市周边冬小麦种植逐渐减少。另外,随着各地区经济发展和农作物种植结构的不断调整优化,研究区内(特别是城市周边)许多地区农户将种植收益较低的粮食作物改种为耕地利用效益更高的经济作物(如蔬菜等),也导致了研究区内部分地区冬小麦面积的不断减少。图7
 新窗口打开|下载原图ZIP|生成PPT
图7河南省不同时期冬小麦种植频率空间分布图
Fig.7Spatial distribution of WWPF in different periods of Henan province
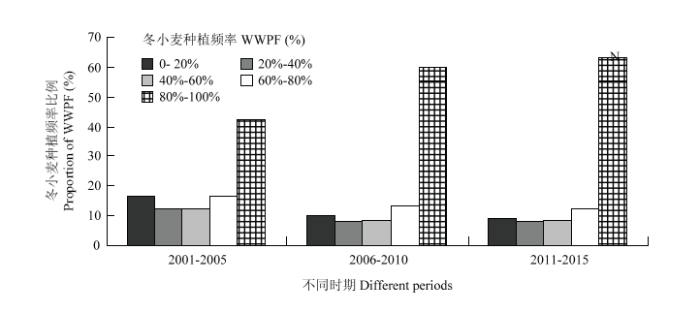
另外,从河南省3个不同时期冬小麦不同种植频率像元数占总种植像元数的比例变化(图8)可以发现,3个时期内种植频率大于80%的像元数(即连续5年种植的像元数)在逐渐增加,3个时期比例分别达到42.68%、59.94%、63.07%。同时,种植频率低(即不连续种植)的像元数比例在逐渐下降,3个时期内种植频率小于等于40%的面积比例分别为28.53%、17.99%和16.63%,这说明河南省是我国冬小麦传统的生产大省,不仅农户冬小麦种植选择行为总体稳定,而且冬小麦种植面积在保证稳定基础上略有增加,这为我国冬小麦生产保持稳定和保障国家粮食安全发挥了重要作用。
图8
 新窗口打开|下载原图ZIP|生成PPT
图8河南省不同时期冬小麦种植频率比例变化情况
Fig. 8The proportion change of WWPF in different periods of Henan province
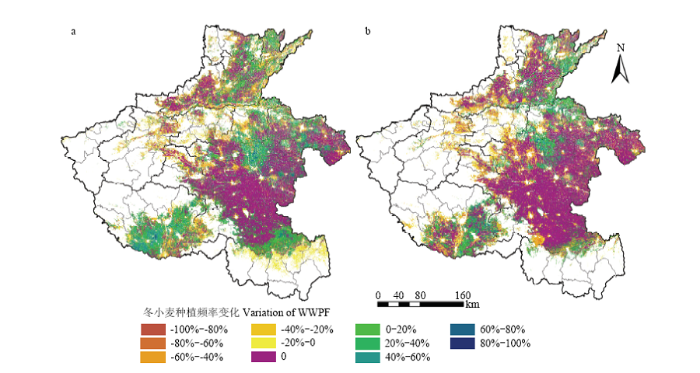
从河南省3个阶段间种植频率空间变化看(图9),冬小麦种植频率保持不变的区域主要集中在豫北地区(如鹤壁、安阳、新乡等)、豫东地区(如商丘和周口)、豫中地区(如许昌和漯河)和豫南地区(如驻马店)等部分县市,上述地区在维持河南省冬小麦种植结构稳定中发挥了重要作用。种植频率变化较大的区域主要集中在豫北地区的濮阳以及南阳盆地和信阳市等地区。从图9可以看出,第一阶段(2001—2005年)到第二阶段(2006—2010年)的种植频率大体上是增加的,并且增幅大多在20%—40%。种植频率降低的地区主要分布在郑州、平顶山、洛阳等地区以及信阳市周边地区。相比第一、第二阶段间变化,从空间分布上也可以看出,第二阶段(2006—2010年)到第三阶段(2011—2015年)间种植频率的增加的地区有所减少,而种植频率基本保持不变的地区则有所增多,说明第二阶段到第三阶段变化过程中河南省冬小麦种植结构更加趋向稳定。其中,种植频率随着时间推移呈现减少趋势的地区主要包括南阳市、邓州市、社旗县、周口市部分县市(如扶沟县、太康县)以及信阳市部分县市(如息县和淮滨县等)。
图9
 新窗口打开|下载原图ZIP|生成PPT
图9河南省不同时期冬小麦种植频率变化空间分布图
(a)第二阶段与第一阶段间冬小麦种植频率变化;(b)第三阶段与第二阶段间冬小麦种植频率变化
Fig. 9Variation distribution of WWPF in different periods in Henan province
(a)Variation of WWPF between the second period and the first period; (b)Variation of WWPF between the third period and the second period
2.3 冬小麦种植频率影响因素分析
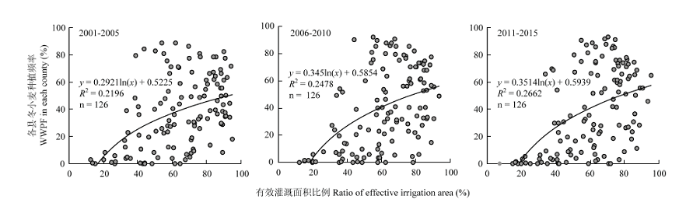
2.3.1 冬小麦种植频率与有效灌溉面积间关系分析 本研究在利用河南省15年县级耕地面积和有效灌溉面积统计数据计算获得2001—2005、2006—2010、2011—2015年3个阶段各县有效灌溉面积比例基础上,结合3个阶段冬小麦种植频率空间信息,开展了冬小麦各县平均种植频率与有效灌溉面积比例相关分析研究。从散点图中可以看出(图10),3个阶段内各县平均种植频率与有效灌溉面积比例间存在一定的正相关关系。通过计算,得到3个阶段显著性P均小于0.01情况下的相关系数r,相关系数分别为0.45、0.49和0.52。可见,冬小麦种植频率与有效灌溉面积比例间正相关关系达到显著水平。
图10
 新窗口打开|下载原图ZIP|生成PPT
图10河南省不同时期各县冬小麦种植频率与有效灌溉面积比例间关系
Fig. 10Relationship between WWPF and ratio of effective irrigated area in different counties of Henan province in different periods
此外,通过对不同时期各县冬小麦平均种植频率和有效灌溉面积比例空间分布结果(图11)进行分析,结果表明,整个河南省研究区域内大多地区有效灌溉面积比例高低水平和各县冬小麦平均种植频率高低水平存在较高的一致性,即当一个地区(如豫东的周口市和商丘市、豫中地区的开封市和许昌市、豫北的濮阳市和鹤壁市等地区)有效灌溉面积比例越高时,其平均种植频率相应越高,而当有效灌溉面积比例水平较低时,其平均种植频率也随之较低,如豫西的三门峡和洛阳、豫南的信阳、南阳和驻马店等地区。
图11
 新窗口打开|下载原图ZIP|生成PPT
图11河南省不同时期各县冬小麦种植频率与有效灌溉面积比例空间分布2.3.2 冬小麦种植频率与土壤质量间关系分析
Fig. 11Spatial distribution of WWPF and ratio of effective irrigation area in different periods of Henan province
(1)土壤质量综合指数构建及计算
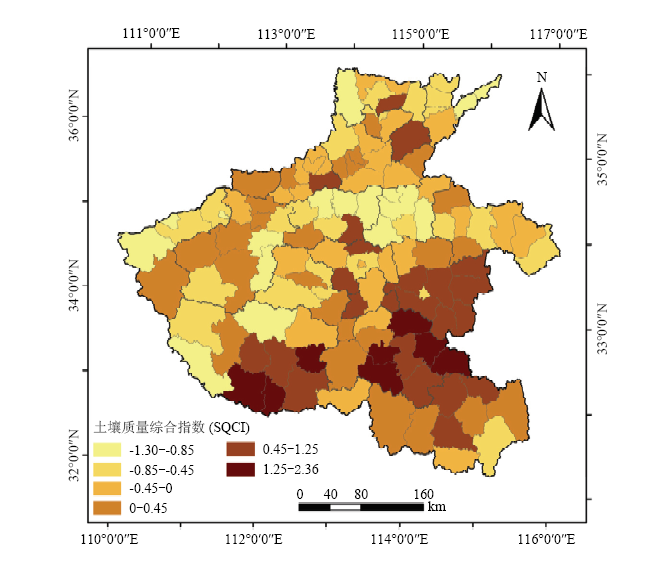
研究中,遵循主成分选取一般原则,即当主成分累积贡献率超过85%时,主成分所包含的信息能够较好地反映原指标所表达信息[46]。本研究选择6个主成分时累积贡献率已达87.84%,因此,选取6个主成分来反映原来12个指标所表达的信息;然后,根据主成分载荷矩阵和主成分特征向量得到主成分表达式,将标准化后土壤指标数据分别代入主成分表达式得到主成分得分f1—f6;最后,以各主成分方差贡献率作为权重,将主成分得分进行加权求和可得到土壤指标综合得分,即为土壤质量综合指数,具体结果如图12所示。
图12
 新窗口打开|下载原图ZIP|生成PPT
图12河南省各县土壤质量综合指数空间分布结果
Fig. 12Spatial distribution of SQCI in Henan province
从图中可以看出,河南省土壤质量综合得分约在-1.30至2.36之间。根据土壤质量综合评价一般标准[47],同时结合实际,本研究将河南省土壤质量综合得分分为6个土壤质量等级。其中土壤质量综合指数在-1.30—-0.85表示土壤质量差;-0.85—-0.45表示土壤质量较差;-0.45—0.45说明土壤质量一般;0.45—1.25表示土壤质量较好,1.25—2.36表示土壤质量好,土壤肥力高。河南省土壤质量较好的地区主要分布在周口、驻马店和南阳等县(市),土壤质量较差的地区主要分布在郑州、三门峡和安阳等县(市)。
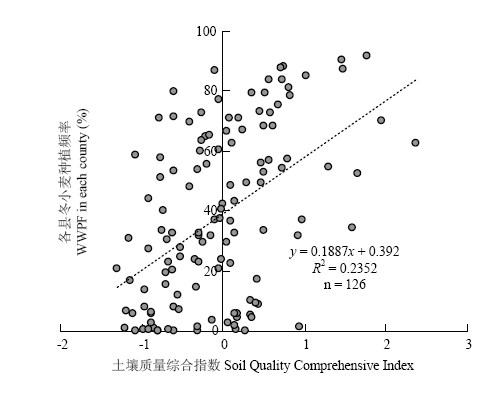
(2)冬小麦种植频率与土壤质量综合指数间关系分析
在得到土壤质量综合指数基础上,本文进一步开展河南省各县冬小麦种植频率与土壤质量综合指数间相关分析研究。从散点图可以看出(图13),随着土壤质量综合指数不断增加,种植频率也在不断上升。通过计算得到P小于0.01情况下的相关系数r为0.49,可见,冬小麦种植频率与土壤质量综合指数间相关关系也达到显著水平。此外,根据土壤质量综合指数分级和作物种植频率高低,结合土壤质量综合指数和冬小麦种植频率散点图的数据分布规律,本研究以土壤质量综合指数0为分界点,种植频率以40%为分界点,将河南省整个研究区内各县土壤质量综合指数和冬小麦种植频率散点数据大致分为4类,如图13中虚线和纵轴共同划分的4个区域所示。
图13
 新窗口打开|下载原图ZIP|生成PPT
图13河南省冬小麦种植频率与土壤质量综合指数间关系
Fig. 13Relationship between WWPF and SQCI in Henan province
通过分析可知,第一类县(市)为土壤质量和种植频率均处于较低水平区域(SQCI≤0,WWPF ≤40%),主要包括安阳、郑州、平顶山、三门峡、南阳和信阳等部分县(市)。其中,除郑州地区受经济水平和城市化水平较高影响导致冬小麦种植频率较低外,上述地区其他地区多以山区为主,且水土流失严重,旱薄地面积较大,土壤质量较低,冬小麦的种植条件较差,因此导致上述地区冬小麦种植频率较低。第二类县(市)为土壤质量高但种植频率较低区域(SQCI>0,WWPF≤40%),主要包括洛宁、宜阳、卢氏、内乡、镇平、罗山和光山等县(市)。上述地区虽然土壤肥力较高,但其有效灌溉面积比例均处较低水平,较差的灌溉条件影响了上述地区部分冬小麦的种植,从而导致上述县(市)冬小麦种植频率处于较低水平。第三类县(市)为土壤质量较低但种植频率较高区域(SQCI≤0,WWPF>40%),主要包括卫辉县、通许县、杞县、夏邑县和许昌县等县(市)。上述县(市)大部分处于河南省冬小麦生产主产区内,尽管土壤质量水平一般,但大多地区地势较为平坦并且具有较好的灌溉条件,因此,上述地区总体条件利于冬小麦的种植,从而使得冬小麦种植频率较高。第四类县(市)为土壤质量和种植频率均处于较高水平区域(SQCI>0,WWPF>40%),主要包括豫北、豫东和豫南地区的部分县(市),如汤阴县、获嘉县、淮阳县、商水县、遂平县等。上述地区中,均处于河南省冬小麦生产主产区内,且大部分县(市)具有较好的自然环境条件,灌溉水平较高且土壤质量较好,这为上述地区冬小麦种植提供了良好的条件,从而保证了上述地区冬小麦种植的稳定性,因此,冬小麦种植频率达到较高水平。
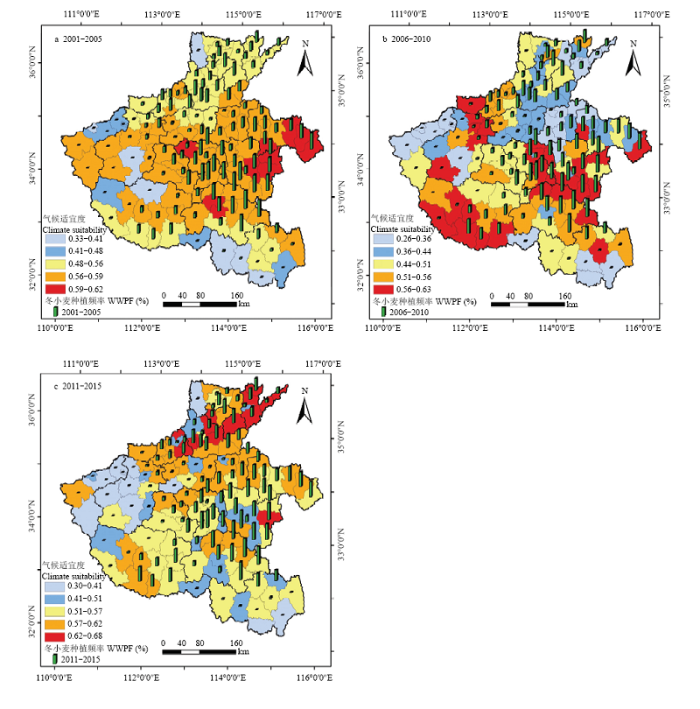
2.3.3 冬小麦种植频率与气候适宜度间关系分析 根据冬小麦播种期气候适宜度计算模型,在分别计算2001—2015年内每年冬小麦播种期气候适宜度基础上,获得了2001—2005、2006—2010、2011—2015年3个阶段冬小麦播种期平均气候适宜度,具体空间分布结果如图14所示。
图14
 新窗口打开|下载原图ZIP|生成PPT
图14河南省不同时期冬小麦种植频率与播种期气候适宜度空间分布
Fig. 14Spatial distribution of WWPF and climate suitability at sowing stage in different periods
从整体来看,2001—2015年间河南省冬小麦播种期气候适宜度较高,一般在0.30—0.65范围内变化。从空间分布上看,河南省3个阶段冬小麦播种期气候适宜度也存在一定变化。其中,第一阶段(2001—2005年)气候适宜度相对较高区域主要集中在豫中和豫东等地,第二阶段(2006—2010年)气候适宜度相对较高区域主要集中在豫东以及南阳盆地等地区,第三阶段(2011—2015年)气候适宜度相对较高的地区则在豫北地区。从图14中3个阶段冬小麦种植频率和气候适宜度空间分布看,冬小麦种植频率和播种期气候适宜度二者分布变化存在较好的一致性关系。其中,豫北、豫东、豫中及南阳盆地等地区冬小麦种植频率和气候适宜度一般都较高,而西南和豫南等地区由于地形复杂、自然条件较差导致冬小麦种植频率和气候适宜度均较低。
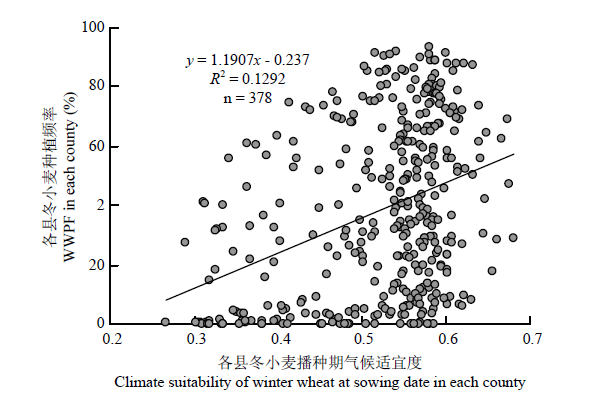
从3个阶段冬小麦种植频率和冬小麦播种期气候适宜度间散点图看(图15),河南省冬小麦种植频率和冬小麦播种期气候适宜度间存在正相关关系,二者间相关系数r达到0.36,说明两者之间关系也达到显著水平,研究区内播种期气候适宜度一定程度上会影响农户冬小麦种植选择行为的发生,当播种期气候适宜度较高时,冬小麦种植频率会出现增加,从而促进冬小麦种植面积的提高,而当播种期气候适宜度较低时,冬小麦种植频率降低的可能性增加,从而导致冬小麦种植面积降低。
图15
 新窗口打开|下载原图ZIP|生成PPT
图15河南省各县冬小麦种植频率与播种期气候适宜度间散点图
Fig. 15Scatter plot of WWPF and climatic suitability at sowing stage in counties of Henan province
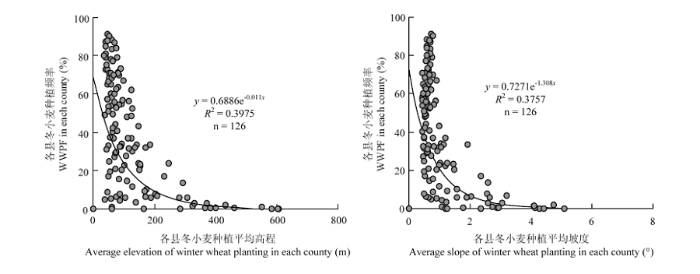
2.3.4 冬小麦种植频率与地形间关系分析 研究中,本文考虑地形主要因素包括高程和坡度,在利用2001—2015年冬小麦面积提取结果进行并集运算获得河南省全部冬小麦种植分布信息基础上,对河南省高程和坡度数据进行掩膜处理,获取了各县冬小麦种植平均高程和平均坡度等信息,进一步开展了冬小麦种植频率与地形间关系分析研究。从冬小麦种植高程和坡度的空间分布与二者间散点图分析看(图16—图17),河南省冬小麦种植频率和高程、坡度间均负相关关系。通过计算得到冬小麦种植频率和高程、坡度间相关系数r分别为-0.58和-0.57,说明研究区内高程和坡度的变化对冬小麦种植频率的高低具有显著的负面影响。从图中可以看出,豫北、豫东以及豫中等地属于平原地区,地势平坦,冬小麦种植自然条件较好,适宜冬小麦生长,因此,冬小麦种植频率较高,而三门峡、洛阳、信阳以及南阳部分地区(如南阳盆地北部)由于高程较高,坡度较大,旱薄地面积较多,冬小麦种植条件偏差,从而导致上述地区冬小麦种植频率较低。
图16
 新窗口打开|下载原图ZIP|生成PPT
图16河南省各县冬小麦种植频率与高程和坡度分布图
Fig. 16Spatial distribution of WWP and elevation/slope in Henan province
图17
 新窗口打开|下载原图ZIP|生成PPT
图17河南省各县冬小麦种植频率与高程和坡度间散点图
Fig. 17Scatter plot of WWPF and elevation/slope in counties of Henan province
2.3.5 区域冬小麦种植频率影响因素指标重要性评价 本研究基于各县多年平均影响因素数据和坡度(高程)数据进行多元线性回归分析,完成上述各因素对冬小麦种植频率的影响程度重要性评价研究,从而对各个影响因素对冬小麦种植频率影响程度进行排序。研究过程中,由于坡度和高程2个变量之间存在很强的相关性,不宜出现在同一回归模型中,因此,本研究在考虑有效灌溉面积、土壤质量综合指数、冬小麦播种期气候适宜度等3个因素基础上,将坡度、高程2个变量分别和上述3个因素与冬小麦种植频率进行多元回归分析,从而获得上述因素的重要性排序。具体结果如下:
式中,Y是冬小麦种植频率(%);X1为冬小麦种植坡度(°),X2为有效灌溉面积比例(%),X3为冬小麦播种期气候适宜度,X4为土壤质量综合指数,X5为冬小麦种植高程(m)。
通过上述冬小麦种植频率与多个影响因素间线性回归方程各个变量系数正负可以看出,土壤质量、气候适宜度和灌溉面积比例对种植频率的提高起到积极促进作用,即土壤质量越高,气候适宜度越强,灌溉条件越完善,冬小麦连续种植的可能性会越高,从而促进冬小麦种植频率的提高,而坡度和高程对冬小麦种植频率的提高起到一定抑制作用,即坡度越大,高程越高,冬小麦连续种植的可能性越低。另外,从拟合冬小麦种植频率的线性回归方程标准化后系数绝对值大小看,标准化系数绝对值越大,说明自变量对因变量的影响程度就越大。因此,本研究中河南省区域冬小麦种植频率影响因素指标重要性排序为:土壤质量综合指数>冬小麦播种期气候适宜度>有效灌溉面积比例>坡度(高程)。其中,冬小麦种植频率变化影响因素指标中,土壤质量对冬小麦种植频率影响属于首要因素,而冬小麦播种期气候适宜度和灌溉条件则属于次要影响冬小麦种植频率高低的因素。研究区内坡度和高程等地形条件对冬小麦种植频率影响最低,主要原因是由于河南省冬小麦主产区大部处于地形简单、坡度起伏不大的平原区,而山区冬小麦种植面积比重较小,因此,研究区冬小麦种植坡度和高程因素对整个河南省冬小麦种植频率影响作用较低。
3 讨论
本研究在利用MODIS时序遥感数据对河南省2011—2015年3个不同时期冬小麦空间分布信息进行遥感提取基础上,计算获得省域内冬小麦种植频率时空变化信息并对其影响因素进行了定量分析,虽然取得了一定研究进展,但一些问题仍有待深入研究或完善。目前研究中仅使用了250 m空间分辨率MODIS MOD13Q1标准产品,由于遥感数据空间分辨率较低,研究区内地物复杂多样导致像元内部必然存在混合像元现象,从而使冬小麦面积提取结果精度下降,今后需进一步开展高分辨率影像以及混合像元分解对作物分布提取影响的相关研究,从而进一步提高作物面积提取精度。此外,研究中进行冬小麦种植面积提取时主要采用对地物进行直接分类的方法,今后需进一步开展基于多源信息(如耕地、地形等)辅助下的作物分布提取方法研究,从而进一步提高作物提取精度水平。
本研究目前对区域冬小麦种植频率时空变化影响因素进行了相关分析,特别是对自然环境因素的影响进行了深入研究,但对极端气候条件等自然因素(如高温、干旱等)对种植频率的影响尚未考虑,今后需要进一步加强研究;由于部分社会经济因素获取存在一定困难,目前仅分析了农业灌溉因素对种植频率变化的影响,而对其他社会经济因素(如粮食价格、种植收益等)和农业政策因素(如农业补贴、目标价格等)考虑不足,今后需要加强开展区域作物种植频率变化与社会经济、农业政策因素间关系研究。
为明确河南省冬小麦种植频率变化及其影响因素的一般规律,本文目前未对河南省进行分区,而是将研究区作为一个整体开展研究,今后需在基于分区的作物种植频率时空变化及其影响因素分析方面进行深入研究。此外,本文仅研究了种植结构简单的冬小麦,今后需要在扩大研究区域基础上,对种植结构更为复杂的秋季作物(如玉米、大豆等)种植频率及其影响因素开展分析研究,从而在更大范围内对本文研究结论的区域适用性做进一步分析;另外,目前研究主要集中在县级尺度作物种植频率及其影响因素开展分析研究,今后需要进一步对地块、农户或村庄等尺度作物种植频率影响因素进行细致研究。
4 结论
本研究以河南省为研究区,以冬小麦为研究作物,利用中低分辨率时序遥感植被指数进行历史连续多年作物种植空间分布信息提取基础上,开展研究区不同时期冬小麦种植频率时空变化和主要影响因素分析研究。主要结论如下:(1)基于MODIS EVI时序遥感数据和CART决策树算法可获得河南省较高精度区域多年冬小麦种植空间分布信息。与验证样点数据相比,冬小麦种植面积提取多年平均总体精度为90.39%,Kappa系数在0.82—0.92之间,表明该方法提取冬小麦空间分布结果达到了较高精度水平,可满足开展区域不同时期冬小麦种植频率变化所需的作物空间分布信息精度需求。
(2)利用河南省不同时期(2001—2005、2006—2010及2011—2015年)冬小麦种植频率空间分布信息,深入分析了河南省冬小麦种植频率时空分布特征和变化规律。结果表明,河南省冬小麦主产区大部具有较高的冬小麦种植频率,而西南地区、豫南等山区由于地形复杂,自然条件较差导致冬小麦种植频率普遍较低。此外,3个不同阶段间河南省冬小麦主产区高频种植冬小麦面积呈逐步增加趋势,低频种植面积呈减小趋势,这在一定程度上对河南省冬小麦种植面积保持稳定和保障国家粮食安全发挥了重要作用。
(3)本研究开展了河南省冬小麦种植频率影响因素定量分析,明确了河南省区域冬小麦种植频率变化影响因素指标重要性排序。结果表明,土壤质量、有效灌溉面积和气候适宜度与河南省冬小麦种植频率间存在显著正相关关系,而坡度和高程呈显著负相关关系。此外,主要指标对河南省冬小麦种植频率影响程度的排序结果为土壤综合质量指数>播期气候适宜度>有效灌溉面积比例>坡度(高程),即土壤质量>播期气候条件>灌溉条件>地形条件。
参考文献 原文顺序
文献年度倒序
文中引用次数倒序
被引期刊影响因子
[本文引用: 1]
[本文引用: 1]
DOI:10.3864/j.issn.0578-1752.2015.10.004URL [本文引用: 1]

Mapping crop patterns with remote sensing is of great implications for agricultural production, food security and agricultural sustainability. In this paper, the theoretical basis behind the mapping was summarized, mapping methods were classified into several categories, characteristics and applicabilities of different mapping methods in the latest decade were discussed intensively, and some important directions and priorities for future studies were proposed. Currently, spectral, temporal and spatial features are the major theoretical bases for crop pattern mapping. The mapping method based on single imagery is characterized by its simple implementation, but with difficulty of capturing imagery at the best time for distinguishing different crops. Instead, the mapping method based on time-series of imagery can make full use of temporal features and is thus widely used for crop mapping, among which the methods using multiple features are more suitable than the ones using a single feature for regions with complicated planting structure. To some extent, feature-oriented statistical modeling method can resolve the mixed-pixel problem but its robustness needs to be improved. Furthermore, large-scale crop pattern mapping can be done by combining the remote sensing and agriculture statistics. However, due to coarse resolution, the derived maps show poor region suitability. Future crop pattern mapping should target at developing “a map of crops”, the emphasis must be put on covering more crop types, enlarging the mapping areas, utilizing the superiority of blending multi-source data, strengthening the data preprocessing, optimizing the feature extraction and classifier selection, and improving the temporal and spatial scales of crop pattern mapping so as to better meet the needs of multi-faceted agricultural applications.
DOI:10.3864/j.issn.0578-1752.2015.10.004URL [本文引用: 1]
Mapping crop patterns with remote sensing is of great implications for agricultural production, food security and agricultural sustainability. In this paper, the theoretical basis behind the mapping was summarized, mapping methods were classified into several categories, characteristics and applicabilities of different mapping methods in the latest decade were discussed intensively, and some important directions and priorities for future studies were proposed. Currently, spectral, temporal and spatial features are the major theoretical bases for crop pattern mapping. The mapping method based on single imagery is characterized by its simple implementation, but with difficulty of capturing imagery at the best time for distinguishing different crops. Instead, the mapping method based on time-series of imagery can make full use of temporal features and is thus widely used for crop mapping, among which the methods using multiple features are more suitable than the ones using a single feature for regions with complicated planting structure. To some extent, feature-oriented statistical modeling method can resolve the mixed-pixel problem but its robustness needs to be improved. Furthermore, large-scale crop pattern mapping can be done by combining the remote sensing and agriculture statistics. However, due to coarse resolution, the derived maps show poor region suitability. Future crop pattern mapping should target at developing “a map of crops”, the emphasis must be put on covering more crop types, enlarging the mapping areas, utilizing the superiority of blending multi-source data, strengthening the data preprocessing, optimizing the feature extraction and classifier selection, and improving the temporal and spatial scales of crop pattern mapping so as to better meet the needs of multi-faceted agricultural applications.
URLPMID:19431994 [本文引用: 2]
Agricultural land uses affect land surface energy and water balance. The North China Plain (NCP) is one of the most important agricultural regions in China and is experiencing a severe water shortage due to decades of excessive extraction of groundwater for crop irrigation. The precise determination of the distribution of the land areas under different crops in NCP does not only provide the basic information needed for evaluating agricultural water consumption in space but also improve agricultural planning for sustainable water resources management. In this study, we established a method for agricultural land use classification using MODIS NDVI data time-series. Raw 16-day composite NDVI data were first processed using HANTS filtering and then sampled the time-series pattern of NDVI for different croplands based on ground truth data. The typical phenological characteristics of the main crops were determined based on field-monitored phenological data in agro-meteorological stations in the study area. Then multiple cropping index (MCI) was induced based on the NDVI time-series to distinguish land areas under wheat-corn double cropping system. Finally, the cultivated area under winter wheat in NCP for the period of 2000-2013 was extracted by using the CART algorithm. The result was validated with county agricultural statistics data, which showed a statistically significant correlation for the 13-year period with correlation coefficient of 0.94 at 95% confidence level. The probability of consistency less than 40% between the remote-sensing derived cultivated area and agricultural statistics data for the study period was less than 15% for the municipalities in the study area. Agricultural land use frequently changed (about yearly) due to crop rotation, price fluctuation, water limitation, etc. This made it difficult to evaluate agricultural land use change from only comparison of agricultural land use maps for any set of years. Thus in this study, the land use change for different crops was evaluated based on multi-year cropping probability comparison, which composed of actual counts of number of years of wheat cultivation in the study period, with high cultivation probability reflecting dominant crop distribution. Through comparison of the differences in wheat cultivated probability maps for the periods of 2000-2006 and 2007-2013, it was noted that wheat cultivated areas significantly increased in Henan and Shandong Provinces, but significantly decreased in the north part and Heilonggang region of Hebei Plain. These changes were mainly considered to be driven by groundwater conditions and national policies for increased grain production, leading to extensive land reclamation in Henan and Shandong.
URL [本文引用: 1]
As a new high-technology with an advantage of high temporal resolution, wide coverage and low cost, remote sensing is currently used in a wide arrange of earth observation activities and thus provides a useful tool to detect and monitor the spatial patterns of crop cultivation. Based on the systematic summary of the progress of studies in remote-sensing-based monitoring of spatial patterns of agricultural crops in the latest decade, including its theories, methods and applications, a series of problems that should be urgently resolved in the study are put forward, and some important study directions and priorities for future are viewed. Studies show that crop acreage can be monitored according to the differences in spectral characteristics of different crops, which are normally recorded by the satellite sensors. There are three major approaches used for crop acreage monitoring: spectral-based identification, phenology-based identification and multiple data-fusion-based identification methods. Mapping multiple cropping systems using remote sensing is mainly based on the crop growth curves, which can be derived from the smoothed time-series vegetation index (VI) data. Furthermore, cropping patterns can be also examined through discriminating the crop growth period from variations in time-series VI data and characteristics of different cropping patterns. How to construct the theoretical and technological systems, to develop and verify the image classification methods, to optimize the smoothing methods for time-series data and to improve the capability of automatic extraction of information could be the major development trends of this field in the future.
URL [本文引用: 1]
Crop pattern is a key element in agricultural land systems other than land use and land cover. Crop pattern dynamic changes take place very frequently, but they are not always easily observable, making many difficulties for analysis. As an effective tool for understanding the driver, process and consequence of agricultural land system changes, the spatially-explicit agent-based land change models have successfully been applied in representing human and natural interactions on agricultural landscapes. With the assumption that the crop pattern at a regional level is the aggregation of crop choices at the filed level, we conceptualized an agent-based model to simulate crop pattern dynamics at a regional scale (CroPaDy), which was supposed to represent the frequent but uneasily observed crop pattern changes in agricultural land systems. The conceptualization of CroPaDy model was designed strictly following the standard protocol for agent-based modeling. However, the computational model hinders its application because it needs a grid-based representation and the model itself is complicated with multi objectives, and nested by 3 interactive sub modules. As CroPaDy model can hardly been developed by the common agent-based modeling platforms, such as RePast, NetLogo, and Swarm, we are trying to use another alternative MATLAB to realize an empirical based application in an agricultural region of Northeast China, by taking the advantage of powerful and open-accessed matrix computing ability of MATLAB. We coded the model for the 3 interactive sub modules in steps: 1) Agents generating module. The Monte Carlo method was used to generate the internal factors (family attributes) for each individual agent in the full coverage study region by combining GIS data, statistical data, survey data and the individual based blanket rules. 2) Agent classifying module. The back propagation artificial neural network method was used to automatically classify the generated agents to groups based on the performance of surveyed agents, and the different groups were further linked with discrete probability on making a certain decision. 3) A probabilistic approach was used to determine the decisions of agent in each modeling period. The survey based data was used to support the empirical based application. After coding CroPaDy model in MATLAB with an input of 114 m×114 m grid-based ASCII file (total grid number = 29 799) plus 384 surveyed households randomly distributed on the selected grids, the model can successfully run and output model results for visualization and analysis. The results suggest that the crop areas of maize, rice, soybean, and tobacco are 26 055.9, 3 506.8, 5 192.2, 3 983.9 hm2 respectively. Comparing with the local statistic yearbook, the overall accuracy of CroPaDy model can reach as high as 90%. Therefore, it is concluded that not only the conceptual framework of CroPaDy model is able to present the interactions between human and environment in agricultural land systems, but also the computational model can be finely programmed with MATLAB software. The study can further prove that crop pattern dynamics can be modeled by capturing farmer's land use decisions, and CroPaDy model can be applied in other similar regions if the detailed household survey data is available.
DOI:10.1007/s11442-018-1535-4URL [本文引用: 1]
Understanding the spatial and temporal variations of cropping systems is very important for agricultural policymaking and food security assessment, and can provide a basis for national policies regarding cropping systems adjustment and agricultural adaptation to climate change. With rapid development of society and the economy, China’s cropping structure has profoundly changed since the reform and opening up in 1978, but there has been no systematic investigation of the pattern, process and characteristics of these changes. In view of this, a crop area database for China was acquired and compiled at the county level for the period 1980-2011, and linear regression and spatial analysis were employed to investigate the cropping structure type and cropping proportion changes at the national level. This research had three main findings: (1) China’s cropping structure has undergone significant changes since 2002; the richness of cropping structure types has increased significantly and a diversified-type structure has gradually replaced the single types. The single-crop types—dominated by rice, wheat or maize—declined, affected by the combination of these three major food crops in mixed plantings and conversion of some of their planting area to other crops. (2) In the top 10 types, 82.7% of the county-level cropping structure was rice, wheat, maize and their combinations in 1980; however, this proportion decreased to 50.7% in 2011, indicating an adjustment period of China’s cropping structure. Spatial analysis showed that 63.8% of China’s counties adjusted their cropping structure, with the general change toward reducing the main food types and increasing fruits and vegetables during 1980-2011. (3) At the national level, the grain-planting pattern dominated by rice shifted to coexistence of rice, wheat and maize during this period. There were significant decreasing trends for 47% of rice, 61% of wheat and 29.6% of maize cropping counties. The pattern of maize cropping had the most significant change, with the maize proportion decreasing in the zone from northeastern to southwestern China during this period. Cities and their surroundings were hotspots for cropping structural adjustment. Urbanization has significantly changed cropping structure, with most of these regions showing rapid increases in the proportion of fruit and vegetables. Our research suggests that the policy of cropping structural adjustment needs to consider geographical characteristics and spatial planning of cropping systems. In this way, the future direction of cropping structural adjustment will be appropriate and scientifically based, such as where there is a need to maintain or increase rice and wheat cropping, increase soybean and decrease maize, and increase the supply of fruit and vegetables.
[本文引用: 1]
[本文引用: 1]
[D].
[本文引用: 1]
[D].
[本文引用: 1]
[本文引用: 1]
[本文引用: 1]
[本文引用: 1]
DOI:10.3864/j.issn.0578-1752.2018.04.007URL [本文引用: 1]
【目的】在遥感与空间抽样相结合进行农作物面积调查中,由于传统的基于面积规模的分层指标设计中缺失对遥感识别结果分类误差的表达,一定程度上影响抽样效率,因此提出基于遥感分类误差校正面积的分层标志——误差校正面积,以期改进农作物种植面积抽样调查效率。【方法】选取北京市通州、大兴区为研究区域,以冬小麦为例,选择16 m分辨率GF-1号影像(获取时间2015年4月4日)为遥感数据源,进行抽样方案的设计。设计与计算高效分层指标,先从像元尺度判断像元相应的错入、错出方向并计算其对应的误差面积,再在抽样单元尺度上统计所有像元的误差面积,将其用于面积规模的校正,校正后结果即为所提出的分层抽样指标——误差校正面积(Scorrect);构建边长为90—300 m的规则正方形格网为抽样框,并完成设置分层层数、确定分层界限方法、样本量分配方式、总体估计方式等空间抽样方案设计。基于设计的抽样方案进行试验,进行研究区冬小麦的区域总量面积反推。以误差校正面积指标和传统分层指标——面积规模为分层指标,进行多次种植面积抽样推断后进行指标有效性分析和精度评价,通过对相关性、典型区域分类错误像元误差分布、总体方差、平均相对误差 、CV值等方面的对比分析,验证所提出指标的可行性与优势。【结果】(1)通过结合原始影像、目标真值分布、遥感分类结果图、分类错误像元误差分布图的对比分析,从像元尺度验证了该指标能校正分类错误像元,从而改善分类结果;在试验抽样框下,误差校正面积的相关系数相较于面积规模略有提高,且数值大于0.7,可保证其与真值较高且稳定的相关性。验证了该指标作为分层指标的有效性。(2)在试验抽样框下,使用误差校正面积作为分层指标进行多次外推面积得到的总体方差在1.70×10¹³—2.41×10¹³,面积规模的总体方差为2.05×10¹³—3.11×10¹³,误差校正面积在推断稳定性方面高于面积规模;采用误差校正面积作为分层指标得到的 为4.21%—5.00%,面积规模的 为4.87%—5.98%,误差校正面积指标能稳定提高近1%的精度;选择误差校正面积指标作为分层指标进行抽样估算结果的CV值在试验抽样框下始终低于面积规模的推断结果,能稳定减少近0.8%。因此误差校正面积指标在与目标真值相关性、抽样精度、推断稳定性等方面均优于传统面积规模分层指标。【结论】误差校正面积指标可在一定程度上提高种植面积抽样调查精度,保证推断的稳定性,验证了遥感识别误差校正面积指标作为分层标志的有效性,能够提高抽样效率,其相较面积规模指标更具有优势。
DOI:10.1016/j.fertnstert.2013.01.092URLPMID:23394781 [本文引用: 1]
To investigate the independent and combined associations between female and male body mass index (BMI) on the probability of achieving a live birth after treatments with in vitro fertilization (IVF) or intracytoplasmic sperm injection (ICSI) under adjustment for relevant covariates.
[本文引用: 1]
[本文引用: 1]
[本文引用: 1]
[本文引用: 1]
[本文引用: 1]
[本文引用: 1]
[本文引用: 1]
[本文引用: 1]
[本文引用: 1]
[本文引用: 1]
[本文引用: 1]
[本文引用: 1]
DOI:10.13287/j.1001-9332.201812.015URLPMID:30584726 [本文引用: 1]
Geographic Object-Based Image Analysis (GEOBIA) was a product under the background of increasing high-resolution remote sensing data. How to improve the accuracy and efficiency of classification of high-resolution images is one of the important topics in image processing. After objects segmented multiscale by QuickBird image was classified, the efficiency of C5.0, C4.5, and CART decision trees in object-oriented classification of forest areas was analyzed. The accuracy of those three methods were compared with kNN method. The eCognition software was used to multiscale segmentation of remote sensing images, with the result showing that 90 and 40 were the optimal scales. After separating vegetation and non-vegetation at 90 scale, 21 features such as spectrum, texture and shape of different vegetation types were extracted at 40 scale, knowledge mining was carried out by using C5.0, C4.5 and CART decision tree algorithms respectively, and classification rules were automatically established. The vegetation area was classified based on the classification rules and the classification accuracy of different methods was compared. The results showed that the classification accuracy based on decision-tree was higher than that of the traditional kNN method. The accuracy of C5.0 method was the best, with the overall accuracy and Kappa coefficient reaching 90.0% and 0.87, respectively. The decision tree algorithm could effectively improve the accuracy in classification of forest species. The Boosting algorithm of the C5.0 decision tree had the most significant improvement on the classification.
[本文引用: 1]
[本文引用: 1]
[本文引用: 1]
[本文引用: 1]
[本文引用: 1]
[本文引用: 1]
[本文引用: 1]
[本文引用: 1]
DOI:10.1016/j.ecolind.2019.01.081URL [本文引用: 1]
[本文引用: 1]
[本文引用: 1]
[本文引用: 1]
[本文引用: 1]
DOI:10.2136/sh2004.4.0129URL [本文引用: 1]
URL [本文引用: 1]
为及时、准确地获取华北平原冬小麦时空分布信息,构建多源遥感监测系统,基于MODIS EVI时间序列数据和两景TM影像,建立华北平原冬小麦时序波谱曲线库,并结合农作物物候历制订统一规则,在此基础上,重建华北平原2001-2011年冬小麦播种面积时空变化过程。结果表明:1)多源遥感监测系统提取华北平原2001-2011年冬小麦信息,在栅格尺度上获得了稳定的较高分类精度,平均为76.36%;在县域行政单元尺度上,2011年的冬小麦遥感监测面积与统计数据的耦合度也较高(决定系数为0.89,均方根误差为1.29×10⁴ hm2);2)华北平原2001-2011年的冬小麦播种面积呈持续上升趋势,2011年比2001年增加了156.05×10⁴ hm2(14.96%);3)冬小麦播种面积大致呈"南增北减"的时空变化格局:平原中南部的鲁西南平原、胶莱平原、豫东平原和皖北平原冬小麦种植面积扩张趋势显著;而北部的京津冀地区冬小麦面积明显收缩。该研究旨在为华北平原调整农业种植结构、制订粮食安全策略及优化水资源管理提供数据支持,也可为大范围、长时间尺度的作物播种面积时空变化遥感监测提供方法借鉴。
[本文引用: 1]
DOI:10.1016/j.gloenvcha.2018.02.011URL [本文引用: 1]
DOI:10.1016/j.apgeog.2017.10.011URL [本文引用: 1]
[本文引用: 1]
[本文引用: 1]
[本文引用: 1]
[本文引用: 1]
URL [本文引用: 1]
土壤作为一种重要的自然资源可以为人类生产食物和纤维,并维持地球生态系统。土壤也是植物生长的媒介、水、热和化合物的源、水分的过滤器和废物分解的生物介质。土壤与水、气和植物互作并抑制环境的波动。土壤可以调节很多控制水气质量和促进植物生长的生态过程。土壤质量概念的引入使我们更全面地理解土壤,也有助于合理地使用和分配劳力、能源、财政和其它投入。土壤质量也提供了一个通用的概念使得专业人员、生产者和公众明白土壤的重要性。此外,它也是一个评价管理措施和土地利用变化对土壤影响的评价工具。土壤质量由土壤的物理、化学和生物性质组成,MDS已被科学家们提出用于土壤质量评价。国际上比较常用的评价方法主要有多变量指标克立格法、土壤质量动力学方法、土壤质量综合评分法和土壤相对质量法。人类对土地不和谐地利用和管理可以导致全球生物地球化学循环发生改变和加快土壤性质变化的速度,当前世界各地土壤退化相当严重,已日益威胁到人类赖以生存的土地资源。在探讨相关概念的基础上综述了近年来土地利用变化对土壤理化质量和生物质量的影响进展,以引起国内外****对土地利用变化对土壤质量影响研究的重视,从而为探讨土地利用对土壤质量影响的机理和规律以及退化土地的恢复和区域土地资源管理以及土地的持续利提供理论依据。土壤质量未来的研究应该集中在土壤质量指标与评价方法;土壤质量变化的发生条件、过程、影响因素及其作用机理与时空规律性;尺度问题的研究;土壤质量保持与提高的途径及其关键技术研究。
[本文引用: 1]
[本文引用: 1]
[本文引用: 1]
[本文引用: 1]
[本文引用: 1]
[本文引用: 1]
[本文引用: 1]
[本文引用: 1]
DOI:10.11849/zrzyxb.1996.04.007URL [本文引用: 1]
On the basis of the meteorologic data in 30 years and the growing and developing character of 8 crops, the climatic ecology adaptability of the crop production in the red and yellow soils region of China is analyzed with the principle of subordinative function of fuzzy mathematics. The results show that the adaptability─subordinative values of temperature, sunshine and rainfall for the spring─sowing crops in the whole growing and developing periods are low, high, low; low, medium, high; and high, medium, low respectively. Those for the summer─sowing crops are low, high, low: high, medium, low; and low, low, low respectively.Those for the autumn─sowing crops are medium, high, low, high; high, low, low; and low,high, medium respectively. The optimal management countermeasure is suggested.
[本文引用: 1]
[本文引用: 1]
[本文引用: 6]
[本文引用: 6]
[本文引用: 1]
[本文引用: 1]
北京: 中国农业出版社,
[本文引用: 1]
Beijing: China Agriculture Press,
[本文引用: 1]
北京: 中国农业出版社,
[本文引用: 1]
Beijing: China Agriculture Press,
[本文引用: 1]
[本文引用: 1]
[本文引用: 1]
[本文引用: 1]
[本文引用: 1]
