 ,1,2,3,*, 刘英1,2,3, 常存1,2,3, 钟瑞森1,2,3
Estimation of cotton Car/Chla ratio by hyperspectral vegetation indices and partial least square regression
YI Qiu-Xiang,1,2,3,*, LIU Ying1,2,3, CHANG Cun1,2,3, ZHONG Rui-Sen1,2,3通讯作者:
收稿日期:2019-10-22接受日期:2020-03-24网络出版日期:2020-08-12
| 基金资助: |
Received:2019-10-22Accepted:2020-03-24Online:2020-08-12
| Fund supported: |

摘要
关键词:
Abstract
Keywords:
PDF (541KB)元数据多维度评价相关文章导出EndNote|Ris|Bibtex收藏本文
本文引用格式
易秋香, 刘英, 常存, 钟瑞森. 基于光谱指数和偏最小二乘的棉花类胡萝卜素/叶绿素a比值估算[J]. 作物学报, 2020, 46(8): 1266-1274. doi:10.3724/SP.J.1006.2020.94157
YI Qiu-Xiang, LIU Ying, CHANG Cun, ZHONG Rui-Sen.
植被色素变化与植被胁迫、光合作用等密切相关。叶绿素(chlorophyll, Chl)及类胡萝卜素(carotenoid, Car)被认为是反映植被生理状况的良好指示器[1]。随着遥感技术的发展, 植被色素含量诊断得到了进一步的发展, 其中, 叶绿素含量的监测已有很多研究, 并且建立了各类叶绿素含量估算模型[2,3,4,5,6]。类胡萝卜素作为叶绿体中的第二大色素, 和叶绿素一样, 具有吸收、传递光能及光保护功能, 并且它可反映植被受胁迫情况[7]。由于叶片中类胡萝卜素含量明显低于叶绿素含量, 并且两者显著相关[8], 用于类胡萝卜素监测的敏感波段也同时受叶绿素含量影响, 这导致类胡萝卜素含量的估算较难[9,10]。
对于大部分植被, 正是由于各类色素含量及其占比的变化, 导致叶片颜色变化[11,12,13]。当植被受到高温胁迫、养分胁迫或在叶片老化过程中, 叶绿素和类胡萝卜素含量都会随之老化而降低, 但相比叶绿素含量的快速减少, 类胡萝卜素含量变化相对更稳定[12,14-16], 这也就意味着类胡萝卜素与叶绿素含量比值可反映植被生长环境胁迫及叶片的老化特征, 如Sanger[17]证实在衰老的叶片中类胡萝卜素要比叶绿素a更持久地存在; Pe?uelas等[18,19]发现类胡萝卜素与叶绿素a (Chla)比值(Car/Chla)在老化和不健康的植被叶片中会增加, 而在健康的叶片中会降低。相比于利用单一叶绿素或类胡萝卜素含量进行植被生理状况监测, Car/Chl比值是一个无量纲值, 能够消除植被类型及品种之间类胡萝卜素和叶绿素含量本身的差异, 使得不同植被类型之间的色素变化情况更具有可比性, 并且, 相比单一叶绿素含量变化或类胡萝卜素含量变化能更灵敏地指示植被生理变化或衰老特征[20], 可为植被生理生态状况监测提供更有效的监测指标。
目前对于类胡萝卜素与叶绿素含量比值的遥感监测已有部分研究。最早Pe?uelas等[18]分析了光谱指数用于Car/Chla监测的可能性, 提出归一化色素指数(Normalized Difference Pigment Index, NDPI)与向日葵及水生植物的Car/Chla比值具有显著相关性; 随后Pe?uelas等[21]又进一步获取了多种植被包括玉米、小麦、番茄、大豆、向日葵、甜菜、橡树、枫树以及肉质植物等的叶片光谱和色素信息, 探讨了
叶片光谱用于Car/Chla估算的最佳波段, 并构建了结构不敏感色素指数 (Structure Insensitive Pigment Index, SIPI), 认为该指数可削弱叶片表面及叶肉结构对Car/Chla估算的影响, 同时证实该指数与Car/Chla比值之间呈非线性相关, 当Car/Chla比值较小时(小于1), SIPI敏感性较低, 当Car/Chla比值大于10时, SIPI达到饱和; Merzlyak等[16]发现多种植被(包括枫树、栗树、土豆以及锦紫苏)叶片老化及果实(包括柠檬和苹果)成熟过程中, 500 nm和680 nm附近的叶片光谱的差值(R678-R500)对叶片老化引起的色素含量变化最为敏感, 由此构建了用于类胡萝卜素与叶绿素比值估算的植被衰老指数(Plant Senescing Reflectance Index, PSRI), 通过PSRI与R678/R750之间的关系判定叶片老化和果实成熟阶段, 但不同植被在叶片老化和果实成熟过程中所展示的PSRI变化有所不同; Nakaji等[22]和Garrity等[23]分别证实日本落叶松及橡树和枫树的Car/Chl比值与光化学指数(Photochemical Reflectance Index, PRI)具有极显著相关性。此外, 也有研究利用辐射传输模型证实了光谱指数与Car/Chla比值之间的显著相关, 如Garrity等[23]利用PROSPECT-5模型证实了PRI与Car/Chl之间显著相关, 决定系数R2=0.83, 但通过实测获取的两种针叶林植被的PRI和Car/Chl比值之间的判定系数仅为0.22, 研究者认为这与获取的叶片样本受干旱胁迫有关; Hernández-Clemente等[24]的研究表明, PRI与叶绿素或类胡萝卜素之间的关系取决于PRI和Car/Chl比值之间的关系, 其利用PROSEPCT+DART模型模拟的针叶林PRI光谱指数与类胡萝卜素与叶绿素比值相关系数达到0.9。国内, 周贤峰[20]利用实测的叶片和冠层光谱评估了一些常用于类胡萝卜素、叶绿素及两者比值估算的光谱指数, 用于玉米和冬小麦的Car/Chl比值估算的精度, 并构建了类胡萝卜素与叶绿素比值植被指数(Combined Carotenoid/Chlorophyll Ratio Index, CCRI)[25], 也证实不同光谱指数对不同作物的Car/Chl比值估算精度与作物Car/Chl比值分布有关, 其中SIPI、PSRI以及PRI对玉米Car/Chl比值估算的精度要优于对冬小麦Car/Chl比值的估算, 主要因为玉米Car/Chl比值分布范围更广泛, 包含更大的变化。
由上可见, 已有研究中关于类胡萝卜素和叶绿素比值遥感监测所提出的光谱指数多针对林木植被展开, 并且都是基于研究对象的经验统计模型, 这类模型的估算精度受植被类型、植被生长环境、植被色素含量变化特征及植被本身光谱特征等多种因素影响, 无法直接应用于不同研究区域的不同作物, 同时对于作物Car/Chla比值遥感监测的研究目前还较少, 有待进一步探讨。本研究分析各类光谱指数用于棉花类胡萝卜素与叶绿素比值及类胡萝卜素的估算精度, 并与偏最小二乘方法对比, 旨在明确其估算的可行性, 丰富棉花生理生态遥感监测指标。
1 材料与方法
1.1 观测试验
于新疆维吾尔自治区北部石河子垦区148团、149团及150团(84°58'—86°24'E, 43°26'—45°20'N), 依据棉田连片面积, 2011及2012年分别选取4个种植面积大于50 hm2的地块作为试验样点布设田间观测点。在每个样点布设6~8个不等的观测点。分别于2011年6月9日(苗期)、7月14日(开花初期)、8月17日(花铃期)及2012年6月19日(现蕾期)、7月18日及(开花盛期) 8月1日(花铃期)试验观测。1.2 数据获取
1.2.1 光谱测定 使用美国ASD (Analytical Spectral Device)公司的ASDFieldSpec Pro FRTM光谱仪测定光谱, 其波段值为350~2500 nm, 其中350~1000 nm光谱采样间隔为1.4 nm, 光谱分辨率为3 nm; 1001~2500 nm光谱采样间隔为2 nm, 光谱分辨率为10 nm。冠层光谱选择在无风无云或少云的天气测定, 测定时间为12:00-16:00。测量之前先开启光谱仪预热, 再次测量之前都先进行光谱仪的优化, 光谱测定前进行参考板反射率测定, 测量时探头垂直向下, 距棉花冠层垂直高度约0.7 m, 25°视场角。叶片光谱选取健康叶片利用叶片夹连接ASD光谱仪测定。冠层光谱和叶片光谱采样均以10条光谱为一采样光谱, 即每次记录10条光谱, 以其平均值作为该样点的光谱反射值。1.2.2 色素含量测定 对应叶片光谱测定的位置, 剪取约0.2 g叶片置试管中, 加萃取液(丙酮:无水乙醇:蒸馏水=4.5:4.5:1.0)(v/v) 25 mL, 于室温下遮光静置至样品完全发白。然后采用722 s分光光度计分别测定663、645和440 nm处的光密度值(optical density, OD), 基于OD值计算叶绿素含量, 参照蒋德安等[26]方法。
1.3 植被指数
考虑到Car/Chla比值与类胡萝卜素含量直接相关, 除已有的Car/Chla比值指数外, 还分析了各类研究中提出的类胡萝卜素光谱植被指数。Hernandez- Clemente等[24]的研究中对用于类胡萝卜素及类胡萝卜素与叶绿素比值估算的植被指数进行了总结, 并构建了简单植被指数(R515/R570), 本文在利用其总结的植被指数外, 加入了Zhou等[25]提出的CCRI, 共计19个植被指数。在对这些植被指数与棉花Car/ Chla比值及类胡萝卜素进行相关性分析的基础上, 筛选出在叶片及冠层尺度与Car/Chla比值及类胡萝卜素均达到极显著相关的植被指数进行进一步模型构建分析。采用的植被指数如表1。Table 1
表1
表1所采用的光谱指数
Table 1
| 指数 Index | 全称 Full name | 表达式 Formula | 文献 Reference |
|---|---|---|---|
| PRI | Photochemical Reflectance Index | (R531-R570)/(R531+R570) | [27] |
| PRI*CI | Carotenoid/Chlorophyll Ratio Index | (R531-R570)/(R531+R570)*((R760/R700)-1)) | [23] |
| PSRI | Plant senescence reflectance index | (R678-R500)/R750 | [16] |
| R515/R570 | Simple ratio vegetation index | R515/R570 | [24] |
| CCRI | Combined carotenoid/chlorophyll ratio index | (R720-R521)*R705/(R750-R705)*R521 | [25] |
新窗口打开|下载CSV
1.4 偏最小二乘回归
偏最小二乘回归(partial least square regression, PLSR)是用于光谱数据分析的强有力方法, 该方法已被应用于各类研究[28,29]。对于该方法的具体介绍可参考Geladi等[30]和Wold等[31]。本研究中, PLSR用于构建棉花叶片及冠层光谱反射率与Car/Chla比值及类胡萝卜素之间的线性模型, 采用波段400~ 1000 nm共计601个光谱反射率作为输入变量, 利用留一验证法(leave-one-out cross-validation, LOOCV)[32]通过最小预测残差平方和(predicted residual sums of squares, PRESS)[33]确定各估算模型的最佳潜变量(latent variables)个数。PLSR模型构建通过Matlab代码编程实现。2 结果与分析
2.1 类胡萝卜素与叶绿素a比值(Car/Chla)及类胡萝卜素(Car)统计特征
将叶片和冠层尺度的Car/Chla比值及Car的实测数据随机分为检验样本和验证样本, 其中总数据的三分之二用于建模, 剩余的三分之一用于模型估算精度验证。建模样本和检验样本的Car/Chla比值及Car统计特征见表2。由表2可知, Car/Chla比值及Car的取值分布广泛, Car/Chla比值的最大最小值分别是0.109和0.495, Car含量最小3.97 μg cm-2, 最大23.06 μg cm-2。建模样本和检验样本统计特征相似, 说明样本随机分组合理。Table 2
表2
表2用于模型构建和验证的Car/Chla比值以及Car的统计特征
Table 2
| 尺度 Level | 数据集 Dataset | 样本数n | Car/Chla比值Car/Chla ratio | 类胡萝卜素Car (μg cm-2) | |||||
|---|---|---|---|---|---|---|---|---|---|
| 平均值Mean | 取值范围 Range | 标准偏差SD | 平均值Mean | 取值范围 Range | 标准偏差SD | ||||
| 叶片尺度 Leaf level | 总体All | 141 | 0.286 | 0.109-0.495 | 0.081 | 13.49 | 3.97-23.06 | 3.99 | |
| 验证样本Calibration | 94 | 0.283 | 0.109-0.478 | 0.081 | 13.08 | 5.76-22.83 | 3.72 | ||
| 检验样本Validation | 47 | 0.292 | 0.118-0.495 | 0.083 | 14.32 | 3.97-23.06 | 4.40 | ||
| 冠层尺度Canopy level | 总体All | 159 | 0.302 | 0.109-0.495 | 0.082 | 14.15 | 3.97-23.06 | 4.16 | |
| 验证样本Calibration | 104 | 0.300 | 0.109-0.440 | 0.082 | 13.88 | 5.76-20.93 | 3.91 | ||
| 检验样本Validation | 55 | 0.306 | 0.118-0.495 | 0.082 | 14.55 | 3.97-23.06 | 4.51 | ||
新窗口打开|下载CSV
2.2 基于植被指数的估算模型构建
已有的研究证实Car/Chla比值及Car和光谱指数之间通常呈线性[24,25]或一元二次的非线性相关[23], 本研究构建了基于这2种拟合函数的估算模型。线性模型为
一元二次模型为
其中, y表示Car/Chla比值或Car含量; x表示光谱指数。
基于各类植被指数构建的线性及一元二次估算模型的决定系数见表3。由表3可知, 对于Car/Chla比值及Car含量, 在叶片及冠层尺度, 均是基于PRI的一元二次模型具有最大决定系数, 并且不论是叶片尺度还是冠层尺度, Car/Chla比值的估算模型的决定系数总是大于Car含量的估算模型, PRI-Car/Chla模型在叶片尺度具有最大决定系数R2=0.732, 冠层尺度R2=0.681, 叶片尺度的Car/Chla估算模型精度略优于冠层尺度。进一步对比发现, 基于PRI的线性估算模型与一元二次模型的决定系数非常接近, 2种模型判定系数的差值均小于0.01。考虑到模型的简单性, 在估算精度相似的情况下, 本研究将采用表达形式更为简单的线性模型利用检验样本进行进一步精度检验, 在此基础上, 讨论利用叶片尺度的PROSPCT-D[34]和冠层尺度的SAILH[35]辐射传输模型模拟棉花叶片及冠层尺度的反射率, 进一步检验PRI用于棉花Car/Chla估算的有效性。
Table 3
表3
表3基于植被指数的Car/Chla比值及Car估算模型
Table 3
| 建模方法 Method | 叶片尺度Leaf level | 冠层尺度Canopy level | |||
|---|---|---|---|---|---|
| 比值Car/Chla ratio | 类胡萝卜素Car | 比值Car/Chla ratio | 类胡萝卜素Car | ||
| PRI-Linear | y= -0.834x+0.338 R2=0.723 | y= -30.58x+14.86 R2=0.541 | y=1.343x+0.313 R2=0.670 | y= -0.009x+0.135 R2=0.486 | |
| PRI-Polynomial | y=1.897x2-1.31x+0.348 R2=0.732 | y=26.1x2-37.07x+14.9 R2=0.542 | y=3.191x2-1.679x+0.309 R2=0.681 | y=0.001x2-0.044x+0.349 R2=0.487 | |
| PRI*CI-Linear | y= -0.155x+0.328 R2=0.638 | y= -5.35x +14.37 R2=0.426 | y= -0.127x + 0.32 R2=0.519 | y= -0.0718x+1.1565 R2=0.356 | |
| PRI*CI-Polynomial | y=0.104x2-0.293x+0.341 R2=0.681 | y=5.38x2-12.49x+15.03 R2=0.488 | y=0.073x2-0.248x+0.321 R2=0.627 | y=0.01x2-0.34x+2.79 R2=0.431 | |
| PSRI-Linear | y=3.711x + 0.323 R2=0.203 | y=155.2x + 14.47 R2=0.196 | y=1.74x + 0.293 R2=0.157 | y=0.0015x-0.0158 R2=0.093 | |
| PSRI-Polynomial | y= -180.3x2-0.66x+0.314 R2=0.257 | y = -11414x2-122.7x+13.9 R2=0.314 | y= -54.95x2+2.56x+0.31 R2=0.239 | y= -0.0004x2 +0.01x-0.09 R2=0.244 | |
| CCRI-Linear | y=0.173x+0.079 R2=0.501 | y=5.42x+6.38 R2=0.272 | y=0.182x+0.082 R2=0.405 | y=0.031x+0.758 R2=0.189 | |
| CCRI-Polynomial | y= -0.134x2+0.49x-0.097 R2=0.580 | y= -7.09x2 +22.3x-2.89 R2=0.396 | y= -0.364x2+0.976x-0.317 R2=0.526 | y= -0.008x2 +0.239x-0.51 R2=0.417 | |
新窗口打开|下载CSV
2.3 基于PLSR的估算模型构建
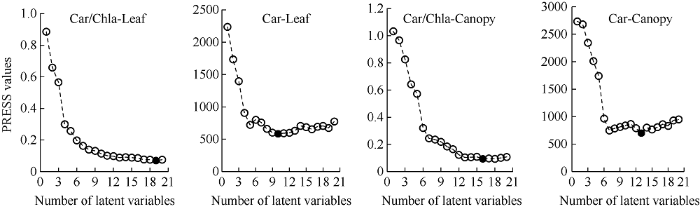
PLSR估算模型的最佳潜变量个数通过LOCCV获取最小预测残差平方和(PRESS)值来确定。潜变量是自变量信息的重新组合, 当潜变量个数对因变量解释性最强, 同时又最能概括自变量系统中的综合信息时, 为最佳潜变量个数, 通常用PRESS值来判定, 当PRESS值最小时, 所对应的潜变量个数即为模型最佳潜变量个数。叶片尺度及冠层尺度的Car/Chla比值及Car含量的PLSR模型的潜变量个数与PRESS之间的关系如图1所示。图中最小PRESS值所对应的潜变量个数用黑色实心圆点表示。由图1可知, 叶片及冠层尺度Car/ Chla比值的PLSR模型的最佳潜变量个数分别为19和16, Car含量的PLSR模型最佳潜变量个数分别为10和13。图1
 新窗口打开|下载原图ZIP|生成PPT
图1预测误差平方和(PRESS)与潜变量之间的变化关系
Fig. 1Relationships between the number of latent variables and the predicted residual sums of squares (PRESS)
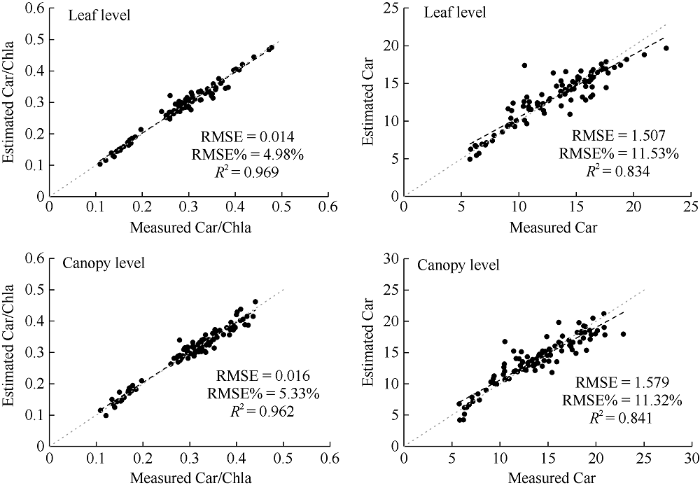
在确定各估算模型最佳潜变量个数的基础上, 将叶片及冠层光谱反射率(400~1000 nm)和Car/ Chla比值及Car含量作为模型输入变量, 构建PLSR估算模型, 得到叶片及冠层尺度的Car/Chla比值和Car含量的估算值。基于建模样本的估算值与实测值之间的线性关系如图2所示。由图2可知, 在叶片和冠层尺度, Car/Chla比值及Car含量的估算值与实测值均高度拟合, 两者的拟合线与1:1线接近重叠, 并且相比Car含量, Car/Chla比值的估算精度更高, 叶片和冠层尺度其估算值与实测值的拟合决定系数R2均大于0.96, RMSE%约为5%, 小于Car含量的11%左右。
图2
 新窗口打开|下载原图ZIP|生成PPT
图2基于建模样本的Car/Chla-PLSR和Car-PLSR估算模型的估算值与实测值之间的线性关系
Fig. 2Measured vs. estimated Car/Chla ratio and Car for PLSR models using calibration dataset
2.4 精度检验
进一步利用检验样本对基于PRI和PLSR的Car/Chla比值及Car含量估算模型进行精度验证。采用估算值与实测值之间线性拟合的决定系数R2、均方根误差RMSE、RMSE%以及估算值与实测值之间线性拟合的斜率(a)和截距(b)进行模型精度检验。决定系数R2以及斜率和截距可反映估算值与实测值之间变化趋势的吻合程度, 当R2越趋近1, 斜率越接近1, 截距越接近0时, 估算值和实测值之间吻合越好; RMSE%是RMSE值与实测平均值之间的百分比值, 它是无量纲值, 可用于单位不同的参数之间估算误差的比较, 直接体现模型估算误差。由表4可知, 叶片及冠层水平, 相比Car含量, Car/Chla比值的光谱指数模型及PLSR模型均具有更好的精度结果, 并且对于PLSR方法, 叶片尺度和冠层尺度Car/Chla比值估算的精度接近, 对于PRI, 叶片尺度光谱对Car/Chla比值估算的精度略优于冠层尺度。Table 4
表4
表4基于检验样本的Car/Chla比值及Car含量估算模型精度检验结果
Table 4
| 尺度 Level | 方法 Method | 参数 Parameter | 决定系数 R2 | 均方根误差RMSE | 均方根误差 RMSE (%) | 斜率 a | 截距 b |
|---|---|---|---|---|---|---|---|
| 叶片尺度Leaf level | PRI | Car/Chla | 0.69 | 0.05 | 15.8 | 0.66 | 0.09 |
| Carotenoid | 0.44 | 3.57 | 24.9 | 0.37 | 7.71 | ||
| PLSR | Car/Chla | 0.87 | 0.03 | 10.7 | 0.83 | 0.04 | |
| Carotenoid | 0.73 | 2.39 | 16.7 | 0.67 | 4.02 | ||
| 冠层尺度Canopy level | PRI | Car/Chla | 0.67 | 0.05 | 15.3 | 0.67 | 0.09 |
| Carotenoid | 0.36 | 3.62 | 24.9 | 0.37 | 8.74 | ||
| PLSR | Car/Chla | 0.84 | 0.03 | 10.1 | 0.84 | 0.05 | |
| Carotenoid | 0.74 | 2.19 | 14.9 | 0.72 | 3.87 |
新窗口打开|下载CSV
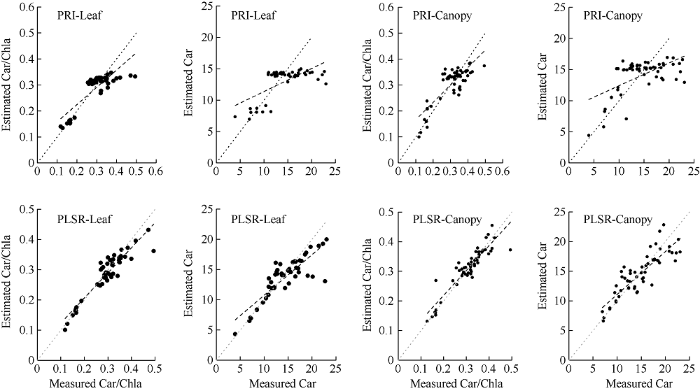
基于检验样本得到的Car/Chla比值及Car含量估算值和实测值之间的吻合趋势见图3。对比基于指数和基于PLSR方法的估算模型发现, 由PLSR模型得到的估算值与实测值之间拟合更好, 不论是Car/Chla比值还是Car含量, 利用PLSR方法得到的估算值都具有更大的斜率和更小的截距, 估算值与实测值更接近, 并且在叶片和冠层尺度Car/Chla比值的估算精度非常接近, 说明PLSR方法具有很好的稳定性。
图3
 新窗口打开|下载原图ZIP|生成PPT
图3基于检验样本的Car/Chla比值及Car含量估算值与实测值之间的拟合关系
Fig. 3Measured vs. estimated Car/Chla ratio and Car using validation dataset
3 讨论
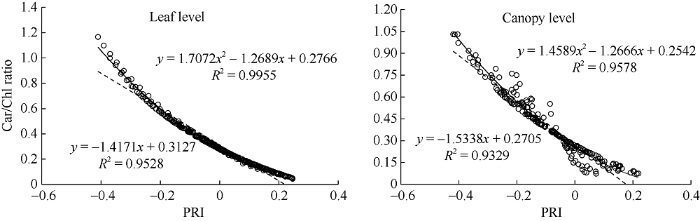
对多种光谱指数与Car/Chla比值及Car含量之间的相关分析表明,PRI指数在叶片和冠层尺度均是表现最佳的植被指数。本研究进一步利用叶片辐射传输模型PROSPECT-D模型和冠层SAILH模型模拟了棉花叶片及冠层尺度的光谱反射率,利用光谱模拟值分析了PRI对Car/Chl比值的估算能力,如图4所示,模拟结果也很好地证明了PRI与Car/Chl比值之间极显著线性及一元二次相关性。这一结论与Garrity等[23]对落叶林Car/Chl比值的监测结果一致,该研究中落叶林模拟PRI值与Car/Chl比值之间的一元二次拟合关系的判定系数R2=0.99,与本研究接近。PRI是531 nm和570 nm处光谱反射率的归一化比值,最早用于叶黄素变化监测,但叶绿素和类胡萝卜素在531 nm处均有吸收特征,570 nm处只叶绿素有吸收特征,因此PRI与Car/Chl比值强烈相关[9,36],很多研究都证实PRI是时间上从天尺度[19,27]到月尺度[37,38]和在叶片[21,39-40]、冠层[19,41-42]以及生态尺度[43,44]监测光合作用的有效指数。本研究的结论也进一步证实了PRI在叶片尺度和冠层尺度,对干旱区作物Car/Chla比值估算的精度接近,凸显了该指数在不同光谱尺度的巨大应用价值。图4
 新窗口打开|下载原图ZIP|生成PPT
图4PROSPECT和SAILH模型模拟的叶片及冠层PRI指数与Car/Chl之间的拟合关系
Fig. 4Relationship of PROSPECT and SAILH simulated PRI with Car/Chl ratio
本研究结果证明不论是基于光谱指数方法还是基于偏最小二乘PLSR方法, 相比单一对Car含量的估算, 对Car/Chla比值的估算精度都更高, 这与Merzlyak等[16]及Pe?uelas等[21]证实的相比单一叶绿素或类胡萝卜素, 光谱指数对Car/Chl比值的估算更为有效的结论一致。基于PRI和PLSR方法的估算模型均能实现Car/Chla比值和Car含量的估算, 前者在叶片和冠层尺度的决定系数R2分别为0.69和0.67, 而后者为0.87和0.84, 可见偏最小二乘法对Car/Chla比值和Car含量的估算精度更好。但PRI是由2个与叶绿素含量和类胡萝卜素含量相关的敏感波段反射率值构成, PLSR方法的输入变量则是400~1000 nm波段范围内的所有光谱反射率, 对于波段分布有限且包含多种指数波段的多光谱卫星, 如Sentinel-2卫星数据, 通过构建光谱指数进行Car/Chla比值监测较为适用, 而当输入变量较多时, 如光谱分辨率较高的高光谱数据, 则可采用PLSR方法, PLSR包含的主成分分析计算, 能有效降低输入变量维度, 剔除冗余变量。
4 结论
(1)对比各类光谱指数, 光化学指数(PRI)与Car/ Chla比值及Car含量具有最显著相关性, 基于PRI指数的线性和一元二次非线性拟合模型对叶片和冠层尺度的Car/Chla比值和Car含量的估算具有最大决定系数; (2) PRI和偏最小二乘回归(PLSR)对Car/Chla比值的估算精度要优于对Car含量的估算, Car/Chla比值可作为棉花生理生态胁迫(如高温胁迫、养分胁迫和水分胁迫以及病虫害)遥感监测的有效参考指标; (3) PRI和PLSR是Car/ Chla比值和Car含量遥感监测的有效方法, 两者在叶片及冠层尺度对Car/Chla比值的估算精度接近, 对于叶片及冠层高光谱数据, PLSR模型估算能力略高于PRI模型。进一步研究, 期望利用Sentinel-2卫星数据在区域尺度上验证本研究结论, 并探讨Car/Chla比值用于棉花水分、养分胁迫及叶片衰老状况监测的特点。参考文献 原文顺序
文献年度倒序
文中引用次数倒序
被引期刊影响因子
[本文引用: 1]
[本文引用: 1]
[本文引用: 1]
[本文引用: 1]
URLPMID:31007289 [本文引用: 1]
URLPMID:21622307 [本文引用: 1]
[本文引用: 1]
[本文引用: 1]
DOI:10.1016/S0034-4257(02)00010-XURL [本文引用: 2]
[本文引用: 1]
[本文引用: 1]
[本文引用: 2]
[本文引用: 1]
[本文引用: 1]
[本文引用: 3]
[本文引用: 1]
[本文引用: 2]
DOI:10.1016/0034-4257(94)90136-8URL [本文引用: 3]
[本文引用: 2]
[本文引用: 2]
[本文引用: 3]
[本文引用: 1]
[本文引用: 4]
[本文引用: 3]
[本文引用: 3]
[本文引用: 1]
[本文引用: 1]
[本文引用: 1]
[本文引用: 1]
[本文引用: 1]
[本文引用: 1]
[本文引用: 1]
[本文引用: 1]
[本文引用: 1]
DOI:10.1109/tsmcb.2003.817107URLPMID:15376838 [本文引用: 1]

The paper introduces an efficient construction algorithm for obtaining sparse linear-in-the-weights regression models based on an approach of directly optimizing model generalization capability. This is achieved by utilizing the delete-1 cross validation concept and the associated leave-one-out test error also known as the predicted residual sums of squares (PRESS) statistic, without resorting to any other validation data set for model evaluation in the model construction process. Computational efficiency is ensured using an orthogonal forward regression, but the algorithm incrementally minimizes the PRESS statistic instead of the usual sum of the squared training errors. A local regularization method can naturally be incorporated into the model selection procedure to further enforce model sparsity. The proposed algorithm is fully automatic, and the user is not required to specify any criterion to terminate the model construction procedure. Comparisons with some of the existing state-of-art modeling methods are given, and several examples are included to demonstrate the ability of the proposed algorithm to effectively construct sparse models that generalize well.
[本文引用: 1]
[本文引用: 1]
[本文引用: 1]
DOI:10.1007/s00442-002-0905-9URLPMID:28547708 [本文引用: 1]
This study examined the ability of the Photochemical Reflectance Index (PRI) to track seasonal variations in carotenoid pigments and photosynthetic activity of mature evergreen chaparral shrubs. Our results confirm that PRI scales with photosystem two (PSII) photochemical efficiency across species and seasons, as demonstrated by PRI's strong correlation with de-epoxidized (photoprotective) xanthophyll cycle pigment levels (normalized to chlorophyll) and with the chlorophyll fluorescence index, DeltaF/Fm'. PRI and carotenoid pigment levels (de-epoxidized xanthophyll cycle pigments normalized to chlorophyll or total carotenoid pigments normalized to chlorophyll) were correlated with seasonal fluctuations in midday net CO2 uptake of top-canopy leaves. By contrast, chlorophyll levels (as measured by the Chlorophyll Index) were not as strongly linked to photosynthetic activity, particularly when all species were considered together. Likewise, the Normalized Difference Vegetation Index (NDVI, an index of canopy greenness) did not correlate with net CO2 uptake. Canopy NDVI also did not correlate with canopy PRI, demonstrating that these indices were largely independent over the temporal and spatial scales of this study. Together, these patterns provide evidence for coordinated regulation of carotenoid pigments, PSII electron transport, and carboxylation across seasons and indicate that physiological adjustments are more important than structural ones in modifying CO2-fixation capacity during periods of photosynthetic down-regulation for these evergreen species. The strong correlation between PRI of whole canopies and PRI of top-canopy leaves suggests that the canopy can be treated as a
[本文引用: 1]
DOI:10.1007/s004420050337URLPMID:28307626 [本文引用: 1]
The photochemical reflectance index (PRI), derived from narrow-band reflectance at 531 and 570 nm, was explored as an indicator of photosynthetic radiation use efficiency for 20 species representing three functional types: annual, deciduous perennial, and evergreen perennial. Across species, top-canopy leaves in full sun at midday exhibited a strong correlation between PRI and DeltaF/Fm', a fluorescence-based index of photosystem II (PSII) photochemical efficiency. PRI was also significantly correlated with both net CO2 uptake and radiation use efficiency measured by gas exchange. When species were examined by functional type, evergreens exhibited significantly reduced midday photosynthetic rates relative to annual and deciduous species. This midday reduction was associated with reduced radiation use efficiency, detectable as reduced net CO2 uptake, PRI, and DeltaF/Fm' values, and increased levels of the photoprotective xanthophyll cycle pigment zeaxanthin. For each functional type, nutrient deficiency led to reductions in both PRI and DeltaF/Fm' relative to fertilized controls. Laboratory experiments exposing leaves to diurnal courses of radiation and simulated midday stomatal closure demonstrated that PRI changed rapidly with both irradiance and leaf physiological state. In these studies, PRI was closely correlated with both DeltaF/Fm' and radiation use efficiency determined from gas exchange at all but the lowest light levels. Examination of the difference spectra upon exposure to increasing light levels revealed that the 531 nm Delta reflectance signal was composed of two spectral components. At low irradiance, this signal was dominated by a 545-nm component, which was not closely related to radiation use efficiency. At progressively higher light levels above 100 mumol m(-2) s(-1), the 531-nm signal was increasingly dominated by a 526-nm component, which was correlated with light use efficiency and with the conversion of the xanthophyll pigment violaxanthin to antheraxanthin and zeaxanthin. Further consideration of the two components composing the 531-nm signal could lead to an index of photosynthetic function applicable over a wide range of illumination. The results of this study support the use of PRI as an interspecific index of photosynthetic radiation use efficiency for leaves and canopies in full sun, but not across wide ranges in illumination from deep shade to full sun. The discovery of a consistent relationship between PRI and photosynthetic radiation use efficiency for top-canopy leaves across species, functional types, and nutrient treatments suggests that relative photosynthetic rates could be derived with the
DOI:10.3732/ajb.89.1.88URLPMID:21669715 [本文引用: 1]
We studied relationships between spectral reflectance and photosynthesis of mountain paper birch, Betula papyrifera var. cordifolia (Regel) Fern., leaves from three different elevations on Mt. Mansfield (summit elevation 1339 m above sea level) in the Green Mountains of Vermont, USA. The different reflectance indices we used all suggested progressively increasing stress with increasing elevation. The photochemical reflectance index (PRI) indicated lower photosynthetic radiation use efficiency at higher elevations, the red edge position (lambdaRE) indicated lower chlorophyll concentrations at higher elevations, and the structure-independent pigment index (SIPI) indicated a higher carotenoid : chlorophyll a ratio at higher elevations. The rate of change in these indices with changes in elevation was much higher than we have observed in our studies of red spruce and balsam fir reflectance along a similar elevational gradient; we take this to be an indicator of the greater susceptibility of paper birch to elevation-related stressors compared to the very stress-tolerant conifers. At all light levels, photosynthesis decreased with increasing elevation; this pattern was most noticeable in the light-saturated rate of photosynthesis (A(sat)), which was nearly twice as high in low-elevation leaves (17.0 +/- 1.0 mumol.m(-2).s(-1)) than in high-elevation leaves. The quantum yield of photosynthesis (Phi) exhibited a similar trend. Furthermore, the highest elevation leaves showed a much sharper transition from the light-limited to the light-saturated part of the light response curve than did the lowest elevation leaves. The photochemical reflectance index was highly correlated with A(sat) (r(2) = 0.99) and Phi (r(2) = 0.96). In addition to contributing to our knowledge of the ecophysiology of paper birch along a steep environmental gradient, these results are further evidence of the usefulness of reflectance measures for the rapid and noninvasive detection of plant stress, especially when used in conjunction with direct measurements of photosynthesis.
[本文引用: 1]
[本文引用: 1]
DOI:10.1016/S0168-1923(99)00167-7URL [本文引用: 1]
DOI:10.1080/014311600750019958URL [本文引用: 1]
