 , 贾芳丽1,2,3, 刘筱因4, 李锋民1,2,3

1. 中国海洋大学, 环境科学与工程学院, 近海环境污染控制研究所, 青岛 266100;
2. 中国海洋大学, 海洋环境与生态教育部重点实验室, 青岛 266100;
3. 青岛海洋科学与技术试点国家实验室海洋生态与环境科学功能实验室, 青岛 266071;
4. 山东省青岛第五十八中学, 青岛 266100
收稿日期: 2020-07-24; 修回日期: 2020-10-26; 录用日期: 2020-10-26
基金项目: 国家重点研发计划(No.2018YFC0406304);山东省重点研发计划(No.2019JZZY020302)
作者简介: 尹诗琪(1996—), 女, E-mail: 834542214@qq.com
通讯作者(责任作者): 李锋民, E-mail: lifengmin@ouc.edu.cn
摘要:微塑料(< 5 mm)是一种备受关注的新兴污染物.目前微塑料在山东近岸的分布规律和影响因素尚不明确.本文选取青岛市红岛水产养殖区海域、李村河口附近海域、团岛污水处理厂海域、麦岛沙滩附近海域的表层海水和潮滩沉积物为研究对象,通过现场采样、密度浮选分离、显微镜观察、傅里叶红外测定等方法,揭示青岛近岸表层海水和潮滩沉积物中微塑料的分布规律及其影响因素.结果表明,4个区域表层海水中微塑料丰度从小到大为麦岛(1439个·m-3) < 李村河口(7209个·m-3) < 团岛(12785个·m-3) < 红岛(16869个·m-3),潮滩沉积物中微塑料的丰度从小到大为麦岛(1517个·m-2) < 团岛(1794个·m-2) < 红岛(2244个·m-2) < 李村河口(2789个·m-2).分析表明,青岛近岸小粒径微塑料(< 1 mm)的含量最多;白色是青岛近岸微塑料的主要颜色;纤维在海水和潮滩沉积物中的含量最高,分别占海水和沉积物中微塑料的62.76%和59.92%;表层海水中聚对苯二甲酸乙二醇酯类塑料的比例最大,主要来自于海洋渔业和海洋运输业,潮滩沉积物中聚丙烯的比例最大,主要来自水产养殖业和旅游业.不同采样区域的主要人类活动的种类和强度不同,影响了微塑料的丰度和种类;不同环境介质(海水、潮滩沉积物)的自然条件不同(紫外线照射时间和强度、风化作用等),影响了微塑料的颜色、粒径、形状和分布规律.
关键词:微塑料分布特征近岸环境沉积物人类活动
The distribution of microplastics and their influence factors in surface seawater and tidal flat sediments in Qingdao coast
YIN Shiqi1,2,3
 , JIA Fangli1,2,3, LIU Xiaoyin4, LI Fengmin1,2,3

1. Institute of Coastal Environmental Pollution Control, College of Environmental Science and Engineering, Ocean University of China, Qingdao 266100;
2. Key Laboratory of Marine Environment and Ecology, Ministry of Education, Ocean University of China, Qingdao 266100;
3. Marine Ecology and Environmental Science Laboratory, Pilot National Laboratory for Marine Science and Technology (Qingdao), Qingdao 266071;
4. Qingdao No. 58 High School Shandong Province, Qingdao 266100
Received 24 July 2020; received in revised from 26 October 2020; accepted 26 October 2020
Abstract: Microplastics (< 5 mm), a type of emerging contaminants, have attracted global concern. However, the spatial distribution of microplastics in the coastal regions of Shandong is not well understood, as well as its influencing factors. Thus seawater, sediments in four sites in Qingdao, i.e., Hongdao aquaculture, Licun River estuary, Tuandao sewage treatment plant, and Maidao Beach, were collected for the qualitative and quantitative analysis of microplastics. Several methods including in-situ sampling, density separation, microscope observation, and Fourier transform infrared (FTIR) were applied. The results showed that the abundance of microplastics in the surface seawater presented an order of Maidao (1439 n·m-3) < Licunhekou (7209 n·m-3) < Tuandao (12785 n·m-3) < Hongdao (16869 n·m-3), and the abundance of microplastics in the sediments showed an order of Maidao (1517 n·m-2) < Tuandao (1794 n·m-2) < Hongdao (2244 n·m-2) < Licunhekou (2789 n·m-2). Furthermore, microplastics with a diameter smaller than 1 mm were dominant, and the majority of microplastics was in the white color. The fiber was dominant type of microplastics in the seawater and sediments, accounting for 62.76% and 59.92%, respectively. The main type of microplastics in the surface seawater was polyethylene terephthalate, which was mainly derived from marine fisheries and marine transportation. The main type of microplastics in the tidal flat sediments was polypropylene, which was mainly resulted from aquaculture and tourism. All these results suggested that the types and intensities of human activities largely affected the microplastics pollution in a coastal environment. In addition, natural conditions (e.g., intensity, duration time of ultraviolet radiation, weathering) in different environmental media (e.g., seawater, tidal flat sediment) in different regions could also affect the distribution patterns of microplastics in a coastal environment.
Keywords: microplasticsdistributioncoastal environmentsedimenthuman activity
1 引言(Introduction)塑料作为一种轻质耐用、抗腐蚀、理化性质稳定的合成有机聚合物(Laist, 1987), 广泛应用于工业生产、农业、包装业等领域.据统计, 近40年来, 塑料碎片在海水和沉积物中的积累显著增加(Thompson et al., 2005), 约占海洋污染物的60%~80%(Eriksen et al., 2013).进入海洋环境中的塑料可以在波浪、光降解、水解、热解、生物降解等作用下碎片化(Andrady, 2011), 形成粒径小于5 mm的“微塑料”.研究表明, 全球微塑料的总产量从1950年的170万吨增加到2018年的约3.59亿吨, 其中约10%的微塑料进入海洋环境中(Kaposi et al., 2014), 因此海洋环境被认为是微塑料在自然环境中的一个巨大的“汇”.
微塑料粒径小, 易被海洋生物误食.目前已经在多种海洋生物, 包括贻贝(Li et al., 2018)、鱼类(Zhang et al., 2019)、海洋浮游生物(Botterell et al., 2019)和海鸟(Holland et al., 2016)体内发现微塑料, 微塑料会造成海洋生物肠道缠绕(Boerger et al., 2010)、虚假饱腹感(Neves et al., 2015)甚至造成生物死亡.此外, 微塑料的比表面积大, 可以作为有机污染物的载体(Dris et al., 2015)吸附并富集有毒物质(Browne et al., 2008;Wang et al., 2020)后释放到环境中, 危害海洋生态环境.
微塑料因其对海洋生态环境的潜在危害性, 引发了越来越多的关注.微塑料可以在风力、洋流等外力作用下, 从河流等淡水系统(Dris et al., 2015;Xiong et al., 2018)汇入沿海地区(Browne et al., 2008)迁徙到开阔海域(Thompson et al., 2009)甚至是深海(Woodall et al., 2014), 从而在海洋环境中积累.研究表明, 中国江西省饶河-鄱阳湖入湖段(龙口)典型湿地表层中底泥沉积物的丰度为938个·kg-1(简敏菲等, 2018);韩国第一长河洛东江上游微塑料的含量为(293±83) 个·m-3, 下游为(4760±5242) 个·m-3, 沉积物中为(1970±62) 个·kg-1(Eo et al., 2019);美国加利福尼亚州海水中微塑料的含量为36.59个·L-1, 沉积物中微塑料的含量为(0.227±0.13) 个·g-1(Saley et al., 2019);中国珠江口微塑料的平均丰度为8902个·m-3(Yan et al., 2019);中国长江口的微塑料密度为(4137.3±2461.5) 个·m-2, 东海的微塑料密度为(0.167± 0.138) 个·m-2(Zhao et al., 2014);中国东南沿海不同红树林沉积物中微塑料的丰度范围为8.3~5738.3个·kg-1(Zhou et al., 2020), 不同采样点微塑料的数量差异较大.研究表明, 微塑料在同一区域不同环境介质, 如河流、湖泊、海水、沉积物中的含量存在较大的差异, 且沿海不同区域微塑料的丰度差异很大, 主要受人类活动等因素的影响(Barnes et al., 1998;Zhou et al., 2020).为探究青岛近岸的微塑料是否存在相似的分布规律, 本文研究了沿岸不同区域的的微塑料的分布规律和同一区域不同环境介质(海水、沉积物)微塑料分布规律, 讨论了影响微塑料分布的影响因素.
青岛市位于山东半岛东南部, 海岸线类型多样, 是国家沿海重要中心城市.2018年青岛市GDP总量超万亿.青岛市重点发展海洋经济, 沿海岸线的不同功能的区域(水产养殖区、海滨浴场、河口区域、污水处理厂), 人类活动强度高, 是微塑料与人类直接接触的场所之一.目前对于青岛不同区域微塑料的分布及其影响因素, 尤其是探究微塑料分布与人类活动之间的关系的研究较少, 因此, 选择不同土地利用方式的沿海区域, 为探究青岛近岸微塑料分布与环境介质和人类活动的关系提供科学依据.
2 材料与方法(Materials and methods)2.1 研究区域本文选择山东半岛东南部沿海城市青岛为研究区域, 沿海岸线采集了不同功能区域的潮滩沉积物样品和表层海水样品.采样点是根据人类高强度活动和不同的土地利用方式选择的红岛水产养殖区、李村河入海口、团岛污水处理厂、麦岛沙滩.如图 1所示, 采样点均属于人类社会经济活动较为活跃的区域.
图 1(Fig. 1)
 |
| 图 1 青岛近岸采样点 Fig. 1Sampling site near Qingdao |
2.2 采样方法海水样品采用带有刻度的不锈钢水桶采集, 记录采集的海水体积, 选择50 μm的浮游生物网过滤样品, 用过滤海水将海水样品冲入1000 mL的棕色样品瓶中保存.潮滩表层沉积物的采集选择低潮水位时段的潮间带区域, 用不锈钢采样铲采集20 cm×20 cm×5 cm的长方体, 用铝箔纸包裹好放入密封袋保存.
2.3 微塑料的分离将采集的沉积物样品, 放置室温下晾干, 过筛后称取100 g样品, 采用NaCl溶液密度浮选法进行预处理(Mathalon et al., 2014;Cluzard et al., 2015), 每24 h取一次上清液, 共浮选3~5次.
将海水样品与浮选后的沉积物样品用真空抽滤器(5 μm的混合纤维膜)抽滤, 使用芬顿试剂将膜上的固体进行消解.在60 ℃的条件下加热72 h, 消除样品中的有机质.消解后的溶液加入NaCl溶液, 再进行一次密度浮选, 然后使用真空抽滤器过滤膜, 放置于玻璃平板中保存.
2.4 微塑料的计数与特征分析使用生物显微镜(DM2500, 德国徕卡公司)对微塑料进行观察(图 2), 记录其数量、形状、粒径、颜色.先用荧光光源进行观察, 再用普通光源补充观察, 因为单纯用荧光光源观察会遗漏掉荧光较弱的透明塑料以及没有荧光的深色塑料.所以使用尼罗红试剂对样品进行染色(Shim et al., 2016), 然后同一视野下切换普通光源进行补充观察.
图 2(Fig. 2)
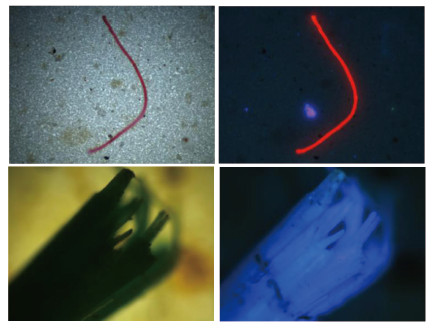 |
| 图 2 普通光学显微镜和荧光显微镜下的微塑料 (左为普通显微镜, 右为荧光显微镜) Fig. 2The observation of microplastics under the ordinary microscope and fluorescence microscope |
本文优化了对微塑料的识别标准(图 2):①塑料颜色均匀且清晰;②塑料特征不明显的透明和白色碎片在显微镜下进一步观察;③通常具有荧光, 且荧光均匀.
2.5 微塑料的成分鉴定微塑料的定性测定采用衰减全反射傅里叶变换红外光谱仪(L1600401, Spectrum, UK)对微塑料样品进行成分鉴定, 扫描次数为4, 波长范围为400~4000 cm-1.获得的光谱图与标准数据库进行比较, 以确定微塑料的聚合物类型(Peng et al., 2017).与标准数据库匹配度超过80%时, 才可以确定微塑料的类型(Lin et al., 2018).
2.6 微塑料的表面形貌特征选择了青岛近岸表层海水和潮滩沉积物中含量较高的4种微塑料(PET碎片、PET纤维、PP纤维和PS颗粒), 使用扫描电镜(SEM, JSM-6390LV, JEOL, Japan)观察微塑料的表面形貌特征, 并与购买的标准样品(PE塑料绳、PS泡沫箱、PET包装袋和PP编织绳)进行对比.
2.7 微塑料分离与计数方法的优化2.7.1 水中微塑料回收率实验将定量的微塑料(聚乙烯PE、聚丙烯PP、聚对苯二甲酸乙二醇酯PET、通用级聚苯乙稀GPPS)加入到3种微藻培养液(短裸假藻、中肋骨条藻、斜生栅藻), 以模拟水生环境, 降低实验误差.然后加入芬顿试剂进行消解, 消解后加入NaCl溶液进行密度浮选, 24 h后提取上清液, 重复3~5次, 溶液用真空抽滤器进行抽滤, 使用荧光显微镜和光学显微镜观察并记录.设置3个平行样以及1个不加微塑料的空白对照样品.
2.7.2 沉积物中微塑料回收率实验先将沉积物样品用NaCl溶液进行密度浮选, 直至无漂浮物, 在烧杯中加入定量的微塑料(聚乙烯PE、聚丙烯PP、聚对苯二甲酸乙二醇酯PET、通用级聚苯乙稀GPPS), 处理观察方法与2.7.1节相同.
2.8 数据分析采用EXCEL 2016和Origin 2018进行数据统计和绘图, 站位图用Photoshop 13.0和Arcgis 10.2绘制.
3 结果与讨论(Results and discussion)3.1 微塑料预处理方法的优化为建立海水及沉积物中微塑料高效分离、计数方法, 以5种不同粒径范围、不同形状的微塑料为目标物质, 以回收率为指标, 检验并优化微塑料预处理方法, 确立采用密度浮选法进行微塑料的分离.
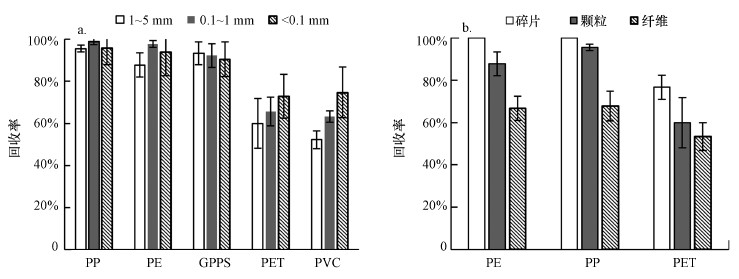
3.1.1 不同密度、形状和粒径的微塑料的回收率选择了5种不同密度的微塑料颗粒(PE、GPPS、PP、PET、PVC), 密度为0.91 ~1.43 g·cm-3(PP < PE < GPPS < PET≈PVC), 水中各粒径范围内的微塑料颗粒的回收率为60%~98.89%, 沉积物中各粒径范围内的微塑料颗粒的回收率为52.22%~100%, 随着微塑料颗粒密度的增大, 同一粒径范围内的微塑料的回收率呈降低趋势.以不同密度的微塑料在沉积物中的回收率为例, 如图 3a所示, 同一粒径范围的微塑料在沉积物中的回收率随着密度的升高, 总体呈降低的趋势.
图 3(Fig. 3)
 |
| 图 3 沉积物中不同密度(a)及不同形状(b)的微塑料的回收率 Fig. 3Recovery rates of microplastics with (a) different densities (b) different shapes in sediments |
分别选择碎片、颗粒、纤维3种形状的微塑料.其中, 与同种类其他形状的微塑料相比, 碎片型微塑料的回收率更高.以沉积物中1~5 mm粒径范围的不同形状的微塑料的回收率为例, 如图 3b所示, 碎片微塑料的回收率更高, 可能是因为一些碎片微塑料包括泡沫碎片和厚度较小的薄膜状碎片, 浮力大, 更容易悬浮在水中(Wang et al., 2018;Yuan et al., 2019).
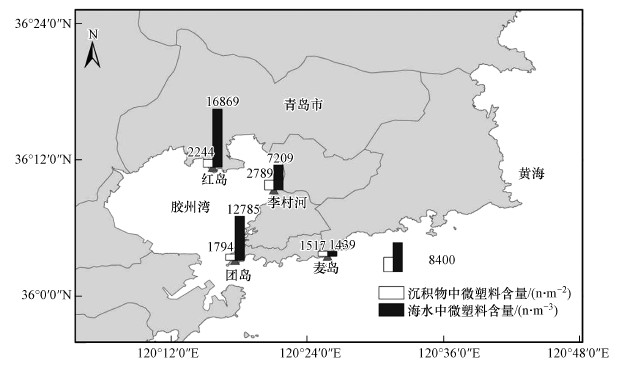
3.2 青岛近岸微塑料的空间分布青岛环胶州湾海域近岸4个采样点微塑料的丰度如图 4所示.总体上微塑料在青岛近岸表层海水中的数量分布差异大, 丰度从小到大为麦岛(1439个·m-3) < 李村河(7209个·m-3) < 团岛(12785个·m-3) < 红岛(16869个·m-3).微塑料在表层海水中的分布与海水的水动力学有关.红岛、李村河和团岛3个采样站点位于胶州湾湾内区域.根据胶州湾潮流场模型推算, 胶州湾湾口处流速最大, 湾内流速最小(王翠等, 2008;刘鑫仓等, 2019), 从而导致微塑料在湾内停留时间较长, 湾内区域相对于湾外区域微塑料含量高.湾内3个区域的微塑料含量也存在较大差异, 可能是不同区域的功能不同导致人类活动的强度不同, 所以即使地理位置相近的区域微塑料的含量差异仍旧较大.
图 4(Fig. 4)
 |
| 图 4 表层海水和潮滩沉积物中微塑料的丰度 Fig. 4Abundance of microplastics in surface seawater and tidal flat sediments |
总体上微塑料在青岛潮滩表层沉积物中的数量分布较为均匀, 丰度从小到大为麦岛(1517个·m-2) < 团岛(1794个·m-2) < 红岛(2244个·m-2) < 李村河(2789个·m-2), 与表层海水中微塑料丰度的相对大小关系并不一致.潮滩表层沉积物中微塑料含量最高的地区为李村河, 而李村河附近表层海水中微塑料的含量相对较小, 这可能是因为采样点为李村河河口, 河岸沉积物会拦截一部分微塑料, 导致微塑料的沉积(Cole et al., 2011), 即河流区域中的微塑料并没有完全被输送到海水中去(Xiong et al., 2019).除李村河河口外, 红岛养殖区表层潮滩沉积物中微塑料的含量也相对较大, 这可能与胶州湾的沉积动力学有关.红岛潮滩位于胶州湾北部是一个典型的弱动力潮滩, 同时红岛也是青岛有名的水产养殖区, 人类养殖活动的微塑料会更多的被保存在潮滩沉积物中(杨世伦等, 2006).
3.3 青岛近岸微塑料的粒径和颜色分布研究表明, 微塑料对生物的危害存在尺寸效应(Lee et al., 2013;Jeong et al., 2016), 即微塑料的粒径大小可以反映微塑料对生物的危害作用.小粒径微塑料对海洋生物群落有更大的潜在影响.海洋生物对微塑料的摄食行为也受微塑料尺寸的影响, 粒径小的微塑料更容易被海洋生物摄食和吸收(Wright et al., 2013).
本文根据微塑料的粒径大小, 将其分为50~100 μm、100~500 μm、500~1000 μm、1~5 mm 4个范围.由图 5a可知, 青岛近岸表层海水和潮滩沉积物中小粒径微塑料(< 1 mm)的含量最大, 占总量的69%~95%.此外, 微塑料在海水和沉积物中的粒径分布存在差异, 潮滩沉积物中100~500 μm的微塑料占比(42.14%)高于表层海水(24.96%), 表层海水中1~5 mm的微塑料(25.04%)占比高于潮滩沉积物(12.32%).因为沉积物中的微塑料会在沙粒之间相互碰撞和沙粒机械磨损的作用下发生破裂, 裂解成为粒径更小的微塑料;小粒径的微塑料(< 100 μm)由于比表面积大, 难以在沉积物中长期存在(Zhang et al., 2015), 所以沉积物中微塑料的尺寸分布主要集中在中、小尺寸.近岸表层海水中纤维型微塑料占微塑料总量的62.76%, 纤维型微塑料主要来自于钓鱼线、衣服纤维、渔网等的碎裂, 尺寸一般大于500 μm, 甚至大于5 mm(Doyle et al., 2011;Zhang et al., 2015), 所以海水中1~5 mm的微塑料的含量相对较高.
图 5(Fig. 5)
 |
| 图 5 表层海水和潮滩沉积物中微塑料的(a)粒径分布和(b)颜色分布 Fig. 5Particle size(a) and color of microplastics(b) in surface seawater and tidal flat sediments |
微塑料的颜色会影响生物对微塑料的摄食行为.海洋生物容易摄食与食物颜色相似的微塑料(Boerger et al., 2010;Clunies-Ross et al., 2016), 如一些鱼类主要摄食白色微塑料(Wright et al., 2013).此外, 海洋生物作为捕猎者对微塑料的摄食符合Thayer定律, 当生物位于塑料的下方感知塑料时, 会优先摄食深色的塑料碎片, 位于微塑料的上方时则优先摄食浅色塑料碎片, 例如海鸟优先摄食浅色塑料碎片(Santos et al., 2016).彩色微塑料的表面可能会含有更多的有害元素, 如红色或者黄色微塑料表面多含有镉和铅两种重金属元素(Massos et al., 2017), 产生更大的毒性.彩色微塑料一般来源于日常生活中经常使用的有色塑料制品(Di et al., 2018).
本文检出的微塑料按照颜色可以分为白色、透明、黑色和彩色, 由图 5b可知, 微塑料在不同环境介质中的颜色分布存在差异, 表层海水中白色和透明微塑料的占比比潮滩沉积物的低, 这与Wong等(2020)在研究台湾北部的淡水河及其支流的微塑料时得到的结论一致, 即沙滩上透明和白色的微塑料更多, 这可能是因为沙滩上的微塑料长时间暴露在紫外光和风化作用下, 导致褪色现象更严重.
3.4 青岛近岸微塑料的化学组成和形状通过傅里叶红外鉴定了样品的聚合物类型(图 6), 青岛近岸海水和潮滩沉积物中共检测出7种微塑料类型, 分别是聚乙烯(PE)、聚丙烯(PP)、聚对苯二甲酸乙二醇酯(PET)、聚苯乙烯(PS)、聚酰胺(PA)、聚丙烯腈(PAN)和聚氨酯(PU).表层海水和潮滩沉积物中微塑料的检出率分别为87%和88.75%.其中, 表层海水中聚对苯二甲酸乙二醇酯(PET)微塑料占微塑料总数的32.08%, 是表层海水中主要的微塑料类型;潮滩沉积物中聚丙烯(PP)微塑料占微塑料总数的28.2%, 是潮滩沉积物中主要的微塑料类型.
图 6(Fig. 6)
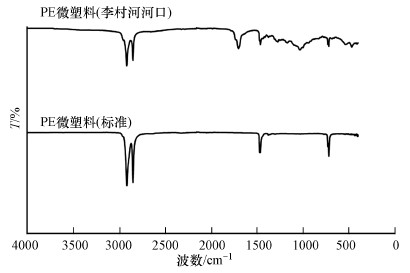 |
| 图 6 标准微塑料与自然环境中采集的微塑料的傅里叶红外光谱图 Fig. 6FTIR spectra of collected microplastics compared with virgin plastics |
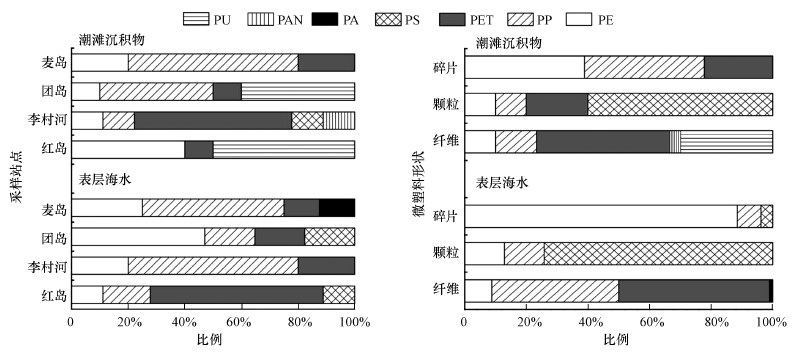
根据检出的微塑料的形状和特征, 微塑料可以分为碎片、颗粒和纤维3种类型, 青岛近岸表层海水和潮滩沉积物中微塑料的主要形状为纤维, 微塑料纤维分别占海水和沉积物中微塑料的62.76%和59.92%.根据Wang等(2019)建立的微塑料来源分类系统和与购买的标准品进行成分和外观对比的方法对青岛近岸表层海水和潮滩沉积物中检出的微塑料进行源分析.
由图 7可知, 微塑料纤维的主要成分是PET和PP, PET主要用作包装材料和纺织品(Weber et al., 2018), 属于纺织品合成纤维的代表成分, 所以海水和沉积物中的PET纤维可能来自于衣服纤维(Wang et al., 2019).除衣服纤维之外, 渔业活动中使用的渔网和绳索也会产生微塑料纤维, PP、PE常被用作塑料绳、渔网等(Wang et al., 2017), 是构成渔网、钓鱼线等渔业用具的主要材料(Wang et al., 2019).将本文检出的PP纤维和PE纤维分别与购买的塑料绳和编织绳的扫描电镜表征图和傅里叶红外进行对比, 发现成分相同, 外观相似, 因此青岛近岸海水中和沉积物中的PP纤维和PE纤维可能来自于钓鱼线、渔网等海洋渔业、水产养殖业用品.
图 7(Fig. 7)
 |
| 图 7 表层海水和潮滩沉积物中微塑料的化学组成和形状 Fig. 7The shape and chemical composition of microplastics in surface seawater and tidal flat sediments |
由图 7可知, 微塑料碎片的主要类型是PP、PE和PET, 可以分为硬质塑料碎片和软质薄膜塑料碎片两种形貌特征, 主要硬质塑料碎片可能来自于外卖的塑料餐具和餐盒、丢弃的塑料玩具、塑料瓶等, 软质塑料薄膜是一类容易识别的塑料产品, 可能来自于食品包装袋、塑料编织袋、覆盖农田的地膜等(Wang et al., 2019), 将本文检出的PET软质薄膜碎片与购买的包装袋的扫描电镜表征图和傅里叶红外对比, 发现成分相同、外观相似, 所以青岛近岸的微塑料碎片可能来自于旅游业、包装业和农业.
由图 7可知, 微塑料颗粒的主要类型是PS, 主要具有白色塑料泡沫和白色或半透明的硬质塑料颗粒两种不同的形貌特征, 白色泡沫塑料颗粒是一种危险的微塑料, 可能来自于塑料泡沫盒、发泡塑料浮标等, 常用于包装业和渔业(Wang et al., 2019), 将本文检出的PS颗粒与购买的泡沫塑料箱的扫描电镜表征图和傅里叶红外图进行对比, 发现成分相同、外观相似.硬质塑料颗粒主要来自于个人护理品(Wang et al., 2019), 所以青岛近岸的微塑料颗粒主要来自于旅游业、海洋渔业.这些微塑料的来源均与人类在沿海潮滩的活动和海洋活动有关.
4 结论(Conclusions)在青岛近岸表层海水和潮滩沉积物中发现了50 μm~5 mm粒径范围的碎片、颗粒、纤维状微塑料.表层海水中微塑料的丰度变化很大, 胶州湾湾内区域表层海水中微塑料的丰度大, 胶州湾湾外区域麦岛表层海水中的微塑料为1439个·m-3远少于胶州湾湾内区域, 胶州湾湾内区域由于人类活动的影响, 丰度由小到大分别为李村河(7209个·m-3) < 团岛(12785个·m-3) < 红岛(16869个·m-3);潮滩沉积物中人类活动密集场所的潮滩沉积物中微塑料的丰度大, 总体来说分布较为均匀, 丰度从小到大为麦岛(1517个·m-2) < 团岛(1794个·m-2) < 红岛(2244个·m-2) < 李村河(2789个·m-2).青岛近岸海域微塑料数量上以小粒径微塑料(< 1 mm)为主, 主要是纤维状微塑料, 青岛表层海水中微塑料的主要种类是聚对苯二甲酸乙二醇酯(32.08%);潮滩沉积物中聚丙烯(PP)微塑料含量占比最大(28.2%).
参考文献
| Andrady A L. 2011. Microplastics in the marine environment[J]. Marine pollution bulletin, 62(8): 1596-1605. DOI:10.1016/j.marpolbul.2011.05.030 |
| Barnes D K A, Francois G, Thompson R C, et al. 2009. Accumulation and fragmentation of plastic debris in global environments[J]. Philos Trans R Soc Lond B Biol Sci, 364(1526): 1985-1998. DOI:10.1098/rstb.2008.0205 |
| Bessa F, Barría P, Neto J M, et al. 2018. Occurrence of microplastics in commercial fish from a natural estuarine environment[J]. Marine Pollution Bulletin, 128: 575-584. DOI:10.1016/j.marpolbul.2018.01.044 |
| Boerger C M, Lattin G L, Moore S L, et al. 2010. Plastic ingestion by planktivorous fishes in the North Pacific Central Gyre[J]. Marine Pollution Bulletin, 60(12): 2275-2278. DOI:10.1016/j.marpolbul.2010.08.007 |
| Botterell Z L R, Beaumont N, Dorrington T, et al. 2019. Bioavailability and effects of microplastics on marine zooplankton: A review[J]. Environmental Pollution, 245: 98-110. DOI:10.1016/j.envpol.2018.10.065 |
| Browne M A, Dissanayake A, Galloway T S, et al. 2008. Ingested microscopic plastic translocates to the circulatory system of the mussel, Mytilus edulis (L.)[J]. Environmental Science & Technology, 42(13): 5026-5031. |
| Clunies-Ross P J, Smith G P S, Gordon K C, et al. 2016. Synthetic shorelines in New Zealand? Quantification and characterisation of microplastic pollution on Canterbury's coastlines[J]. New Zealand Journal of Marine and Freshwater Research, 50(2): 317-325. DOI:10.1080/00288330.2015.1132747 |
| Cluzard M, Kazmiruk T N, Kazmiruk V D, et al. 2015. Intertidal concentrations of microplastics and their influence on ammonium cycling as related to the shellfish industry[J]. Archives of Environmental Contamination and Toxicology, 69(3): 310-319. DOI:10.1007/s00244-015-0156-5 |
| Cole M, Lindeque P, Halsband C, et al. 2011. Microplastics as contaminants in the marine environment: A review[J]. Marine Pollution Bulletin, 62(12): 2588-2597. DOI:10.1016/j.marpolbul.2011.09.025 |
| Di M, Wang J. 2018. Microplastics in surface waters and sediments of the Three Gorges Reservoir, China[J]. Science of the Total Environment, 616: 1620-1627. |
| Doyle M J, Watson W, Bowlin N M, et al. 2011. Plastic particles in coastal pelagic ecosystems of the Northeast Pacific ocean[J]. Marine Environmental Research, 71(1): 41-52. DOI:10.1016/j.marenvres.2010.10.001 |
| Dris R, Imhof H, Sanchez W, et al. 2015. Beyond the ocean: contamination of freshwater ecosystems with (micro-) plastic particles[J]. Environmental Chemistry, 12(5): 539-550. DOI:10.1071/EN14172 |
| Eo S, Hong S H, Song Y K, et al. 2019. Spatiotemporal distribution and annual load of microplastics in the Nakdong River, South Korea[J]. Water Research, 160: 228-237. DOI:10.1016/j.watres.2019.05.053 |
| Eriksen M, Mason S, Wilson S, et al. 2013. Microplastic pollution in the surface waters of the Laurentian Great Lakes[J]. Marine Pollution Bulletin, 77(1/2): 177-182. |
| Holland E R, Mallory M L, Shutler D. 2016. Plastics and other anthropogenic debris in freshwater birds from Canada[J]. Science of the Total Environment, 571: 251-258. DOI:10.1016/j.scitotenv.2016.07.158 |
| Jeong C B, Won E J, Kang H M, et al. 2016. Microplastic size-dependent toxicity, oxidative stress induction, and p-JNK and p-p38 activation in the monogonont rotifer (Brachionus koreanus)[J]. Environmental Science & Technology, 50(16): 8849-8857. |
| 简敏菲, 周隆胤, 余厚平, 等. 2018. 鄱阳湖-饶河入湖段湿地底泥中微塑料的分离及其表面形貌特征[J]. 环境科学学报, 38(2): 579-586. |
| Kaposi K L, Mos B, Kelaher B P, et al. 2014. Ingestion of microplastic has limited impact on a marine larva[J]. Environmental Science & Technology, 48(3): 1638-1645. |
| Laist D W. 1987. Overview of the biological effects of lost and discarded plastic debris in the marine environment[J]. Marine Pollution Bulletin, 18(6): 319-326. DOI:10.1016/S0025-326X(87)80019-X |
| Lee K W, Shim W J, Kwon O Y, et al. 2013. Size-dependent effects of micro polystyrene particles in the marine copepod Tigriopus japonicus[J]. Environmental Science & Technology, 47(19): 11278-11283. |
| Li J, Green C, Reynolds A, et al. 2018. Microplastics in mussels sampled from coastal waters and supermarkets in the United Kingdom[J]. Environmental Pollution, 241: 35-44. DOI:10.1016/j.envpol.2018.05.038 |
| Lin L, Zuo L Z, Peng J P, et al. 2018. Occurrence and distribution of microplastics in an urban river: a case study in the Pearl River along Guangzhou City, China[J]. Science of the Total Environment, 644: 375-381. DOI:10.1016/j.scitotenv.2018.06.327 |
| 刘鑫仓, 刘艳玲, 迟万清, 等. 2019. 胶州湾潮余流和物质输送之间的关系[J]. 海洋湖沼通报, (2): 10-17. |
| Massos A, Turner A, Cadmium. 2017. lead and bromine in beached microplastics[J]. Environmental Pollution, 227: 139-145. DOI:10.1016/j.envpol.2017.04.034 |
| Mathalon A, Hill P. 2014. Microplastic fibers in the intertidal ecosystem surrounding Halifax Harbor, Nova Scotia[J]. Marine Pollution Bulletin, 81(1): 69-79. DOI:10.1016/j.marpolbul.2014.02.018 |
| Neves D, Sobral P, Ferreira J L, et al. 2015. Ingestion of microplastics by commercial fish off the Portuguese coast[J]. Marine Pollution Bulletin, 101(1): 119-126. DOI:10.1016/j.marpolbul.2015.11.008 |
| Peng G, Zhu B, Yang D, et al. 2017. Microplastics in sediments of the Changjiang Estuary, China[J]. Environmental Pollution, 225: 283-290. DOI:10.1016/j.envpol.2016.12.064 |
| Saley A M, Smart A C, Bezerra M F, et al. 2019. Microplastic accumulation and biomagnification in a coastal marine reserve situated in a sparsely populated area[J]. Marine Pollution Bulletin, 146: 54-59. DOI:10.1016/j.marpolbul.2019.05.065 |
| Santos R G, Andrades R, Fardim L M, et al. 2016. Marine debris ingestion and Thayer's law-The importance of plastic color[J]. Environmental Pollution, 214: 585-588. DOI:10.1016/j.envpol.2016.04.024 |
| Shim W J, Song Y K, Hong S H, et al. 2016. Identification and quantification of microplastics using Nile Red staining[J]. Marine Pollution Bulletin, 113(1/2): 469-476. |
| Thompson R, Moore C, Andrady A, et al. 2005. New directions in plastic debris[J]. Science, 310(5751): 1117-1117. |
| Thompson R C, Moore C J, Vom Saal F S, et al. 2009. Plastics, the environment and human health: current consensus and future trends[J]. Philosophical Transactions of the Royal Society B: Biological Sciences, 364(1526): 2153-2166. DOI:10.1098/rstb.2009.0053 |
| Wang S, Xue N, Li W, et al. 2020. Selectively enrichment of antibiotics and ARGs by microplastics in river, estuary and marine waters[J]. Science of the Total Environment, 708: 134594. DOI:10.1016/j.scitotenv.2019.134594 |
| Wang T, Zou X, Li B, et al. 2019. Preliminary study of the source apportionment and diversity of microplastics: taking floating microplastics in the South China Sea as an example[J]. Environmental Pollution, 245: 965-974. DOI:10.1016/j.envpol.2018.10.110 |
| Wang W, Ndungu A W, Li Z, et al. 2017. Microplastics pollution in inland freshwaters of China: A case study in urban surface waters of Wuhan, China[J]. Science of the Total Environment, 575: 1369-1374. DOI:10.1016/j.scitotenv.2016.09.213 |
| Wang Z, Su B, Xu X, et al. 2018. Preferential accumulation of small (< 300 μm) microplastics in the sediments of a coastal plain river network in eastern China[J]. Water Research, 144: 393-401. DOI:10.1016/j.watres.2018.07.050 |
| Wong G, L wemark L, Kunz A. 2020. Microplastic pollution of the Tamsui River and its tributaries in northern Taiwan: Spatial heterogeneity and correlation with precipitation[J]. Environmental Pollution, 260: 113935. DOI:10.1016/j.envpol.2020.113935 |
| 王翠, 孙英兰, 张学庆. 2008. 基于EFDC模型的胶州湾三维潮流数值模拟[J]. 中国海洋大学学报(自然科学版), 38(5): 833-840. |
| Weber A, Scherer C, Brennholt N, et al. 2018. PET microplastics do not negatively affect the survival, development, metabolism and feeding activity of the freshwater invertebrate Gammarus pulex[J]. Environmental Pollution, 234: 181-189. DOI:10.1016/j.envpol.2017.11.014 |
| Woodall L C, Sanchez-Vidal A, Canals M, et al. 2014. The deep sea is a major sink for microplastic debris[J]. Royal Society Open Science, 1(4): 2-8. |
| Wright S L, Thompson R C, Galloway T S. 2013. The physical impacts of microplastics on marine organisms: a review[J]. Environmental Pollution, 178: 483-492. DOI:10.1016/j.envpol.2013.02.031 |
| Xiong X, Wu C, Elser J J, et al. 2019. Occurrence and fate of microplastic debris in middle and lower reaches of the Yangtze River-from inland to the sea[J]. Science of the Total Environment, 659: 66-73. DOI:10.1016/j.scitotenv.2018.12.313 |
| Xiong X, Zhang K, Chen X, et al. 2018. Sources and distribution of microplastics in China's largest inland lake-Qinghai Lake[J]. Environmental Pollution, 235: 899-906. DOI:10.1016/j.envpol.2017.12.081 |
| 杨世伦, 李鹏, 郜昂, 等. 2006. 基于ADP-XR和OBS-3A的潮滩水文泥沙过程研究-以胶州湾北部红岛潮滩为例[J]. 海洋学报(中文版), 5: 56-63. |
| Yan M, Nie H, Xu K, et al. 2019. Microplastic abundance, distribution and composition in the Pearl River along Guangzhou city and Pearl River estuary, China[J]. Chemosphere, 217: 879-886. DOI:10.1016/j.chemosphere.2018.11.093 |
| Yuan W, Liu X, Wang W, et al. 2019. Microplastic abundance, distribution and composition in water, sediments, and wild fish from Poyang Lake, China[J]. Ecotoxicology and Environmental Safety, 170: 180-187. DOI:10.1016/j.ecoenv.2018.11.126 |
| Zhang F, Wang X, Xu J, et al. 2019. Food-web transfer of microplastics between wild caught fish and crustaceans in East China Sea[J]. Marine Pollution Bulletin, 146: 173-182. DOI:10.1016/j.marpolbul.2019.05.061 |
| Zhang K, Gong W, Lv J, et al. 2015. Accumulation of floating microplastics behind the Three Gorges Dam[J]. Environmental Pollution, 204: 117-123. DOI:10.1016/j.envpol.2015.04.023 |
| Zhao S, Zhu L, Wang T, et al. 2014. Suspended microplastics in the surface water of the Yangtze Estuary System, China: first observations on occurrence, distribution[J]. Marine Pollution Bulletin, 86(1/2): 562-568. |
| Zhou Q, Tu C, Fu C, et al. 2020. Characteristics and distribution of microplastics in the coastal mangrove sediments of China[J]. Science of the Total Environment, 703: 134807. DOI:10.1016/j.scitotenv.2019.134807 |
