 ,Department of Physics, Naragh Branch,
 Received:2020-11-16Revised:2021-04-18Accepted:2021-04-29Online:2021-06-01

Abstract
Keywords:
PDF (852KB)MetadataMetricsRelated articlesExportEndNote|Ris|BibtexFavorite
Cite this article
Payam Mehdipour Kaldiani. Deformation parameter changes in fission mass yields within the systematic statistical scission-point model. Communications in Theoretical Physics, 2021, 73(7): 075303- doi:10.1088/1572-9494/abfcb0
1. Introduction
Since the fission discovery, the experimental and theoretical fission mass yields have been continuously extended and updated [1–24]. At first, Fong [1] had presented the statistical model to obtain the fission fragment mass yields and then Wilkins [2] presented the scission point model as the most widely used theoretical model. With this model, Wilkins was able to explain the transitions between symmetric to asymmetric fission modes. These models have been developed in many branches, such as the Gaussian model [3–5] and the modified scission point models [7–12]. Recently, the time-dependent model has been significantly developed by Randrup [14–16] and some researchers [17–21] to evaluate the mass yields of pre-actinides and actinides. However, recent models have sophisticated computations, which indicate the need for a systematic method to more easily evaluate the mass yields of fission fragments.The mass yields of fissioning systems with mass numbers between 226 and 258 are asymmetric. With increasing the mass numbers of fissioning systems, the symmetric fission is favored (A > 258). The transition of mass yields from symmetric (asymmetric) to asymmetric (symmetric) occurs by increasing the mass number of thorium (fermium) isotopes. Although the statistical scission point model can predict transition from asymmetric to symmetric fission for heavy actinides [9], the calculated results are not accurate compared with experimental data. This problem is found where the calculated results were refined, as far as they smeared each calculated yield by the Gaussian with the width 1.5 amu to obtain a smoother curve.
The excitation energy (E) of the fissioning nucleus is often manipulated. Some researchers [7–10] have added the difference between the potential energy of fissioning nucleus and the potential energy of one of the complementary fragments at the scission point. Some others [11, 12] have added the energy of the excited compound nucleus (i.e. E* = Q + E where Q is the Q-values). Here, the height of the fission barrier is added to the excitation energy.
In this study, it is assumed that the collective temperature is independent from the fragment temperature calculated by the generalized superfluid model. The remaining two parameters, namely collective temperature and deformation parameters of fission fragments, are investigated by comparing calculated results and experimental data. At first, the deformation parameters of fission fragments are obtained for a collective temperature equal to 1 MeV. Then the collective temperature is changed (Tcoll = 2 MeV) to investigate the effect of this parameter on mass yields.
In the next section, the framework for calculation the mass yields is presented in a systematic method, which has least parameters and refinements. In section
2. Theoretical framework
The relative yield is usually calculated as the ratio between the probabilities of a given fragmentation over the sum of probabilities of all possible fragmentations as followsThe total potential energies at the scission point is defined as
The first term is the interaction energy between complementary fragments, VInterac = VCoul + Vprox. The individual energy includes macroscopic energy (VMac) plus shell correction energy and pairing energy as the microscopic energies (VMic), i.e. ${V}_{\mathrm{indiv}}={V}_{\mathrm{Mac},{i}}+{E}_{\mathrm{shell},{i}}+{E}_{\mathrm{pair},{i}}$. In the following sections, these energies are presented separately.
2.1. The interaction energy
The nuclear proximity potential (Vprox) is caculated by [25, 26]In equation (
The Coulomb energy is written as [4, 13]
2.2. The individual energies
The individual energies include macroscopic energy plus shell correction energy and pairing energy. The macroscopic energy is calculated in the framework of the FRLDM model from [28], and the spheroidally deformed is applied as [23]The pairing correction energy (Epair in MeV) is calculated as
The shell correction energy is calculated according to [29]. Our systematic method requires the shell correction energy values of fission fragments, which the recent reference has presented good approximate relations. Of course, the results of this method are agreed with the results of the Strutinsky model [30].
2.3. The temperature of fragments
The temperature-dependent relation for pairing energy is given by [31]The temperature dependence of shell energy is applied as [31]
The temperature (T) is calculated using the generalized superfluid model as
2.4. Discussion on method
Similar to [32, 33], the atomic numbers of the fission fragments are obtained by the unchanged charge-density distribution [34]The extremum values of energy at the scission point is usually used to find the atomic numbers of the fission fragments [36–39]. The exponential function is upward-sloping, so the minimum total energy at the scission point has the greatest effect in equation (
Here, βm,i are the value of the deformation parameter of each fragment associated with the minimum total energy at the scission point.
Also, according to [2], the distance of two fragments, s, is 1.44 fm. Using the pairing correction energy, the calculated results fluctuate sharply. Therefore, the pairing correction energy is not included in the calculations.
3. The mass yields of asymmetric fission
Pasha [10] added the fission barrier to the total potential energy of the fissioning system at the scission point. Also, he added the difference between the potential energy of the fissioning nucleus and the potential energy of one of the complementary fragments at the scission point to the excitation energy. Here, the excitation energy E is the energy of gamma ray or initial neutron energy plus the hight of the fission barrier. Therefore, the fission barrier (i.e. 6 MeV ) is added to the initial excitation energy for spontaneous fission of 238U (in equations (3.1. 238U exploration
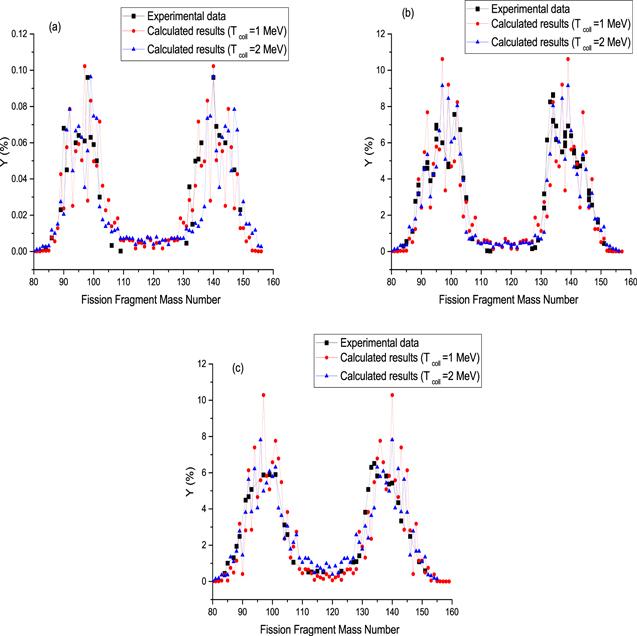
The mass yield for spontaneous fission of 238U is presented in figure 1(a). The squares and triangulares indicate the calculated results obtained for Tcoll = 1 MeV and Tcoll = 2 MeV, respectively. The deformation parameters are obtained by fitting the calculated results to the experimental values for Tcoll = 1 MeV and Tcoll = 2 MeV and presented in table 1 and 2, respectively. Figure 1(a) shows that the calculated results for mass yield are in good agreement to the experimental data for two collective temperatures. However, unlike the βm,L values in table 1, βm,L values in table 2 decrease in the symmetric region. This indicates that choosing Tcoll = 1 MeV is better than choosing Tcoll = 2 MeV for the spontaneous fission of 238U.Figure 1.
 New window|Download| PPT slide
Figure 1.Calculated mass yield for (a) spontaneous fission, photofission of 238U at (b) 8 MeV and (c) 68.3 MeV bremsstrahlung endpoint energy along with the experimental data [54–56], respectively. The squares and triangulares indicate the calculated results obtained with Tcoll = 1 MeV and Tcoll = 2 MeV, respectively.
Table 1.
Table 1.The βm,L values for spontaneous fission (SP) and photofission of some fissioning systems with Tcoll = 1 MeV. (βm,H = 0.5).
| AL | SP 238U | 238U | 240Pu | 239Pu | 237Np | 237Np |
|---|---|---|---|---|---|---|
| and 8 MeV | 67.8 MeV | 10 MeV | 28 MeV | 9.5 MeV | 28 MeV | |
| 80–87 | 0.40 | 0.33 | 0.37 | 0.25 | 0.3 | 0.3 |
| 87–90 | 0.40 | 0.33 | 0.41 | 0.32 | 0.39 | 0.39 |
| 91–93 | 0.42 | 0.37 | 0.41 | 0.32 | 0.39 | 0.39 |
| 94 | 0.42 | 0.37 | 0.41 | 0.36 | 0.39 | 0.39 |
| 95 | 0.42 | 0.4 | 0.41 | 0.32 | 0.39 | 0.39 |
| 96–98 | 0.47 | 0.45 | 0.45 | 0.36 | 0.45 | 0.45 |
| 99 | 0.53 | 0.53 | 0.5 | 0.47 | 0.45 | 0.45 |
| 100–101 | 0.53 | 0.5 | 0.55 | 0.45 | 0.45 | 0.45 |
| 102 | 0.53 | 0.52 | 0.53 | 0.42 | 0.45 | 0.45 |
| 103 | 0.53 | 0.5 | 0.5 | 0.43 | 0.45 | 0.45 |
| 104 | 0.53 | 0.5 | 0.53 | 0.46 | 0.45 | 0.45 |
| 105–109 | 0.53 | 0.5 | 0.5 | 0.4 | 0.45 | 0.45 |
| 107 | 0.53 | 0.5 | 0.52 | 0.4 | 0.45 | 0.45 |
| 110- | 0.53 | 0.5 | 0.5 | 0.4 | 0.45 | 0.45 |
New window|CSV
Table 2.
Table 2.The βm,L values for spontaneous fission (SP) and photofission of some fissioning systems with Tcoll = 2 MeV. (βm,H = 0.5).
| AL | SP 238U | 238U | 238U | 240Pu | 239Pu | 237Np | 237Np |
|---|---|---|---|---|---|---|---|
| — | 8 MeV | 67.8 MeV | 10 MeV | 28 MeV | 28 MeV | 9.5 MeV | |
| 80–87 | 0.40 | 0.4 | 0.33 | 0.37 | 0.25 | 0.3 | 0.38 |
| 87–90 | 0.40 | 0.4 | 0.33 | 0.38 | 0.3 | 0.39 | 0.39 |
| 91–93 | 0.38 | 0.41 | 0.35 | 0.38 | 0.3 | 0.39 | 0.39 |
| 94 | 0.38 | 0.41 | 0.35 | 0.38 | 0.36 | 0.39 | 0.39 |
| 95 | 0.38 | 0.41 | 0.39 | 0.38 | 0.3 | 0.39 | 0.39 |
| 96 | 0.43 | 0.44 | 0.41 | 0.38 | 0.32 | 0.39 | 0.39 |
| 97 | 0.55 | 0.44 | 0.45 | 0.38 | 0.32 | 0.42 | 0.39 |
| 98–99 | 0.55 | 0.5 | 0.5 | 0.47 | 0.42 | 0.45 | 0.45 |
| 100–101 | 0.55 | 0.5 | 0.48 | 0.48 | 0.42 | 0.42 | 0.45 |
| 102 | 0.55 | 0.5 | 0.52 | 0.48 | 0.38 | 0.49 | 0.45 |
| 103–104 | 0.43 | 0.58 | 0.5 | 0.48 | 0.4 | 0.49 | 0.45 |
| 104–109 | 0.43 | 0.58 | 0.5 | 0.5 | 0.38 | 0.49 | 0.45 |
| 107 | 0.43 | 0.58 | 0.5 | 0.52 | 0.38 | 0.49 | 0.45 |
| 109- | 0.43 | 0.58 | 0.5 | 0.5 | 0.4 | 0.49 | 0.45 |
New window|CSV
Also, the obtained βm,L values, especially for fragment with mass number 98, are similar to the results of [29], in which the temperature of fission fragments is used instead of the collection temperature to calculate the mass yield for the spontaneous fission of 238U. For this reason, the changes in βi values of [29] are less than the changes in our βm,L values.
The photofission mass yield of 238U at 8 MeV bremsstrahlung endpoint energy is presented in figure 1(b). The squares and triangulares indicate the calculated results obtained with Tcoll = 1 MeV and Tcoll = 2 MeV, respectively. This figure shows that the mass yield values with selecting Tcoll = 2 MeV are closer to the experimental data than the mass yield values with selecting Tcoll = 1 MeV.
The fragment deformation parameters for Tcoll = 1 MeV are the same as the deformation parameters for the spontaneous fission of 238U. This shows that with increasing excitation energy up to 8 MeV, the behavior of photofission and spontaneous fission is the same.
For Tcoll = 2 MeV, the values of the deformation parameter for light fragments are presented in table 2. Unlike βm,L values for spontaneous fission in this table, βm,L values for photofission at 8 MeV endpoint energy increase in the symmetric region (because this is an asymmetric fission). This increase in βm,L values for the symmetric fragments and the results presented in figure 1(b) indicates that it is better to choose Tcoll = 2 MeV instead of Tcoll = 1 MeV for photofission of 238U at 8 MeV endpoint energy.
In figure 1(c), the photofission mass yield of 238U at 68.3 MeV bremsstrahlung endpoint energy is presented. This indicates that the calculated values of mass yield with Tcoll = 2 MeV are closer to the experimental data than the calculated values with Tcoll = 1 MeV. The deformation parameters are obtained by fitting the calculated results to the experimental values for Tcoll = 1 MeV and presented in table 1. It can be seen again that βm,L values increase with increasing mass numbers of fission fragments. However, the increase in βm,L values is significant only for fragments with mass numbers greater than 98. For Tcoll = 2 MeV (table 2), the fission fragments with mass numbers between AL = 96 to 102 have the semi-magic proton number or magic neutron number (ZL = 50 and NH = 82), which makes the large βm,L values in this region.
As the excitation energy increases from 8 to 68 MeV, the number of cases where the value of the deformation parameter must be expressed separately increases (tables 1 and 2). This indicates the increase in excitation energy causes chaos. On the other hand, βm,L values decrease with increasing the excitation energy. This indicates that there is no need to deform the fragments much for fission with increasing the excitation energy. Also, by comparing the difference in beta values for symmetric and asymmetric fission fragments, it can be seen that this difference decreases with increasing the excitation energy. For example in table 2, the difference in beta values for fission fragments with mass numbers 100 and 109 in spontaneous fission is 0.12, while the differences in photofission at 8 and 67.8 MeV endpoint energies are 0.08 and 0.02, respectively. This indicates that the probability of the formation of symmetric fragments is reduced, which dues to the increase of weight of symmetric fission mode at high excitation energy.
Why does the fission fragment with mass number AL = 102, corresponding to the heavy fission fragment ${}_{53}^{135}{\rm{I}}$ with magic number 82, have a large βm,L value at 68 MeV excitation energy but this fragment does not have this large value at 8 MeV excitation energy? This may be because the magic fragment with mass number AH = 132 is much heavier than the magic fragment with mass number AL = 96, so stimulating a heavy nucleus needs more excitation energy.
In tables 1 and 2, comparing βm,L values in photofission of 238U at 8 MeV endpoint energy and photofission of 240Pu in 10 MeV endpoint energy, and also in photofission of 237Np and 239Pu at 28 MeV endpoint energy, it can be seen that these values decrease with increasing the mass numbers of fission fragments. Therefore, βm,L values for all fissioning systems decrease with increasing the mass numbers of fission fragments. This indicates that there is no need to deform the fragments much so fission occurs more easily with increasing the mass numbers of fissioning systems.
The sum of βi values can be calculated by fitting the experimental and theoretical data in the statistical scission model (such as [2]), so the β values of fragments can be considered equal such as [40]. Although the total kinetic energy has been studied in this reference, the β values of fragments can be compared with our βm values. So that the sum of βi values for the complementary fission fragments with mass numbers 158 in [40] and 80 in our study are equal to 0.9 and 0.88, respectively. Also, total β values for complementary fission fragments with mass numbers 141 in [40] and 98 in our study are 0.9 and 0.94, respectively. However, with the proximity to the symmetric region, the results are very different. So that the difference between the total βi values in the results of these studies for complementary fission fragments 129/109 reaches 1.2. This difference can be due to changes in the values of total kinetic energy measured in this region.
3.2. 240Pu and 239Pu exploration
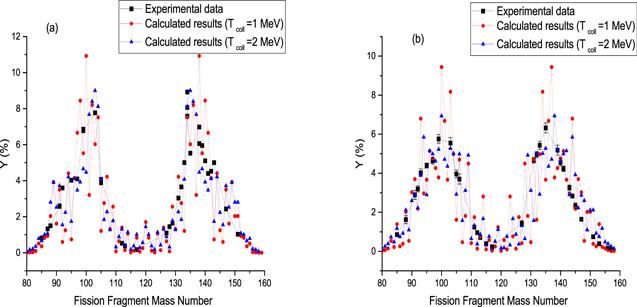
The photofission mass yield of 240Pu at 10 MeV bremsstrahlung endpoint energy is presented in figure 2(a). The deformation parameters of fission fragments are obtained by fitting the calculated results with the experimental values for Tcoll = 1 MeV and presented in table 1. The total β values of complementary fission fragments with mass numbers around 110 are so close to the results of [40] in which the total kinetic energy of actinide was studied within the statistical scission point model.Figure 2.
 New window|Download| PPT slide
Figure 2.Calculated mass yield for photofission of 240Pu at 10 MeV bremsstrahlung endpoint energy, accompanied with the experimental data [41] and (b) photofission of 239Pu at 28 MeV at 28 MeV bremsstrahlung endpoint energy, accompanied with the experimental data [57]. The squares and triangulares calculated results obtained with Tcoll = 1 MeV and Tcoll = 2 MeV, respectively.
For Tcoll = 2 MeV, the deformation parameters of light fragments are presented in table 2. It is seen that the heavy fission fragments with mass numbers around 102 have a magic neutron number (NH = 82), which makes the large change in βm,L values. Also, the heavy fission fragments with mass numbers around 106 have magic neutron number (${}_{52}^{134}{\rm{Te}}$), which makes the large change in βm,L values.
The photofission mass yield of 239Pu at 28 MeV bremsstrahlung endpoint energy is presented in figure 2(b). The deformation parameters of fission fragments are obtained by fitting the calculated results with the experimental values for Tcoll = 1 MeV and presented in table 1. βm,L values do not increase with increasing mass numbers of fission fragments, so Tcoll = 1 MeV may not be suitable for this excitation energy.
For Tcoll = 2 MeV, the deformation parameters of light fragments are presented in table 2. The βm,L values in plutonium-239 fission is lower than the βm,L values in plutonium-240 fission. This decrease can be due to both an increase in excitation energy and the odd effect of the plutonium-239 nucleus. To examine the odd–even effect on βm,L values, neptunium nucleus is investigated in the next section.
3.3. 237Np exploration
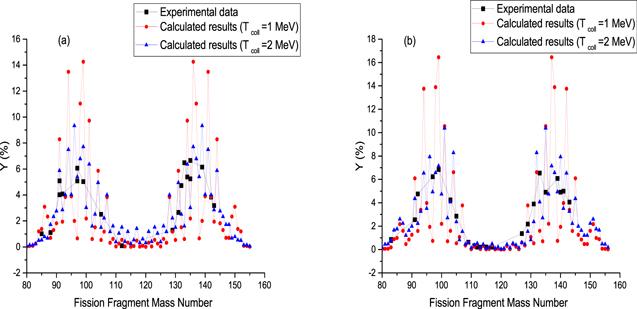
The photofission mass yield of 237Np at 9.5 MeV bremsstrahlung endpoint energy is presented in figure 3(a). The deformation parameters of fission fragments are presented in table 1, which are obtained by fitting the calculated results to the experimental values for Tcoll = 1 MeV. For Tcoll = 2 MeV, the deformation parameters are presented in table 2.Figure 3.
 New window|Download| PPT slide
Figure 3.Calculated mass yield (a) for photofission of 237Np at 9.5 MeV bremsstrahlung endpoint energy, accompanied with the experimental data [58] and (b) for photofission of 237Np at 28MeV bremsstrahlung endpoint energy, accompanied with the experimental data [59]. The squares and triangulares indicate the calculated results obtained with Tcoll = 1 MeV and Tcoll = 2 MeV, respectively.
The photofission mass yield of 237Np is presented in figure 3(b) at 28 MeV bremsstrahlung endpoint energy. The deformation parameters of fission fragments are presented in table 1, which are obtained by fitting the calculated results with the experimental values for Tcoll = 1 MeV. Comparing the last two columns of table 1, it can be seen that there is no change in the βm,L values for fission of 237Np at two energies (9.5 and 28 MeV). This indicates that calculated results with selecting Tcoll = 1 MeV are not very reliable.
For Tcoll = 2 MeV, the deformation parameters are presented in table 2. This table indicates that the βm,L values decrease with increasing mass number of the fissioning systems. Also, unlike fission of 238U, the βm,L values increase with increasing the excitation energy. On the other hand, the βm,L values for photofission of 238U at 8 MeV endpoint energy are higher than the βm,L values for photofission of 237Np at 9.5 MeV endpoint energy, while the mass numbers of fissioning systems has decreased. At first glance, it seems that the odd mass numbers of the fissioning systems reduce the deformation parameters. However, only for the symmetric fragments, the βm,L values in photofission of 240Pu at 10 MeV endpoint energy increase sharply (such as 238U) and their values do not differ much difference for the asymmetric fragments. Also, βm,L values for photofission of 237Np are higher than those for the photofission of 239Pu at the same energy. Therefore, the increase in βm,L values is related to the mass number of fissioning systems, not their odd or even. These changes must be related to the properties of the fission fragments, not to the fissioning systems.
Despite 240Pu fission, βm,L values of 237Np fission do not change much with increasing excitation energy. Also, the deformation parameter values for 237Np fission have the least variations. In addition, with increasing excitation energy, the amount of change in βm,L values is less than other fission.
Naik and Pomme [41–43] showed that the yields of fission fragments around mass numbers 94–95, 99–100, 104–105 are higher than the yields of other fission fragments for photofission of 238U and 240Pu in the low energy region. These changes can be also seen in the calculated results of our systematic model. Therefore, our results confirm the changes in the mass yields of these experimental data in some fragments.
As shown in figures 2 and 3, the calculated results of mass yield for odd–even nucleus are in good agreement with the experimental values. This indicates that our model is proper for all fissioning systems. On the other hand, the deformation parameters reduce oscillations when Tcoll = 2 MeV, so the mass yields are better to evaluate with selecting Tcoll = 2 MeV for photofission in the intermediate excitation energy and Tcoll = 1 MeV for spontaneous fission.
As mentioned earlier, the sum of beta values is obtained in the statistical model, therefore, in the next section the βi values of the complementary fission fragment are considered equal to investigate the difference of these methods.
4. The transition between asymmetric and symmetric fission
In this section, the transition between asymmetric and symmetric fission is investigated by calculating the mass yields of pre-actinides and actinide within the scission point model. As discussed in the previous section, the temperature value is 1 MeV for spontaneous fission and 2 MeV for thermal neutron fission. Also, the βi values of the complementary fission fragments are equal, such as [40]. By fitting the calculated results to the experimental data, the deformation parameters of fission fragments are presented in table 3.Table 3.
Table 3.The βm,L( = βm,H) values for each fission.
| AL | 194Po | 200Ra | 222Th | 229Th | 248Fm | 258Fm |
|---|---|---|---|---|---|---|
| 80–87 | 0.47 | 0.45 | 0.525 | 0.49 | 0.44 | 0.4 |
| 87–90 | 0.47 | 0.55 | 0.525 | 0.55 | 0.44 | 0.4 |
| 90–94 | 0.48 | 0.55 | 0.525 | 0.55 | 0.44 | 0.4 |
| 94–99 | 0.47 | 0.55 | 0.525 | 0.55 | 0.44 | 0.4 |
| 100 | — | 0.51 | 0.48 | 0.55 | 0.44 | 0.4 |
| 101 | — | — | 0.48 | 0.55 | 0.44 | 0.4 |
| 102 | — | — | 0.48 | 0.51 | 0.44 | 0.4 |
| 103–104 | — | — | 0.48 | 0.51 | 0.49 | 0.4 |
| 104–109 | — | — | 0.444 | 0.51 | 0.49 | 0.4 |
| 109–115 | — | — | 0.444 | 0.51 | 0.49 | 0.51 |
| 115–125 | — | — | — | — | 0.55 | 0.51 |
| 125- | — | — | — | — | — | 0.49 |
New window|CSV
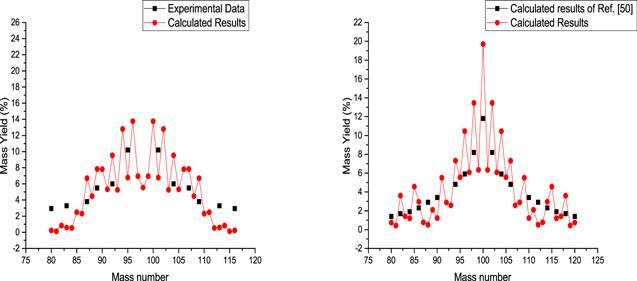
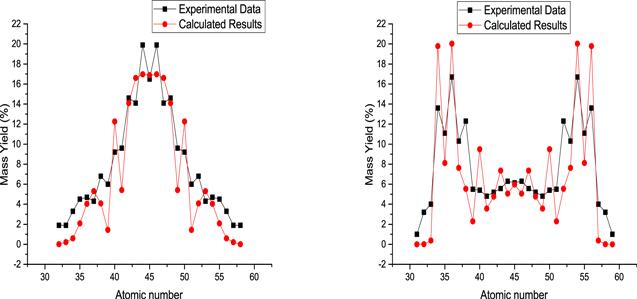
The calculated mass yields for the 194Po and 200Ra fission are presented along with the experimental data in figure 4. The values of mass yields for 200Ra fission are taken from Pomorski [44]. However, the mass yield for fission of 194Po is measured by Ghys [45]. As can be seen from this figure, the calculated mass yields for pre-actinide nuclei with symmetric fission are also in good agreement with the experimental results.
Figure 4.
 New window|Download| PPT slide
Figure 4.The mass yield calculated for fission of 194Po (left part) and 200Ra (right part), accompanied with the experimental data [45] and the calculated results [44].
Atomic yields of most thorium isotopes have been measured by Schmitt [46]. In addition, the atomic yields of 222,229Th have been investigated by Ruan [47] within the improved scission point model and by Randrup [15] within the Brownian shape motion model. Therefore, we study the atomic yields (instead of mass yields) of the 222,229Th fission. Because the experimental and theoretical atomic distributions for 222Th fission as the symmetric fission and for 229Th fission as the asymmetric fission are known, the atomic yields of these thorium isotopes have been investigated.
In figure 5, atomic yields for fission of 222Th (left part) and 229Th (right part) are presented along with experimental data [46]. As it is seen the transition from symmetric to asymmetric fission is well reproduced for thorium isotopes with increasing mass number. Comparing figure 5 with figure 5 of [47] indicates that our results are closer to the experimental data than the calculated results of other models.
Figure 5.
 New window|Download| PPT slide
Figure 5.Calculated atomic yield for fission of 222Th (left part) and 229Th (right part), accompanied with the experimental data [46].
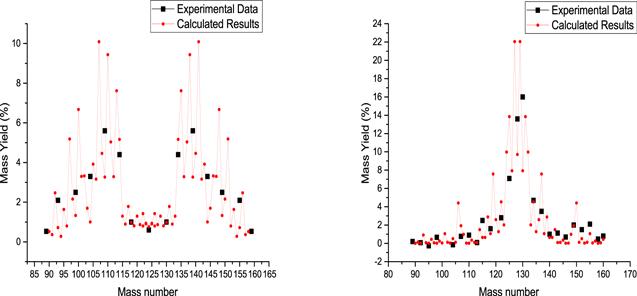
In figure 6, the calculated mass yield for fission of 248Fm and 258Fm is represented along with experimental data [48, 49]. For spontaneous fission of 248Fm the collective temperature is selected 1MeV and for thermal neutron fission of 257Fm Tcoll = 2 MeV. The transition from asymmetric to symmetric fission mode is well reproduced in this figure with slight changes in βm,i values (table 3).
Figure 6.
 New window|Download| PPT slide
Figure 6.Calculated mass yield for the spontaneous fission of 248Fm (left part) and fission of 258Fm (right part), accompanied with the experimental data [48, 49].
In table 3, the deformation parameters values of complementary fission fragments are presented for discussed fissioning systems. Despite the increase in βm,i values for symmetric fission fragments in tables 1 and 2, the βm,i values of table 3 in the symmetric region decrease, except for 248Fm fission as an asymmetric fission. Therefore, the change in the βm,i values corresponds to the fission modes. In this way, for the 194Po, 200Ra, 222Th and 258Fm fission whose fission mode are symmetric, the βm,i values in the symmetric fragments are decreased and these values for the symmetric fragments are increased in 248Fm fission as an asymmetric fission. While 229Th fission is an asymmetric fission, the βm,i values do not increase for the symmetric fission fragments. This is because that 229Th fission is not a completely asymmetric fission. As shown in figure 5, the atomic yield of thorium-229 fission, such as the fission mass yield of thorium-232, has a peak in the symmetric region (i.e. their atomic yields have three peaks).
On the other hand, it is obvious that the shape of the mass (atomic) yields is related to the formation of magic fission fragments. It can be seen that the beta values are maximized for fission fragments with mass numbers around 89 to 98 because according to [50], the fission fragments are produced as follows in 229Th fission: 140,139Cs with NH = 84, 89Rb with NL = 50, 130Sn with ZH = 50, and 98−100Zr with ZL = 40. Of course, this increase in beta due to very unstable complementary fission fragments, otherwise magic fragments have the least deformation. Therefore, the total deformation parameter of these two complementary fragments is maximal.
In the statistical scission point model, the total deformation parameters are usually investigated. The deformation parameters of light and heavy fragments can be assumed equal (i.e. βL = βH, which is done in this section) or it can be assumed that one of them is fixed and the other changes (as in the previous section). If one of them remains constant, according to the figures 3 of [29], the change in mass yield is more. However, tables 1–3 indicate that keeping one beta value constant or the equality of both beta values makes little difference in the results. So both cases are not different to investigate the mass yield within the statistical model.
On the other hand, in [40], beta values are obtained by fitting the theoretical and experimental results of the total kinetic energy using the same model. Although in this reference the beta values in the symmetric region are very large, this abnormal increase in the beta value is not related to the model. This is because the amounts of total kinetic energy change (increase) abruptly in the symmetric region, which is probably related to the target thickness [51].
Also, Liu [52] showed that the heavy fragment mass distribution shifts to the right side about several mass units while the light fragment mass distribution shifts to the left side a little bit by introducing the constraint on the heavy fragment deformation. However, as shown in tables 1–3, this shift in mass yields does not occur in the calculated results of the statistical scission point model.
Wei [53] has recently calculated mass distribution using a simplified scission-point model. In these calculations, the deformation values of the fission fragments are equal to the ground state deformation values (such as [47]). For this reason, for low excitation energies (e.g. 1 MeV), the calculation results are in good agreement with the experimental values.
5. Summary
The mass yields for fission of pre-actinides and actinides are calculated within a systematic scission point model. The calculated results are compared with the available experimental data which indicates that the calculated results are in good agreement with the experimental data, specially with selecting the collective temperature equal 2 MeV for intermediate excitation energy and with selecting Tcoll = 1 MeV for spontaneous fission. The barrier potential energy is added to the excitation energy (E) to evaluate mass yields. The distance of two fragments surface is 1.44 fm.The deformation parameters of fission fragments are presented by fitting the calculated results to the experimental data. The deformation values for asymmetric (symmetric) fissions increase (decrease) with increasing the mass numbers of fission fragments (i.e. for the symmetric region). The (shape of) the mass yields can be predicted for the rest of fission systems.
Also, the deformation parameter values decrease with increasing the excitation energy. This indicates that there is no need to deform the fragments much for fission with increasing excitation energy. Of course, this increase causes chaos in deformation parameter values. Also, deformation parameter values decrease with increasing the mass numbers of fissioning systems.
The small increase in the experimental photofission mass yield [41–43] for some fragments with mass numbers around 104–105, 99–100 is related to the total potential energy of the fissioning system at the fission point. These higher values may also exist in mass yields of the other actinides fission, but their small amount causes them to be excluded from the results as measurement errors.
The mass yields in the transitions region between asymmetric and symmetric fission are calculated within the systematic scission point model. The calculated results are compared with the available experimental data. This indicates that there is a good agreement between the calculated results and the experimental data in this region. Therefore, the mass yields in the transitions between asymmetric and symmetric fission modes are well reproduced for thorium and fermium isotopes within our systematic scission point model.
Keeping one beta value constant or the equality of both beta values makes little difference in results. Therefore, the both cases are not different to investigate the mass yield within the statistical scission point model. However, it is recommended to keep one of them (βL or βH) constant due to increasing the range of changes.
Reference By original order
By published year
By cited within times
By Impact factor
DOI:10.1103/PhysRev.102.434 [Cited within: 2]
DOI:10.1103/PhysRevC.14.1832 [Cited within: 5]
DOI:10.1016/0370-1573(90)90114-H [Cited within: 1]
DOI:10.1016/j.nuclphysa.2016.11.007 [Cited within: 1]
DOI:10.1134/S1063778819050089 [Cited within: 1]
DOI:10.1007/s41365-018-0482-1 [Cited within: 1]
DOI:10.1103/PhysRevC.86.044315 [Cited within: 2]
DOI:10.1140/epja/i2016-16369-5 [Cited within: 1]
DOI:10.5506/APhysPolB.48.431 [Cited within: 1]
DOI:10.1016/j.nuclphysa.2017.10.001 [Cited within: 2]
DOI:10.1051/epjconf/20136204002 [Cited within: 1]
DOI:10.1103/PhysRevC.99.034612 [Cited within: 2]
DOI:10.1140/epja/i2019-12729-y [Cited within: 1]
DOI:10.1103/PhysRevLett.106.132503 [Cited within: 1]
DOI:10.1103/PhysRevC.88.064606 [Cited within: 1]
DOI:10.1103/PhysRevC.91.044316 [Cited within: 1]
DOI:10.1134/1.1378876 [Cited within: 1]
DOI:10.1103/PhysRevC.90.054607
DOI:10.1051/epjconf/201612201002
DOI:10.1103/PhysRevC.81.044317
DOI:10.1051/epjconf/201816900016 [Cited within: 1]
DOI:10.1103/PhysRevC.54.258
DOI:10.1103/PhysRevC.64.014607 [Cited within: 1]
DOI:10.1016/j.nuclphysa.2004.01.038 [Cited within: 1]
DOI:10.1016/0003-4916(81)90268-2 [Cited within: 2]
DOI:10.1016/0003-4916(77)90249-4 [Cited within: 2]
DOI:10.1016/j.nuclphysa.2013.03.002 [Cited within: 1]
DOI:10.1006/adnd.1995.1002 [Cited within: 2]
DOI:10.1088/1402-4896/ab93a9 [Cited within: 4]
DOI:10.1016/0375-9474(67)90510-6 [Cited within: 1]
DOI:10.1103/PhysRevC.97.054331 [Cited within: 2]
DOI:10.1016/j.nuclphysa.2011.08.001 [Cited within: 1]
DOI:10.1088/0954-3899/39/5/055103 [Cited within: 1]
[Cited within: 1]
DOI:10.1016/0375-9474(70)90174-0 [Cited within: 1]
DOI:10.1140/epja/i2004-10017-9 [Cited within: 1]
DOI:10.1016/j.nuclphysa.2016.02.036
DOI:10.1103/PhysRevC.99.044601
DOI:10.1088/1674-1137/43/9/094101 [Cited within: 1]
DOI:10.1103/PhysRevC.102.044612 [Cited within: 6]
DOI:10.1016/j.nuclphysa.2011.01.009 [Cited within: 3]
DOI:10.1140/epja/i2013-13094-7
DOI:10.1016/0375-9474(94)90174-0 [Cited within: 2]
DOI:10.1103/PhysRevC.101.064602 [Cited within: 2]
DOI:10.1103/PhysRevC.90.041301 [Cited within: 2]
DOI:10.1051/epjconf/201816900022 [Cited within: 3]
DOI:10.1088/1361-6471/ab4820 [Cited within: 3]
DOI:10.1103/PhysRevC.22.1581 [Cited within: 2]
[Cited within: 2]
DOI:10.1140/epja/s10050-020-00080-5 [Cited within: 1]
DOI:10.1103/PhysRevC.96.044301 [Cited within: 1]
DOI:10.1103/PhysRevC.99.044614 [Cited within: 1]
DOI:10.1088/1674-1137/abd083 [Cited within: 1]
DOI:10.1016/0022-1902(71)80491-8 [Cited within: 1]
DOI:10.1007/s10967-013-2719-0
DOI:10.1103/PhysRevC.91.034603 [Cited within: 1]
DOI:10.1007/BF01141251 [Cited within: 1]
[Cited within: 1]
DOI:10.1016/0039-6028(73)90215-X [Cited within: 1]
