Abstract:The nature of glass transition is one of the most interesting problems in modern condensed matter physics. There is a theory that shows that when the particle's diffusion motion probability P is less than $ {{\rm{e}}^{ - 2{{\rm{e}}^3}}}$, the proportion of particles whose diffusion motion is frozen is not less than 1 + 2e3/lnP. Based on the modulus temperature formula of this theory and the experimental modulus-temperature curve of polystyrene in the literature, the free volume expansion coefficient of polystyrene is determined to be in a range of 0.00045-0.00052. In this paper, we first quantitatively study the specific heat temperature relationship in the glass transition of polystyrene. Based on this theory, the specific heat-temperature formula in the glass transition region is derived. The material in the glass transition region is a mixture of rubber and glass, and this two-component (rubber and glass) system’s total specific heat is the product of the specific heat of the rubber and the percentage of rubber in the two-component system plus the product of the specific heat of the glass and the percentage of glass in the two-component system. Let b be the number of atoms in the main chain of the segment, then the proportion of rubber will be the b-th power of free volume fraction. This specific heat-temperature formula with polystyrene is tested. By substituting the obtained free volume expansion coefficient of the polystyrene into the specific heat-temperature formula, the resulting formula can accurately and quantitatively describe the specific heat-temperature relationship in the glass transition of polystyrene without fitting any parameters. In this paper, we also study the change of motion in the glass transition of polystyrene. According to the analysis, the glass transition process of polystyrene is a process in which the diffusion movement of the main chain atoms is activated or frozen, which is consistent with the conclusions of relevant research on amorphous alloys. When the main chain atom is used as the molar unit of measurement, the specific heat change in the glass transition of polystyrene is 1.61R (R is the gas constant), which is consistent with the law, i.e. “the specific heat change in the glass transition of the amorphous alloy is about 1.5R”. These consistent conclusions predict that the glass transitions of amorphous alloys and glass transitions of polystyrene have the same essence. Based on this idea, the specific heat temperature formulas of the amorphous alloy Pd40Ni10Cu30P20 and polystyrene are verified and prove to be consistent. Keywords:glass transition/ specific heat-temperature formula/ amorphous alloy/ polystyrene
${a_{\rm{f}}}$取不同值拟合得到的聚苯乙烯的模量-温度曲线如图1所示. 通过比较拟合图发现, 当${a_{\rm{f}}}$取值0.00048时, 计算曲线和实验曲线最为符合; 当${a_{\rm{f}}}$取值0.00045或者0.00052时, 拟合匹配性较${a_{\rm{f}}}$取值0.00048时的差. 当拟合值是真实值时, 拟合曲线和实验曲线是最接近的, 所以聚苯乙烯的${a_{\rm{f}}}$真实值应该在(0.00045, 0.00052)范围内. 图 1 以不同${a_{\rm{f}}}$值拟合的不同分子量的聚苯乙烯的模量-温度曲线(文献值的原数据取自文献[17]) (a) ${a_{\rm{f}}}=0.00045$; (b) ${a_{\rm{f}}}=0.00048$; (c) ${a_{\rm{f}}}=0.00052$ Figure1. Modulus-temperature curves of polystyrene at different molecular weight under different ${a_{\rm{f}}}$ (The source data of the reference values marked in panel are extracted from Ref. [17]): (a) ${a_{\rm{f}}}=0.00045$; (b) ${a_{\rm{f}}}=0.00048$; (c) ${a_{\rm{f}}}=$ 0.00052
图2是不同降温速度下的聚苯乙烯DSC曲线图, 纵坐标归一化比热为实验计算值. 图中的曲线取自文献[19, 20], 这些曲线均是实验实测的, 是聚苯乙烯先降温后升温然后通过DSC测量的升温过程中的归一化比热温度数据, 详细的测量步骤请查看文献原文. 图 2 不同降温速度后升温的聚苯乙烯的DSC测试结果[19,20] (a) 0.1, 1, 10, 100 K/min; (b) 10, 20, 100 K/min Figure2. DSC experimental results of polystyrene recorded after cooling at different cooling rates[19,20]: (a) 0.1, 1, 10, 100 K/min; (b) 10, 20, 100 K/min.
从图2(a)可以看到DSC曲线会有吸热峰出现, 从图2(a)可以看到降温速度越大吸热峰越小, 在降温速度为100 K/min时吸热峰已经非常小了. 做辅助线如图2, 可以看到随着降温速度的增加, 辅助线以上的部分(吸热峰)越来越小, 可以假设在一个合适的降温速度下, 辅助线以上的部分会完全消失, 吸热峰为0. 观察图2(a), 随着降温速度的增加, 辅助线以上部分的变化远远大于辅助线以下部分的变化. 特别是根据图2(b), 可以看到降温速度由20 K/min变成100 K/min, 辅助线以上的部分变化很大, 而辅助线以下的部分基本不变, 据此可以认为继续增加降温速度, 辅助线以上部分会迅速变成零, 而辅助线以下部分会基本不变, 即可以认为这个合适降温速度下的DSC曲线辅助线以下部分就是100 K/min的DSC曲线在辅助线以下部分, 这个合适降温速度下的DSC曲线辅助线以上部分就是该温度区间的辅助线. 根据文献[11], 聚合物在DSC升温测试中的归一化比热变化有两个来源: 一部分是由玻璃化转变中玻璃组分减少引起的, 另一部分是由滞后焓回复引起的. 升温过程中, 高分子中玻璃组分随温度单调减少, 所以玻璃转变中的玻璃组分减少是不会产生比热峰的, 吸热峰就是由滞后焓的回复引起的. 当高分子是玻璃时, 滞后焓回复引起的归一化比热为零[11]; 当高分子是橡胶时, 滞后焓回复引发的归一化比热也为零[11]; 那么若玻璃化转变区内滞后焓引起的归一化比热不为零, 则其归一化比热温度曲线上必存在一个峰. 依据这样分析, 若某DSC测试得到的曲线吸热峰为零, 那么此条曲线中滞后焓回复引起的归一化比热变化也为零, 这条DSC曲线就是材料本身的归一化比热温度曲线. 再结合上述分析, 作聚苯乙烯的归一化比热温度曲线如图3中圆点线(100 K/min的DSC曲线实验数据取自文献[20]), 其纵坐标变量为归一化比热的实验值$C_{{\rm{p}}, {\rm{e}}}^{\rm{N}}$. $C_{{\rm{p}}, {\rm{e}}}^{\rm{N}}$的计算公式[19,20]为 图 3 不同${a_{\rm{f}}}$值的聚苯乙烯的$C_{\rm{p}}^{\rm{N}}$的实验值和计算值(实验值的原数据取自文献[20]) (a) ${a_{\rm{f}}}$ = 0.00045; (b) ${a_{\rm{f}}}$ = 0.00052 Figure3. Experimental and predicted $C_{\rm{p}}^{\rm{N}}$ of PS at different ${a_{\rm{f}}}$ (The source data of the experimental values marked in panel are extracted from Ref. [20]): (a) ${a_{\rm{f}}}$ = 0.00045; (b) af = 0.00052.
$C_{{\rm{p}},{\rm{e}}}^{\rm{N}} = \frac{{{C_{\rm{p}}}\left( T \right) - {C_{{\rm{pg}}}}\left( T \right)}}{{{C_{{\rm{pr}}}}\left( T \right) - {C_{{\rm{pg}}}}\left( T \right)}}.$


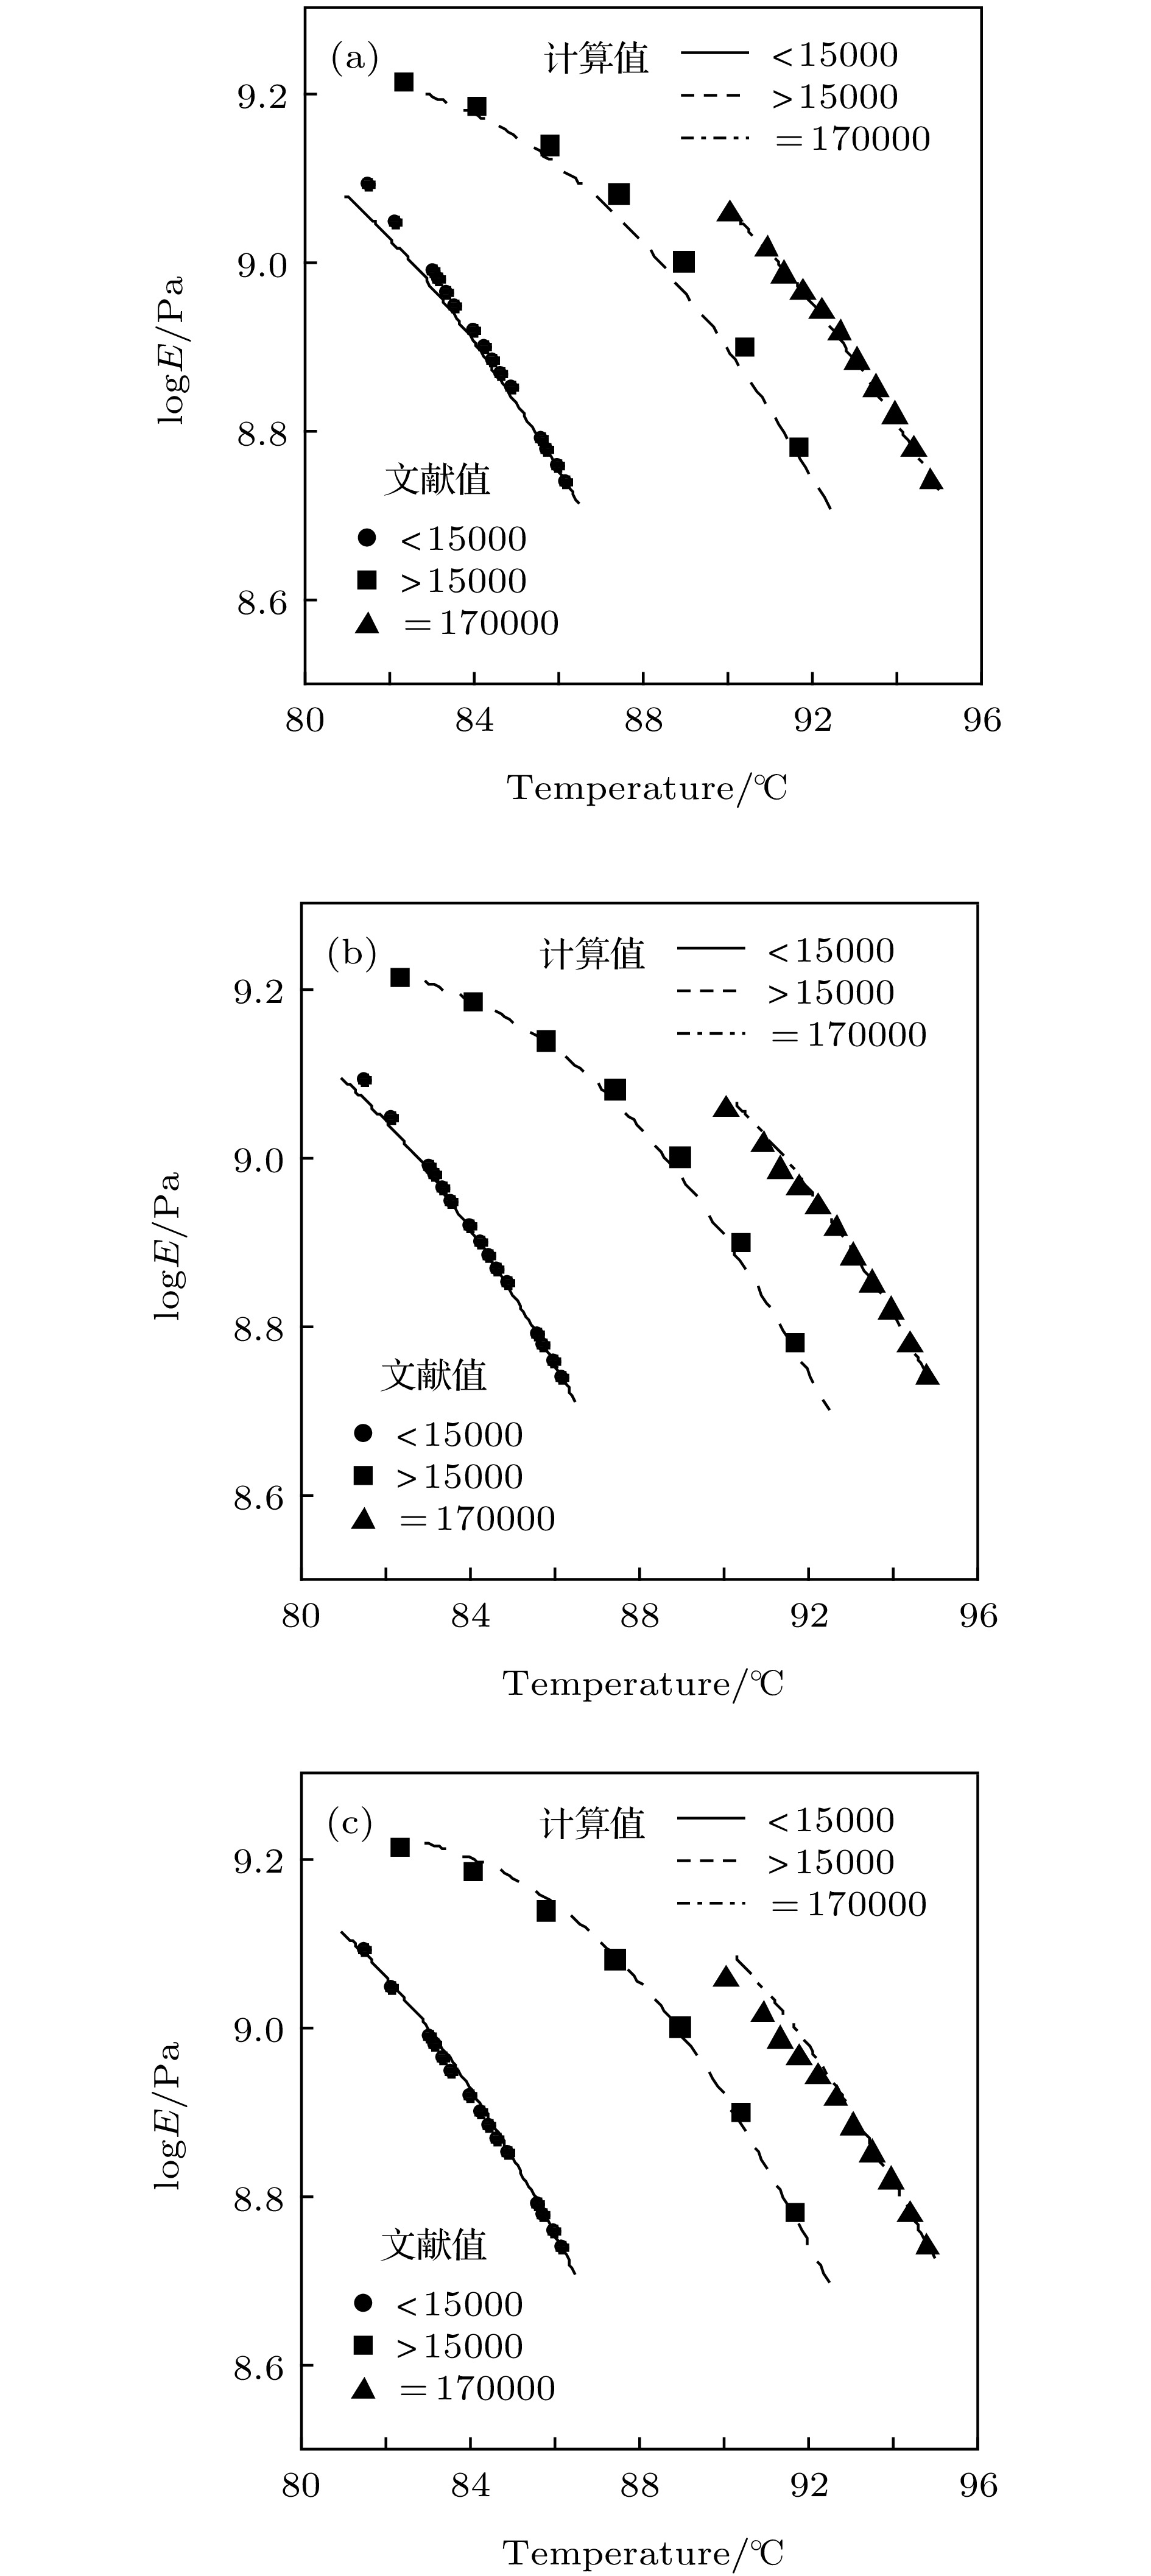 图 1 以不同


 图 2 不同降温速度后升温的聚苯乙烯的DSC测试结果[19,20] (a) 0.1, 1, 10, 100 K/min; (b) 10, 20, 100 K/min

 图 3 不同


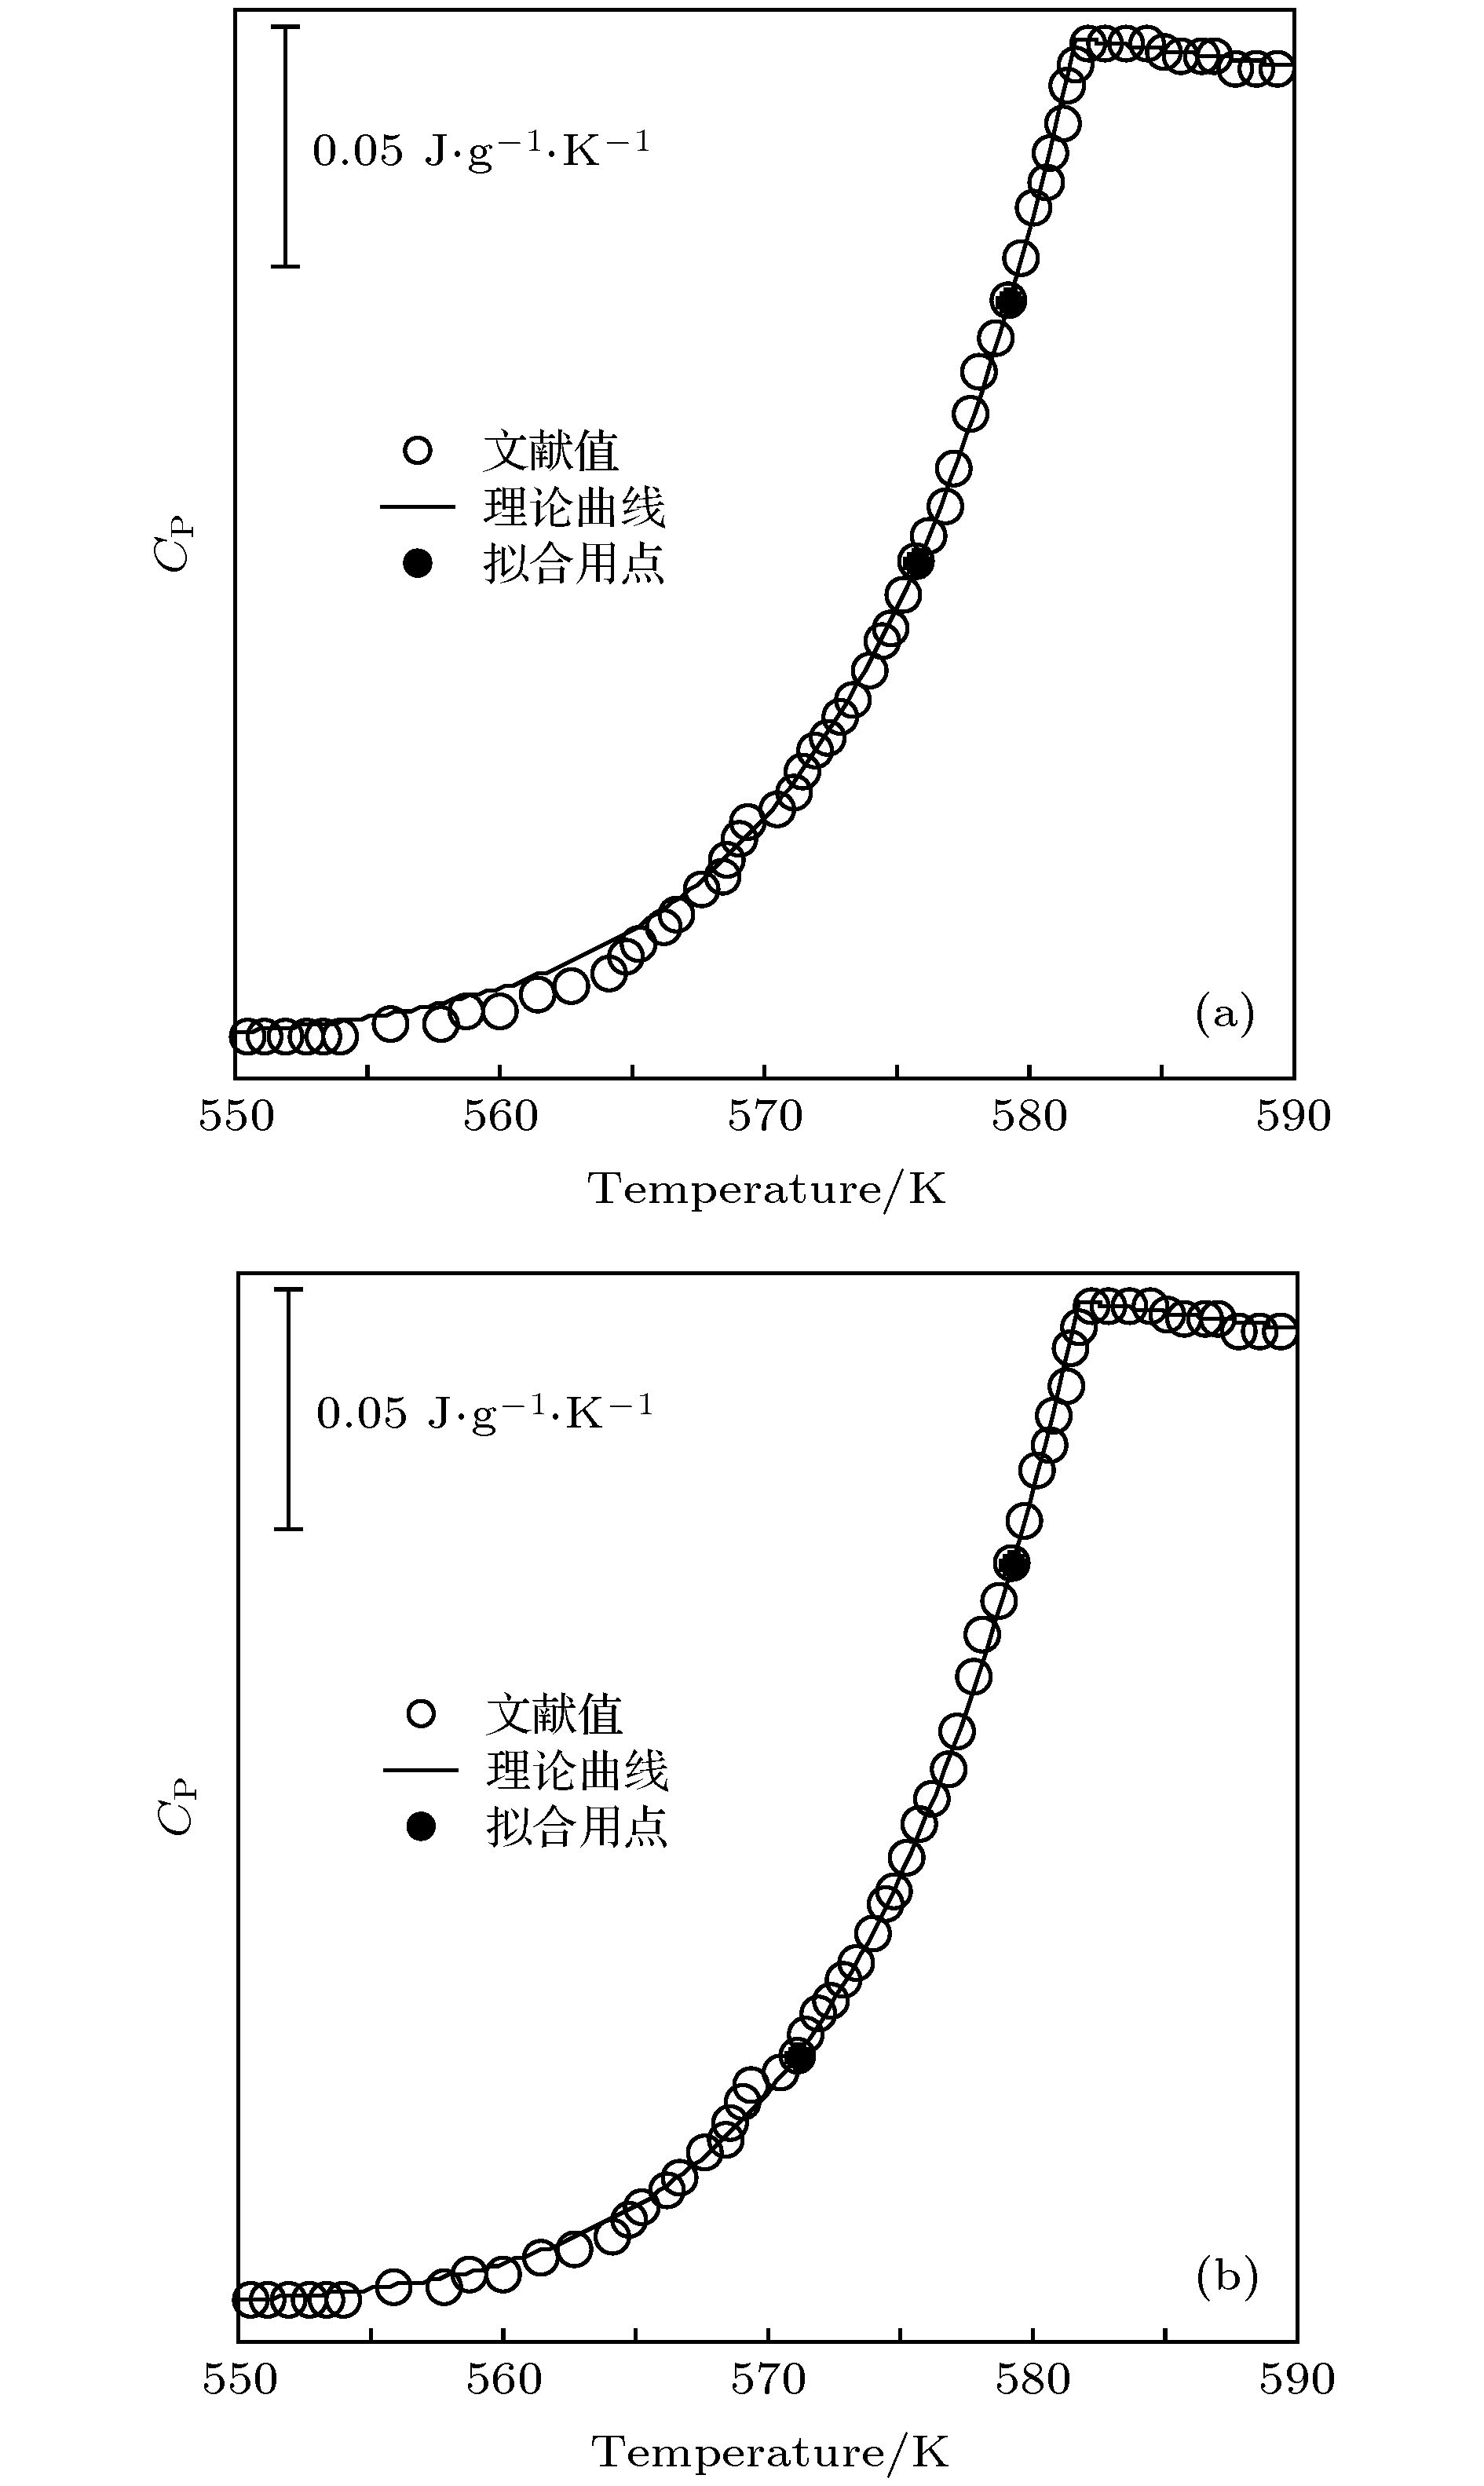 图 4 Pd40Ni10Cu30P20的比热温度曲线(文献值的原数据取自文献[4]) (a) af = 0.00027, b = 11.57; (b) af = 0.00043, b = 7.20


