 ,1,2, 卢宏玮,2, 姚天次2, 刘云龙1, 唐孟1, 冯玮2, 卢静昭1
Distribution and source analysis of microplastics in typical areas of Qinghai-Tibet Plateau
FENG Sansan,1,2, LU Hongwei,2, YAO Tianci2, LIU Yunlong1, TANG Meng1, FENG Wei2, LU Jingzhao1通讯作者:
收稿日期:2020-06-29修回日期:2020-12-9
| 基金资助: |
Received:2020-06-29Revised:2020-12-9
| Fund supported: |
作者简介 About authors
冯三三(1993-), 男, 山西吕梁人, 博士生, 主要从事环境微塑料污染研究。E-mail:

摘要
关键词:
Abstract
Keywords:
PDF (4580KB)元数据多维度评价相关文章导出EndNote|Ris|Bibtex收藏本文
本文引用格式
冯三三, 卢宏玮, 姚天次, 刘云龙, 唐孟, 冯玮, 卢静昭. 青藏高原典型区微塑料分布特征及来源分析. 地理学报, 2021, 76(9): 2130-2141 doi:10.11821/dlxb202109007
FENG Sansan, LU Hongwei, YAO Tianci, LIU Yunlong, TANG Meng, FENG Wei, LU Jingzhao.
1 引言
微塑料是指粒径小于5 mm的塑料[1],目前正在得到越来越多的关注。研究表明,微塑料已经广泛分布在世界各地的水体和陆地环境中,甚至在极地地区也有分布[2]。微塑料质轻且体积小容易被生物体误食,进而对动物消化和呼吸系统产生堵塞等物理伤害[3,4]。微塑料还会通过饮食摄取和呼吸吸入途径进入人体,引起各种过敏反应和细胞毒性反应、免疫反应等,严重威胁人体健康[5]。此外,微塑料具有比表面积大且疏水性强的特征,可作为多种污染物(如持久性有机污染物、重金属等)和病原菌的载体,形成复合污染物,产生更严重的环境风险[6,7]。因此,微塑料污染已经被认为是一个严峻的环境问题。关于微塑料的研究从海洋开始,之后逐渐转向陆地河流和湖泊。从2010年至今,国际上关于微塑料研究的论文数量持续快速增加[8],调查区域集中在海洋地区,包括地中海西北部[9]、美国东部海岸[10]、西北太平洋[11]等。科学家甚至在极地地区也检测到了微塑料,比如南极水域[12]。中国环境微塑料研究最早可以追溯到2014年Zhao等[13]报道的关于长江口漂浮微塑料的情况。之后,国内****陆续展开相关研究,调查涉及山东半岛[14]、南海[15]、长江[16]、三峡[17]和鄱阳湖[18]等区域,而越来越多的证据表明中国陆地环境也存在严重的微塑料问题[19,20]。
青藏高原作为亚洲多条重要河流的水源地,也是人类活动强度较低的地区。Yin等[21]在2018年检测了青藏高原6个采样点的水体微塑料含量,证明了微塑料存在于青藏高原水体和沉积物中。然而受限于样点数量及空间分布的单一,上述研究难以准确表征高原整体的微塑料赋存形态及特征,更难以追溯其可能来源。因此,有必要在青藏高原更广阔区域开展样品采集和微塑料检测,识别高原微塑料来源并支撑微塑料迁移转化机理的研究。鉴于物质往往通过地表径流在水土介质之间迁移,同时开展微塑料在水土环境中的检测既可以了解其在不同介质中的丰度水平、空间差异及介质间的迁移转化机理,更有助于解译水土环境中的微塑料随地表水体跨区域迁移和降解的过程,对于进一步估算河流源区微塑料输出通量乃至全流域微塑料入海总量均有重要意义。
本文将平行对比青藏高原南部人类活动低强度地区和北部祁连山高强度地区典型河流、湖泊、土壤中的微塑料检测数据,分析微塑料浓度和主要类型,识别其潜在来源,为探明高原微塑料赋存形态、空间分布,支撑迁移转化机理和人类活动的生态环境影响研究提供科学依据。
2 材料和方法
2.1 研究区域
青藏高原是世界上最高的高原,被称为“第三极”和“亚洲水塔”,为当地及周边地区10亿多人口提供了水资源。研究区域位于青藏高原东部地区(26°50′47N″~40°8′31″N, 91°57′34″E~102°36′45″E),海拔范围在1131~4666 m,包括西藏、四川、云南、青海、甘肃等5个省份的部分地区。其中,高原东南部区域是典型农牧区,由于高原的寒冷条件,以塑料覆膜和大棚为主的设施农业成为这里重要的农业类型;而位于青藏高原东北边缘的祁连山地区,前期不合理的工矿开发已经造成较为突出的生态环境问题,自2017年被确定为国家生态恢复重点区域后,随着大部分工矿企业被关停,旅游业、传统畜牧业、小型设施农业成为当地的主要产业。塑料制品也被广泛使用在青藏高原居民生产生活中,更是有大量的旅游人口进入高原地区。塑料垃圾已成为当地自然环境中微塑料的一个重要来源。2.2 样品采集
本文根据青藏高原东部地区的人口、经济和自然环境选择了105个采样点,包括53个水样点和52个土壤样点,所有样本均采集自2019年夏天(5—7月进行)。① 水样采集:在距离岸边至少5 m且水深超过1 m的位置,用带有2 L不锈钢瓶的采样杆收集地表水样20 L(深度:0~10 cm)。收集的水样用20 μm孔径的不锈钢筛子过滤,钢筛上的残留物用蒸馏水冲洗到250 mL的玻璃瓶中,最后加入10 mL 4%福尔马林溶液冷藏保存。② 土样采集:土壤样本均取自大棚农田、覆膜农田和裸露农田(其中覆膜和大棚样点在塑料覆膜附近,而非直接取自覆膜下)。每个样点采集3个重复,分别在0.2 m×0.2 m区域内用干净的不锈钢铁铲从第一层(0~3 cm)和第二层(3~6 cm)收集土壤样本,并去掉其中大于3 cm的大块垃圾。在每个采样点分别收集到约1.2 kg的土壤样品两份并封装于铝箔袋中保存。2.3 样品前处理
水样置于干净的锥形瓶中并加入0.05 M的Fe(II)溶液少许和30%的H2O2约50 mL,将以上混合液加热至70 ℃并持续72 h,以保证充分氧化样品中的有机物质,消解时间根据部分样品情况适当延长直至全部消解彻底。化学降解之后混合液倒入烧杯中用蒸馏水稀释,最后把稀释后的液体慢慢通过GF/C过滤器过滤(0.45 μm孔隙大小,47 mm直径)。过滤完样品的滤纸置于干净的玻璃培养皿中(直径5 cm)待测。Tab. 1
表1
表1采样点经纬度信息
Tab. 1
| 水体 | 纬度(°N) | 经度(°E) | 土壤 | 纬度(°N') | 经度(°E) | |
|---|---|---|---|---|---|---|
| W1 | 29.9790 | 95.6800 | S1 | 29.5816 | 94.4493 | |
| W2 | 29.9314 | 95.6188 | S2 | 29.9088 | 95.6124 | |
| W3 | 29.8656 | 95.7580 | S3 | 30.9411 | 97.3638 | |
| W4 | 29.5530 | 96.8330 | S4 | 29.9016 | 98.4488 | |
| W5 | 31.1399 | 97.1754 | S5 | 29.6716 | 98.5950 | |
| W6 | 29.7600 | 97.9788 | S6 | 28.8525 | 99.8280 | |
| W7 | 30.0180 | 99.1219 | S7 | 27.6263 | 99.7413 | |
| W8 | 27.8209 | 99.7097 | S8 | 26.8466 | 100.0669 | |
| W9 | 27.7399 | 100.8171 | S9 | 27.1986 | 100.2738 | |
| W10 | 27.8035 | 100.7547 | S10 | 27.7513 | 100.7861 | |
| W11 | 29.0487 | 100.2955 | S11 | 28.2800 | 99.1772 | |
| W12 | 29.4538 | 94.4647 | S12 | 28.2969 | 98.8675 | |
| W13 | 29.0504 | 93.0682 | S13 | 28.4927 | 97.0116 | |
| W14 | 29.1476 | 92.5725 | S14 | 28.4925 | 97.0077 | |
| W15 | 26.8880 | 99.9611 | S15 | 28.6233 | 97.3430 | |
| W16 | 27.7711 | 99.4275 | S16 | 29.7402 | 96.0019 | |
| W17 | 28.3644 | 99.5488 | S17 | 29.9602 | 95.3766 | |
| W18 | 28.4183 | 99.2544 | S18 | 29.5766 | 94.4697 | |
| W19 | 28.3505 | 99.0677 | S19 | 29.0727 | 92.8952 | |
| W20 | 28.9069 | 99.0538 | S20 | 29.0632 | 92.8265 | |
| W21 | 31.6231 | 98.5944 | S21 | 29.2605 | 91.9597 | |
| W22 | 31.9563 | 98.8764 | S22 | 26.8880 | 99.9611 | |
| W23 | 32.4951 | 97.8555 | S23 | 27.9597 | 99.4127 | |
| W24 | 33.0128 | 97.2381 | S24 | 27.9936 | 99.5488 | |
| W25 | 32.9800 | 97.2405 | S25 | 29.0427 | 99.3772 | |
| W26 | 33.2240 | 96.4812 | S26 | 31.8666 | 98.1097 | |
| W27 | 32.9762 | 95.1020 | S27 | 32.4702 | 97.8994 | |
| W28 | 32.9004 | 95.2597 | S28 | 32.4951 | 97.8555 | |
| W29 | 36.8499 | 101.8731 | S29 | 33.0128 | 97.2381 | |
| W30 | 36.5093 | 101.8476 | S30 | 32.9800 | 97.2405 | |
| W31 | 36.9029 | 101.0161 | S31 | 32.9994 | 97.1530 | |
| W32 | 36.5459 | 100.7194 | S32 | 33.2240 | 96.4812 | |
| W33 | 36.5862 | 100.4869 | S33 | 33.7388 | 96.2361 | |
| W34 | 37.3574 | 97.3215 | S34 | 33.6151 | 95.1472 | |
| W35 | 37.3149 | 96.9262 | S35 | 32.9004 | 95.2597 | |
| W36 | 37.3166 | 96.8826 | S36 | 38.1580 | 102.512 | |
| W37 | 37.4626 | 95.6045 | S37 | 36.5092 | 101.8512 | |
| W38 | 37.4505 | 95.5430 | S38 | 37.1940 | 102.6125 | |
| W39 | 37.8555 | 95.4363 | S39 | 37.3553 | 97.3212 | |
| W40 | 37.8200 | 95.2100 | S40 | 37.4626 | 95.6045 | |
| W41 | 38.8000 | 94.3400 | S41 | 37.9100 | 95.1200 | |
| W42 | 39.9521 | 94.3352 | S42 | 38.8200 | 94.3400 | |
| W43 | 40.1420 | 94.6549 | S43 | 40.1159 | 94.6868 | |
| W44 | 39.7464 | 98.2916 | S44 | 39.7294 | 98.3033 | |
| W45 | 39.7480 | 98.2928 | S45 | 39.8019 | 98.3240 | |
| W46 | 39.7653 | 98.3067 | S46 | 39.1162 | 100.1361 | |
| W47 | 38.9559 | 100.4183 | S47 | 39.1569 | 99.3994 | |
| W48 | 38.9575 | 100.3925 | S48 | 38.8878 | 100.4997 | |
| W49 | 39.1503 | 99.2850 | S49 | 38.5736 | 100.7875 | |
| W50 | 39.1628 | 99.2861 | S50 | 38.2825 | 100.9064 | |
| W51 | 38.2003 | 100.9344 | S51 | 37.4492 | 101.3555 | |
| W52 | 38.0717 | 100.3964 | S52 | 37.0264 | 101.5508 | |
| W53 | 37.4566 | 101.4044 |
新窗口打开|下载CSV
土壤样品中微塑料分离使用密度分离法并选择饱和NaCl(1.2 g/cm3)作为浮选剂。每个采样点的3个土壤样品首先在50 ℃下烘24 h,烘干后的样品通过2 mm孔径的不锈钢筛,选取通过筛网的100 g土壤样本倒入1000 mL烧杯并加入900 mL浮选液。混合液搅拌30 min后静置24 h,收集上清液于干净的锥形瓶中。浮选过程重复3次以充分提取土壤中的微塑料,密度分离后上清液的化学降解和过滤过程与水样处理方法相同。
2.4 微塑料的观察和鉴定
将培养皿中风干后的滤膜在体视显微镜(重庆重光实业有限公司,UB100-CV320)下观察计数,分析统计微塑料的粒径、颜色、形状和数量。使用显微Raman光谱仪(Gloucestershire Bristol Gloucestershire,英国)对微塑料颗粒的聚合物组成进行进一步鉴定(入射激光波长设置为532 nm,拉曼光谱范围为0~3200/cm)。将塑料颗粒的光谱特征峰与Bruker参考库(Bruker Daltonic Inc,美国)中的标准数据库进行比较,最终确定聚合物类型。2.5 质量控制和数据分析
实验过程采取充分预防措施避免样品污染的可能。所有采样仪器(铁锹、不锈钢网筛、不锈钢杯)在使用前均用蒸馏水冲洗以避免交叉污染,所有玻璃器皿(玻璃烧杯、锥形烧瓶、培养皿和过滤装置等)在清洗后加热到400 ℃保持5 h以去除可能的有机物质,所有室内实验过程都在干净的层流柜中进行,且实验过程穿着棉质实验服和手套 (丁腈),玻璃器皿上覆盖锡箔以避免污染。在10份空白样品(蒸馏水)中检出3个微塑料(天然物质纤维粒子),浓度为(6.66±0.1)个/m3,占水样平均微塑料浓度的2.96%,因此最终样品的微塑料浓度以检测结果扣除空白样中的微塑料浓度为准。利用独立样本t检验对不同组别数据间的差异进行显著性检验,以p<0.05作为差异显著的标准。3 结果分析与讨论
3.1 水体微塑料
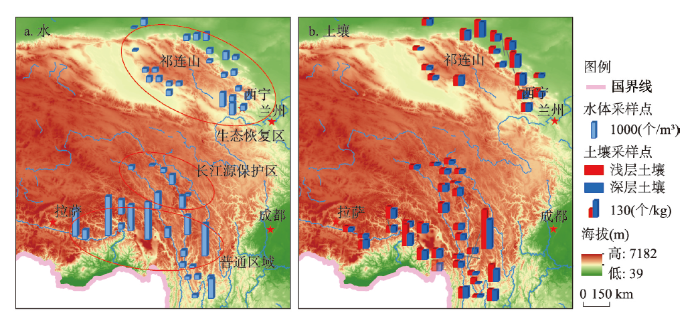
3.1.1 丰度和空间分布 本文中大多数水体样本都有微塑料检出(检出率达95%)(图1a)。其中南部水体中微塑料的丰度范围0~1916.67个/m3,平均值(±标准差)为(584.82±581.56)个/m3,而北部祁连山地区全部检出范围为66.67~733.33个/m3(平均值277.33个/m3)。Wong等[22]在中国台湾大寒河的调查中发现微塑料(>300 μm)平均丰度仅为(83.7±70.8)个/m3,Mao等[23]利用71 μm滤网对内蒙古乌梁素海的微塑料调查显示平均丰度高达4141个/m3(高于本研究中平均值一个数量级),Di等[17]对中国三峡水库地表水的检测结果显示微塑料丰度(>48 μm)范围为1597~12611个/m3,韩国纳克东河微塑料丰度平均值(±标准差)在(293±83)个/m3(上游)至(4760±5242)个/m3(下游)之间[24]。由于本文与上述研究采用类似实验方法,说明青藏高原地表水的微塑料含量低于大部分地区。图1
 新窗口打开|下载原图ZIP|生成PPT
图1水体和土壤中微塑料取样点及丰度
Fig. 1Sampling sites and abundance of microplastics in surface water and soil
研究区域内的水体微塑料丰度空间变化较大,从图1a可以看出,青藏高原南部的微塑料含量(平均值581.85个/m3)显著高于北部祁连山地区(平均值277.33个/m3)。已有研究证明,人口密度、到城市中心或工业活动中心的距离会影响微塑料在淡水环境中的分布[25,26]。研究中南部区域的采样点大部分位于县城附近,人口密度较大可能是微塑料浓度较高的原因。研究区最南边的边境地区和中部金沙江流域上游地区微塑料含量极低,部分样点甚至未检出,说明金沙江上游作为长江源的自然保护区人类活动干扰程度较低。与之类似,祁连山地区作为国家生态恢复重点区域在环境治理方面日趋严格,因此除了青海湖以外所有采样点的微塑料含量均低于高原南部地区。由此可见,生态保护区的建设能够显著降低当地表层水体的微塑料含量。
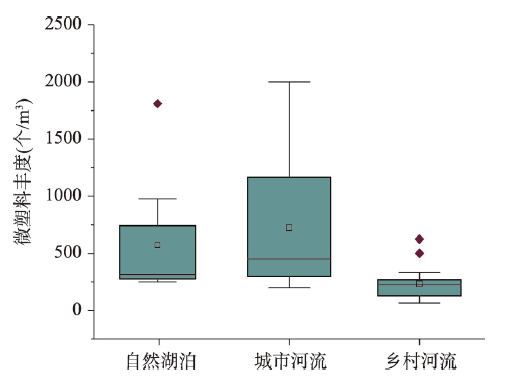
从图2可以看出,城市(县城以上)河流水体中的微塑料浓度显著高于乡村河流,而自然湖泊中微塑料的丰度平均值介于两者之间,反映了不同强度人类活动对水体微塑料含量的影响。本文中微塑料含量最高的河流样点位于德钦县城河道(1916.67个/m3),这可能与周边城市生活和医疗废水的排入有关,因为小尺寸的微塑料会通过城市污水管网进入河流[27],有的甚至是随污水直排入河,加之城市水体较低流速带来的累积效应,共同导致城市内部河流微塑料含量较高。我们在南北2个区域的湖泊中都检测到了较高浓度的微塑料,分别是位于公路边的然乌湖(1916.67个/m3)(南部区域)和著名旅游景点青海湖(733.33个/m3)(祁连山地区的最高浓度)。自然湖泊中较高的微塑料含量一方面是由于湖泊作为一个封闭环境是很多微塑料迁移的终点,另外由于这些湖泊多是旅游景点,旅游活动成为当地水体微塑料的重要来源。
图2
 新窗口打开|下载原图ZIP|生成PPT
图2不同类型水体中微塑料的丰度箱线图
注:菱形表示离群值,后图同。
Fig. 2The boxplot of microplastics abundance in different types of water bodies
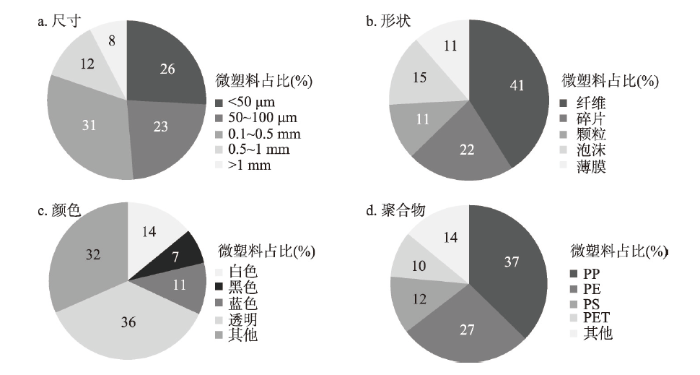
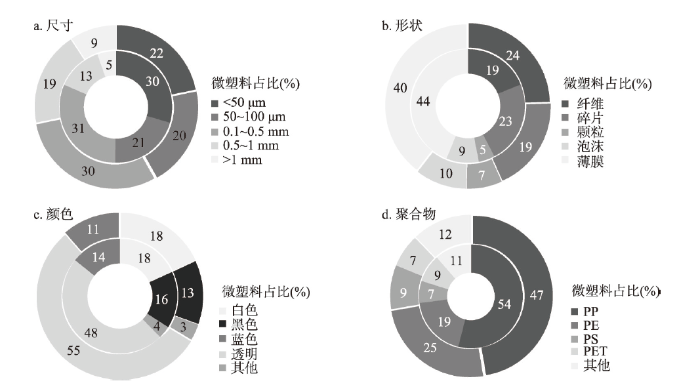
3.1.2 形态特征和化学组成 根据尺寸将微塑料分为5种类型:<50 μm、50~100 μm、100~500 μm、0.5~1 mm和>1 mm。从图3a可以看出,水体中微塑料以小尺寸为主,小于100 μm的微塑料占比接近一半(49%),其次100~500 μm的占比31%,而尺寸较大的微塑料(500~1000 μm和1~5 mm)则分别占到了12%和8%。
图3
 新窗口打开|下载原图ZIP|生成PPT
图3水体中不同类型微塑料特征
Fig. 3The percentage of different types of microplastics in water bodies
水体中微塑料的主要形状包括纤维、薄膜、碎片、颗粒和泡沫(图3b)。其中,纤维占主要地位(41%),这与大多数水体中微塑料的研究结果一致[9,10,11];接下来是碎片(22%)、泡沫(15%)、薄膜(11%)和颗粒(11%)。颜色方面以透明为主,平均比例为36%(图3c),其次为其他颜色(31%)、白色(14%)、蓝色(11%)和黑色(7%)。水体中大比例的微塑料被鉴定为聚丙烯(37%),其次为聚乙烯(27%)、其他类(14%)、聚苯乙烯(10%)和聚酯(10%)(图3d)。
3.2 土壤微塑料
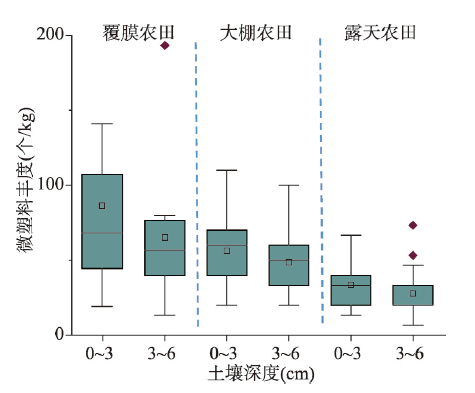
3.2.1 丰度和空间分布 52个土壤样品中有48个检测到微塑料(图4)。其中,南部地区有4个样点未检出,微塑料丰度总体范围是0~260个/kg(平均值为(48.57±41.03)个/kg),0~3 cm和3~6 cm层的丰度分别为(53.13±46.59)个/kg和(43.87±33.73)个/kg;北部祁连山地区样品全部检出,其范围是10~110个/kg(平均值为(47.94±25.06)个/kg),第一层和第二层的丰度分别为(52.86±40.55)个/kg和(43.75±30.57)个/kg。从图1b可以看出,土壤微塑料浓度最高值位于得荣县一处山谷的地膜梯田旁,0~3 cm和3~6 cm层土壤中微塑料含量分别达到260个/kg和193.33个/kg。未检测到微塑料的采样点均位于金沙江流域的4处裸露耕地。Liu等[19]在上海郊区农田土壤中检测到的微塑料浓度略高于本文结果,Blasing[28]在中国渤海附近滩涂土壤检测到微塑料浓度高达634个/kg,表明青藏高原土壤微塑料含量低于大部分已研究区域。图4
 新窗口打开|下载原图ZIP|生成PPT
图4不同类型土壤中的微塑料丰度
Fig. 4Microplastic abundances in different soil environments
从空间分布来看(图1b),金沙江上游的长江源保护区土壤微塑料浓度较低,南北2个区域含量接近(祁连山地区:(47.94±25.06)个/kg、南部(48.57±41.03)个/kg)(p>0.05)。相比于土壤,祁连山生态恢复区对水体微塑料问题的改善可能更明显。比较3种不同类型土壤的微塑料丰度(图4),从高到低分别是地膜覆盖土壤>大棚土壤>裸露土壤,且每类均是浅层土壤平均值高于深层土壤。不同耕地类型土壤微塑料含量的差异表明土地利用方式是影响土壤微塑料含量的重要原因。
3.2.2 微塑料特征 如图5a所示,土壤中微塑料的尺寸以100~500 μm占据绝对优势,分别占比30%(0~3 cm层)和31%(3~6 cm层)。而大于1 mm的大尺寸微塑料在不同土层中仅占9%(0~3 cm层)和5%(3~6 cm层)。薄膜在土壤中含量最高(图5b),纤维和碎片也广泛存在,其中纤维在第一层土中含量较高,可能源自长期农业活动过程中人类自身以及通过农业工具带入土壤的塑料降解。其他形状占比分别是纤维(24%)>碎片(19%)>泡沫(10%)>颗粒(7%)(0~3 cm层)和碎片(23%)>纤维(19%)>泡沫(9%)>颗粒(5%)(3~6 cm层)。透明色微塑料占比最高(图5c),在浅层和深层土壤中分别达到55%和48%;第一、二层土壤中其他颜色占比由大到小依次是白色 (18%、18%)、黑色(13%、16%)、其他(14%、11%)和蓝色(3%、4%)。聚合物鉴定表明土壤微塑料中含有大量聚乙烯(PE)(图5d),随后是聚酰胺(PA)、聚苯乙烯 (PS)、聚丙烯(PP)和其他。较高的聚乙烯含量可能与设施农业中塑料覆盖物的使用有关[29,30]。
图5
 新窗口打开|下载原图ZIP|生成PPT
图5土壤中不同类型微塑料特征
注:外圈为第一层土壤(0~3 cm层),内圈为第二层土壤(3~6 cm层)。
Fig. 5The percentage of different types of microplastics in soil
3.3 微塑料在水土环境中的差异分析
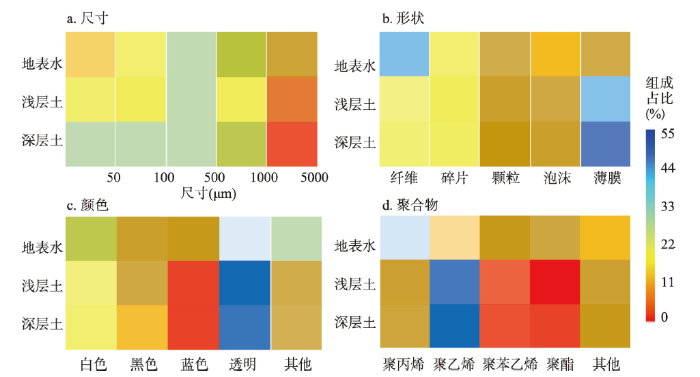
本文对水土样品中的微塑料组成进行比较(图6),可以发现土壤中聚乙烯的含量(50.5%)高于水中(27%),而水体中聚丙烯的含量最高(37%,图4d),说明水土环境中的微塑料来源可能不同。土壤中两个土层的微塑料组成非常相似,但第二层土壤中的小尺寸微塑料(<100 μm)占比更高(51%>42%),可能是由于农业耕作加速了土壤表层微塑料颗粒的破碎化,频繁的土壤翻动使得更多粒径小的塑料颗粒进入土壤下层。此外,无论水体还是土壤中的微塑料都是以透明和小尺寸为主,说明这些微塑料应该已经经过了一段时间的风化和降解,逐渐褪色至透明。两种介质中微塑料的相似特征在一定程度上也与其迁移过程有关,水体中的部分微塑料来自于地表径流带入的土壤微塑料,而土壤中的部分微塑料则来自于灌溉过程中的塑料制品使用(如灌溉水管)。图6
 新窗口打开|下载原图ZIP|生成PPT
图6微塑料在不同环境中的尺寸、形状、颜色和聚合物分布
Fig. 6Size, shape, color and polymer distribution of microplastics within different environments
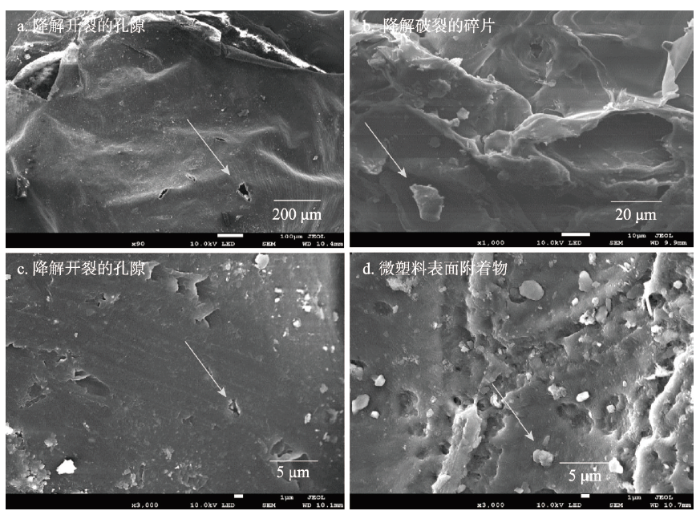
利用扫描电镜进一步观察微塑料薄膜的细微形貌(图7),发现表面有裂纹、孔隙等(图7a、7c),说明塑料薄膜可能是通过光氧化或土壤颗粒机械磨损等方式分解[31]。此外,扫描电镜照片显示,存在其他物质附着在微塑料表面(图7d),这与之前报道的水生环境中有微生物定植在微塑料表面的现象相吻合[32]。由于微塑料比表面积大且疏水性强,可以作为很多有机物质的载体甚至微塑料的附着体,因此表面附着的污染物质(如重金属、有机污染物等)可能对环境造成更大风险。同时,经风化后的微塑料表面会变得更加粗糙,其吸附污染物的能力也会随老化时间逐渐增加[33],因此经过长期风化的微塑料对生态环境的潜在危害尤其应给予重视。
图7
 新窗口打开|下载原图ZIP|生成PPT
图7塑料薄膜微塑料扫描电镜照片
Fig. 7Scanning electron microscope (SEM) images of the film microplastics
3.4 来源分析
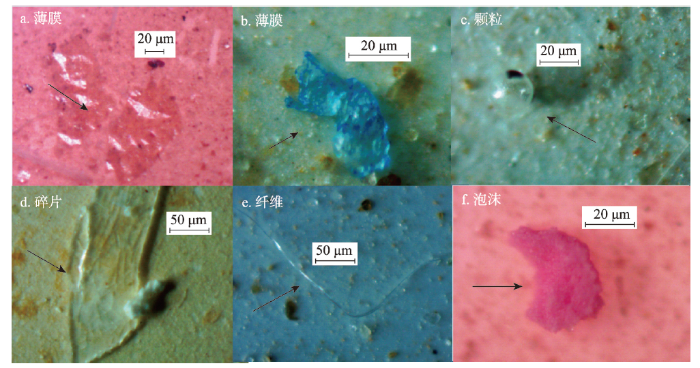
已有研究表明,微塑料丰度与城市化水平和人口密度显著相关[34]。在本文中,与城市相邻的河流中微塑料丰度较高,农村地区丰度较低(图2)。根据其形态特征和聚合物组成(图3、图5),可以推测其潜在来源。例如,水体中含量最高的是纤维,且80%以上均为聚丙烯和聚酯,多来自于合成纺织材料(服装、包装袋等)在日常消耗后运输至污水/废物处理厂,最终到达天然水体[35,36]。该结论也与Browne等[37]对家庭洗衣废水中的微塑料研究结果相符。除生活污水(特别是洗衣废水)排放引入外,水体中的微塑料碎片还可能来自于可重复使用塑料包装的破损、磨损和风化。尤其在几个湖泊采样点中发现大量低密度的聚丙烯,很可能来自游客衣物和所携带塑料包装的纤维脱落。例如,在微塑料丰度最高的然乌湖水样品中发现多种透明和黑色碎片,应来自于游客及其交通工具(轮胎摩擦)。此外,在没有人类居住和污水排放的自然河流中也检测到了微塑料的存在,可能来自于大气传输。水土环境中的典型微塑料照片如图8所示。土壤中的微塑料主要是呈透明薄膜状的聚乙烯,且覆膜农田和大棚农田的微塑料水平高于裸露耕地,说明土壤微塑料主要来自于农业塑料覆膜的破碎降解。Huang等[31]发现连续地膜覆盖5年、15年和24年的土壤中微塑料丰度随覆膜时间不断增加,说明地膜是陆地环境中大塑性和微塑性污染的重要来源。本文中的德钦县梯田附近检测到最高的微塑料含量,也是由于该地在近10年连续使用覆膜,进一步证明了塑料覆膜对土壤微塑料含量的重要贡献。由于微塑料会降低土壤饱和导水率,影响土壤微生物活性和丰度并最终影响土壤肥力[38,39],因此有必要对农业用地的残留可见塑料覆膜进行定期清理和有序管理,防止其在土壤中进一步降解污染环境。土壤微塑料的其他来源还包括:有机肥料、大气传输(干湿沉降)等。
图8
 新窗口打开|下载原图ZIP|生成PPT
图8典型微塑料照片
Fig. 8Photo of typical microplastics
4 结论与展望
本文基于青藏高原地区水土样品微塑料检测结果,分析了高原南部地区和东北部祁连山地区水土环境中的微塑料赋存情况并讨论了其潜在来源。研究发现:青藏高原微塑料含量低于已有相关研究的大部分地区,但城市和湖泊景点周边的地表水体以及接近塑料大棚和塑料覆膜的农田土壤中微塑料含量较高。水体中的微塑料多来自于洗衣废水和生活垃圾浸出,而土壤中的微塑料主要来自于农业覆膜的使用。不同区域微塑料的丰度差异表明生态保护区的建立能够显著降低水体微塑料含量,但对土壤微塑料的影响尚无明显证据。本文选取的105个采样点覆盖了青藏高原东南部和东北部约40万km2的空间范围,但受条件限制只采集了同一时期的样品,缺乏对不同代表性时段 (如旅游旺季和淡季、耕作期和休耕期、丰水期和枯水期)不同介质中微塑料赋存特征的全面调查。今后应根据不同时期水土环境和人类活动的特点制定持续性采样方案,并开展野外实验,确保微塑料浓度检测和来源分析的准确性。水体类型应进一步考虑各类生活、工业、农业和养殖污/废水的调查取样,从而更全面地了解微塑料组成并为后续塑料污染控制提供科学依据。
参考文献 原文顺序
文献年度倒序
文中引用次数倒序
被引期刊影响因子
PMID:15131299 [本文引用: 1]
DOI:S0269-7491(18)30985-0PMID:30096546 [本文引用: 1]

The Arctic is a unique and fragile ecosystem that needs to be preserved and protected. Despite its remoteness, plastic pollution has been documented in this region. In the coming years, it is likely to worsen since, with climate changes and the opening of new shipping routes, the human presence is going to increase in the whole area. Here, we investigated the presence of microplastics (MPs) in sub-surface water and in two mid-trophic level Arctic fishes collected off Northeast Greenland: the demersal bigeye sculpin, Triglops nybelini, and the pelagic polar cod, Boreogadus saida. Plastics debris were found in the water samples at a concentration of 2.4 items/m ±0.8 SD which is higher than in most seas at lower latitudes. Both fish species had eaten MPs with different proportion among the species, 34% for T. nybelini (n?=?71) and 18% for B. saida (n?=?85). The significant difference in the occurrence of MPs between the two species is likely a consequence of their feeding behavior and habitat. Polyethylene was the main plastic polymer for water samples (41%, n?=?17) and polyester (34%, n?=?156) for fish samples as analyzed by Fourier Transformed Infrared (FT-IR) spectroscopy. Our data underscore that the Arctic regions are turning into a hotspot for plastic pollution, and this calls urgently for precautionary measures.Copyright © 2018 Elsevier Ltd. All rights reserved.
DOI:S0043-1354(17)30664-4PMID:28846910 [本文引用: 1]
The growing awareness of the relevance of organic microcontaminants on the environment has led to a growing number of studies on attenuation of these compounds in wastewater treatment plants (WWTP) and rivers. However, the effects of the sampling strategies (frequency and duration of composite samples) on the attenuation estimates are largely unknown. Our goal was to assess how frequency and duration of composite samples influence uncertainty of the attenuation estimates in WWTPs and rivers. Furthermore, we also assessed how compound consumption rate and degradability influence uncertainty. The assessment was conducted through simulating the integrated wastewater system of Puigcerdà (NE Iberian Peninsula) using a sewer pattern generator and a coupled model of WWTP and river. Results showed that the sampling strategy is especially critical at the influent of WWTP, particularly when the number of toilet flushes containing the compound of interest is small (≤100 toilet flushes with compound day), and less critical at the effluent of the WWTP and in the river due to the mixing effects of the WWTP. For example, at the WWTP, when evaluating a compound that is present in 50 pulses·d using a sampling frequency of 15-min to collect a 24-h composite sample, the attenuation uncertainty can range from 94% (0% degradability) to 9% (90% degradability). The estimation of attenuation in rivers is less critical than in WWTPs, as the attenuation uncertainty was lower than 10% for all evaluated scenarios. Interestingly, the errors in the estimates of attenuation are usually lower than those of loads for most sampling strategies and compound characteristics (e.g. consumption and degradability), although the opposite occurs for compounds with low consumption and inappropriate sampling strategies at the WWTP. Hence, when designing a sampling campaign, one should consider the influence of compounds' consumption and degradability as well as the desired level of accuracy in attenuation estimations.Copyright © 2017 Elsevier Ltd. All rights reserved.
DOI:10.1016/j.envpol.2016.08.076URL [本文引用: 1]
URL [本文引用: 1]
DOI:10.1016/j.marpolbul.2012.12.010URL [本文引用: 1]
DOI:10.1016/j.marpolbul.2011.09.025URL [本文引用: 1]
DOI:10.1126/science.1192321URL [本文引用: 1]
DOI:10.1016/j.marpolbul.2012.01.011PMID:22325448 [本文引用: 2]
Neustonic microplastic and zooplankton abundance was determined in the North Western Mediterranean Sea during a summer cruise between July 9th and August 6th 2010, with a break between July 22 th and 25th due to a strong wind event. Ninety percent of the 40 stations contained microplastic particles (size 0.3-5mm) of various compositions: e.g., filaments, polystyrene, thin plastic films. An average concentration of 0.116 particles/m(2) was observed. The highest abundances (>0.36 particles/m(2)) were observed in shelf stations. The neustonic plastic particles concentrations were 5 times higher before than after the strong wind event which increased the mixing and the vertical repartition of plastic particles in the upper layers of the water column. The values rise in the same order of magnitude than in the North Pacific Gyre. The average ratio between microplastics and mesozooplankton weights was 0.5 for the whole survey and might induce a potential confusion for zooplankton feeders.Copyright © 2012 Elsevier Ltd. All rights reserved.
DOI:10.1021/acs.est.9b04814URL [本文引用: 2]
URL [本文引用: 2]
URL [本文引用: 1]
DOI:10.1016/j.marpolbul.2014.06.032URL [本文引用: 1]
[D].
[本文引用: 1]
[D].
[本文引用: 1]
PMID:31884260 [本文引用: 1]
Microplastics are widespread across the global oceans, yet the potential risks of the ubiquitous environmental contaminant to marine organisms has been less known. Accumulation of microplastics and associated contaminants in marine fish, may pose adverse impacts to human health via seafood consumption. This study evaluated microplastic contamination in 24 fish species collected from Beibu Gulf, one of the world's largest fishing grounds in South China Sea. Microplastics were detected in 12 fish species at an abundance of 0.027-1.000 items individual and found in fish stomach, intestines and gills with the count percentage of 57.7%, 34.6% and 7.7%, respectively. Transparent fibers were observed as the predominant microplastics, which might be ingested accidently by fish or transferred through other animals at lower trophic levels. Majority of microplastics were identified as polyester (44%) and nylon (38%), whereas polypropylene (6%), polyethylene (6%), and acrylics (6%) were also found. Relatively, higher microplastic abundances were found in demersal fish compared to the pelagic species. Overall, the abundance of microplastics was documented as relatively low in the commercial fish collected from the open water of Beibu Gulf, South China Sea.Copyright © 2019 Elsevier Ltd. All rights reserved.
DOI:10.1016/j.watres.2019.06.019URL [本文引用: 1]
DOI:10.1016/j.scitotenv.2017.10.150URL [本文引用: 2]
DOI:10.1016/j.ecoenv.2018.11.126URL [本文引用: 1]
DOI:10.1016/j.envpol.2018.07.051URL [本文引用: 2]
DOI:10.1016/j.scitotenv.2018.06.004URL [本文引用: 1]
DOI:10.1016/j.envpol.2019.03.022URL [本文引用: 1]
URL [本文引用: 1]
URL [本文引用: 1]
DOI:10.1016/j.watres.2019.05.053URL [本文引用: 1]
DOI:10.1016/j.marpolbul.2014.06.001URL [本文引用: 1]
PMID:24449922 [本文引用: 1]
Neuston samples were collected at 21 stations during an ~700 nautical mile (~1300 km) expedition in July 2012 in the Laurentian Great Lakes of the United States using a 333 μm mesh manta trawl and analyzed for plastic debris. Although the average abundance was approximately 43,000 microplastic particles/km², station 20, downstream from two major cities, contained over 466,000 particles/km², greater than all other stations combined. SEM analysis determined nearly 20% of particles less than 1 mm, which were initially identified as microplastic by visual observation, were aluminum silicate from coal ash. Many microplastic particles were multi-colored spheres, which were compared to, and are suspected to be, microbeads from consumer products containing microplastic particles of similar size, shape, texture and composition. The presence of microplastics and coal ash in these surface samples, which were most abundant where lake currents converge, are likely from nearby urban effluent and coal burning power plants.
DOI:10.1016/j.watres.2019.02.028URL [本文引用: 1]
DOI:10.1016/j.scitotenv.2017.08.086URL [本文引用: 1]
DOI:10.1016/j.polymdegradstab.2011.09.001URL [本文引用: 1]
DOI:10.1016/j.scitotenv.2015.03.142URL [本文引用: 1]
PMID:32041035 [本文引用: 2]
Plastic mulching is suspected to be a significant source of microplastics in terrestrial environments owing to its intensive application and improper disposal. However, there has been a comparative lack of studies examining this hypothesis. In this study, the occurrence of macroplastics in agricultural soils was investigated by analysing 384 soil samples collected from 19 provinces across China. Additionally, the abundance of microplastics was investigated in potential hotspots that have carried out plastic mulching for over 30 years. Macroplastic concentrations in the soil samples ranged from 0.1 to 324.5 kg/ha, with an average of 83.6 kg/ha; the concentrations were higher in western China than in eastern China. A highly significant linear correlation (R = 0.61) was found between the consumption of mulching film and the plastic residue in soils, indicating plastic film mulching may be a major source of macroplastics. The abundances of microplastic particles increased over time in the locations where plastic mulching was continuously employed, with concentrations of 80.3 ± 49.3, 308 ± 138.1, and 1075.6 ± 346.8 pieces/kg soil in fields with 5, 15, and 24 y of continuous mulching, respectively. Fourier transform infrared analyses revealed that the composition of the microplastics matched that of the mulching films, suggesting the microplastic particles originated from the mulching films. These findings confirm that plastic mulching is an important source of macroplastic and microplastic contamination in terrestrial environments. Further studies to investigate the microplastic hazards in soils are thus necessary.Copyright © 2020 Elsevier Ltd. All rights reserved.
DOI:10.1021/es401288xURL [本文引用: 1]
DOI:10.1016/j.envpol.2018.01.022URL [本文引用: 1]
DOI:10.1021/acs.est.9b01363URL [本文引用: 1]
DOI:10.1016/j.marpolbul.2016.01.006URL [本文引用: 1]
DOI:10.1016/j.scitotenv.2019.04.110URL [本文引用: 1]
DOI:10.1021/es201811sURL [本文引用: 1]
DOI:S0043-1354(18)30283-5PMID:29653356 [本文引用: 1]
Occurrence of microplastics (MPs) in the environment has attracted great attention as it has become a global concern. This review aims to systematically demonstrate the role of marine microplastic as a novel medium for environmental partitioning of chemicals in the ocean, which can cause toxic effects in the ecological environment. This review assimilated and analyzed available data published between 1972 and 2017 on the interaction between MPs and selected chemicals. Firstly, the review analyzes the occurrence of chemicals in MPs and outlines their distribution patterns. Then possible mechanisms of the interaction between MPs and organic chemicals and potential controlling factors were critically studied. Finally, the hazards of MPs and affiliated organic chemicals to marine organisms were shortly summarized.Copyright © 2018 Elsevier Ltd. All rights reserved.
URL [本文引用: 1]
