 ,1, 郑法川,2
Rank-size distribution of the modern China urban system based on the China Postal Atlas in 1936
WANG Zhe,1, ZHENG Fachuan,2通讯作者:
收稿日期:2020-05-28修回日期:2021-07-8
| 基金资助: |
Received:2020-05-28Revised:2021-07-8
| Fund supported: |
作者简介 About authors
王哲(1981-), 男, 山东东阿人, 博士, 副研究员, 主要从事历史经济地理研究。E-mail:

摘要
关键词:
Abstract
Keywords:
PDF (6083KB)元数据多维度评价相关文章导出EndNote|Ris|Bibtex收藏本文
本文引用格式
王哲, 郑法川. 中国近代城市体系的位序规模特征——基于1936年《中华民国邮政舆图》的分析. 地理学报, 2021, 76(8): 1910-1923 doi:10.11821/dlxb202108007
WANG Zhe, ZHENG Fachuan.
1 引言
Braudel认为“在西方,资本主义和城市实际上是合二为一的”[1],因此最早的严肃的城市研究始于对资本主义起源的学术讨论,Marx和Weber等西方思想家均投入了大量的研究精力[2,3]。城市之所以发展,是因为城市让人获得公共品、外部效应(如亲密关系)或工作场所[4],城市也提供了客户、知识溢出或技术外部性,为金融服务和法律援助提供了场所[5,6],那些超大型城市的出现则是因为特权阶层的存在[7]。以上研究给出了城市发展的理由,但无法解释城市在空间上的不均衡和城市体系存在的原因。城市体系研究中,齐普夫法则(Zipf's Law)是最受关注的理论之一,其在世界范围内的适用性得到了广泛的验证[8,9,10,11]。经济学规律一般很少会被抬高到“法则”的地位,虽然齐普夫法则缺乏扎实的微观经济学基础,但似乎已经成为一个经验性规律。而且齐普夫法则还具有极高的历史惰性和稳定性,比如,****基于准自然实验方法,对受到巨大外部冲击的城市体系(第二次世界大战期间德国和日本)进行研究,发现美军大规模连续轰炸也无法动摇城市体系的稳定性[12,13]。Krugman把这种客观规律的普遍存在与学术解释的无力,称之为“令人惊讶的经验规律和令人沮丧的(****)境遇”[14]。当然,也有大量的国家是例外,处于首位式或者中间态的位序规模分布[15]。
齐普夫法则成立的原因是什么?Gabaix等从随机增长的角度分析认为,如果不同城市以相同的期望值增速和方差随机增长,城市规模分布的极限收敛于齐普夫法则[16]。Krugman认为齐普夫法则成立可能是因为自然优势,城市跟其经济腹地之间的可达性发挥了重要作用[14]。这种解释容易理解,毕竟城市与腹地之间可达性受限于自然地理分形特征形成的河流和陆路,换句话说,如果自然界普遍存在幂律分布,城市体系分布势必受其本质影响。也有****认为齐普夫法则下的位序规模分布与中心地理论是一致的,其是城市体系最有可能的分布,代表了稳定状态平衡[17]。换句话说,位序规模的齐普夫法则和中心地理论,分别从统计规律和空间上描述了同一个稳定态。
目前来看,学界更多的工作是验证齐普夫法则,至于为什么它会存在,现在尚未有一锤定音的解释。国内经济地理学界和区域经济学界对城市体系的研究非常丰富而深入。使用的基础数据分为两种:① 城市属性数据(城市人口、夜间灯光等),研究成果较多,在此不再赘述;② 城市间交通起止点(Origin-Destination, OD)数据(货物流、航空流、信息流、金融流),其本质是“关系型数据”[18,19,20,21,22,23,24,25]。相对于当代城市体系和城市网络研究的深入,中国历史时期的城市体系研究显得较为薄弱。顾朝林等对中国近代城市体系进行了详细的梳理,使用的施坚雅(Skinner G W)和沈汝生等的数据,限于近代城市人口统计的不系统,并未采用当代城市地理常规方法进行彻底分析[26]。也有一些历史地理****利用城市秩等(地方官员俸禄额度)对西汉城市体系进行过研究,其基础数据以今日地理学研究的标准看略显粗糙[27,28]。
历史时期城市体系和城市网络研究的最大困难在于城市属性数据和城市间OD数据的双重缺乏。近代中国时期,如果无法获得系统可靠的城市人口统计,是否可以找到一个代用指标表达城市规模并分析其城市体系?这就是本文想解决的问题。
2 整体框架、技术路线和基础数据
2.1 整体框架
邮政在近代中国社会中具有指标意义,近代邮政承担了国内平信、挂号信、航空函件、讼诉文书、包裹(普通或特殊)、电报、代售印花税票、邮政储金(储蓄)、新闻(报)纸、明信片、贸易契、商务传单、存证信函等极为丰富的功能,是近代中国信息流和金融流的主要载体。同时,邮政是国家能力的重要表现,也是近代中国政府所能提供的为数不多的国家基础设施。类似地,19世纪美国经济的腾飞除了铁路拓展、土地确权和专利制度等原因以外,以美国邮政为代表的国家基础设施的建设对美国从一个农业国跃升为世界第一工业强国提供了巨大的帮助[29]。使用近代城市的邮政能力T值替代近代城市人口,本质是在单一指标——近代人口数据不系统、不可获得和可信性不高的情况下,使用间接指标(邮政点、邮路)对近代城市规模的多指标测度。目前城市地理学界也认为,把城市人口作为城市化水平指标这种方式,虽然是单一指标方法中最科学的,但也存在诸多局限性。学界多年前就开始对此进行反思,较多****认为,城市人口难以涵盖城市化的全部内涵,有可能造成不同地区之间,或同一地区不同时间测度的城市化水平具有不可比性。学界目前采用的“复合指标法”和“城市化发展质量的综合测度”等方法,测度城市化水平更为科学。本质上,“复合指标法”是希望使用尽量多的指标来拟合城市化水平。本文核心数据是邮政点和邮路核密度,两者结合,则可以将近代人口密度、城市经济水平、人均识字率等社会经济发展综合指标考虑进去。同时,近代中国城市的规模并非由其城市人口所决定,而是由其区域总人口所决定[30]。所以,本文所计算的近代中国城市的邮政能力T值定义为某城市及周边一定范围内邮政网点分布密度和邮路分布密度之和。
2.2 技术路线
本文使用城市及周边一定范围内邮政网点和邮路分布核密度之和,作为此城市规模的代用指标进行城市体系位序规模的分析。城市位序规模分布的一般数学表达式是:
式中:Pi是所有城市按照人口规模从大到小排序后第i位城市的人口;ri是第i位城市的位序;K和q是常数;q是斜率。对上式做对数变换得到:
本文使用城市邮政能力Ti值,代替人口数据Pi,列入计算过程:
式中:Ti是所有城市按照邮政能力值从大到小排序后第i位城市的邮政能力值;ri是第i位城市的位序;K和q是常数;q是斜率。
城市邮政能力Ti为邮政点核密度值Tip和邮路核密度值Tir之和:
式中:Tip和Tir分别计算,权重各设置为50%,为消除量纲影响,Tip和Tir均经过极差标准化处理。
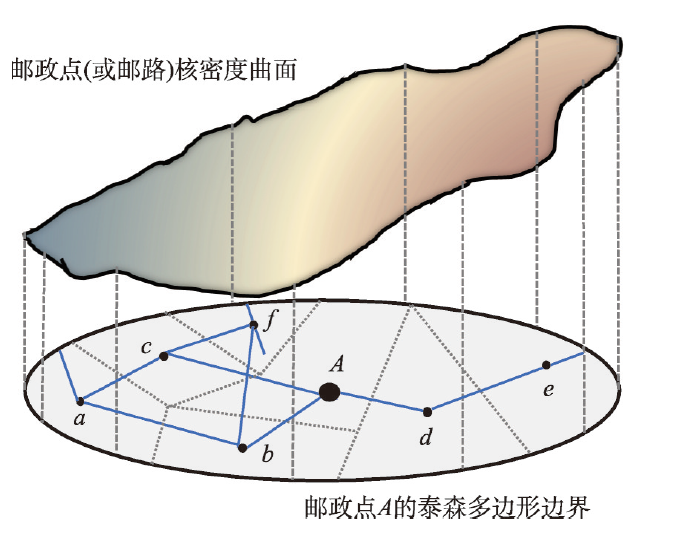
本文的技术路线以邮政点核密度计算过程为例(图1):① 邮政舆图数字化。基于ArcGIS对1936年的《中华民国邮政舆图》进行数字化。② 核密度分析。对点要素进行核密度(Kernel)计算,其权重(Population字段)以近代邮政各级网点收入门槛为准(后详),形成1个核密度曲面。③ 分层建立泰森多边形(Thiessen Polygon)。T值是其邮政服务范围内的核密度值之和。首先利用泰森多边形法,划定政点的邮政服务范围。4级邮政网点(邮政管理局和一二三等邮局),以近代行政区划底图为环境边界,形成4个泰森多边形图层。④ 分区统计(Zonal Statistics)。基于ArcGIS工具箱的分区统计法,在4个泰森多边形图层,分别获取核密度曲面被相应泰森多边形垂直投影切割后的区域统计值(sum值)。sum值本质为泰森多边形内核密度值之和。⑤ 赋值。使用核密度统计sum值作为邮政能力Tip值。邮路核密度Tir计算过程同上,其ArcGIS计算过程中的邮路权重由路线的运输频率决定。
图1
 新窗口打开|下载原图ZIP|生成PPT
图1邮政点A的邮政能力TA示意图
Fig. 1Schematic representation of postal capacity at postal point A
2.3 基础数据之一:邮政舆图及其处理
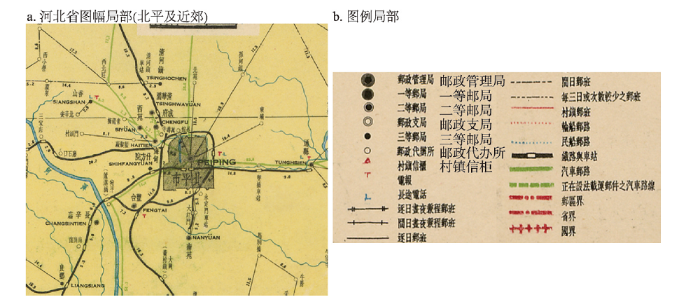
2.3.1 近代中国邮政舆图简介 1936年《中华民国邮政舆图》被张其昀认为是“二十年”(1915—1935年)中国地理学进步的标志之一[31]。其特点如下:① 最精美完善,也是1949年以前最后一版。② 时间代表性。1936年是中华人民共和国成立前国内经济发展的高峰。从1927年南京国民政府建立以后,工业增长速度年率达到6.7%(除满洲),国内的铁路和邮政事业,都有了巨大的进步[32]。1936年以后进入全面抗战阶段,社会经济发展被打断,1937年工业生产较1936年有18%的降低[33]。其点要素(图2a)从“邮政管理局”到“邮政代办所”分为6级,线要素即邮路分11种(图2b),按照运输频率或强度以及运输工具划分。图2
 新窗口打开|下载原图ZIP|生成PPT
图21936年《中华民国邮政舆图》局部
Fig. 2A glimpse of the China Postal Atlas in 1936
2.3.2 1936年邮政舆图数字化 邮政网点的精确定位是本文的核心问题。步骤为:① 利用“中国历史地理信息系统”中“1911年层数据”的省、府、县、村镇四级治所[34],凡可在其找到的同名点,则以前者经纬度为准。② 其余无法配对的点,尤其是1万多村镇邮政代办所依靠周围已定位之4级治所和近代大比例尺地形图确定其经纬度。③ 最终,6级邮政网点均得到定位,共计13240个,邮路共计407799 km(表1)。
Tab. 1
表1
表11936年中国邮政网点及官方设定标准
Tab. 1
| 等级 | 数量(个) | 官方设定标准 |
|---|---|---|
| 邮政管理局 | 29 | 省会或首都 |
| 一等邮局 | 47 | 营收5000元/月 |
| 支局 | 195 | 位于大城市内部;视同二等邮局 |
| 二等邮局 | 984 | 营收600元/月 |
| 三等邮局 | 1562 | 营收200元/月 |
| 邮政代办所 | 11536 | 营收27元/月 |
| 村镇信站 | 93 | 乡村邮递员所经村落 |
新窗口打开|下载CSV
2.4 基础数据之二:近代城市人口数据
近代中国城市人口的数据有两个缺点:① 城市样本量较小,一般不足200,横向对比,美国城市历史数据样本达700(1900—2000年)[36]。② 数据来源繁杂,并非基于政府普查,统计口径不一。近代城市人口的大部分都没有统计[37],有如下若干常见来源,如沈汝生[38]、中华续行委办会[39]、珀金斯[40]和施坚雅[41]。如胡焕庸的《中国人口之分布:附统计表与密度图》一文,利用的是民政厅调查、内政部报告、《中国经济周刊》、某省年鉴、邮政统计、《经济旬刊》等[42]。另外,曹树基认为无论是清代中期还是清代末年,中国都不存在一个统一的城市人口等级模式,上一级城市人口与下一级城市人口之间的关系,在区域之间表现为非常复杂的关系,城市等级与人口数量之间的关系呈现较大的差异[30]。这就更说明了为近代城市人口寻找代用指标衡量城市规模的必要性和迫切性。3 1936年邮政地理空间格局和城市体系
3.1 整体空间格局与“胡焕庸线”
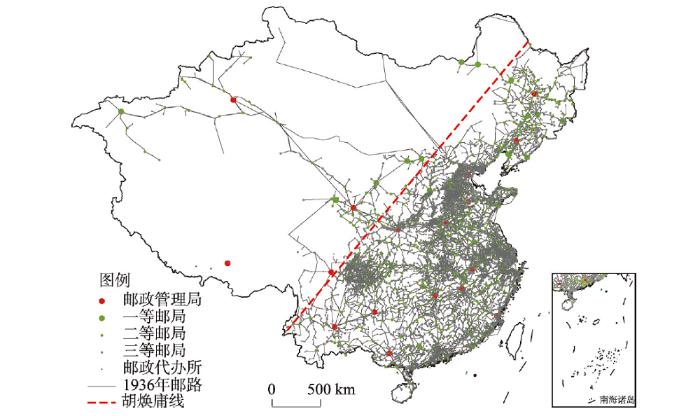
1936年邮政空间分布不均衡,“胡焕庸线”两侧分布差异明显,“胡焕庸线”西北半壁有邮政点415个,全国占比为3.1%,小于与“胡焕庸线”西北半壁的人口占比4%[43]。“胡焕庸线”西北半壁的高等级邮政网点如邮政管理局和一等邮局比例为17.2%和21.3%,远高于其人口占比4%,而低等级邮政网点(邮政代办所)2.4%,要远低于人口的比例,中间等级的邮政网点如二等邮局和三等邮局的占比与其人口比例4%极为接近。邮路方面,“胡焕庸线”西北半壁的邮路数3.5%略低于人口占比,但其邮路占全国总里程的比例高达13.7%(表2、图3)。
Tab. 2
表2
表21936年“胡焕庸线”西北半壁邮政网点和邮路比例
Tab. 2
| 邮政等级 | 数量(个) | “胡焕庸线”西北半壁数量(个) | “胡焕庸线”西北半壁占比(%) |
|---|---|---|---|
| 邮政管理局 | 29 | 5 | 17.2 |
| 一等邮局 | 47 | 10 | 21.3 |
| 支局 | 195 | 4 | 2.1 |
| 二等邮局 | 984 | 40 | 4.1 |
| 三等邮局 | 1562 | 66 | 4.2 |
| 邮政代办所 | 11536 | 272 | 2.4 |
| 村镇信站 | 93 | 18 | 19.4 |
| 邮路数 | 17604 | 613 | 3.5 |
| 邮路总里程(km) | 407799 | 55776 | 13.7 |
| 合计 | 13240 | 415 | 3.1 |
新窗口打开|下载CSV
图3
 新窗口打开|下载原图ZIP|生成PPT
图31936年中国邮政网点和邮路的空间分布
注:基于谭其骧《中国历史地图集》的近代中国地图制作。
Fig. 3Spatial distribution of postal points and routes in China in 1936
3.2 邮政聚集区
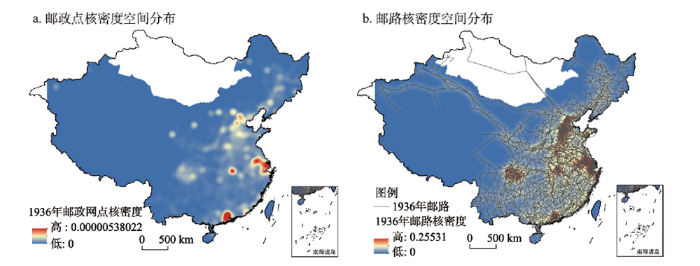
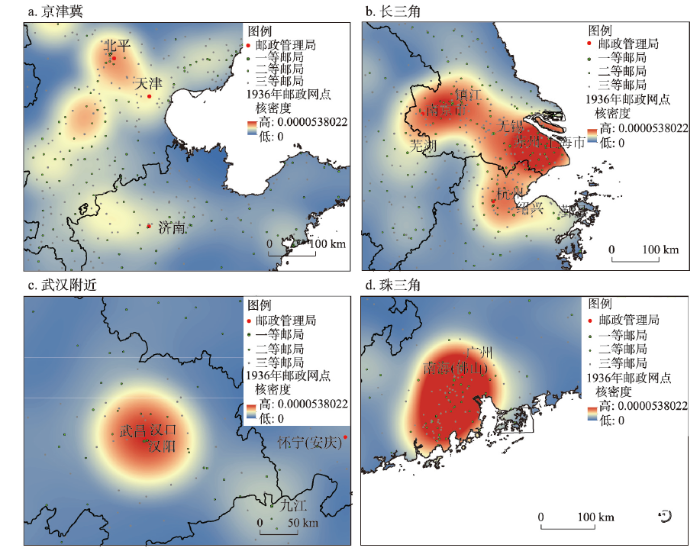
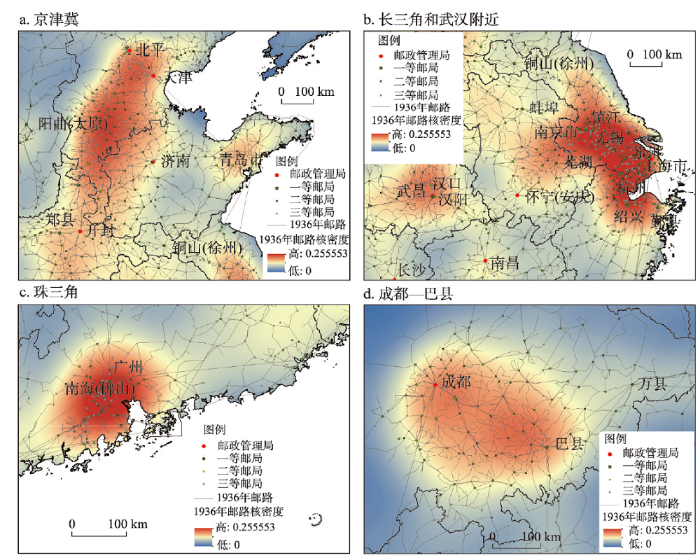
1936年邮政网点和邮路有5个较为密集的区域,本文称之为邮政聚集区,分别是京津冀邮政聚集区、长三角邮政聚集区、珠三角邮政聚集区、武汉邮政聚集区和成都—巴县(今重庆)邮政聚集区(图4),与目前的京津冀城市群、长三角城市群、珠三角城市群、长江中游城市群和成渝城市群有一定的空间相似性。图4
 新窗口打开|下载原图ZIP|生成PPT
图41936年中国邮政点和邮路核密度空间分布
注:基于谭其骧《中国历史地图集》的近代中国地图制作。
Fig. 4Spatial distribution of postal kernel density in China in 1936
京津冀邮政聚集区的地理范围为太行山以东,今黄河以北,原京杭大运河的南运河以西的平原地带,由永定河、滹沱河、大清河、子牙河等水系所流经的流域(图5a、图6a)。本区3个核心即北京、保定和天津三足鼎立,北京与天津基本融合,保定与北京、天津中间存在密度略低的低谷(邮路核密度图无低谷)。聚集区向南则可一直延伸到郑县(今郑州)和开封。东侧的较为清晰的边界是济南。总体形状不规则,大致呈椭圆状,长轴背靠太行山。
图5
 新窗口打开|下载原图ZIP|生成PPT
图51936年中国邮政聚集区邮政网点及核密度分布
Fig. 5Postal points and kernel density by region in China in 1936
图6
 新窗口打开|下载原图ZIP|生成PPT
图61936年中国邮政聚集区邮路及核密度分布
Fig. 6Postal routes and kernel density by region in China in 1936
长三角邮政聚集区横跨3省,主体核心区在江苏和浙江,西侧进入安徽省东部今马鞍山、芜湖等地(图5b、图6b)。江苏省部分是传统意义上的“苏南”区域加上江北的今南通、扬州和泰州。“苏南”区域以1908年开通的沪宁铁路和江南运河为主干,连接了南京、常州、无锡、苏州和上海。1914年通车的沪杭甬铁路连接的嘉兴、杭州、绍兴、宁波构成了浙江部分的主干。珠三角邮政聚集区是邮政网点最密集区域(图5d、图6c),也是一个省域聚集区。主体为珠江三角洲河口,核心是今广州、深圳、佛山、江门、珠海和中山,次一级核心包括今肇庆、清远和惠州。珠三角邮政聚集区,沿着西江和北江等上溯到河流中下游山间谷地,本聚集区呈现近似圆形空间范围,直径约300 km。武汉邮政聚集区是一个省域聚集区(图5c、图6b),核心为近代武汉三镇,整体呈三角形,聚集区东南侧包括今鄂州、黄石和黄冈,西北侧至今孝感。聚集区直径约300 km,密度极值低于长三角和京津冀。1936年邮路核密度分布上(邮政点核密度分布不明显),成都—巴县(今重庆)的邮政聚集区呈现双核结构(图6d),其密度稍弱于长三角和京津冀。双核融为一体,基本覆盖了四川平原的大部分面积。
3.3 城市体系位序规模分布
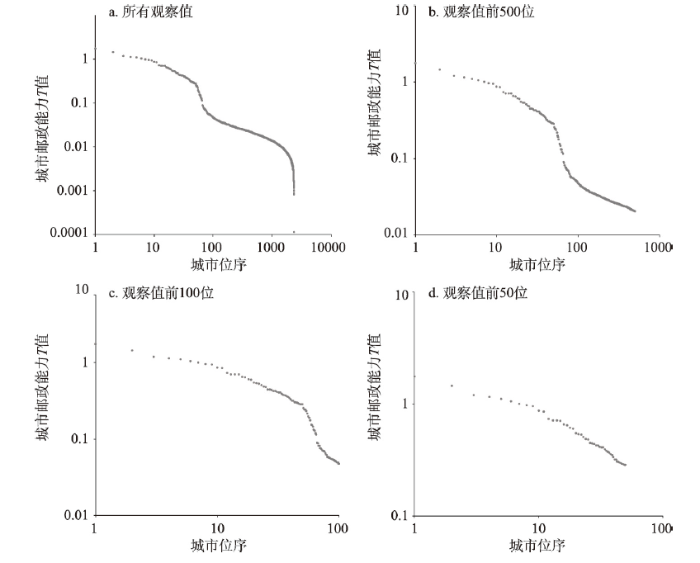
利用上文获取的邮政能力T值作为城市规模代用指标,进行位序规模分布的分析。由图7可见,在所有观察值分布曲线上,位序规模曲线存在2个斜率绝对值突然增大的突变点,整体呈“三段式”分布,“头部”城市数据点分布非常线性。图7
 新窗口打开|下载原图ZIP|生成PPT
图7基于邮政能力T值的近代中国城市位序规模
Fig. 7Rank-size distribution of modern China cities based on postal capability value T
在4个观察范围内(所有观察值、前500位、前100位、前50位),其位序规模分布回归曲线的相关系数R绝对值都在0.89以上,处于公认区间,位序规模分布符合齐普夫法则(表3),但R绝对值不及1949年以后,观察值前50位城市的回归系数R绝对值已经相当接近1949年后指标。
Tab. 3
表3
表3基于邮政能力T值的近代中国城市位序规模分析结果及与1949年后的对比
Tab. 3
| 观察范围 | q(斜率) | R(相关系数) |
|---|---|---|
| 所有观察值 | -0.85 | -0.941 |
| 观察值前500位城市 | -0.94 | -0.953 |
| 观察值前100位城市 | -1.02 | -0.898 |
| 观察值前50位城市 | -0.53 | -0.974 |
| 1953年(中国前100位城市) | -0.91 | -0.990 |
| 1963年(中国前100位城市) | -0.84 | -0.992 |
| 1973年(中国前100位城市) | -0.81 | -0.991 |
新窗口打开|下载CSV
3.4 1936年城市位序规模分布与齐普夫法则
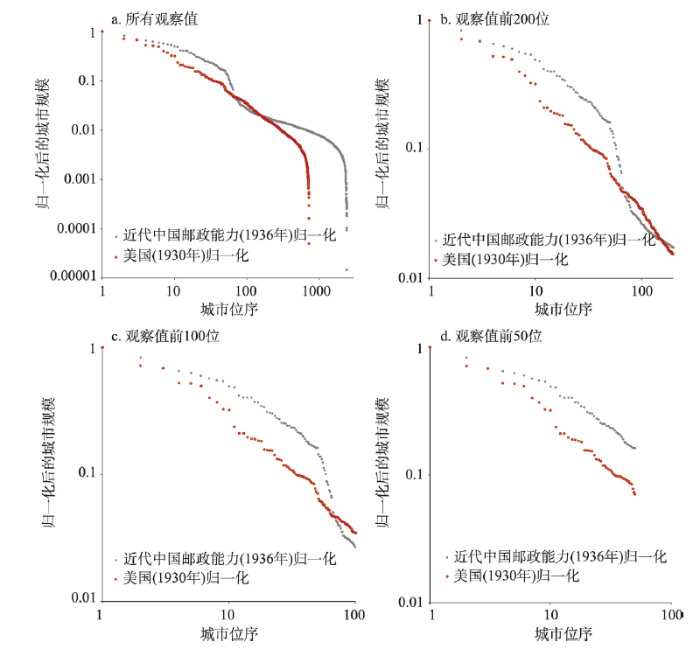
中国和美国作为地理空间近似的2个宏观区域,在以往研究中经常会作为比较对象。城市人口和城市邮政能力T值量纲不一致,本文对二者进行归一化处理,置于一个坐标系进行对比。因为1930年美国城市位序规模已经非常接近标准齐普夫法则的分布曲线(图8),因此可借机观察1936年中国城市位序规模分布与标准齐普夫法则曲线的异同。图8
 新窗口打开|下载原图ZIP|生成PPT
图81936年中国和1930年美国城市位序规模分布比较
Fig. 8City rank-size distribution based in value T in comparison of modern China in 1936 with the USA in 1930
根据图8和表4,可得如下结论:① 齐普夫法则。1936年中国位序规模曲线相关系数R绝对值达0.941(所有观察值)和0.974(前50位城市),处于齐普夫法则公认区间范围。②“三段式”曲线。1936年中国位序规模曲线的最大特征是“三段式”而非常见的“两段式”。“两段式”曲线常见于欧美各国和当下中国城市体系研究的成果中。在前人研究中有一个统一的现象,“尾部”城市在某个规模城市以下曲线开始剧烈下坠,偏离回归线,越靠近“头部”则区域回归系数越好,如在中美前50位城市的分布中(图8d)。③ “中段凹陷”。1936年中国位序规模曲线出现了独特的“中段凹陷”(图8a、图9b)。处于“头部”“尾部”之间的中等规模城市,在位序n = 50到n = 500之间发生了快速的城市规模降低,从曲线上看表现为在n = 50处以极大的斜率(绝对值)迅速远离齐普夫标准曲线。
Tab. 4
表4
表4基于邮政能力T值的近代中国城市位序规模分析结果及美国的对比
Tab. 4
| 观察范围 | q(斜率) | R(相关系数) |
|---|---|---|
| 所有观察值(近代中国邮政) | -0.850 | -0.9411 |
| 所有观察值(美国1930年) | -1.179 | -0.9512 |
| 观察值前50位城市(近代中国邮政) | -0.531 | -0.9736 |
| 观察值前50位城市(美国1930年) | -0.743 | -0.9894 |
新窗口打开|下载CSV
图9
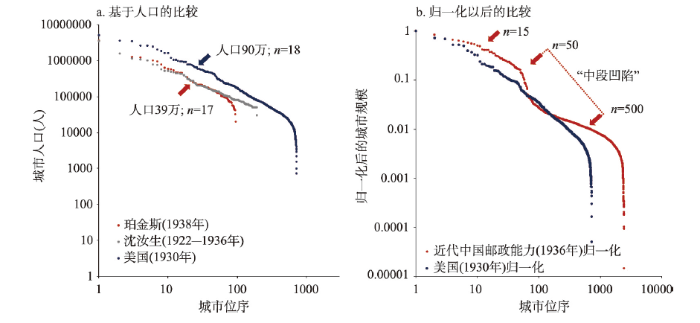 新窗口打开|下载原图ZIP|生成PPT
图9近代中美城市位序规模分布比较
Fig. 9City rank-size distribution of postal capability value T and urban population in comparison of China and the USA
⑤ 转捩点。图9a中,中美其中一个转捩点均发生在位序n = 17~18的城市,人口分别是39万和90万,这个转捩点是中美曲线斜率发生巨变的开始。此点之前,相邻城市之间人口规模差距较大,此点之后,相邻城市之间人口差距变小。在归一化的位序规模曲线上(图9b),这样的趋势更为明显,中国前2个转捩点发生在位序n = 15和n = 50处。n = 50以后,中国城市规模整体上有一个可观的降低,相邻城市规模开始接近。
4 近代中国邮政地理格局和城市体系特征
4.1 邮政地理格局和聚集区
中国1936年有5个邮政聚集区,每个区域有其独特的形成机理和历史背景。4.1.1 京津冀邮政聚集区 本区地貌基底是一系列山前古冲积扇和冲积洪积小平原,是历代北方人口最为密集的区域,也是黄河文明的核心区。本聚集区的形成,有赖于保定、北京和天津这3个特殊城市。北京无需多言,保定于清康熙八年(1669年)设为直隶巡抚(总督)所在,并一直延续到清朝末年。天津也短暂承担过直隶省省会之责,同时作为近代北方经济金融中心和最大港口,汇集了大量工业、金融业、新闻业以及诸多下野军政要员,是北方物流、信息流和金融流的汇聚地。
4.1.2 长三角邮政聚集区 本区形成受益于太湖碟形洼地及周边大量的运河、圩田、湖荡泾浜等,结合本地悠久的船舶出行习惯,明清以来发达的手工业,近代密度最高的城镇分布,文化昌明居民识字率较高,也有利于邮政事业的推广。
4.1.3 珠三角邮政聚集区 本区的形成受益于其开埠最早,广州享有近90年的一口通商的独特外贸经济地位。珠江三角洲特殊的“八口入海”,河网密度高达0.81 km/km2 [44],特别利于民船运输邮件。本区及周边是传统侨乡,海外侨民定期向国内家属写信和汇款,以前仰仗本地民间邮政机构——侨批局,后来国营邮政蚕食侨批网点,形成了极为密集的邮政网点分布。
4.1.4 武汉邮政聚集区 本区的形成有赖于武汉自1861年开埠以来成为近代中国内陆最大贸易港,其茶叶、桐油、棉花、猪鬃等大量出口,周边地区均被不同程度纳入了其贸易网络,区域存在大量的贸易流、金融流和价格信息的流动。
4.1.5 成都—巴县邮政聚集区 本区呈现成都—巴县(今重庆)的显著双核结构,形成原因是近代成都平原的高人口密度,良好灌溉条件下的高亩产量,人均收入和生活水平高于同时期的华北。较之华北和长三角,成都平原在清末历次残酷的农民起义(捻军、太平天国和义和团)和中华民国军阀战争中受影响较少,没有发生大的人口损失和基层社会崩塌。上述邮政聚集区,与当下的城市群空间分布,具有一定的空间契合度。说明城市群的形成在近代中国工业化起步阶段就已奠定。邮政聚集区是中国长期历史经济发展“层累叠加”的外在宏观景观。同时,20世纪30年代左右,中华民国政府颁布的《特别市组织法》和《市组织法》也在一定程度上促使近代中国从城乡合洽走向城乡分治,部分特别市(直辖市或院辖市)如天津和上海,在城市自治的过程中获取了实效,在城市税收和城市基础建设上成绩斐然,从某种程度上促进了当地邮政的发展。在1948年统计的直辖市中,除了西安和东北城市,其余城市均处于本文的邮政聚集区内。
4.1.6 邮政聚集区与人口分布 近代邮政与人口分布并不呈现绝对的空间相关。“胡焕庸线”西北半壁的邮政网点占比较之人口占比略低,而高等级邮政网点和邮路里程的占比远高于其人口占比。这说明因国防和边疆民族地区治理的原因,近代邮政的网络骨干已经前瞻性地在陕西、甘肃、宁夏、新疆等地架设。“胡焕庸线”西北半壁的邮政代办所密度远低于东部,显示基层市场活力方面的巨大东西差距。
4.2 1936年中国城市体系特征
4.2.1 整体符合齐普夫法则 邮政能力T值可视为近代中国城市规模的最佳代用指标,基于其的城市体系位序规模分布相关系数R处于公认区间,符合齐普夫法则。4.2.2 1936年“头部”城市“偏大” 1936年中国“头部”城市规模较中等城市“偏大”,本质原因是19世纪中叶以来开埠通商造成的某些沿海沿江城市的超常规发展。但此制度因素是有偏的,大量的中等城市和“尾部”城市还维持原有规模,导致所有样本范围的回归曲线大致维持未开埠之前的斜率(开埠城市约50个仅占样本总体的2%)。除了极少的“头部”城市,1936年的城市位序规模分布,反映的是14世纪以来明清两朝六百多年中央集权对整个国家城市网络的空间塑造。
4.2.3 独特的“中段凹陷” “三段式”分布说明近代中国城市体系存在巨大的统计断裂和区域差异。近代中国交通基础设施的落后,长途大宗贸易不发达,区域经济发展水平存在巨大差异,国内统一市场缺失,反映在统计结果上就是曲线多次突兀断裂。近代中国海关统计记载,1930年有海关进出口统计的港口是46个,1920年是49个,1910年是48个。铁路铺设又强化了这种优势,使其城市规模迅速与未开埠的城市拉开差距,因此,在n = 50到n = 500之间出现了“中段凹陷”。为何在以城市人口为指标的位序规模分布曲线未能见到如此明显的“中段凹陷”(图9a),原因是传统的近代中国城市人口数据样本量仅在200左右,未能囊括“中段凹陷”发生的区间。设想如果近代中国城市人口也有2000左右的样本量的话,也许能观察到这个现象。
5 结论和讨论
为解决近代中国城市体系研究中城市人口数据的缺乏和不系统,本文使用1936年邮政舆图邮政网点和邮路的空间分布核密度之和,作为城市人口的代用指标,借此界定近代城市的城市规模而进行城市体系研究。本文主要研究结论为:① 从整体样本或“头部”城市的回归结果来看,近代中国城市体系位序规模分布符合齐普夫法则。② 依靠邮政能力T值,分析近代中国城市体系的样本量从以往的200左右(城市人口)增加到2360,让****能第一次观察到近代中国城市位序规模曲线存在的独特的“中段凹陷”现象。“中段凹陷”客观上造成了“三段式”分布,本质原因是19世纪中叶以来50个左右“头部”城市开埠的外部冲击。③ 1936年邮政网点和邮路的空间分布地理格局与人口分布有部分的空间相关性。京津冀、长三角、珠三角、武汉和成都—巴县5个邮政聚集区的形成,均有独特地理和社会经济综合原因,其空间地理格局整体上与当下城市群分布具有一定相似性。④ 鉴于近代城市人口数据的不可获得性和不系统,邮政能力T值可视为近代中国城市规模的最佳代用指标。
以往的人口地理研究认定中国近代城市规模与城市人口之间的统计关系比较模糊,全国统一建模可能不大。本文另辟蹊径,绕过近代城市人口模型,使用经济活动的外在景观和物理载体——邮政网点和邮路的密度来界定城市规模,这与现代灯光数据的使用存在某些学理相似性。作者后续将继续数字化1903年开始的其他邮政舆图,建立一个近代邮政网络的面板数据,在近代信息和交通可达性方面对近代中国经济地理做定量化的分析,补全中国经济地理长时段研究的某些空白。
参考文献 原文顺序
文献年度倒序
文中引用次数倒序
被引期刊影响因子
[本文引用: 1]
[本文引用: 1]
[本文引用: 1]
[本文引用: 1]
[本文引用: 1]
[本文引用: 1]
DOI:10.1111/jors.1988.28.issue-4URL [本文引用: 1]
DOI:10.1086/261856URL [本文引用: 1]
[本文引用: 1]
DOI:10.2307/2118515URL [本文引用: 1]
DOI:10.1111/1467-9787.00129URL [本文引用: 1]
DOI:10.1162/003355399556133URL [本文引用: 1]
DOI:10.1016/j.apgeog.2016.08.002URL [本文引用: 1]
DOI:10.11821/xb201012005 [本文引用: 1]

Over the process of rapid urbanization, how will massive rural-urban migrants be distributed in the cities with different sizes? It is one of key issues that we must face when we set out the strategies for socio-economic development at the country level. The United States is the largest developed country in the world. In 1910, the level of urbanization in the US had reached that of today's China. Based on the census data of the US, using the Rank-Size rule, this study analyzed the evolution of the urban system of the country in the 20<sup>th</sup> century, which may provide some implications for the development of the urban system in China and urban planning at the macro level. Results show that: between 1900 and 1970, the value of sloping index (q) presents a rising trend, which implies that the big cities grew more rapidly, compared with the small and medium-sized cities. And in the last 30 years of the 20<sup>th</sup> century, the cities developed more evenly. In China, during the process of rapid urbanization (1985-2000), urban population in small cities grew faster than that in big cities. Comparison of the urban systems of two countries shows that the large cities in China will have a big potential in terms of urban population growth.
[本文引用: 1]
DOI:10.1093/jeg/4.2.201URL [本文引用: 1]
DOI:10.1257/000282802762024502URL [本文引用: 1]
DOI:10.1006/jjie.1996.0023URL [本文引用: 2]
DOI:10.1086/449923URL [本文引用: 1]
[本文引用: 1]
DOI:10.1080/09595237300185241URL [本文引用: 1]
[本文引用: 1]
[本文引用: 1]
[本文引用: 1]
[本文引用: 1]
[本文引用: 1]
[本文引用: 1]
DOI:10.11821/dlxb201602007 [本文引用: 1]
The evolution of inter-city network influenced by globalization and information technology has become a hot topic in city and urban research. This study tries to explore the evolution of nodal hierarchy and communities in inter-city network based on passenger train network during the rapid development period of High-speed Railway (HSR) in China since 2003. Results indicate that: (1) the evolved HSR network in China enlarged the disparities of weighted degree centrality between regions, but decreased the disparities of that between communities, and led to an increasing concentrated city hierarchy with fewer cities having high centrality value, and a growing similarity between the city hierarchies measured by the passenger train network and by city attributes (such as population and GDP); (2) the city hierarchy measured by passenger train network followed a rank-size distribution in the national and regional levels, as well as in some communities. (3) Spatially, cities with higher hierarchy in passenger train network and larger improvement in weighted centrality indicator were mostly located in the eastern region or the areas with the distance to the nearest HSR stations below 50 km, developed economy and high population density; the cities in 2013 could be divided into 14 communities, including the communities with cities mainly located along Beijing-Shanghai, Beijing-Wuhan and Wuhan-Chengdu, Wuhan-Guangzhou, Beijing-Jiujiang, Hangzhou-Xiamen, Lanzhou-Urumqi trunk rail lines, and located in Northeast China, Shanxi Province, Inner Mongolia. (4) The evolution of communities was mostly influenced by the natural environment and administrative areas, especially by the development of HSR network.
[本文引用: 1]
[本文引用: 1]
[本文引用: 1]
[本文引用: 1]
[本文引用: 1]
DOI:10.11821/dlxb201904005 [本文引用: 1]
At present, there is a consistency that the focus of urban system research has shifted from the hierarchical to network paradigm. Based on an extensive review of existing studies, this paper investigates the shift of paradigm of China's urban system research since the 1980s, and discusses the development situation, main problems, and key topics of related research on urban network. The results show that: (1) After 2010, the amount of literature about urban network has increased dramatically and become the mainstream of urban system research, while the number of studies on the hierarchy system decreased. And the existing studies mainly focus on the urban system at national level and in the Yangtze River Delta. (2) The attribute data to a certain extent compensate for the lack of data in the early urban network research. Meanwhile, although the gravity model was widely used in these studies, its suitability is gradually decreasing. (3) In contrast, the relationship data have attracted scholars' attention, which is mainly applied to the urban system research from three perspectives: enterprise organization, traffic flow and information flow. However, due to the limitations of different perspectives, a comprehensive research on multiple perspectives has gradually become imperative. (4) The identification analysis has been the dominant theme of urban network research. Visualization analysis and design for urban system is mainly supported by directed unprivileged networks and undirected weighted networks. (5) Five important aspects of urban network research in future include adjusting the research framework of national urban network, examining the physical connections between cities directly without traffic data, measuring the horizontal linkages between the outside enterprises, analyzing and visualizing the directed weighted network research, and intensifying the geospatial characteristics of urban network research.
[本文引用: 1]
DOI:10.11821/dlxb201912005 [本文引用: 1]
Transportation connection has always been one of the important perspectives of studying spatial cascading systems and urban systems. Based on the timetable data in 2018 of inter-city coach, high-speed train and aviation, this paper builds networks of the three modes of transportation in China. Through the methods of the city-pair connectivity and community detection, this paper compares the spatial structure and linkage systems of multi-traffic flow network and reveals the geospatial constraints. The research results show that: (1) Different modes of transportation are suitable for portraying urban systems on different spatial and administrative scales. Inter-city coaches are constrained by the provincial administrative boundaries. High-speed train network shows the effect of corridors especially along the main trunks. The aviation network reflects the spatial relationship at the national scale. (2) From the perspective of the direct accessibility, there is a large spatial overlap between inter-city coaches and high-speed trains, and the market of inter-city coaches is obviously squeezed in recent years. For air transport, its frequency advantage mainly concentrates on the city-pairs with a long distance. The competition and complementarity of the three modes of transportation have a great impact on the urban system and are useful for the understanding of the spatial cascading system. (3) Geographical space, infrastructure space and administrative space constraint and management system are important factors affecting the transportation networks. Inter-city coach network and high-speed train network are obviously affected by distance attenuation effects, and they present significant community structures in the two networks, but their communities have different spatial characteristics. However, air transport does not follow the constraint of distance attenuation, and there is not an obvious community structure in the network. Factors related to the passenger transport market, such as social and economic links and tourism resources, play the important roles in the aviation network structure.
[本文引用: 1]
[本文引用: 1]
[本文引用: 1]
[本文引用: 1]
[本文引用: 1]
[本文引用: 1]
[本文引用: 1]
DOI:10.1257/aer.p20161071URL [本文引用: 1]
[本文引用: 2]
[本文引用: 2]
[本文引用: 1]
[本文引用: 1]
[本文引用: 1]
[本文引用: 1]
DOI:10.1017/S0022050700070704URL [本文引用: 1]
[本文引用: 1]
[本文引用: 1]
[本文引用: 1]
URL [本文引用: 1]
[本文引用: 1]
[本文引用: 1]
[本文引用: 1]
[本文引用: 1]
[本文引用: 1]
[本文引用: 1]
[本文引用: 1]
[本文引用: 1]
[本文引用: 1]
DOI:10.11821/xb193502002 [本文引用: 1]
China is the most populous country of the world.Besides her great numberof population she has also the most densely inhabited regions which are notcomparable with any other country of the world.
[本文引用: 1]
DOI:10.11821/dlxb201602001 [本文引用: 1]
In November, 2014, Premier Li Keqiang raised a problem about Hu Huanyong population line (hereinafter referred to as "Hu line"), when visiting the exhibition of sciences of human settlements in National Museum of China, which was called "Premier's Question" by the press. Hence, Hu line has become a highlight currently, and aroused great controversy and different views. Aiming at such dilemma of cognition, this paper gives a general review of the origins of Hu line, which was put forward by the famous population geographer Hu Huanyong in 1935, under the background of a debate on the surplus of domestic population. Based on population census data and GIS platform, the paper analyzes the change of population scale, proportion and density in both southeast and northwest sides of Hu line. The results indicate that the population urbanization and migration do not change the pattern of population distribution determined by Hu line. On such basis, the pattern that the population density of southeast part is large, while that of northwest part is relatively small will not radically change over a longer period, and the pattern that urban agglomeration is mainly located in southeast part as well. The long-term existence of Hu line depends on integrated physical geographical conditions, like climate. At the meantime, this paper argues that the core issue of the Premier's concern is solvable, by positive policy guidance and reasonable spatial organization. It is definitely promising for western China to realize a higher level of modernization and a better quality of urbanization, and central region as well.
[本文引用: 1]
[本文引用: 1]
[本文引用: 1]
