 ,1,2, 庄大方1, 何剑锋,1, 文可戈1,2
Spatiotemporal variations in remote sensing phenology of vegetation and its responses to temperature change of boreal forest in tundra-taiga transitional zone in the Eastern Siberia
LI Cheng,1,2, ZHUANG Dafang1, HE Jianfeng,1, WEN Kege1,2通讯作者:
收稿日期:2020-05-7修回日期:2021-04-27网络出版日期:2021-07-25
| 基金资助: |
Received:2020-05-7Revised:2021-04-27Online:2021-07-25
| Fund supported: |
作者简介 About authors
李程(1991-), 男, 山东沾化人, 博士生, 主要从事植被物候变化遥感监测方面的研究。E-mail:

摘要
关键词:
Abstract
Keywords:
PDF (7751KB)元数据多维度评价相关文章导出EndNote|Ris|Bibtex收藏本文
本文引用格式
李程, 庄大方, 何剑锋, 文可戈. 东西伯利亚苔原—泰加林过渡带植被遥感物候时空特征及其对气温变化的响应. 地理学报[J], 2021, 76(7): 1634-1648 doi:10.11821/dlxb202107005
LI Cheng, ZHUANG Dafang, HE Jianfeng, WEN Kege.
1 引言
物候是动植物受气象、水文、土壤等环境因素影响而产生的周期性变化现象,其中,气象因素影响最为显著。其不仅反映了当时的天气,更反映了一段时期内的天气积累,是气候变化的重要指示器。通过对物候的研究可以了解当地气候的变化以及它对动植物的影响[1,2,3,4,5,6,7,8]。俎佳星等通过研究1982—2006年间东北地区不同植被物候变化与气候因子之间的关系,发现春季温度与阔叶林、针叶林和草甸春季物候呈负相关,前一年冬季温度与草原春季物候呈正相关[9]。茹皮亚·西拉尔等通过研究2001—2016年间新疆棉花物候时空变化与气温之间的关系,发现棉花的生长季开始期与生长季初期平均温度呈显著性相关[10]。马晓芳等研究发现在全球气候变暖的背景下,青藏高原植被返青期和枯黄期的年际变化整体呈提前的趋势,生长季长度呈增长的趋势[11]。物候观测方法方面,传统的物候观测为科研人员在物候观测站点按照一定标准,目视观测、实地记录当地植物的生长荣枯、动物的来往生育[12]。该方法可以较为真实准确地记录当地物候现象。但受限于人力物力,难以深入自然条件较为恶劣的地区,尤其是人类活动较少的东西伯利亚苔原—泰加林过渡带地区,物候记录较少。而该地区的物候现象却恰恰可以揭示近似纯自然条件下动植物生长发育变化对气候变化的响应[13,14,15,16,17]。
遥感观测技术以其覆盖广、观测时间长、周期性强、空间连续,且能够完整反映植被生长季变化过程及年际变化差异等特点,为物候观测提供了新的手段[18,19,20,21,22,23,24]。Justice等提出可以利用NOAA-AVHRR时间序列数据通过计算NDVI提取植被生长季参数等物候指标,实现了对全球植被物候的监测[25]。Lloyd提出阈值法,并将NDVI大于等于0.099作为判定植被生长季起始期的阈值[26]。Fischer通过设定固定阈值确定植被生长季起始与结束期[27]。但是,由于不同研究区土地覆盖类型、土壤背景、光照等条件不同,植被生长季起始期的阈值不尽相同。White等人基于相对绿度指数(Relative Greenness Indexes, RGI)提出季节中点法(Seasonal Medial Nodes, SMN),将RGI = 0.5设为植被生长季起始期和结束期的动态阈值[28]。动态阈值法消除了不同地区环境背景值的差异,可以更准确地提取植被生长季参数。Jonsson等对全球多个地区生长季NDVI曲线进行研究,认为将生长季起始期阈值设定为10%具有较强的普适性,尤其适用于植被生长季短暂而迅速的北半球高纬度地区[29]。
2000年以后,更高空间分辨率、更多光谱波段、更短重访周期的MODIS数据逐渐取代了NOAA-AVHRR成为遥感监测物候变化研究的主要数据源[30]。基于MODIS原始数据生产各类专题数据产品更为相关研究提供了便利。但是北半球高纬度地区气候寒冷,积雪覆盖较多,Picard等指出在西伯利亚地区,由于积雪覆盖的干扰,利用高分辨卫星遥感影像提取植被物候可能会产生较大的误差[31]。中国科学院资源环境科学数据中心基于MODIS MOD09数据,重新进行云、雪及阴影精细检测,同时,采用基准生长合成,以及优化的插值算法,生产的NDVI产品可以较好地体现植被的真实生长过程[32,33,34]。
但是MODIS-NDVI数据为8 d周期的散点数据,其中不可避免地会受到大气扰动、土地利用变化等因素的干扰而出现不符合植被生长规律的异常点,需要通过一定拟合函数拟合出植被生长季NDVI变化曲线。Reed等利用中值滤波法减少云的干扰以提取植被生长季信息,但是该方法会破坏植被绿度信息[35]。Chen等利用Savitzky-Golay平滑滤波拟合法对中国北方SPOT-NDVI数据进行平滑拟合,提取了生长季参数,取得了较好的结果,但是S-G拟合法为窗式拟合,而北半球高纬度地区生长季较短,可供拟合的点较少,难以获取较为准确的拟合结果[36,37]。Jonsson等考虑到植被生长季曲线左右的不对称性,在高斯滤波的基础上提出了不对称高斯滤波拟合法,对生长季曲线的左右两边分别拟合提取到了更加符合植被自然生长规律的生长季曲线[38]。
本文以2000—2017年MODIS-NDVI时间序列产品为基础,对比S-G平滑滤波拟合、不对称高斯拟合和Double-Logistic拟合等多种时间序列拟合函数,优选出更适合北半球高纬度地区植被NDVI变化曲线的不对称高斯拟合方法,结合动态阈值法,提取了4种反映东西伯利亚苔原—泰加林过渡带植被生长状况的遥感物候参数:生长季起始期(Start of Season, SOS)、生长季结束期(End of Season, EOS)、生长季中期(Middle of Season, MOS)和生长季长度(Length of Season, LOS),并对每种参数的长时间序列数据进行线性回归,分析了各生长季参数的时空变化格局。同时结合该研究区气温变化的时空分布,研究了各植被生长季参数变化与气温变化之间的响应关系。
2 研究区概况与数据来源
2.1 研究区概况
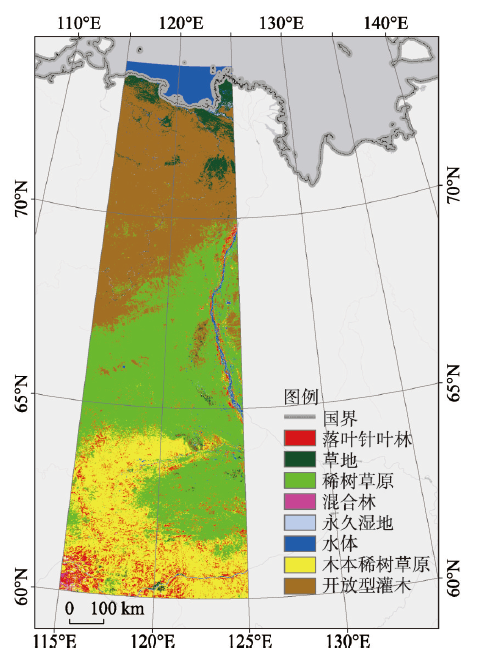
研究区样带位于中西伯利亚东部,西起115°E、东至125°E,北临北冰洋拉普捷夫海域(Laptev Sea)的奥列尼奥克湾(Olenok Gulf),南至60°N(图1)。全区都在俄罗斯萨哈(雅库特)共和国境内。北部是北西伯利亚低地东端,海拔最低,南部山区海拔500 m以上,样带平均海拔约300 m,整体东南高、西北低。样带内的主要河流有流经西北部地区的奥列尼奥克河,东部的勒拿河(Lena River)及其支流以及自西向东的维柳伊河(Vilyui River)。该区域具有典型的大陆性气候特征,冬夏温差较大,昼夜温度变化剧烈,降水量小。夏季短暂而冬季漫长,其中最北端冬季可长达9~10个月。春季升温和秋季降温的过程都十分短暂而迅速。图1
 新窗口打开|下载原图ZIP|生成PPT
图1研究区范围及土地覆盖类型
Fig. 1Scope and land cover types of the study area
该区域植被覆盖类型自北向南依次为苔原、草原、低矮灌木和落叶针叶林,无大型城市等建筑用地,人类活动影响较小。因此可忽略人类活动的影响,而认为此区域植被遥感物候的特征变化是近似自然变率所致。
2.2 数据采集与处理
2.2.1 NDVI数据集 本文使用中国科学院资源环境科学数据中心MODIS-NDVI数据产品,空间分辨率0.005°,时间分辨率8 d。时间跨度自2000—2017年,其中每年46幅影像,共计828幅影像。使用前,利用数据聚合方法进行影像预处理,将原始0.005°分辨率的MODIS-NDVI数据产品,重采样至0.01°,并转换为tif格式。2.2.2 土地覆盖类型数据 本文所使用的土地覆盖类型数据为MODIS土地覆盖产品——MCD12Q1,下载于USGS官网。此数据是根据一年的Terra和Aqua观测数据经过处理而得到的研究区土地覆盖的类型。土地覆盖数据集中包含了17个主要土地覆盖类型,根据国际地圈生物圈计划(IGBP),划分为11个自然植被类型,3个土地开发和镶嵌的地类和3个非草木土地类型类(图1)。
由于研究区植被覆被类型在2000—2017年间变化较小,本文假设研究区的植被类型在研究时段内没有变化。因此使用研究起始期的MCD12Q1土地覆盖产品,网格范围包括:h19v01、h20v01、h21v01、h22v01、h21v02、h22v02、h23v02、h24v02、h23v03、h24v03、h25v03、h26v03共计12幅数据产品。利用MRT软件对原始数据进行拼接裁剪,得到与研究区空间一致的土地覆盖类型数据。
2.2.3 气温数据 本文所使用的气象数据为CRU气象数据集。该数据集由英国东英格利亚大学气候研究小组整合全球已有的若干知名气象数据库,重构而成的空间分辨率0.5°×0.5°的网格气候数据集,覆盖全球陆地。全部的数据集时间跨度自1901年至今。本文利用研究区NDVI数据对全球CRU数据进行掩膜,截取与NDVI数据时空范围一致的以月份为步进的月平均气温数据,即2000—2017年共18 a,每年12期,共计216期气温数据,并利用最邻近法将数据重采样至0.01°,使其分辨率与NDVI时间序列数据相同。
在MATLAB中,利用线性回归分析提取出18 a逐月平均气温的线性变化趋势,按照各回归系数计算2000—2017年间气温的变化差值,以此表征逐月平均气温的线性变化趋势,公式如下:
式中:k表示气温变化斜率;b表示气温变化回归方程的截距;n表示时间跨度;i表示第i年;x表示年份;y表示气温;
2.3 关键遥感物候因子提取
本文研究的4种植被生长季参数定义如表1所示,对NDVI时间序列进行拟合重构,模拟出植被生长季曲线,并从中提取4种关键物候因子。Tab. 1
表1
表1植被生长季遥感物候参数定义
Tab. 1
| 植被生长季参数 | 参数定义 |
|---|---|
| 生长季起始期(SOS) | 在NDVI生长曲线的左侧,当NDVI值从最小值上升到年际NDVI振幅的10%时所对应的天数 |
| 生长季结束期(EOS) | 在NDVI生长曲线的右侧,当NDVI值从最大值下降到年际NDVI振幅的10%时所对应的天数 |
| 生长季中期(MOS) | 曲线左侧NDVI上升到年际振幅80%时对应的天数到曲线右侧NDVI下降到年际振幅80%时对应的天数,之间天数的中点 |
| 生长季长度(LOS) | 从生长季起始期到生长季结束期之间的天数 |
新窗口打开|下载CSV
在北半球高纬度地区,植被的每个生长季周期的NDVI曲线是不对称的,生长季前期变化更为迅速,而后期较为缓慢。因此,本文选取适用于分段拟合的不对称高斯函数,以NDVI最大值为中线,对植被每个生长季周期分前后2个半段分别进行拟合。
不对称高斯函数拟合方法由Jonsson于2002年提出[38],该方法的核心是使用分段高斯函数组合来模拟植被的生长季变化,每1个组合代表1次植被生长季盛衰的过程,最后再通过平滑算法连接各个高斯拟合曲线,以此实现时间序列的重建。其公式为:
式中:
其中:
利用TIMESAT软件提取平滑后数据的植被生长季参数SOS、EOS、MOS和LOS。根据北半球高纬度地区植被生长季较短、生长起始期和结束期较迅速的特点,阈值的设定应遵循以下原则:① 这个值要尽可能接近冬季NDVI背景值;② 这个值不能过小而导致噪声,污染NDVI信号。综合前人研究结果,将生长季起始、结束期动态阈值设定为曲线最大值、最小值差值的10%[29]。然后,对每种植被生长季参数分别做线性回归分析,并计算该参数18 a间的线性变化差值。结合气温变化情况,对各植被生长季参数变化明显的区域中的所有像元进行趋势分析,变化趋势显著性通过P值进行检验。
3 结果与分析
3.1 气温变化趋势的分布格局
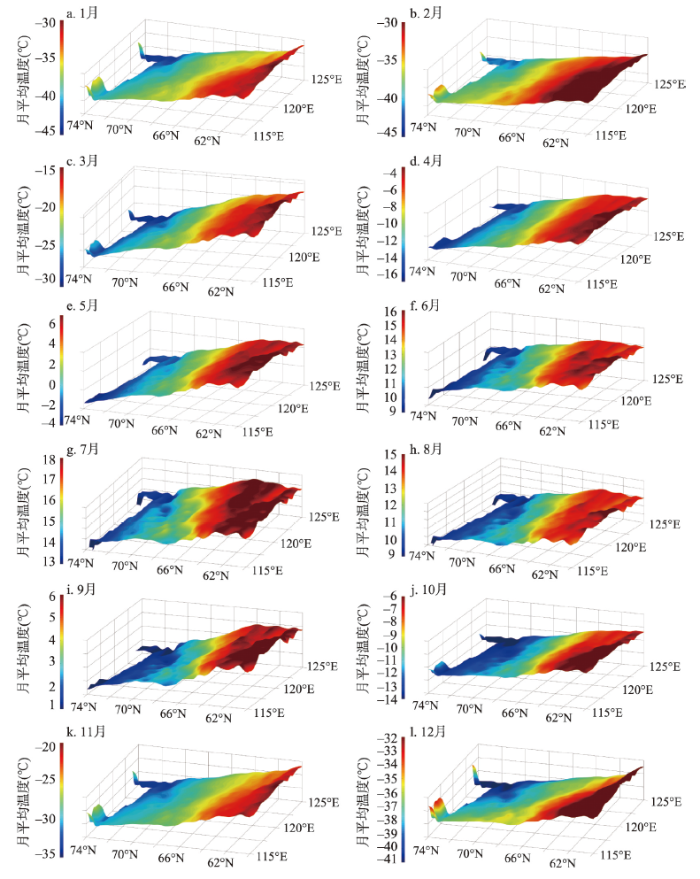
3.1.1 2000—2017年间逐月月平均气温时空分布特征 根据计算所得的18 a月平均气温绘制0.01°×0.01°分辨率的3D空间分布图(图2)。研究区各月的平均气温空间分布特征基本相似,具有明显的纬度梯度变化特征,气温随纬度升高而降低。南北两端温差的状况,存在月度的时间变化规律。最大温差出现在11月、2月、3月,温差高达14 ℃。12月、1月南北温差约10 ℃。自4月开始,南北温差逐渐减小,9月达到最小,约为5 ℃,之后温差又逐渐增大。但是值得注意的是,研究区的最北端的北冰洋海岸带地区,气温随纬度升高而升高,尤其是在12月至次年1月,该特征更为明显。图2
 新窗口打开|下载原图ZIP|生成PPT
图22000—2017年研究区逐月月平均气温空间分布
Fig. 2Spatial distribution of monthly average temperature in the study area from 2000 to 2017
气温随经度变化的特征则存在明显的月度时间变化规律。10月至次年2月,同纬度地区西部温度高于东部温度,12月至次年1月倾斜度最大,即温差最大;自3月起,同纬度地区温度逐渐变为东高西低,即西部温度低于东部温度;7月至8月倾斜度最大,即温差最大。同时,可以看到,在5—10月的植被生长季期间,气温分布的不均匀性比其他时期更大,在研究区的最南端,这种不均匀性最为明显。
3.1.2 2000—2017年间逐月月平均气温线性变化趋势的时空分布特征 对研究区2000—2017年间的逐月平均气温做线性回归分析(图3)。研究区内7月份整体区域、8月份西北部区域、9月份西南部区域以及11月份67°N以南区域出现1 ℃以内的降温。其他月份,研究区内整体出现气温明显的增温现象。但是不同时间、不同区域气温变化的幅度不同。
图3
 新窗口打开|下载原图ZIP|生成PPT
图32000—2017年逐月月平均气温的线性回归变化趋势空间分布
Fig. 3Linear trend of monthly average temperature in the study area from 2000 to 2017 per month
温度的季节变化规律表现为:春季(3—5月)、冬季(12月至次年2月)增温幅度最高,夏季(6—8月)气温变化幅度较小,秋季(9—11月)气温变化幅度差异较大。其中3—4月气温升高趋势最为显著,平均升温3~4 ℃,最高升温达5 ℃;1月、10月和12月平均升温2~3 ℃,最高升温达4 ℃;2月、5月和6月平均升温1~2 ℃;8月、9月和11月既有升温又有降温现象,但变化幅度不大,平均在±1 ℃以内;7月整体呈小幅降温趋势,平均降温0.5~1 ℃。
气温变化的空间分布表现为:1月、3月、4月和10月,北部升温幅度明显高于南部;2月和12月,南部升温幅度高于北部;5月和6月,研究区内升温幅度差异较小;7月,研究区中部降温幅度最大,可达1 ℃,南部和北部降温幅度较小,约0.5 ℃左右;8月,呈西北部降温,东南部升温趋势;9月,呈西南部降温,北部升温趋势;11月,呈南部降温,北部升温趋势。
对植被生长期4—10月的温度变化进行详细分析发现:4月研究区65°N以南区域虽然升温幅度较其他区域低,但升温幅度高达2~3 ℃;5月气温升高幅度最大的区域位于65°N~70°N附近,最高达2 ℃;6月气温升高幅度最大的区域位于62°N和69°N附近,最高达2 ℃,而研究区最北端升温幅度小于1 ℃;7月65°N附近降温幅度最大达1 ℃;8月研究区西北部呈降温趋势,降温幅度约0.5 ℃,东南部呈升温趋势,升温幅度约0.5 ℃;9月研究区北部呈升温趋势,升温幅度1~2 ℃,西南部呈降温趋势,降温幅度约0.5 ℃;10月整体呈北高南低趋势,研究区最北端升温幅度最高可达3.5 ℃,62°N~70°N之间升温幅度2~3 ℃,60°N~62°N之间升温幅度1~2 ℃,西南部升温幅度最小,约0.3 ℃。
3.2 物候因子变化趋势的时空变化格局及气温变化响应分析
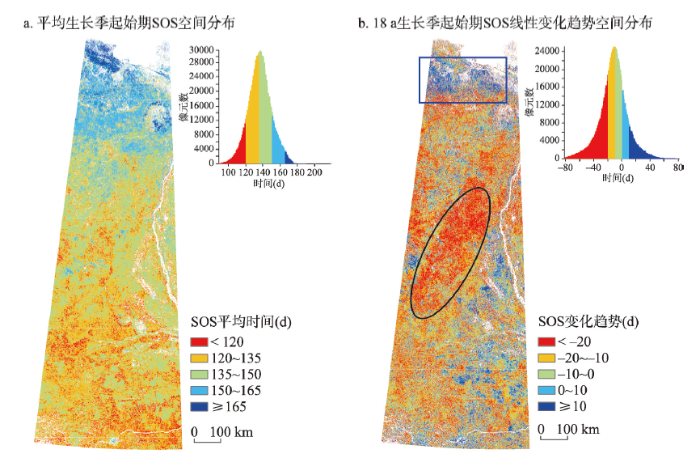
3.2.1 生长季起始期(SOS) 研究区内SOS主要集中在第120~150 d,SOS值为140 d左右最为集中,即5月的中下旬为研究区的植被生长季起始期(图4a)。整体来看,研究区内SOS具有明显的纬度分布规律,SOS自南向北越来越晚。SOS最早的区域为研究区的西南部的柳伊河平原地区,最晚的区域为奥利尼奥克湾沿岸。图4
 新窗口打开|下载原图ZIP|生成PPT
图42000—2017年研究区生长季起始期SOS空间分布
注:b图蓝色框为SOS推迟区域;黑色椭圆为SOS提前最大区域。
Fig. 4Spatial feature of average SOS in the study area from 2000 to 2017
从图4b中可以看出,研究区域内SOS都普遍呈现出了提前的趋势(P = 0.0403),18 a的线性趋势变化幅度在-20~5 d之间,只有位于研究区最北端北冰洋沿岸区域出现了推迟的现象(如图4b蓝色长方形框内)。SOS变化趋势的空间分布随纬度变化而呈现出一定的规律,在64°N~67°N和71°N左右(如图4b黑色椭圆形框内),SOS提前达到最大值,最多可达25 d左右。SOS空间变换分布在经度方向同样存在差异,这种趋势差异表现为:在研究区西部剧烈,而东部地区较平缓。
结合气温变化趋势可以看出,64°N以南区域,SOS变化主要受4—5月气温变化影响,提前5~15 d,其中与对应区域4月份温度的平均相关系数r = -0.4498,最大相关系数为r = -0.8762;与5月份对应区域温度的平均相关系数r = -0.5631,最大相关系数为r = -0.9275。64°N~72°N之间,SOS变化主要受5—6月气温变化影响,提前10~25 d,其中与5月份对应区域温度的平均相关系数r = -0.5993,最大相关系数达r = -0.9357;与6月份对应区域温度的平均相关系数r = -0.4003,最大相关系数为r = -0.8580。研究区最北端的北冰洋沿岸(图6b蓝色框范围),出现部分地区SOS推后15~25 d现象,与7月对应区域气温呈下降趋势有关,平均相关系数r = -0.4975,最大相关系数为r = -0.8137。
图6
 新窗口打开|下载原图ZIP|生成PPT
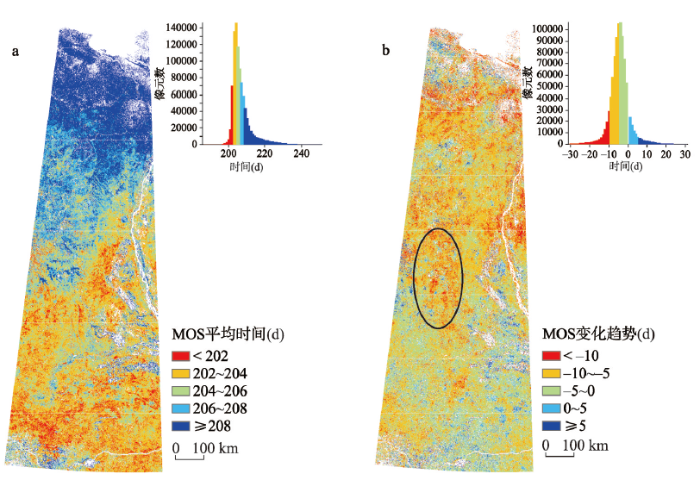
图62000—2017年研究区生长季中期MOS空间分布
注:b图黑色椭圆为MOS提前幅度最大区域。
Fig. 6Spatial feature of MOS in the study area from 2000 to 2017
综合来看,4—6月气温均呈较大幅度升高的65°N~68°N中部区域(图4b黑色框范围)SOS提前最多(P = 0.0205),达20~25 d。
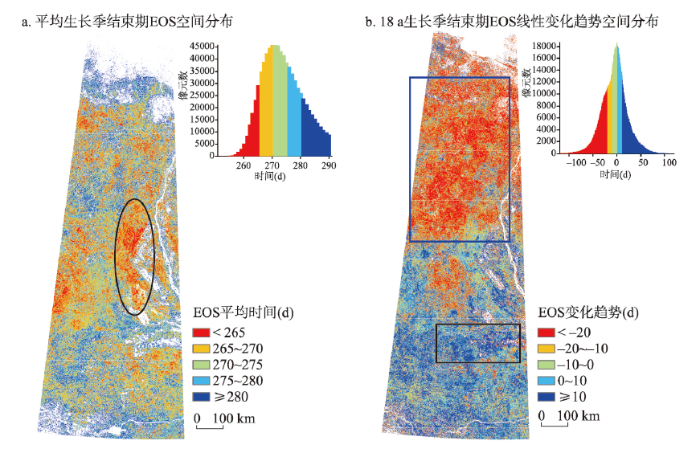
3.2.2 生长季结束期(EOS) 从图5a中可以看出,研究区内EOS主要集中在265~280 d之间,其中EOS为270 d前后的最为集中,即9月中旬到10月中下旬为研究区植被生长季结束期。EOS具有纬度变化规律。70°N以南,纬度越高,EOS越早;70°N以北纬度越高EOS越晚。EOS最早出现在65°N~68°N附近(图5a黑色框范围)。
图5
 新窗口打开|下载原图ZIP|生成PPT
图52000—2017年研究区生长季结束期EOS空间分布
注:a图黑色椭圆为EOS最早出现区域;b图蓝色框为EOS提前幅度最大区域;黑色椭圆为SOS推迟幅度最大区域。
Fig. 5Spatial feature of EOS in the study area from 2000 to 2017
从图5b中可以看出,EOS的变化趋势空间分布具有明显的纬度变化特征,呈北部、西南部提前,南部推后趋势,变化幅度在-25~25 d之间。EOS提前最为明显的区域主要分布在67°N以北的区域(P = 0.0325),提前幅度达15~25 d,提前幅度最长达30 d(图5b蓝色框范围)。EOS推迟区域主要分布在67°N以南的区域(P = 0.0403),推迟5~25 d。推迟幅度最大位于63°N附近(图5b黑色框范围),达30 d。
结合气温变化趋势图可以看出,EOS提前的区域基本与8—9月气温降低的区域重合,其中与8月份对应区域温度的平均相关系数r = 0.4582,最大相关系数为r = 0.8056;与9月份对应区域温度的平均相关系数r = 0.4325,最大相关系数为r = 0.8478。而EOS推迟的区域是8—10月气温升高的区域,其中与8月份对应区域温度的平均相关系数r = 0.5007,最大相关系数为r = 0.7709;与9月份对应区域温度的平均相关系数r = 0.3162,最大相关系数为r = 0.8108;与10月份对应区域温度的平均相关系数r = 0.5183,最大相关系数为r = 0.8679。
3.2.3 生长季中期(MOS) 从图6a中可以看出,MOS的时间较为集中,主要分布在第200~220 d,即6月下旬—7月上旬为研究区的植被生长季中期。其空间分布特征表现为66°N以南MOS的时间差异不大,最大差别在5 d以内;66°N以北则表现出较为明显的纬度分布规律,纬度越高,MOS越晚。
从图6b中可以看出,MOS的变化差异较小,研究区整体MOS呈提前趋势(P = 0.0986),提前幅度3~10 d。提前幅度最大的区域位于研究区65°N~68°N之间(图6b黑色框范围)(P = 0.0384),最多提前约13 d。结合气温变化时空分布图可以看出,MOS整体前移主要受春季气温整体大幅升高,秋季气温升高幅度较小,且部分区域气温下降所致。
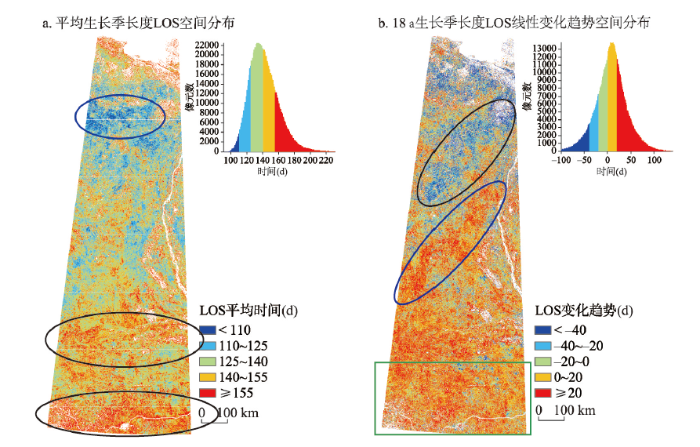
3.2.4 生长季长度(LOS) 从图7a中可以看出,LOS主要集中在120~160 d,即生长季长度约4~5个月,生长季长度很短。LOS最短的地区出现在71°N~72°N附近(图7a蓝色框范围),最长的区域不仅包括研究区最南端,同时还包括64°N附近。对应于土地覆盖类型图可以发现,LOS最长的区域出现在柳伊河两岸的低地平原和落叶针叶林与稀疏林的交错区。
图7
 新窗口打开|下载原图ZIP|生成PPT
图72000—2017年研究区生长季长度LOS空间分布
注:a图蓝色椭圆为LOS最短区域,黑色椭圆为LOS最长区域;b图黑色椭圆为LOS缩短最长区域,蓝色椭圆为LOS延长最大区域,绿色方框为LOS延长较大区域。
Fig. 7Spatial feature of LOS in the study area from 2000 to 2017
从图7b中可以看出,研究区北部LOS呈缩短趋势(P = 0.0301),缩短20~25 d,其中68°N~71°N之间中西部地区LOS缩短最长(图7b黑色框范围),达25 d以上。65°N~68°N中东部和65°N以南区域呈现了LOS延长的变化趋势(P = 0.0379),延长天数10~30 d,其中66°N附近西部和研究区西南部延长天数最长,达30 d以上。
4 讨论
(1)地处北半球高纬度地区的东西伯利亚苔原—泰加林过渡带近几十年来气候变化明显,但人类活动较少,是研究没有人工扰动的自然条件下植被对气候变化响应的理想地区。利用该地区MODIS遥感影像,得到大范围、长时间、高分辨率的地表NDVI产品,以此表征地表植被生长状况,采用符合该研究区植被生长特点的不对称高斯拟合方法和动态阈值法提取了植被生长季起始期(SOS)、生长季结束期(EOS)、生长季中期(MOS)和生长季长度(LOS)4个反映植被生长季变化特点的植被遥感物候参数,结合气温变化数据,实现了对该研究区植被物候的遥感观测、变化趋势分析和气温变化响应研究。对比SOS和EOS 2000—2017年间平均值的时空分布可以看出:时间分布方面,EOS比SOS更为集中,时间更短;空间分布方面,SOS具有更明显的纬度分布特征。对比SOS和EOS 2000—2017年间线性变化趋势时空分布可以看出:EOS的变化趋势的空间分布具有明显的纬度变化特征;相比于同样温度变化下SOS提前的幅度,EOS对气温变化的响应更为敏感,较小的气温变化幅度即可引起EOS较为明显的波动。结合SOS和EOS变化趋势可以看出,研究区北部LOS缩短主要是由于该区域SOS变化幅度较小且EOS提前导致。65°N~68 °N中东部(图7b蓝色框范围)LOS延长主要是由于该区域SOS提前幅度大于EOS提前幅度导致。研究区西南部(图7b绿色框范围)LOS延长主要是由于该区域SOS提前且EOS推后导致。该结果与Xue等通过研究西伯利亚地区针叶林物候与气温变化规律,指出在气温最高的2005年当地针叶林生长季长度最长、气温变化对西伯利亚针叶林生长季长度有密切影响的结果基本一致[17]。另外,通过逐月平均气温空间分布可以看出,研究区的最北端的北冰洋海岸带地区,气温随纬度升高而升高,尤其是在12月至次年1月,该特征更为明显,推测该现象是由于北大西洋暖流影响所致。(2)通过对比18 a间研究区内不同植被类型的分布情况,我们发现,仅在不同植被类型交界的地区发生了小范围的植被类型变化现象,而研究区整体植被分布情况并未发生明显变化,这为本文提供了稳定的实验条件。本文以研究区内整体地物的NDVI为研究对象,而并未区分不同植被类型,以研究北半球高纬度地区所有植被整体对气候变化的响应关系,这样可以简单、直观、明了地揭示研究区内不同气候变化特征区域对应的植被遥感物候变化特征。毋庸置疑,通过研究不同植被类型物候对气候变化的响应,将有助于更深入理解植被物候对气候变化的响应机理。受限于采样精度,目前本文的现有数据尚无法支持精确的不同植被类型物候对气候变化的响应研究。因此,本文仅以不同气候变化特征区和植被遥感物候变化特征区为讨论对象。后期,将以本文结果为基础,针对气候、物候变化明显区域实地采样,并结合更高分辨率的气象数据和更精确的植被覆盖数据重点研究不同植被类型对气候变化的响应规律。
(3)由于当地气象观测站点较少,无法获取够数量的站点实测气象数据作为实验数据,仅能通过对分辨率较粗(0.5°×0.5°)的CRU全球气象数据集进行裁剪而来,这与NDVI数据(0.01°×0.01°)分辨率有较大差别,因此本文可能存在一定的误差,进而影响实验结果。但是考虑到研究区总体面积较大,气候变化也并非小范围急剧变化,而是大范围、长期、整体的变化现象。通过研究区18 a气温变化趋势图(图5)可以看出研究区内整体气温变化比较平缓,并未出现不同区域气温变化差异较大现象。因此,使用CRU气象数据集,可以宏观反映研究区内气温变化趋势。受限于气温数据的分辨率,本文未对小范围特殊温度—植被物候因子变化区域进行讨论,而是重点讨论大范围变化特征的区域,以此宏观描述植被遥感物候特征整体对气温变化响应的一般共性规律。随着气象站点布设的加密,加之实地考察采样数据的积累,结合更高分辨率的卫星遥感影像,后期可以探究更高分辨率的局部温度—植被物候因子的特性规律。
(4)在物候因子提取过程中发现,不同的NDVI时间序列曲线拟合方法,对提取的物候因子结果影响很大。其中,被广泛应用的S-G拟合方法虽然能够最大程度地保留曲线的局部变化规律,但是通过S-G拟合过的峰值形状更为细窄,对于林地类型这样旺盛期较长且平稳的类型可能会产生过度拟合;而对于研究区北部,特别是苔原地区,生长期短,NDVI曲线峰值本已十分细窄,使用S-G方法,可供拟合的点较少,会产生更多的噪声。Double Logistic拟合与本文所采用的高斯函数类似,也是分段拟合,其特点是曲线前半段增速由小变大,而后半段增速由大变小。这一特征与北半球高纬度的生长曲线较为符合,也有不少研究者使用该方法对北半球高纬度的NDVI时间序列进行拟合。但不对称高斯函数不仅适用于北半球高纬度地区的NDVI时间序列曲线拟合,同样在更高纬度的草原、苔原地区也有很好的拟合效果。利用不同拟合方法对不同植被物候因子提取的具体差异有待深入探讨。
(5)温度是控制北半球高纬度植被生态过程及生长状况的关键因子。研究普遍认为升温有利于打破对生产力的限制。但气温周期的物候变化对植被光合作用能力的影响却是不确定的。比如升温虽然导致植被生长季起始期的提前,但提前的时机和幅度却会对冻土的生化过程产生不同的影响,进而导致了随后生长季中植被的生理状态和光合作用能力的不同变化趋势。不同植被类型对气温变化响应的敏感程度以及响应机理目前还不清楚。在气温变化引起植被物候因子变化的同时,植被物候因子的变化会对气温产生反作用,反过来影响气温变化。因此温度—植被物候因子变化的反馈机制还有待进一步研究。
5 结论
本文基于遥感数据提取了北半球高纬度样带地区2000—2017年植被生长季参数SOS、EOS、MOS和LOS的变化趋势信息,同时结合气温变化空间分布规律,综合分析了18 a间气温变化的时空特征对不同植被类型各物候因子变化的影响。研究结果表明:(1)春季气温普遍升高,对应于该研究区内植被生长季(SOS)起始期普遍提前10~25 d。其中,4—5月气温升高,研究区南部植被生长季起始期提前;5—6月气温升高,研究区北部植被生长季起始期提前;但是,6月气温升高幅度较小且7月气温降低,研究区最北端北冰洋沿岸植被生长季起始期推后。
(2)秋季不同月份不同区域气温升降趋势不同,研究区内植被生长季结束期也出现了提前和推后的空间分布差异。8月西北部、9月西南部气温降低,该区域植被生长季结束期提前,9—10月南部气温升高,该区域生长季结束期推迟。秋季植被生长季结束期的变化对气温变化较春季植被生长季起始期更为敏感,较小的气温波动即引起植被生长季结束期较大的变动。
(3)研究区内植被生长季整体呈前移趋势,且西北部植被生长季长度缩短,中部、南部生长季长度延长。
本文结果表明东西伯利亚植被物候变化对气候变化存在密切的响应关系,通过研究植被—气候变化耦合机理,可以较好地揭示全球气候变化对生态的影响。
致谢
感谢中国科学院资源环境科学数据中心刘荣高研究员、徐新良研究员和刘洋副研究员为本文提供数据支持,感谢本文匿名审稿专家为本文的完善提出的宝贵意见。参考文献 原文顺序
文献年度倒序
文中引用次数倒序
被引期刊影响因子
[本文引用: 1]
[本文引用: 1]
[本文引用: 1]
DOI:10.1360/02tb9399URL [本文引用: 1]
[本文引用: 1]
[本文引用: 1]
DOI:10.1360/N072017-00100URL [本文引用: 1]
[本文引用: 1]
[本文引用: 1]
[本文引用: 1]
[本文引用: 1]
[本文引用: 1]
DOI:10.11821/dlxb201801004 [本文引用: 1]

The study on vegetation phenology is of great importance to understand the relationship between vegetation and climate. In areas where the vegetation is sensitive to climate change, a phenological study is helpful to reveal the response mechanism of vegetation to climate change. Based on Moderate Resolution Imaging Spectro radiometer (MODIS) Enhanced Vegetation Index (EVI) time-series images from 2000 to 2015, we utilized Savitzky-Golay (S-G) filter and dynamic threshold method to extract the phenological parameters of forest vegetation in the Funiu Mountains. Combining temperature and precipitation data, we used Mann-Kendall (M-K) trend test, Theil-Sen estimator, ANUSPLIN interpolation, and correlation analysis methods to analyze phenological changes of vegetation in response to climate factors (temperature/precipitation) in the Funiu Mountains. The results showed that: (1) The start and end of growing season ranged mainly from 105 d to 120 d and from 285 d to 315 d, respectively. The length of the growth season ranged mainly from 165 d to 195 d. There is an evident correlation between forest phenology and altitude. With increasing altitude, the start, end and length of the growing season presented a significantly delayed, advanced and shortened trend, respectively. (2) In terms of the interannual variations, both the start and end of the growing season mainly displayed a delayed trend in 76.57% and 83.81% of the total area, and the length of the growing season exhibited a lengthened trend of 61.21%. The start of forest growing season is mainly affected by the decrease of spring temperature in the region. (3) A significant correlation was found between the start of growing season and mean temperature in March. The negative correlation coefficient indicated that a delayed start of the growing season was primarily due to the temperature decrease in March. The end of growing season was mainly influenced by September precipitation, and their correlation was positive, that is, the increased precipitation in September can delay the end of the growing season. In addition, the length of the growing season was influenced by temperature and precipitation during the whole growing season, for most parts of the region, the mean temperature and precipitation in August were obviously correlated with the length of forest growing season.
[本文引用: 1]
[本文引用: 1]
[本文引用: 1]
[本文引用: 1]
[本文引用: 1]
[本文引用: 1]
[本文引用: 1]
[本文引用: 1]
[本文引用: 1]
[本文引用: 1]
[本文引用: 1]
[D].
[本文引用: 1]
[D].
[本文引用: 1]
[本文引用: 1]
[本文引用: 1]
[本文引用: 1]
DOI:10.1093/jpe/rtv075URL [本文引用: 2]
DOI:10.11820/dlkxjz.2009.01.005 [本文引用: 1]
Plant phenological phenomena are the most salient and sensitive bio-indicators of the environmental change at seasonal and interannual scales. Timings of plant phenological phenomena can indicate the rapid response of terrestrial ecosystems to climate change. Since the remote sensed phenology observation is characterized by multi-temporal, broad coverage, spatial continuality, and relatively long time series, recently, it has been an important means for detecting responses and feedbacks of vegetation dynamics to global climate change. On the basis of introducing remote sensing data sets and processing methods for monitoring plant phenology, we systematically reviewed important progresses in remote sensing phenology during the last five years worldwide focusing on identification of the phenological growing season, plant phenology and climate change, plant phenology and net primary production, plant phenology and land cover, and plant phenology and crop yield estimate, and so on. Then, we pointed out some existing problems in the current research, and tried to propose some main research aspects in the near future as follows: (1) developing a kind of more general technique for identifying the phenological growing season using remote sensing data; (2) unifying surface observed and satellite derived spatial information by carrying out plant community phenology observations and selecting appropriate scale transition methods; (3) analyzing quantitatively response mechanisms of plant phenology to human activities; (4) implementing amalgamation of remote sensing data with different spatial resolutions using suitable mathematical methods and models; and (5) estimating possible responses of plant phenology to future climate change by dynamic simulations.
[本文引用: 1]
DOI:10.1016/S0034-4257(02)00096-2URL [本文引用: 1]
[本文引用: 1]
[本文引用: 1]
[本文引用: 1]
[本文引用: 1]
[本文引用: 1]
[本文引用: 1]
[本文引用: 1]
DOI:10.11821/dlxb202001002 [本文引用: 1]
As one of the most important plant traits of crops, crop phenology reflects the characteristics of crop growth and development; its variation also affects crop production. Therefore, crop phenology is a reliable and comprehensive biological indicator reflecting global climate change. Global climate change, marked by rising temperatures, has exerted significant impacts on crop phenology. Under the background of global climate change, revealing the mechanism of global climate change impacts on crop phenology and growth as well as the formation of crop yield is of theoretical and practical significance. At present, crop phenology shifts and their influencing factors have become a hot research topic and an important international issue, thus a large number of studies have been carried out, and achieved rich and effective results. In this paper, we mainly focus on the research progress of crop phenological changes under the background of climate change, including the driving factors and their influencing mechanisms of crop phenological changes as well as methods of research on crop phenology, and the key scientific issues which need to be solved in future study are also discussed. The conclusions of this research could provide a theoretical basis for understanding the impacts and mechanisms of global climate change on crop phenology and for guiding regional agricultural production practices.
[本文引用: 1]
DOI:10.1080/01431168508948281URL [本文引用: 1]
DOI:10.1080/01431169008955174URL [本文引用: 1]
DOI:10.1016/0034-4257(94)90143-0URL [本文引用: 1]
DOI:10.1029/97GB00330URL [本文引用: 1]
DOI:10.1016/j.cageo.2004.05.006URL [本文引用: 2]
[本文引用: 1]
[本文引用: 1]
DOI:10.1111/gcb.2005.11.issue-12URL [本文引用: 1]
DOI:10.1016/j.rse.2016.11.023URL [本文引用: 1]
DOI:10.1016/j.rse.2013.01.019URL [本文引用: 1]
DOI:10.1109/TGRS.2016.2623746URL [本文引用: 1]
DOI:10.2307/3235884URL [本文引用: 1]
PMID:10993564 [本文引用: 1]
The objectives of this study are to explore the relationships between plant phenology and satellite-sensor-derived measures of greenness, and to advance a new procedure for determining the growing season of land vegetation at the regional scale. Three phenological stations were selected as sample sites to represent different climatic zones and vegetation types in northern China. The mixed data set consists of occurrence dates of all observed phenophases for 50-70 kinds of trees and shrubs from 1983 to 1988. Using these data, we calculated the cumulative frequency of phenophases in every 5-day period (pentad) throughout each year, and also drew the cumulative frequency distribution curve for all station-years, in order to reveal the typical seasonal characteristics of these plant communities. The growing season was set as the time interval between 5% and 95% of the phenological cumulative frequency. Average lengths of the growing season varied between 188 days in the northern, to 259 days in the southern part of the research region. The beginning and end dates of the surface growing season were then applied each year as time thresholds, to determine the corresponding 10-day peak greenness values from normalized difference vegetation index curves for 8-km2 pixels overlying the phenological stations. Our results show that, at the beginning of the growing season, the largest average greenness value occurs in the southern part, then in the northern, and finally the middle part of the research region. In contrast, at the end of the growing season, the largest average greenness value is measured in the northern part, next in the middle and lastly the southern part of the research region. In future studies, these derived NDVI thresholds can be applied to determine the growing season of similar plant communities at other sites, which lack surface phenological data.
[D].
[本文引用: 1]
[D].
[本文引用: 1]
DOI:10.1109/TGRS.2002.802519URL [本文引用: 2]
