 ,1,2, 申雅静1, 王雄1, 李心怡1
Vulnerability to biological disasters: A novel field of cultivated land use transition research
SONG Xiaoqing,1,2, SHEN Yajing1, WANG Xiong1, LI Xinyi1收稿日期:2020-05-6修回日期:2020-08-27网络出版日期:2020-11-25
| 基金资助: |
Received:2020-05-6Revised:2020-08-27Online:2020-11-25
| Fund supported: |
作者简介 About authors
宋小青(1984-), 男, 湖北荆州人, 博士, 副教授, 博导, 中国地理学会会员(S110008928M), 主要从事人地系统转型、空间规划与国土多功能利用研究。E-mail:

摘要
关键词:
Abstract
Keywords:
PDF (3519KB)元数据多维度评价相关文章导出EndNote|Ris|Bibtex收藏本文
本文引用格式
宋小青, 申雅静, 王雄, 李心怡. 耕地利用转型中的生物灾害脆弱性研究. 地理学报[J], 2020, 75(11): 2362-2379 doi:10.11821/dlxb202011007
SONG Xiaoqing, SHEN Yajing, WANG Xiong, LI Xinyi.
1 引言
土地利用转型作为土地利用/覆被变化综合研究的新途径被引入国内后[1],迅速引起决策层和学术界的热议。它是指一定地域的土地利用形态随着经济社会发展而发生的趋势性转折[2,3,4]。学术界遵循“格局监测—过程识别—机理探索—效应评估”研究逻辑,聚焦森林[5,6,7,8,9]、耕地[10,11,12,13,14,15]、城乡建设用地[16,17,18,19]转型开展了大量研究,为应对全球环境变化、加大生态建设力度、改进耕地保护制度、优化城乡建设布局提供了重要支撑。然而,以往大多从显性视角研究土地利用空间(或格局)转型,或者从隐性视角研究土地利用功能转型[20,21,22],有关这两方面的耦合研究还不够深入[4],并未充分彰显土地利用转型研究的综合优势。学术界迫切需要探索新的领域以提升土地利用转型的综合研究水平。2020年蝗灾影响警示人类迫切需要降低耕地利用系统脆弱性。环境变化驱动的自然灾害是导致耕地利用系统脆弱性最突出的因素。20世纪90年代以来,气候变化科学范式推动农业自然灾害脆弱性研究取得了重要进展[23]。然而,以往研究集中在与气候变化相关的农业洪涝、干旱脆弱性[24,25,26,27],对作物病虫草害等农业生物灾害脆弱性关注甚少。事实上,生物灾害是粮食减产的重要因素。2010—2014年,病虫害导致全球小麦、水稻、玉米、土豆、大豆等产量损失分别高达21.5%、30.0%、22.6%、17.2%、21.4%[28]。1988—2017年,病虫草害导致全国粮食自然损失量(挽回损失量与实际损失量之和)达24.38亿t,占该时期全国粮食总产的15.87%[29]。当前,国际科学界呼吁采取切实行动以应对生物灾害对粮食安全的威胁[30]。可见,农业生物灾害脆弱性研究迫在眉睫。
人地耦合系统脆弱性往往与资源利用活动紧密关联[31]。由此,农业生物灾害脆弱性必然与耕地利用关系密切。然而,鲜有****从耕地利用角度研究农业生物灾害脆弱性。从土地利用格局角度来看,全球耕地利用正处于从生计农业模式下的细碎化利用向集约农场模式下的规模化利用转型[32]。欧美多功能农业实践、最优管理实践(Best Management Practices, BMP)、综合害虫管理实践(Integrated Pest Management, IPM)[33]以及可持续集约化(Sustainable Intensification, SI)[34,35]。实践表明,与生计农业相比,集约农场更加注重农业生态系统服务管理,水、肥配置及生物灾害防治更加精准、科学,而且灾害防治合作意愿更强烈[36],因而具有更强的生物灾害应对能力。1988—2017年,全国劳均耕地从0.45 hm2/人增长到0.64 hm2/人[29]。随着耕地经营面积增加,单位面积化肥和农药使用量呈下降态势[37]。研究显示,耕地经营面积增加1%,除草剂和杀虫剂用量下降1.8%、化肥用量下降0.3%[38]。同时,与细碎化经营的散户相比,种田大户在采用施肥、病虫害防治等新技术的意愿更强烈,也更愿意付出时间和成本学习农业知识[39]。此外,家庭农场、种田大户、农业企业、农业合作社等新型农业经营主体带动小农发展的生产格局已经形成。2018年全国小农户2.6亿,新型农业经营主体超过300万[40]。新型农业经营主体突出贡献之一是,大力推动了农业生物灾害统防统治。根据笔者调查,黑龙江省五常市五常大米种植区通过农业企业带动实现了生物灾害统防统治航化作业;苏南、苏北的农业企业也已实施水稻生物灾害统防统治。从土地利用功能角度来看,2006年以来,从全国到地市尺度,耕地利用多功能化态势已经显现。发达地区(如珠江三角洲)的耕地利用功能已从经济社会型转向生态经济型,生态功能从快速退化走向恢复[15, 41]。综合发达国家经验以及中国情况来看,化学品使用强度下降以及耕地利用功能转向生态经济型,必定促成中国耕地生态系统由受损转向恢复并降低耕地利用的负面环境影响,从而有利于降低耕地利用系统的暴露度和敏感性。同时,农业生物灾害防治意愿和能力的提升必然增强耕地生态系统对农业生物灾害的应对能力。那么,随着经济社会发展,中国耕地利用生物灾害脆弱性是否存在或者已经转型?
耕地利用生物灾害脆弱性是耕地生态系统对生物灾害承受能力和耕地利用对生物灾害应对能力的综合度量,反映了耕地生态系统自身状态和耕地利用水平。也就是说,耕地利用生物灾害脆弱性转型必然是耕地利用空间形态(或格局)的构成要素(即不同数量、类型和形状的耕地地块)和耕地利用功能形态的构成要素(即不同性质、类型和强度的耕地功能)[4, 22]耦合作用的结果。从这一解释来看,耕地利用生物灾害脆弱性转型是代表着耦合耕地利用空间形态(或格局)与耕地利用功能形态的综合研究领域。研究耕地利用生物灾害脆弱性转型对于探索耕地利用转型研究新领域具有重要意义。
基于以上考虑,本文在构建耕地利用生物灾害脆弱性转型理论框架、评价指标体系及评价模型基础上,开展1988—2017年耕地利用生物灾害脆弱性转型诊断及特征研究,以期为探索耕地利用转型综合研究领域及创新耕地保护政策提供支撑。
2 理论框架
2.1 耕地利用生物灾害脆弱性的基本概念
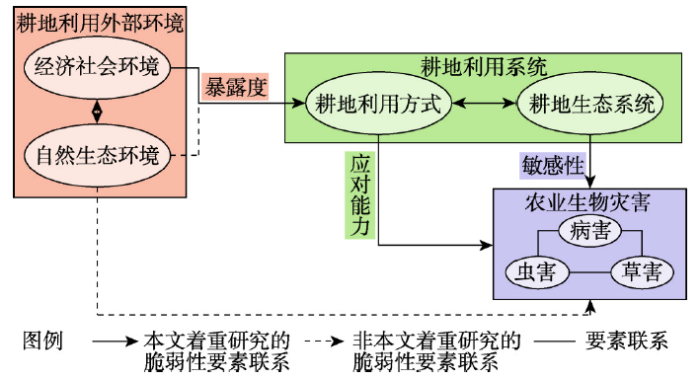
脆弱性概念源于自然灾害研究,经由气候变化科学范式完善后获得科学界公认。它是指系统暴露于外部环境受到损害或威胁的倾向性以及应对能力的缺乏[23, 31]。据此可以将耕地利用生物灾害脆弱性解释为,耕地利用系统暴露于外部环境中,受到生物灾害损害或威胁的倾向性,以及生物灾害防治能力的缺乏。其中,外部环境包括自然生态环境和经济社会环境(图1)。从生态学角度来看,病虫草害的相互关联性强,而螺害和鼠害的与病虫草害的关联相对较弱。因此,本文研究关注的农业生物灾害包括病虫草害,但不包括螺害和鼠害。图1
 新窗口打开|下载原图ZIP|生成PPT
图1耕地利用生物灾害脆弱性概念框架
Fig. 1A connotation framework of cultivated land use vulnerability to biological disasters
2.2 耕地利用生物灾害脆弱性的构成要素
耕地利用生物灾害脆弱性是暴露度、敏感性和应对能力的函数(图1)。其中,暴露度是指耕地利用系统在容易导致病虫草害等农业生物灾害的环境中的暴露程度。考虑到本文研究时段1988—2017年内自然环境相对稳定而经济社会环境变化显著,本文聚焦耕地利用系统暴露于经济社会环境影响而产生的脆弱性问题,将自然环境作为背景因素考虑。本文所指的暴露度聚焦在耕地利用系统所承受的容易导致农业生物灾害的经济社会压力。敏感性是指耕地利用系统受到农业生物灾害的可能影响程度,由耕地生态系统状态及生物灾害强度共同决定。应对能力是指耕地利用应对农业生物灾害的能力,由生物灾害防治水平及成效反映。2.3 耕地利用“趋利避害”、农业诱致性生产替代与生物灾害脆弱性
耕地利用是由农户“趋利性”和“避害性”动机共同支配的经济行为。在“趋利性”方面,耕地利用表现为农业诱致性生产替代[15, 42-46]。为实现收益最大化,农户往往根据价格配置农业资源。农户倾向于种植较高收益的作物,从而替代较低收益的作物。1988—2018年,中国粮食种植净利润从794.25元/hm2下降到-1283.85元/hm2 [47],粮食作物播种面积占农作物播种面积的比重从76.02%下降到70.54%,而经济与园艺作物播种面积占比从18.93%增长到26.46%,其中蔬菜播种面积占比从4.16%增长到12.32%[29]。同时,农户倾向于用较低成本的投入要素替代较高成本的投入要素。1988—2018年,粮食种植化肥成本从301.95元/hm2增长到2085.30元/hm2,土地成本从110.40元/hm2增长到3373.05元/hm2 [47]。土地相对于化肥的成本优势下降,诱致稀缺、昂贵的土地被相对廉价、充足的化肥所替代。农业诱致性生产替代必然导致耕地化肥使用强度和作物多样性的变化。1988—2017年,耕地化肥投入量从151.41 kg/hm2迅速增长到434.41 kg/hm2 [29]。耕地化肥使用强度升高和作物多样性下降必将影响耕地生态系统对生物灾害的抵御能力。在“避害性”方面,为最大程度地避免损失尤其是生物灾害导致的减产,农户倾向于投资生物灾害防治。而农户的这种投资能力往往由其收入水平决定,是影响生物防治能力的关键因素。综上,农业资源相对稀缺等经济社会压力构成了耕地利用生物灾害暴露度,耕地化肥使用强度和作物多样性等影响耕地生态系统功能的因素以及生物灾害强度决定了耕地利用生物灾害敏感性,而生物灾害防治水平及成效构成了耕地利用生物灾害应对能力。暴露度、敏感性和应对能力在“趋利性”和“避害性”的支配下形成了耕地利用生物灾害脆弱性。
2.4 耕地利用生物灾害脆弱性转型的综合解释
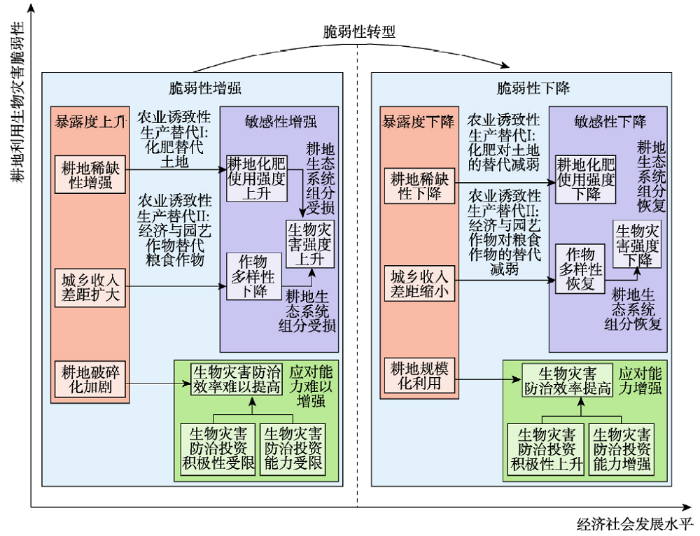
耕地利用生物灾害脆弱性转型是指耕地利用生物灾害脆弱性随着经济社会发展从一种状态向另一种状态的趋势性转折。随着经济社会进入快速发展时期,城乡关系往往表现为不平衡状态[48,49]。快速工业化、城镇化导致城乡收入差距扩大,耕地大量流失、破碎化加剧、稀缺性增强[50,51,52,53]。提高经济收益是农户耕地利用的重要目标,而日益升高的土地成本是制约耕地规模经营的重要因素。在“趋利性”驱使下,农业诱致性生产替代一方面导致化肥等增产性投入被大量使用以节约逐步昂贵的土地要素[42, 45-46],另一方面导致粮食作物逐步被经济与园艺作物替代[15, 54-57]。而且,农作物倾向于被专业化种植,以便于机械化耕作并提高产量。此外,粮食作物种植的亩均化肥施用量明显低于经济与园艺作物[15, 47]。作物替代必然导致耕地化肥使用强度逐步升高,进而导致耕地生态系统过程明显受损[32, 58-59]。同时,专业化种植大大降低作物多样性,导致耕地生态系统组分受损[60,61,62,63,64,65,66,67]。耕地生态系统组分及过程受损共同促成耕地生态系统功能弱化。这必定明显降低耕地生态系统对生物灾害的抵御能力,生物灾害强度增强。在“避害性”方面,农户经济收入受限导致生物灾害防治的积极性及能力难以提高。而且,耕地破碎化制约了生物灾害防治效率。根据以上分析,随着经济社会进入快速发展时期,呈扩大态势的城乡收入差距和呈增强态势的耕地破碎化和稀缺性,导致耕地利用生物灾害暴露度升高;呈升高态势的耕地化肥使用强度、专业化种植水平及生物灾害强度,导致耕地利用生物灾害敏感性增强;受限的生物灾害防治积极性、能力与防治效率,导致耕地利用生物灾害应对能力难以提高。以上共同导致耕地利用生物灾害脆弱性增强。随着经济社会发展进入相对发达阶段,城乡收入差距缩小[48,49],农村土地大量流转带动耕地规模经营水平提高[68]。2012—2016年,全国耕地流转面积从1.3×10⁵ hm2增长到3.1×10⁵ hm2 [69],地劳关系明显优化。加之,土地生产力水平已大大提高,显著缓解耕地稀缺性从而降低耕地压力[41, 70]。值得注意的是,该阶段耕地多功能需求凸显,耕地生态系统服务价值逐步显化,农业生产的环境损害成本升高[33]。由此,在“趋利性”驱使下,农业诱致性生产替代导致农户根据耕地生态系统特征和作物生理需求决定化肥施用量。与前一发展阶段相比,耕地化肥使用强度增长明显趋缓甚至下降。1988—2003年,城乡收入比从2.17增长到3.23,耕地化肥使用强度从151.41 kg/hm2增长到326.67 kg/hm2、年均增长11.68 kg/hm2 [29]。2004—2017年,城乡收入比从3.45下降到2.71,耕地化肥使用强度从345.76 kg/hm2增长到434.41 kg/hm2、年均增长6.82 kg/hm2 [29]。同时,由于粮食品质提高及耕地生态系统服务市场价值显化,经济与园艺作物产品价格高于粮食价格的优势褪化。这将导致经济与园艺作物对粮食作物的诱致性替代逐步减弱,从而进一步降低耕地化肥使用强度并提升作物种植多样性。由此,耕地生态系统过程及组分转而恢复。这必将增进耕地生态系统功能,进而增强耕地生态系统对生物灾害的抵御能力,生物灾害强度势必下降。在“避害性”方面,农户经济收入水平显著提高将切实增强生物灾害防治的投资积极性及能力。而且,耕地规模化利用将大大提升耕地管理水平,从而增强生物灾害防治效率。根据以上分析,随着经济社会发展进入相对发达阶段,呈缩小态势的城乡收入差距、逐步提升的耕地规模化利用水平以及呈弱化态势的耕地稀缺性,导致耕地利用生物灾害暴露度下降;呈下降态势的耕地化肥使用强度、呈增长态势的作物多样化种植水平以及呈下降态势的生物灾害强度,导致耕地利用生物灾害敏感性下降;逐步增强的生物灾害防治积极性及能力与防治效率,导致耕地利用生物灾害应对能力显著增强。以上共同导致耕地利用生物灾害脆弱性减弱(图2)。
图2
 新窗口打开|下载原图ZIP|生成PPT
图2耕地利用生物灾害脆弱性转型理论框架(修正自文献[71])
Fig. 2A theoretical framework of transition in cultivated land use vulnerability to biological disasters
综上,耕地利用生物灾害脆弱性转型可以理解为,沿着“经济社会环境—耕地利用活动—生物灾害反馈—灾害防治应对”社会生态交互逻辑,耕地利用生物灾害脆弱性随着经济社会发展从增强向减弱的趋势性转折。
3 研究方法与数据
3.1 耕地利用生物灾害脆弱性评价方法
3.1.1 评价指标体系 根据理论框架,耕地稀缺性、耕地规模经营水平和城乡收入差距是决定暴露度的关键指标,作物多样性、耕地化肥使用强度和生物灾害强度是决定敏感性的关键指标,生物灾害防治积极性、生物灾害防治能力及效率是决定应对能力的关键指标。在暴露度方面,考虑到耕地稀缺程度是耕地数量、质量和食物需求的综合反映,在此运用耕地压力指数衡量耕地稀缺性[41, 70]。耕地稀缺性越高,脆弱性越强。运用劳均耕地、城乡收入比分别衡量耕地规模经营水平、城乡收入差距。城乡收入差距、耕地规模经营水平分别与脆弱性呈正相关、负相关。在敏感性方面,作物多样性是维持耕地生态系统功能的关键指标,与脆弱性呈负相关。以各类作物播种面积为基础数据,运用Simpson指数衡量作物多样性[15, 41]。耕地化肥使用强度、生物灾害强度均与脆弱性呈正相关。在应对能力方面,运用作物生物灾害防治率和作物生物灾害防治失控率衡量生物灾害防治积极性和防治能力,分别与脆弱性呈负相关、正相关。考虑到粮食作物是农作物种植的主要类型,运用粮食生物灾害损失挽回率衡量生物灾害防治效率,与脆弱性呈负相关。综上,构建脆弱性评价指标体系(表1)。Tab. 1
表1
表1耕地利用生物灾害脆弱性评价指标体系
Tab. 1
| 脆弱性 | 指标名称 | 指标属性 | 指标涵义 | 评价方法 | 单位 |
|---|---|---|---|---|---|
| 暴露度 | 耕地压力 指数[41, 70] | + | 耕地稀缺性 | CLPI: 耕地压力指数; f: 粮食自给率; d: 人均粮食需求量; y: 粮食播面单产; r: 粮作比; mci: 复种指数; PerCLA: 人均耕地面积 | - |
| 劳均耕地 | - | 耕地规模经营水平 | PCLAEA: 劳均耕地; CLA: 耕地面积; EA: 农业从业人员 | hm2/人 | |
| 城乡收入比 | + | 城乡差距 | RIUR: 城乡收入比; IU: 城镇居民家庭人均可支配收入; IR: 农村居民家庭人均纯收入 | - | |
| 敏感性 | 作物 多样性[15, 41] | - | 维持耕地生态系统功能的系统组分多样性水平 | Diversity: 作物多样性指数; Ci: 作物i播种面积占农作物播种面积的比例 | - |
| 耕地化肥使用强度 | + | 化学品对耕地生态系统的影响程度 | CFUI: 耕地化肥使用强度; ACFU: 化肥施用量(折纯量); CLA: 耕地面积 | kg/hm2 | |
| 地均生物灾害发生面积 | + | 生物灾害发生强度 | RBDA: 地均生物灾害发生面积; BDA: 作物病虫害等生物灾害发生面积; CLA: 耕地面积 | - | |
| 应对 能力 | 生物灾害防治率 | - | 生物灾害防治积极性 | RBDPCA: 地均生物灾害防治面积; BDPCA: 作物病虫害等生物灾害防治面积; TSAC: 农作物播种面积 | - |
| 生物灾害防治失控率 | + | 生物灾害防治能力 | FRBDPC: 生物灾害防治失控率; BDA: 作物病虫害等生物灾害发生面积; BDPCA: 作物病虫害等生物灾害防治面积 | - | |
| 生物灾害损失挽回率 | - | 生物灾害防治效率 | RRGL: 粮食生物灾害损失挽回率; RGL: 粮食生物灾害损失挽回量; AGL: 粮食生物灾害实际损失量 | - |
新窗口打开|下载CSV
3.1.2 评价指标标准化方法 首先,运用倒数法将负向指标正向化。然后,运用极大值法[74,75]将正向化后的评价指标无量纲化:
式中:i、j分别表示评价对象、评价指标;xij为正向化后的评价指标;max(xj)为正向化后的评价指标中的最大值;Xij为评价指标无量纲值。
3.1.3 逻辑斯蒂增长模型 系统要素与系统功能之间往往呈非线性关系[76]。同时,由于农业资源的生态限制性,农业生产表现为典型的生态承载力特征[77]。对此,采用逻辑斯蒂增长模型[77,78,79]计算标准化后评价指标的耕地利用生物灾害脆弱性分值。
式中:CLVBDij为耕地利用生物灾害脆弱性评价指标分值。为保证CLVBDij的值介于(0, 1),设置k = 1,且a、b均为常数。根据逻辑斯蒂增长曲线特征,假定Xij→0.01,则CLVBDij→0.001;假定Xij→0.99,则CLVBDij→0.999。由此推算出a、b分别为1150.221、-14.095。
3.1.4 综合计量模型 考虑到评价指标对耕地利用生物灾害脆弱性的贡献差异,运用熵权法计算评价指标权重,并运用线性加权求和法计算耕地利用生物灾害脆弱性值。
式中:CLVBD为耕地利用生物灾害脆弱性值;wj为评价指标j的权重。
3.2 耕地利用生物灾害脆弱性转型诊断方法
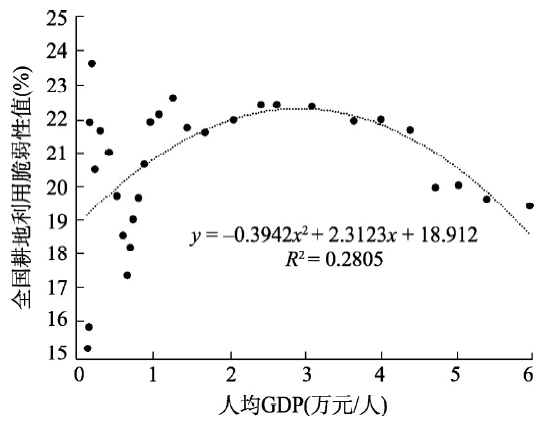
3.2.1 单因素模拟方程 根据理论框架,以人均GDP衡量经济社会发展水平并作为自变量,运用一元二次方程检验其与因变量耕地利用生物灾害脆弱性值之间的关系。式中:CLVBD为耕地利用生物灾害脆弱性;PerGDP为人均GDP;
3.2.2 多因素面板数据回归模型 耕地利用生物灾害脆弱性变化的影响因素包括自然生态环境和经济社会环境多因素。那么,诊断耕地利用生物灾害脆弱性转型,不仅要考虑人均GDP,而且还要在尊重数据可获得性基础上考虑自然环境和其他经济社会因素。在自然环境方面,主要考虑气温和降水对生物灾害的影响。耕地利用“趋利性”和“避害性”动机是由耕地利用目标所诱导。而耕地利用目标表现为追求土地生产率和劳动生产率最大化。对此,在经济社会环境方面,将土地生产率、劳动生产率作为脆弱性变化的影响变量(表2)。
Tab. 2
表2
表2耕地利用生物灾害脆弱性面板回归模型变量
Tab. 2
| 变量 | 变量类型 | 变量含义 | 变量属性 | 单位 |
|---|---|---|---|---|
| CLVBD | 因变量 | 耕地利用生物灾害脆弱性 | - | - |
| Temp | 自变量 | 气温 | 控制变量 | oC |
| Precip | 降水量 | mm | ||
| ProLand | 土地生产率,即单位耕地面积种植业增加值 | 万元/hm2 | ||
| ProLabor | 劳动生产率,即单位农业从业人员种植业增加值 | 万元/人 | ||
| PerGDP | 人均GDP | 核心变量 | 万元/人 | |
| PerGDP2 | 人均GDP的二次方 | (万元/人)2 |
新窗口打开|下载CSV
以脆弱性值为因变量,以人均GDP及其二次方项为核心变量,同时将气温、降水量、土地生产率、劳动生产率纳入控制变量,构建面板数据回归模型:
式中:a为常数项;bi和cj分别为时间和地区固定效应因子;
3.3 数据来源
3.3.1 耕地数据 耕地数据为1988—2017年全国及各省(直辖市、自治区)耕地面积。其中,1996年耕地面积、2009年耕地面积分别为第一次、第二次土地调查成果,其余年份数据为土地利用变更调查成果,来自《国土资源统计年鉴》《中国土地年鉴》[80]。相对于第一次土地调查,第二次土地调查采用的遥感影像等基础资料更加精细。因此,2009—2017年耕地面积比1997—2008年耕地面积的精度更高。为保证数据精度一致性,有必要以2009—2017年耕地面积为基础,校正1997—2008年耕地面积。考虑到复种指数在2008—2009年波动较小,在此首先运用复种指数校正2008年耕地面积。式中:CLAadj2008、CLA2009为2008年校正耕地面积、2009年校正耕地面积;TSAC2008、TASC2009分别为2008年、2009年农作物播种面积;MCI2009为2009年复种指数。
以2008年耕地面积、历年年内新增耕地面积和年内耕地减少面积为基础,运用历史重建法[41, 81-82],反推1988—2007年耕地面积。其中,1996—2007年年内新增耕地面积、年内耕地减少面积来自《国土资源统计年鉴》《中国土地年鉴》[80];1988—1995年新增耕地面积、年内耕地减少面积来自《中国农业年鉴》[29]。
式中:CLAadj(t+1)、CLAadj(t)分别为第t+1年、第t年耕地面积;INCLArea(t)、DECLArea(t)分别为第t年的年内新增耕地面积、年内耕地减少面积。
3.3.2 生物灾害数据 生物灾害数据为1988—2017年全国及各省(直辖市、自治区)病虫害发生面积、病虫害防治面积、病虫害挽回粮食损失量、病虫害实际损失粮食量、草害发生面积、草害防治面积、草害挽回粮食损失量、草害实际损失粮食量,来自《中国农业年鉴》[29]。
3.3.3 农业生产数据 农业生产数据为1988—2017年全国及各省(直辖市、自治区)各类农作物播种面积、化肥施用折纯量。其中,农作物类型包括早稻、中稻和一季晚稻、双季晚稻、冬小麦、春小麦、玉米、高粱、谷子、大豆、马铃薯、其他薯类、棉花、花生、油菜籽、芝麻、胡麻籽、向日葵籽、其他油料、麻类、甘蔗、甜菜、烤烟、其他烟叶、药材、蔬菜、瓜果类、青饲料共27类,均来自《中国农业年鉴》[29]。气温、降水量数据来自《中国统计年鉴》[83]。
3.3.4 经济社会数据 经济社会数据为1988—2017年全国及各省(直辖市、自治区)总人口、农业从业人员、城镇居民家庭人均可支配收入、农村居民家庭人均纯收入、人均GDP、种植业增加值,均来自《中国农业年鉴》[29]《中国统计年鉴》[83]。
4 1988—2017年中国耕地利用生物灾害脆弱性转型
4.1 国家尺度耕地利用生物灾害脆弱性转型
1988—2017年,耕地利用生物灾害脆弱性随着经济社会发展发生了转型(图3)。根据模拟方程计算曲线顶点坐标值可知,转型时人均GDP为2.93万元/人。对照1988—2017年人均GDP可知,转型时对应年份为2010年前后。1988—2009年,全国耕地利用生物灾害脆弱性值从15.33%增长到22.45%,年均增长0.34个百分点。2010—2017年,全国耕地利用生物灾害脆弱性值从22.40%下降到19.49%,年均下降0.42个百分点。图3
 新窗口打开|下载原图ZIP|生成PPT
图31988—2017年全国耕地利用生物灾害脆弱性转型倒“U”型曲线
Fig. 3The inverted U-shaped curve of transition in cultivated land use vulnerability to biological disasters at the national level in China between 1988 and 2017
4.2 省级尺度耕地利用生物灾害脆弱性转型
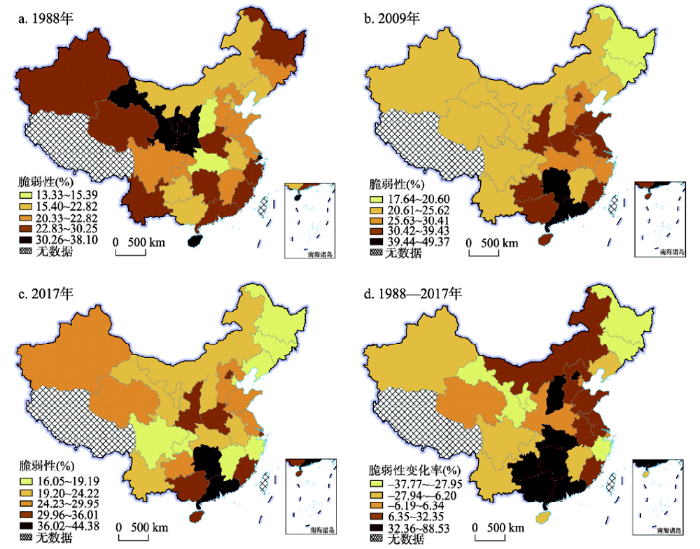
1988—2017年,脆弱性高值由西北向东南移动,长江中游地区、华南、云贵高原东部脆弱性明显增强,而东北平原、西北地区脆弱性明显减弱。2017年,华南以及湖南省、广西壮族自治区脆弱性明显较强,黄淮海平原区其次,东北平原区、四川盆地及周边地区以及江西省、浙江省最低(图4)。图4
 新窗口打开|下载原图ZIP|生成PPT
图41988—2017年中国省级尺度耕地利用生物灾害脆弱性变化格局
注:基于自然资源部标准地图服务网站审图号GS(2019)1825的标准地图制作,底图无修改。
Fig. 4Spatial pattern of cultivated land use vulnerability to biological disasters at the provincial level in China between 1988 and 2017
为诊断省级尺度耕地利用生物灾害脆弱性转型态势,构建多因素面板回归模型。协整检验结果显示,拒绝原假设,面板数据存在协整关系。在开展Hausman检验基础上,运用最小二乘估计求解模型。表3为模型变量的统计描述。表4显示,气温(Temp)、降水量(Precip)与耕地利用生物灾害脆弱性(CLVBD)相关关系不显著。这与2.2节理论认知一致,即在短时间范围内,自然生态环境不是导致CLVBD变化的关键因素。土地生产率(ProLand)和劳动生产率(ProLabor)分别与CLVBD呈显著的正相关和负相关关系。人均GDP(PerGDP)与CLVBD的相关性从显著正相关变为显著负相关,证明了本文关于耕地利用生物灾害脆弱性转型的理论认知。即随着经济社会发展,耕地利用生物灾害脆弱性由增强向减弱转型。
Tab. 3
表3
表3耕地利用生物灾害脆弱性面板回归模型变量描述性统计
Tab. 3
| 变量 | 均值 | 中间值 | 最大值 | 最小值 | 标准差 | 横截面数 |
|---|---|---|---|---|---|---|
| CLVBD | 28.67 | 28.25 | 50.59 | 13.34 | 7.05 | 870 |
| Temp | 14.29 | 15.10 | 25.40 | 4.20 | 5.07 | 870 |
| Precip | 901.61 | 787.05 | 2939.70 | 74.90 | 525.08 | 870 |
| ProLand | 1.37 | 0.89 | 8.39 | 0.04 | 1.39 | 870 |
| ProLabor | 0.62 | 0.41 | 3.48 | 0.04 | 0.58 | 870 |
| PerGDP | 2.04 | 1.04 | 12.90 | 0.06 | 2.33 | 870 |
| PerGDP2 | 9.55 | 1.07 | 166.39 | 0.00 | 20.65 | 870 |
新窗口打开|下载CSV
Tab. 4
表4
表4耕地利用生物灾害脆弱性面板回归结果
Tab. 4
| 自变量名称 | 自变量属性 | 参数估计值 | 标准差 | t值 | P值 |
|---|---|---|---|---|---|
| Temp | 控制变量 | -0.252004 | 0.244870 | -1.029134 | 0.3037 |
| Precip | 0.000069 | 0.000621 | 0.111802 | 0.9110 | |
| ProLand | 2.397000 | 0.232688 | 10.30136 | 0.0000 | |
| ProLabor | -3.820744 | 0.601890 | -6.347908 | 0.0000 | |
| PerGDP | 核心变量 | 1.570417 | 0.382706 | 4.103459 | 0.0000 |
| PerGDP2 | -0.066274 | 0.025634 | -2.585370 | 0.0099 | |
| a | 28.72717 | 3.642856 | 7.885891 | 0.0000 | |
新窗口打开|下载CSV
4.3 耕地利用生物灾害脆弱性转型特征分析
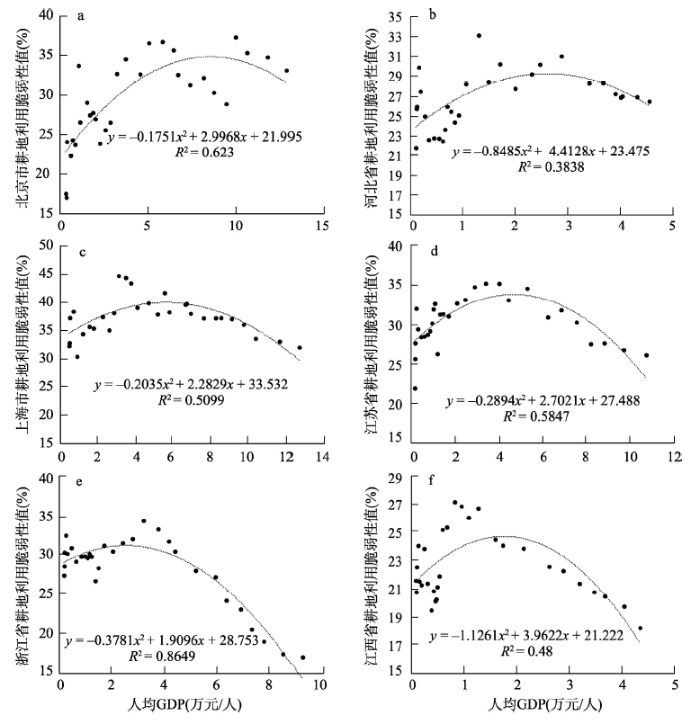
从转型路径和因子贡献两方面揭示耕地利用生物灾害脆弱性转型特征。为揭示转型路径,构建省级对照组,比较分析转型曲线形态。对照组构建原则为:① 每组包含2个省级地区;② 省级地区的耕地资源禀赋、自然环境条件基本一致,而经济社会发展水平差异显著。以全国农业区划方案(图5
 新窗口打开|下载原图ZIP|生成PPT
图51988—2017年省级对照组耕地利用生物灾害脆弱性转型倒“U”型曲线
Fig. 5The inverted U-shaped curves of transition in cultivated land use vulnerability to biological disasters in provincial control groups in China between 1988 and 2017
Tab. 5
表5
表51988—2017年省级对照组耕地利用生物灾害脆弱性曲线比较
Tab. 5
| 对照组 | 省级行政区 名称 | 耕地资源禀赋(hm2/人) | 自然环境 因素 | 经济社会发展 水平(万元/人) | 转型拐点特征值 | ||
|---|---|---|---|---|---|---|---|
| 人均GDP (万元/人) | 脆弱性值 (%) | 曲率 | |||||
| 对照组1 | 北京市 | 0.43 | 黄淮海平原 | 4.48 | 8.56 | 34.82 | 0.35 |
| 河北省 | 0.43 | 1.66 | 2.60 | 29.21 | 1.70 | ||
| 对照组2 | 上海市 | 0.32 | 长江中下游地区 | 4.95 | 5.61 | 39.93 | 0.41 |
| 江苏省 | 0.30 | 2.91 | 4.67 | 33.80 | 0.58 | ||
| 对照组3 | 浙江省 | 0.31 | 长江中下游地区 | 3.05 | 2.53 | 31.16 | 0.76 |
| 江西省 | 0.30 | 1.30 | 1.76 | 24.71 | 2.25 | ||
新窗口打开|下载CSV
图6
 新窗口打开|下载原图ZIP|生成PPT
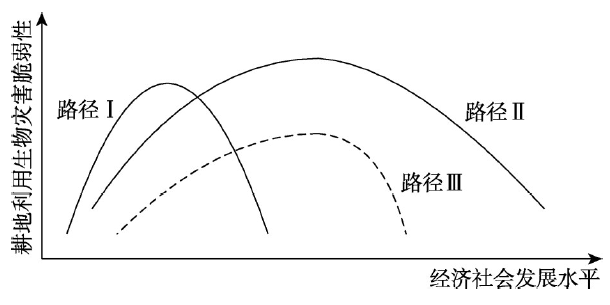
图6耕地利用生物灾害脆弱性转型路径
Fig. 6Pathways of transition in cultivated land use vulnerability to biological disasters
为进一步揭示耕地利用生物灾害脆弱性转型因子贡献,以农业区为基础,计算分析转型发生后即2010—2017年各指标变化幅度与脆弱性变化幅度的比值。由于数据缺失,不开展青藏高原区转型因子贡献分析。表6显示,在全国和农业区域尺度,脆弱性减弱主要源自暴露度下降,其次是应对能力提升,但是敏感性继续增强。暴露度下降主要源自城乡收入比缩小和劳均耕地的提升,应对能力增强主要源自生物灾害损失挽回率的提升和生物灾害防治失控率的下降,而敏感性增强主要源自作物多样性下降和耕地化肥使用强度上升。
Tab. 6
表6
表62010—2017年中国农业区耕地利用生物灾害脆弱性转型因子贡献(%)
Tab. 6
| 地区名称 | 脆弱 性变化 幅度 | 因子贡献 | |||||||||||
|---|---|---|---|---|---|---|---|---|---|---|---|---|---|
| 暴露度 | 敏感性 | 应对能力 | |||||||||||
| 小计 | 耕地压 力指数(+) | 劳均 耕地(-) | 城乡收 入比(+) | 小计 | 作物多样性(-) | 化肥使用强度(+) | 生物灾害发生强度(+) | 小计 | 生物灾害防治率(-) | 生物灾害 防治失控率(+) | 生物灾害 损失挽回率(-) | ||
| 全国 | -2.91 | 1.13 | 0.00 | 0.21 | 0.92 | -0.35 | -0.14 | -0.23 | 0.03 | 0.22 | 0.00 | 0.13 | 0.08 |
| 东北平原区 | -3.06 | 5.26 | 0.01 | -0.04 | 5.28 | -3.93 | -3.63 | -0.40 | 0.11 | -0.33 | -1.02 | 10.09 | -9.41 |
| 黄淮海 平原区 | -4.59 | 1.71 | 1.26 | -0.21 | 0.66 | -0.74 | -0.09 | -0.57 | -0.08 | 0.04 | 0.00 | -0.08 | 0.12 |
| 长江中 下游地区 | -5.93 | 0.49 | -0.08 | 0.10 | 0.46 | 0.46 | -0.07 | 0.22 | 0.31 | 0.05 | 0.00 | 0.02 | 0.04 |
| 华南区 | -4.30 | 0.71 | -0.01 | -0.11 | 0.83 | -0.05 | -0.13 | -0.09 | 0.17 | 0.35 | 0.00 | 0.04 | 0.31 |
| 四川盆地及周边地区 | -6.36 | 0.95 | 0.00 | 0.35 | 0.59 | -0.02 | -0.02 | 0.00 | 0.00 | 0.07 | 0.00 | 0.06 | 0.01 |
| 云贵高原区 | -1.38 | 7.36 | 0.01 | 2.77 | 4.59 | -7.78 | -5.33 | -2.43 | -0.02 | 1.42 | 0.31 | -0.22 | 1.33 |
| 黄土高原区 | -1.46 | 1.80 | 0.00 | 0.10 | 1.70 | -1.74 | -0.51 | -1.23 | -0.01 | 0.95 | 0.00 | 0.83 | 0.12 |
| 北方干旱半干旱区 | -0.92 | 1.07 | 0.00 | -0.02 | 1.09 | -0.51 | -0.74 | 0.23 | 0.00 | 0.44 | 0.00 | 0.17 | 0.39 |
新窗口打开|下载CSV
5 讨论
5.1 关于耕地利用生物灾害脆弱性管控政策的建议
本文研究发现,在自然环境条件和耕地资源禀赋基本一致的前提下,经济发展相对落后地区和相对发达地区的耕地利用生物灾害脆弱性分别沿“路径I”和“路径II”转型演化。为了降低生物灾害的影响,建议通过政策措施干预,引导耕地利用生物灾害脆弱性沿着“路径III”转型演化,即在经济社会发展水平较低阶段引导脆弱性慢速增长,当达到转型的经济社会条件时引导脆弱性快速下降。为进一步推动脆弱性快速减弱,建议如下:① 在暴露度管控方面,根据表6,首先要进一步促进农民增收、缩小城乡收入差距,降低耕地所承担的促进国民经济增长的压力。此外,劳均耕地对脆弱性下降的贡献较大,而耕地压力指数的贡献甚微。面板回归模型结果表明,提高土地生产率(ProLand)已无法有效降低脆弱性,但是提高劳动生产率(ProLabor)的作用显著。这就意味着,优化地劳关系、进一步加大耕地规模化经营水平,应当成为降低耕地利用生物灾害暴露度进而降低脆弱性的抓手。这一政策需求在黄淮海平原区和华南区尤为显著;② 在敏感性管控方面,表6显示,改进种植制度和农艺水平、提升作物多样化水平进而促进耕地生态系统组分从受损走向恢复,控制化肥使用强度进而促进耕地生态系统过程从受损走向恢复,是各地区增强耕地利用系统对生物灾害抵御能力的当务之急;③ 在应对能力管控方面,表6显示,生物灾害损失挽回率提升和生物灾害防治失控率下降是导致脆弱性下降的主要因素,而生物灾害防治率的影响甚微。这就意味着,提升生物灾害统防统治的技术水平和效率是未来提升生物灾害应对能力的关键。这对于东北平原区和云贵高原区尤为重要。5.2 关于耕地利用生物灾害脆弱性转型理论框架及脆弱性评价方法的讨论
本文明确了耕地利用生物灾害脆弱性的基本概念和构成要素。以自然环境为背景因素,从经济社会环境变化驱动的耕地利用角度构建了脆弱性转型理论框架,提出了脆弱性评价指标体系及评价方法。实证研究将自然环境因素设定为控制变量和背景条件,所得的研究结果证实了转型理论框架。生物灾害数据可获得性限制对评价指标选择构成了一定影响。在后续研究中,将综合实地调查、站点实验、遥感监测等多源数据,完善评价指标体系。在评价方法方面,尽管在评价指标的分值计算中引入了逻辑斯蒂增长模型,但是采用线性加权模型进行脆弱性分值综合。这在一定程度上掩盖了暴露度、敏感性、应对能力与脆弱性之间的非线性关系。对此,将在今后研究中发展耕地利用生物灾害脆弱性概念模型,以此为基础构建基于非线性关系的脆弱性定量评价模型。此外,本文在回归模型中,对气温、降水考虑不够精细,在未来研究中将随着研究尺度的下降而逐步精细化。5.3 关于耕地利用转型综合研究领域的探讨
综合性是土地利用转型研究的突出优势和内在要求[1, 3-4],集中体现在方法论的综合和研究对象的综合。对于方法论而言,土地利用转型研究紧紧围绕人地关系核心命题,充分吸收了社会生态学思想,旨在揭示人类集团(社会)的组织、行为与生态系统之间的交互作用[2,3,4]。以森林转型为例,空间行为对森林的影响,揭示了社会系统对生态系统的作用;为应对森林变化引起的生态环境效应而采取的策略如退耕还林,揭示了生态系统对社会系统的反馈及社会响应[84]。在研究对象方面,与土地利用/覆被变化研究相比,土地利用转型不再拘泥于对地块和区域尺度土地的生物物理、社会经济具体属性的监测分析,而是试图将土地及其利用属性综合为土地利用形态,揭示土地利用空间形态(格局)和功能形态变化随着经济社会发展的宏观规律。但是,有关这两种形态的耦合研究尚属少见[4, 20-22]。无论是从方法论还是从研究对象的综合来看,本文都发展了耕地利用转型研究的综合性。首先,本文构建的转型理论框架不仅耦合了耕地利用“趋利避害”动机与农业诱致性生产替代行为,而且建立了“经济社会环境—耕地利用活动—生物灾害反馈—灾害防治应对”社会生态交互逻辑。这不仅体现了人地关系命题,而且从生物灾害角度揭示了耕地利用这一空间行为与耕地生态系统之间的交互作用。其次,本文综合了耕地利用格局和耕地利用功能的内涵,从更加综合的角度——耕地利用生物灾害脆弱性,揭示耕地利用系统状态的趋势性转折,实现了土地利用空间形态(格局)与功能形态变化的耦合研究。因此,本文研究能够为建立耕地利用转型新的综合研究领域提供思路和参考。
6 结论
(1)耕地利用生物灾害脆弱性随着经济社会发展存在从增强转而减弱的转型。耕地利用“趋利避害”动机和农业诱致性生产替代行为是这一转型的决定性因素。(2)1988—2017年,耕地利用生物灾害脆弱性在国家、省级两个尺度发生了转型。在国家尺度,2010年前后人均GDP达到2.93万元/人时,脆弱性发生了转型。1988—2009年,全国脆弱性值从15.33%增长到22.45%,而2010—2017年从22.40%下降到19.49%。在省级尺度,耕地利用生物灾害脆弱性于2010年普遍转而减弱,存在2条典型转型路径。在自然环境条件和耕地资源禀赋基本一致前提下,经济社会发展水平较高地区的脆弱性更强,转型时的经济社会发展水平更高,转型后脆弱性减弱的速度更慢。
(3)耕地利用生物灾害脆弱性转而减弱主要源自因城乡收入比缩小和劳均耕地的提升而带来的暴露度下降,其次源自因生物灾害损失挽回率提升和生物灾害防治失控率下降而带来的应对能力提升。但是,脆弱性减弱后,主要源自作物多样性下降和耕地化肥使用强度上升带来的敏感性继续增强。
(4)本文基于“经济社会环境—耕地利用活动—生物灾害反馈—灾害防治应对”社会生态交互逻辑,建立的耕地利用生物灾害脆弱性转型理论框架以及以此为指导开展的实证研究,从方法论和研究对象两方面发展了耕地利用转型的综合性,论证了耕地利用生物灾害脆弱性有望成为耕地利用转型综合研究的新领域。
参考文献 原文顺序
文献年度倒序
文中引用次数倒序
被引期刊影响因子
[本文引用: 2]
[本文引用: 2]
[本文引用: 2]
DOI:10.1016/j.landusepol.2009.09.003URL [本文引用: 3]
DOI:10.11821/dlxb201703009URL [本文引用: 6]

Land change has been a hot topic in geographical research. The overarching and convincing theories of land change science, however, have not emerged. Establishment of land use transition theory is of significance for the theory basis of land change science. This paper attempts to establish a research framework of land use transition based on summarizing the development and implications of land use transition research and clarifying the differences between land use transition and land use change. Results show that transition research of artificial ecosystems, such as cultivated land, rural housing land and urban land, is of significance. Land use transition is distinguished from land use change on several aspects, such as fundamental types, temporal scale, spatial scale, agents, driving forces, trajectory, and results or effects. Research framework of land use transition covers transition diagnosis, mechanism research and effects research. Key issues of transition diagnosis are the establishment of measuring indices and diagnosis principles of land use spatial and functional morphologies from the perspectives of quantity change, landscape pattern change and management pattern change, and of land use externality and land use policy development. Mechanism of land use transition behaves as cascading effects of underlying driving factors of land use change, including demographic, economic, technological, institutional, cultural, and location factors. Mechanism research should place emphasis on interaction between land use spatial transition and functional transition. Effects of land use transition covers at least 17 themes relating to social, economic and environmental dimensions. Cultivated land use transition in France in 1961-2011 confirms the research framework of land use transition and is beneficial to the innovation of cultivated land protection in China.
[本文引用: 6]
URL [本文引用: 1]
[本文引用: 1]
[本文引用: 1]
[本文引用: 1]
DOI:10.1111/area.1998.30.issue-2URL [本文引用: 1]
DOI:10.1016/j.landusepol.2018.09.012URL [本文引用: 1]
[本文引用: 1]
DOI:10.1016/j.landusepol.2017.10.010URL [本文引用: 1]
DOI:10.1016/j.landusepol.2017.08.035URL [本文引用: 1]
DOI:10.1016/j.landusepol.2020.104470URL [本文引用: 1]
DOI:10.11821/dlxb201905012URL [本文引用: 7]
Changes of cultivated land use structures including type structure, input structure, and plantation structure, could succinctly reveal change of cultivated land use function morphology. Cultivated land use function transition (CLUFT) in the process of socio-economic development, however, is currently an issue to be resolved. Based on the underlying relationship between induced production substitution and cultivated land use structure change, this paper established a comprehensive explanation framework of the CLUFT. Then, the regional CLUFT was studied with Guangdong province as a typical case area. Results show that cultivated land use functional morphology in Guangdong overall entered the interim stage of the transition from socio-economic morphology to ecological and economic morphology. Cultivated land use function in the Pearl River Delta has accomplished the transition from socio-economic morphology to ecological-economic morphology. The rest of districts of Guangdong, however, accomplished the transition from socio-ecological morphology to socio-economic morphology. Both socio-economic and institutional forces drove the CLUFT in Guangdong. Mechanism of the CLUFT behaves as cascading effects of interactions among urbanization, socio-economic development, induced production substitution, changes of cultivated land use structures, and transformation of cultivated land use function morphologies. The positive analysis above justified the comprehensive explanation framework presented in this paper. That is, changes of cultivated land use structures could effectively denote cultivated land use function transition. With socio-economic development from its primary stage to an advanced one, changes of cultivated land use structures will drive transition of cultivated land use function morphology from socio-ecological morphology to socio-economic morphology, and to ecological and economic morphology under the direct force of induced production substitution. This paper presented new knowledges on morphology and transition explanations in land use transition research. Furthermore, new knowledges on the underlying mechanism of cultivated land use transition has been developed based on rethinking of the induced production substitution in agriculture. This study is of significance to bridge the knowledge gap of cultivated land use transition among scholars, the public, and policy makers and to deepen further research on land use transition. Finally, suggestions on transformation from dryland to paddy filed in southern China and control of socio-ecological effects of cultivated land use function transition were discussed.
[本文引用: 7]
DOI:10.1007/s13280-010-0081-9URLPMID:21141773 [本文引用: 1]
Urbanization is a global multidimensional process paired with increasing uncertainty due to climate change, migration of people, and changes in the capacity to sustain ecosystem services. This article lays a foundation for discussing transitions in urban governance, which enable cities to navigate change, build capacity to withstand shocks, and use experimentation and innovation in face of uncertainty. Using the three concrete case cities--New Orleans, Cape Town, and Phoenix--the article analyzes thresholds and cross-scale interactions, and expands the scale at which urban resilience has been discussed by integrating the idea from geography that cities form part of
DOI:10.1016/j.landusepol.2005.11.003URL [本文引用: 1]
AbstractRural housing land accounted for 67.3% of China's total construction land in 2000. While there are numerous studies analyzing the loss of arable land due to urban sprawl, less attention has been paid to the study of rural housing land in China. This paper develops a theoretical framework for rural housing land transition in China. It introduces a research method, which is using the spatial differentiation in regional development for compensating the deficiencies in time-series data, to analyze the rural housing land transition in the Transect of the Yangtse River (TYR). Detailed land-use data and socio-economic data from both research institutes and government departments were used to test the following hypothesis on rural housing land transition. We assume that rural housing in every region will undergo specific stages—the proportion of rural housing in the increase of total construction land will decline gradually with the development of the local economy, and the end of the transition corresponds to a new equilibrium between rural housing and other construction activities. Five regional types of rural housing land change were defined according to an aggregation index used to reflect landscape patterns. The outcomes indicated that the share of rural housing in the increase of total construction land declines gradually from the upper reaches to the lower reaches of the Yangtse River, i.e. from Ganzi–Yushu to Luzhou–Diqing, Enshi–Chongqing, Tongling–Yichang and to Shanghai–Chaohu. Each region is in a different phase of the rural housing land transition, which corresponds to a particular socio-economic developmental level. Finally, some policy implications were discussed by applying this research to land management issues. The authors argue that there are problems in the current rural housing land managerial system in China, and that the Central Government needs to define uniform regulations for rural housing according to regional socio-economic developmental level, physical conditions and rural housing land transition phase.]]>
URL [本文引用: 1]
[本文引用: 1]
[本文引用: 2]
[本文引用: 2]
[本文引用: 1]
[本文引用: 3]
[本文引用: 3]
[本文引用: 2]
DOI:10.1016/j.gloenvcha.2016.04.012URL [本文引用: 1]
[本文引用: 1]
URLPMID:31417231 [本文引用: 1]
Death tolls and economic losses from natural hazards continue to rise in many parts of the world. With the aim to reduce future impacts from natural disasters it is crucial to understand the variability in space and time of the vulnerability of people and economic assets. In this paper we quantified the temporal dynamics of socio-economic vulnerability, expressed as fatalities over exposed population and losses over exposed GDP, to climate-related hazards between 1980 and 2016. Using a global, spatially explicit framework that integrates population and economic dynamics with one of the most complete natural disaster loss databases we quantified mortality and loss rates across income levels and analyzed their relationship with wealth. Results show a clear decreasing trend in both human and economic vulnerability, with global average mortality and economic loss rates that have dropped by 6.5 and nearly 5 times, respectively, from 1980-1989 to 2007-2016. We further show a clear negative relation between vulnerability and wealth, which is strongest at the lowest income levels. This has led to a convergence in vulnerability between higher and lower income countries. Yet, there is still a considerable climate hazard vulnerability gap between poorer and richer countries.
DOI:10.1007/s10113-010-0179-4URL [本文引用: 1]
DOI:10.1038/s41559-018-0793-yURLPMID:30718852 [本文引用: 1]
Crop pathogens and pests reduce the yield and quality of agricultural production. They cause substantial economic losses and reduce food security at household, national and global levels. Quantitative, standardized information on crop losses is difficult to compile and compare across crops, agroecosystems and regions. Here, we report on an expert-based assessment of crop health, and provide numerical estimates of yield losses on an individual pathogen and pest basis for five major crops globally and in food security hotspots. Our results document losses associated with 137 pathogens and pests associated with wheat, rice, maize, potato and soybean worldwide. Our yield loss (range) estimates at a global level and per hotspot for wheat (21.5% (10.1-28.1%)), rice (30.0% (24.6-40.9%)), maize (22.5% (19.5-41.1%)), potato (17.2% (8.1-21.0%)) and soybean (21.4% (11.0-32.4%)) suggest that the highest losses are associated with food-deficit regions with fast-growing populations, and frequently with emerging or re-emerging pests and diseases. Our assessment highlights differences in impacts among crop pathogens and pests and among food security hotspots. This analysis contributes critical information to prioritize crop health management to improve the sustainability of agroecosystems in delivering services to societies.
[本文引用: 10]
[本文引用: 10]
DOI:10.1126/science.aaw1572URLPMID:31249049 [本文引用: 1]
DOI:10.1016/j.gloenvcha.2006.02.006URL [本文引用: 2]
DOI:10.1126/science.1111772URL [本文引用: 2]
DOI:10.11849/zrzyxb.2012.04.002URL [本文引用: 2]
This paper attempted to explore the way out for cultivated land protection in China from the viewpoint of multifunctional cultivated land based on the development of human living desire. Firstly, we discussed the process of cultivated land function development based on the connotation of multifunctional cultivated land. According to the process, optimization of social utility through conducting the competition of cultivated land function use on the premise of internalization of externality is the key issue of cultivated land function management. After understanding in depth this issue, we categorized cultivated land function management into monofunctional and multifunctional models. The former one is merely the transitional stage during the process of human living desire development. While, the latter one signals the direction of cultivated land resources management. Secondly, we demonstrated the two models by characterizing farmland protection in China, the Netherland and America. Finally, route of multifunctional cultivated land management was designed through integrating the experiences in the Netherland and America and the particularities in China based on the international comparison.
[本文引用: 2]
DOI:10.1016/j.gloenvcha.2017.11.009URL [本文引用: 1]
URLPMID:22106295 [本文引用: 1]
DOI:10.1016/j.ecolecon.2015.07.006URL [本文引用: 1]
DOI:10.1016/j.jclepro.2019.02.151URL [本文引用: 1]
URLPMID:29915067 [本文引用: 1]
URLPMID:12292354 [本文引用: 1]
[本文引用: 1]
[本文引用: 1]
DOI:10.1007/s11442-015-1204-9URL [本文引用: 7]
Land function change has been the focus of scientific research and policy making worldwide. Agricultural development and land use demand at present in China shared common characteristics with the countries such as Japan, South Korea, USA, and European developed countries, which have undergone cultivated land function transition. Whether cultivated land function transition occurred is of significance for land change science and cultivated land protection in China. However, there has been no explicit methodology for cultivated land function change research. This paper firstly presents a methodology by integrating policy development analysis based on the normative connotation of cultivated land function or termed cultivated land function demand and quantitative assessment based on the positive connotation of cultivated land function or termed cultivated land function supply. Then, cultivated land function transition is diagnosed by analyzing cultivated land function change in 1949-2012. Results show that cultivated land function transition overall occurred in 2006. Specifically, the normative cultivated land function or cultivated land function demand fragmented into seven types in 1985 and upgraded in 2004. Total value of the positive cultivated land function or cultivated land function supply turned to rise with an increase from 2.40 to 2.45 as the coefficients of variability (CV) of the value of the seven functions decreased from 2.94 to 2.29 in 2006-2012. The two-year gap between these two aspects of transition mainly resulted from the time lag effects of policy implementation. In the process of the transition, co-ordination and malposition of supply and demand of cultivated land function coexisted with supply lag and function morphology distortion. Considering the transition experiences in the developed countries mentioned above, suggestions on multifunctional cultivated land management are proposed. Moreover, route of land use transition research is discussed.
[本文引用: 2]
DOI:10.1016/S0959-3780(01)00007-3URL
DOI:10.1016/j.geoforum.2018.06.006URL
DOI:10.5367/oa.2013.0142URL [本文引用: 1]
This paper presents a quantitative model for assessing the spatiotemporal patterns in the growth of grain production in China between 1985 and 2008 using provincial panel data and a GIS model. The results show that the pathway for grain production relied mainly on land productivity growth as a rational response to the scarcity of cultivated land and a small peasant-based economy. Large-scale land management is the inevitable trend for agricultural development in China. In Inner Mongolia and Heilongjiang, promoting labour productivity accords with the requirement for the transition of cultivated land management in the future. The area of cultivated land per agricultural employee (1.33 ha) may be the reference threshold for large-scale land management. Finally, suggestions for regulations against regional cultivated land management are proposed.
[本文引用: 2]
[本文引用: 3]
[本文引用: 3]
URL [本文引用: 2]
DOI:10.1111/j.1467-9957.1954.tb00021.xURL [本文引用: 2]
[本文引用: 1]
DOI:10.1016/j.jrurstud.2014.10.005URL [本文引用: 1]
This paper investigates the way in which changes in social and industrial structures brought about by the urban-rural transformation process impact upon the relationship between farmland conversion and economic growth in post-reform China. Through this study, panel data analysis revealed that an inverted U-shape relationship existed between the factors of farmland conversion and economic growth in China in the period 2000-2009. The turning point, whereby decreasing farmland conversion is able to occur alongside economic growth, was found to have occurred in 2008, the year when China's per capita GDP exceeded 3000 US dollars. Moreover, rural-urban migration was not found to be significant with respect to this relationship, while the industrial upgrading from secondary to tertiary industries was found to help reduce farmland conversion. The paper highlights the important role that market and governmental forces play in initiating the shift from extensive to intensive and highly efficient land-use patterns. (C) 2014 Elsevier Ltd.
DOI:10.1007/s11442-014-1082-6URL [本文引用: 1]
Land-use/land-cover changes (LUCCs) have links to both human and nature interactions. China's Land-Use/cover Datasets (CLUDs) were updated regularly at 5-year intervals from the late 1980s to 2010,with standard procedures based on Landsat TM\ETM+ images. A land-use dynamic regionalization method was proposed to analyze major land-use conversions. The spatiotemporal characteristics,differences,and causes of land-use changes at a national scale were then examined. The main findings are summarized as follows. Land-use changes (LUCs) across China indicated a significant variation in spatial and temporal characteristics in the last 20 years (1990-2010). The area of cropland change decreased in the south and increased in the north,but the total area remained almost unchanged. The reclaimed cropland was shifted from the northeast to the northwest. The built-up lands expanded rapidly,were mainly distributed in the east,and gradually spread out to central and western China. Woodland decreased first,and then increased,but desert area was the opposite. Grassland continued decreasing. Different spatial patterns of LUC in China were found between the late 20th century and the early 21st century. The original 13 LUC zones were replaced by 15 units with changes of boundaries in some zones. The main spatial characteristics of these changes included (1) an accelerated expansion of built-up land in the Huang-Huai-Hai region,the southeastern coastal areas,the midstream area of the Yangtze River,and the Sichuan Basin;(2) shifted land reclamation in the north from northeast China and eastern Inner Mongolia to the oasis agricultural areas in northwest China;(3) continuous transformation from rain-fed farmlands in northeast China to paddy fields;and (4) effectiveness of the "Grain for Green" project in the southern agricultural-pastoral ecotones of Inner Mongolia,the Loess Plateau,and southwestern mountainous areas. In the last two decades,although climate change in the north affected the change in cropland,policy regulation and economic driving forces were still the primary causes of LUC across China. During the first decade of the 21st century,the anthropogenic factors that drove variations in land-use patterns have shifted the emphasis from one-way land development to both development and conservation.The "dynamic regionalization method" was used to analyze changes in the spatial patterns of zoning boundaries,the internal characteristics of zones,and the growth and decrease of units. The results revealed "the pattern of the change process," namely the process of LUC and regional differences in characteristics at different stages. The growth and decrease of zones during this dynamic LUC zoning,variations in unit boundaries,and the characteristics of change intensities between the former and latter decades were examined. The patterns of alternative transformation between the "pattern" and "process" of land use and the causes for changes in different types and different regions of land use were explored.
DOI:10.1007/s11442-018-1490-0URL [本文引用: 1]
3 km2 while the cropland decreased by 4.9×10³ km2, and the total area of woodland and grassland decreased by 16.4×10³ km2. The spatial pattern of land-use changes in China during 2010-2015 was concordant with that of the period 2000-2010. Specially, new characteristics of land-use changes emerged in different regions of China in 2010-2015. The built-up land in eastern China expanded continually, and the total area of cropland decreased, both at decreasing rates. The rates of built-up land expansion and cropland shrinkage were accelerated in central China. The rates of built-up land expansion and cropland growth increased in western China, while the decreasing rate of woodland and grassland accelerated. In northeastern China, built-up land expansion slowed continually, and cropland area increased slightly accompanied by the conversions between paddy land and dry land. Besides, woodland and grassland area decreased in northeastern China. The characteristics of land-use changes in eastern China were essentially consistent with the spatial govern and control requirements of the optimal development zones and key development zones according to the Major Function-oriented Zones Planning implemented during the 12th Five-Year Plan (2011-2015). It was a serious challenge for the central government of China to effectively protect the reasonable layout of land use types dominated with the key ecological function zones and agricultural production zones in central and western China. Furthermore, the local governments should take effective measures to strengthen the management of territorial development in future.]]>
DOI:10.1016/j.ecolecon.2016.01.001URL [本文引用: 1]
DOI:10.1073/pnas.1100480108URLPMID:21321211
A central challenge for sustainability is how to preserve forest ecosystems and the services that they provide us while enhancing food production. This challenge for developing countries confronts the force of economic globalization, which seeks cropland that is shrinking in availability and triggers deforestation. Four mechanisms-the displacement, rebound, cascade, and remittance effects-that are amplified by economic globalization accelerate land conversion. A few developing countries have managed a land use transition over the recent decades that simultaneously increased their forest cover and agricultural production. These countries have relied on various mixes of agricultural intensification, land use zoning, forest protection, increased reliance on imported food and wood products, the creation of off-farm jobs, foreign capital investments, and remittances. Sound policies and innovations can therefore reconcile forest preservation with food production. Globalization can be harnessed to increase land use efficiency rather than leading to uncontrolled land use expansion. To do so, land systems should be understood and modeled as open systems with large flows of goods, people, and capital that connect local land use with global-scale factors.
DOI:10.1016/j.landusepol.2018.04.009URL
DOI:10.1016/j.landusepol.2015.10.003URL [本文引用: 1]
URLPMID:20150447 [本文引用: 1]
DOI:10.1038/s41893-018-0076-2URL [本文引用: 1]
DOI:10.1016/j.agee.2018.02.011URL [本文引用: 1]
DOI:10.1016/j.agee.2017.01.040URL [本文引用: 1]
DOI:10.1016/j.fcr.2018.01.026URL [本文引用: 1]
DOI:10.1016/j.gloenvcha.2017.12.002URL [本文引用: 1]
[本文引用: 1]
URLPMID:31358630 [本文引用: 1]
//
[本文引用: 1]
URLPMID:26011743 [本文引用: 1]
[本文引用: 1]
[本文引用: 1]
[本文引用: 3]
[本文引用: 3]
[本文引用: 1]
[本文引用: 1]
[本文引用: 1]
[本文引用: 1]
[本文引用: 1]
[本文引用: 1]
[本文引用: 1]
[本文引用: 1]
[本文引用: 1]
[本文引用: 2]
[本文引用: 1]
DOI:10.1016/j.jtbi.2018.02.027URLPMID:29481822 [本文引用: 1]
Cell proliferation is the most important cellular-level mechanism responsible for regulating cell population dynamics in living tissues. Modern experimental procedures show that the proliferation rates of individual cells can vary significantly within the same cell line. However, in the mathematical biology literature, cell proliferation is typically modelled using a classical logistic equation which neglects variations in the proliferation rate. In this work, we consider a discrete mathematical model of cell migration and cell proliferation, modulated by volume exclusion (crowding) effects, with variable rates of proliferation across the total population. We refer to this variability as heterogeneity. Constructing the continuum limit of the discrete model leads to a generalisation of the classical logistic growth model. Comparing numerical solutions of the model to averaged data from discrete simulations shows that the new model captures the key features of the discrete process. Applying the extended logistic model to simulate a proliferation assay using rates from recent experimental literature shows that neglecting the role of heterogeneity can, at times, lead to misleading results.
[本文引用: 2]
[本文引用: 2]
[本文引用: 1]
[本文引用: 1]
[本文引用: 1]
[本文引用: 1]
[本文引用: 2]
[本文引用: 2]
[本文引用: 1]
