 ,1, 占文凤,1,2, 杨俊3, 刘紫涵1, 黄帆1, 赖佳梦1, 李久枫1, 洪发路1, 黄媛4, 陈吉科5, 李旭辉6
Urban heat island studies based on local climate zones: A systematic overview
JIANG Sida,1, ZHAN Wenfeng,1,2, YANG Jun3, LIU Zihan1, HUANG Fan1, LAI Jiameng1, LI Jiufeng1, HONG Falu1, HUANG Yuan4, CHEN Jike5, LEE Xuhui6通讯作者:
收稿日期:2019-11-27修回日期:2020-06-7网络出版日期:2020-09-25
| 基金资助: |
Received:2019-11-27Revised:2020-06-7Online:2020-09-25
| Fund supported: |
作者简介 About authors
江斯达(1996-), 女, 湖北黄冈人, 硕士生, 主要从事城市热岛遥感研究。E-mail:

摘要
关键词:
Abstract
Keywords:
PDF (2624KB)元数据多维度评价相关文章导出EndNote|Ris|Bibtex收藏本文
本文引用格式
江斯达, 占文凤, 杨俊, 刘紫涵, 黄帆, 赖佳梦, 李久枫, 洪发路, 黄媛, 陈吉科, 李旭辉. 局地气候分区框架下城市热岛时空分异特征研究进展. 地理学报[J], 2020, 75(9): 1860-1878 doi:10.11821/dlxb202009004
JIANG Sida, ZHAN Wenfeng, YANG Jun, LIU Zihan, HUANG Fan, LAI Jiameng, LI Jiufeng, HONG Falu, HUANG Yuan, CHEN Jike, LEE Xuhui.
1 引言
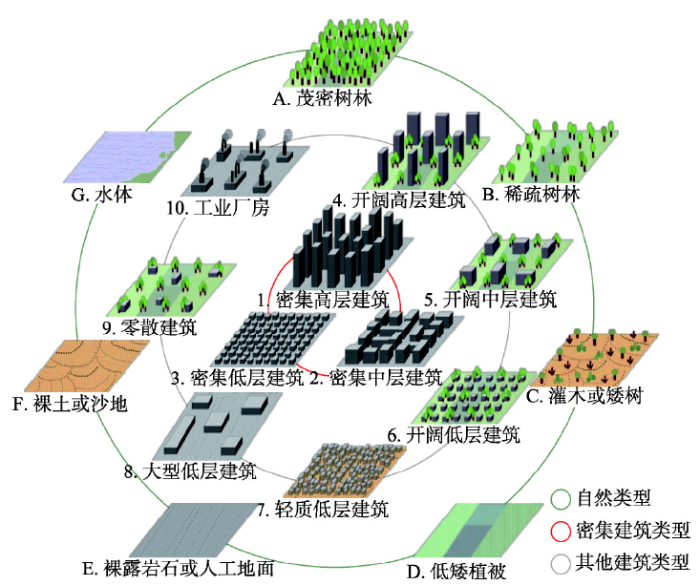
城市热岛效应对城市能源消耗、空气质量与人类健康等多方面影响深远,因而成为国内外众多****广泛关注的议题[1,2,3,4,5,6,7]。传统研究大多在“城—郊”二元划分(即将城市地表划分为城区和郊区2种类型)的框架下计算城市热岛强度并进一步探讨城郊热力差异[8,9,10]。然而,“城—郊”二元划分方法忽略了城郊内部三维结构与地表材质等多方面的差异,严重影响了城市热岛的准确评估,并进一步阻碍了全球范围内城市热岛的区域对比研究[11]。在此背景下,局地气候分区(Local Climate Zones, LCZ)分类体系应运而生[12]。根据地表覆盖、地表结构、地表材质和人类活动等方面的差异,LCZ体系制定了10个量化指标,并利用这些指标将城市下垫面划分为17种基本类型,包括10种建筑类型(LCZ 1~10)和7种自然类型(LCZ A~G)(图1)。LCZ体系建议用不同类型LCZ间的温差(ΔTLCZ X-LCZ Y,其中LCZ X与LCZ Y分别代表X类别与Y类别LCZ)定义并计算热岛强度,从而奠定了热岛强度区域乃至全球尺度准确对比的理论基础。早期,基于LCZ分区的城市热岛研究主要关注城市冠层的近地表气温(下文简称LCZ冠层热岛)[13,14,15]。随着LCZ遥感制图的发展,尤其伴随着能够快速获取地表温度的卫星热红外遥感反演技术的不断成熟,基于LCZ分区的城市地表热岛(下文简称LCZ地表热岛)研究受到广泛关注[16,17,18,19]。
图1
 新窗口打开|下载原图ZIP|生成PPT
图1LCZ体系的基本类型(据Stewart[12]改绘))
Fig. 1Standard types of the LCZ scheme (modified from Stwart[12])
LCZ体系极大地促进了城市热岛研究的快速发展[20]。然而,目前对LCZ框架下城市冠层和地表热岛时空分异特征仍缺乏系统性总结,主要体现在:① 数据获取手段缺乏概括,特别是对新方法、新技术的应用情况尚未进行充分梳理。② 时空格局缺乏深入分析,LCZ类别之间(简称“类间”)和类别内部(简称“类内”)在冠层和地表热岛时空分异特征的比较未受到充分关注。③ 影响因素缺乏详细归纳,尤其是一些潜在因素仍未引起足够重视。这些问题的存在,使得目前该领域的发展仍不够有序,同时也严重影响了对LCZ城市热岛研究领域的整体认知,进而阻碍了LCZ框架下区域乃至全球尺度下城市热岛的对比研究。
在理清LCZ发展脉络的基础上,本文以统计和“荟萃分析”(Meta-Analysis)为手段,通过整理与LCZ城市热岛有关的调查研究,综述LCZ城市热岛在数据获取手段、时空格局和影响因素3个方面的研究进展,进而深入探讨现有研究的不足并力图提出应对策略,以期为今后研究提供新思路。
2 LCZ发展脉络及研究现状
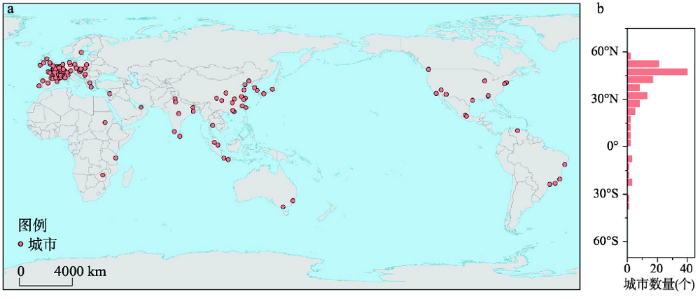
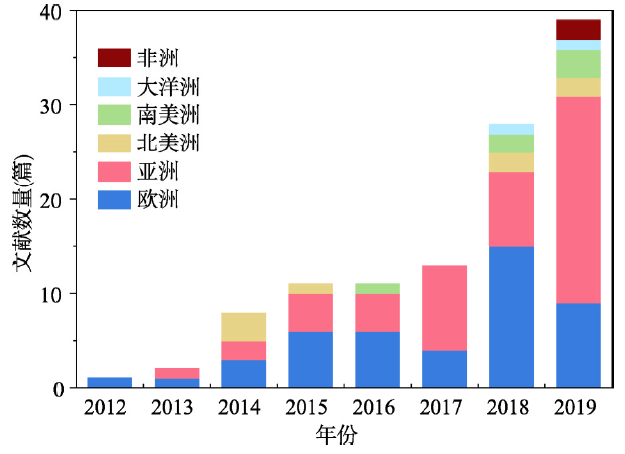
LCZ体系提出之前,国内外****已尝试发展了多种分类体系或城市气候图(Urban Climate Map)[21,22],来研究以城市热岛为代表的城市气候。然而,多数分类体系和城市气候图局限于少数特定的城市[23,24]。为此,在前期研究基础上[25],Oke等****尝试提出一种适应于全球的城市地表分区体系。历经城市气候带(Urban Climate Zones, UCZ)体系初步探索阶段[26,27]与热气候区(Thermal Climate Zones, TCZ)体系过渡阶段[28,29],LCZ体系雏形得以形成[30,31],并在之后得到最终确定[12]。与之前Oke提出的一系列体系相比,LCZ体系普适性更强。这主要体现在:一方面类型更加标准化,各类型高度抽象化地表真实形态,以适应不同城市复杂地表;另一方面分类指标更加完善,各指标对城市热环境具有高敏感性,而且指标值的参考范围由全球大量城市实地调查研究得到。自LCZ体系提出以来,全球范围内已有超过130座城市在LCZ框架下进行了城市热岛研究,这些城市大部分集中在北半球中纬度地区(35°N~55°N)(图2)。从大洲看,目前LCZ城市热岛研究仍主要集中于欧洲与亚洲城市(图3)。其中,欧洲城市最早开展相关研究,亚洲城市紧随其后,且随着时间推移,亚洲城市的文献数量在2019年已大幅超越欧洲;对北美洲和南美洲城市的研究相对较晚,文献数量也相对较少;对大洋洲和非洲城市的研究直到2018年才出现。
图2
 新窗口打开|下载原图ZIP|生成PPT
图2LCZ体系框架下开展热岛研究城市的全球分布(a)及纬度分布(b)
注:该图基于自然资源部标准地图服务网站下载的审图号为GS(2016)1665号的标准地图制作,底图无修改。
Fig. 2Global (a) and latitudinal (b) distributions of the cities where LCZ-based urban heat island has been investigated
图3
 新窗口打开|下载原图ZIP|生成PPT
图32012—2019年LCZ热岛研究文献数量逐年变化情况
Fig. 3Comparison of literature number related to the LCZ-based UHI by year (2012-2019)
围绕LCZ城市热岛的学术活动和研究项目也相继开展。学术活动方面,Remote Sensing期刊早在2015年即为LCZ城市热岛研究设立了专刊[32]。ICUC(2015年和2018年)[33]、PLEA(2017年和2018年)[34]以及JURSE(2017年和2019年)[35]等国际会议均多次设立有关LCZ城市热岛理论与应用的专门议题。此外,在中国香港和成都、爱尔兰都柏林与法国图卢兹等多座城市也专门开展了LCZ研讨会①(①资料来源:
3 基于LCZ的城市热岛分析文献综述
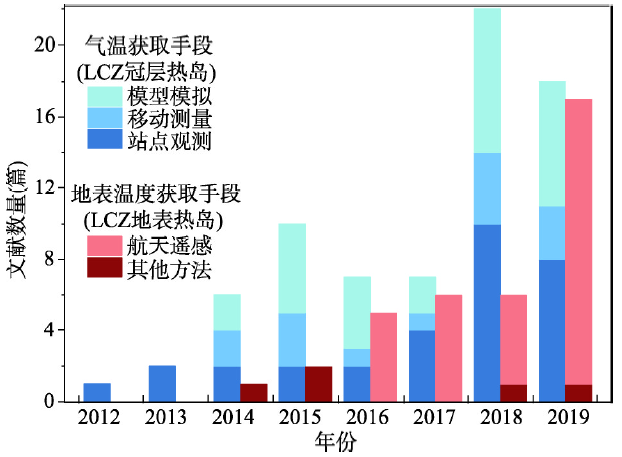
首先,在Google Scholar、ISI Web of Knowledge、中国知网(CNKI)等主流数据库中锁定2012年至2019年10月1日引用Stewart等[12]的所有文献,以标题、摘要或关键词中至少有一项包含“local climate zone”或“LCZ”等近似表达为基本筛选标准,初步得到与LCZ相关的文献。其次,逐篇浏览摘要,筛选出以研究城市热岛为主题的文献。最后,删除会议摘要等,保留期刊论文和会议论文,最终共得到文献107篇。需要特别说明的是,限于数据可获得性,本文可能遗漏部分硕士、博士学位论文等资料。统计结果表明,目前LCZ城市热岛研究主要关注以近地表空气温度(下文简称气温)表征的城市冠层热岛和以地表温度表征的城市地表热岛研究两类(图4)。由于LCZ最初旨在反映城市不同气象站点间气温的特征差异,因此LCZ冠层热岛研究开展得相对较早,且持续受到城市气候学家的关注。尤其在2018年,LCZ冠层热岛的文献数量激增。在2019年1—9月,冠层热岛研究的文献数量仍保持较高水平,预计文献数量将持续增长。相比于LCZ冠层热岛,LCZ地表热岛的研究起始时间相对较晚(始于2014年)。但是随着LCZ遥感制图的兴起以及卫星热红外遥感获取大范围地表温度的便利性[40],LCZ地表热岛文献数量亦呈现高速增长趋势,目前已成为新的研究热点(图4)。特别地,在2019年1—9月份,相关文献数量已接近2018年全年文献数量的3倍。
图4
 新窗口打开|下载原图ZIP|生成PPT
图4采用不同温度获取手段的LCZ冠层和地表热岛文献数量逐年变化情况对比
Fig. 4Comparison of literature number that applies different approaches to obtain temperatures for LCZ-based UHI studies
LCZ城市冠层和地表热岛研究的主要内容是评估不同局地气候分区的温度差异。研究过程通常涵盖如下3个步骤:① 获取温度数据;② 基于LCZ框架分析城市不同区域的温度差异,估算城市热岛强度,并分析城市热岛的时空格局特征规律;③ 探讨影响城市热岛时空分异特征的因素。下文将依次从温度数据获取、时空格局、影响因素3个方面进行综述。
3.1 温度数据获取手段综述
在研究LCZ冠层和地表热岛前,分别需要获取气温与地表温度数据,这两类温度数据的获取手段存在较大差异。气温数据主要通过“站点观测”“移动测量”和“模型模拟”3种方法获取(图4)。①“站点观测”方法最为常用(文献数量占42.5%),通常直接从城市气象站点获得气温观测资料,亦有少数研究在重点区域布置固定的小型气象站来收集气温资料。这种传统方法的优势在于其简便性,且历史数据通常较为丰富[41,42,43,44]。但在大多数城市,站点数量较少,这使得单个或某几个站点的观测结果难以代表单个LCZ区域内的整体平均气温[45]。特别地,在建筑密集的区域,如LCZ 1~3(均为密集建筑)等,观测站点往往非常缺乏,这导致其所对应LCZ的气温数据更加难以获取。②“移动测量”通常指利用车载测温仪器来自动采集行车路线上气温数据的一类方法。该方法通过灵活增加测量线路或位点,“加密”站点观测的单点数据,从而成为固定站点观测的重要补充[46,47](文献数量占19.2%)。然而,该方法耗时费力,且仅能获取某些时刻的气温数据,因此亦存在一定局限性。③“模型模拟”方法无需经过实地调查,只需输入各类地表参数,便可利用气候模型模拟获得长时间、大范围的气温数据,因而近年来逐渐受到更多关注[48,49,50,51](文献数量占38.3%)(图4)。然而,也正是因为输入参数较多,该方法的数据处理过程较为复杂,模型模拟结果难以逼近气温时空变化的真实情景[52]。需要说明的是,由于LCZ的适宜空间尺度(几百米至几千米)通常介于气象学中的微尺度和中尺度之间[53],因此目前采用的气候模型既包括小尺度模型,如ENVI-met[54,55]、TEB[56]与MUKLIMO_3[57,58]与UrbClim[59]等,也包括中尺度模型,如WRF[60,61,62]等。
地表温度数据主要通过“航天遥感”获取,也包括少量其他获取方法,例如“航空遥感”和“模型模拟”等(图4)。①“航天遥感”是指利用卫星热红外遥感影像反演地表温度进行LCZ热岛研究的方法。一般而言,卫星遥感的地表温度空间分辨率相对较低,但由于大多遥感影像数据可免费获取且覆盖范围广,因而得到广泛应用(文献数量占比86.5%)。目前所应用的地表温度数据主要由如下卫星传感器获得:TIRS(Landsat 8)、ASTER和MODIS。这3类传感器在时空分辨率上各有优缺点:TIRS影像的空间分辨率(100 m)相对较高,但其重访周期较长(16 d),且通常仅能获取上午时刻的地表温度[63];ASTER影像空间分辨率(90 m)亦相对较高,还可获得夜晚时分LCZ的地表温度,但其重访周期同样较长[64]。MODIS虽然能够获得每天4个时刻的地表温度数据,但其空间分辨率(1 km)较低,难以应用于LCZ面积较小的区域[65,66]。②“航空遥感”是指基于机载热红外遥感反演直接获得地表温度的方法,而“模型模拟”获得地表温度的方法与其模拟气温类似,即利用城市气候模型来模拟。尽管“航空遥感”能够获得较高空间分辨率的LCZ地表温度数据,但其成本相对高昂。相应地,“模型模拟”虽然相对便捷,但模拟结果的精度难以保证。因而这两种方法的研究文献数量占比较少(13.5%)。
3.2 热岛时空格局特征综述
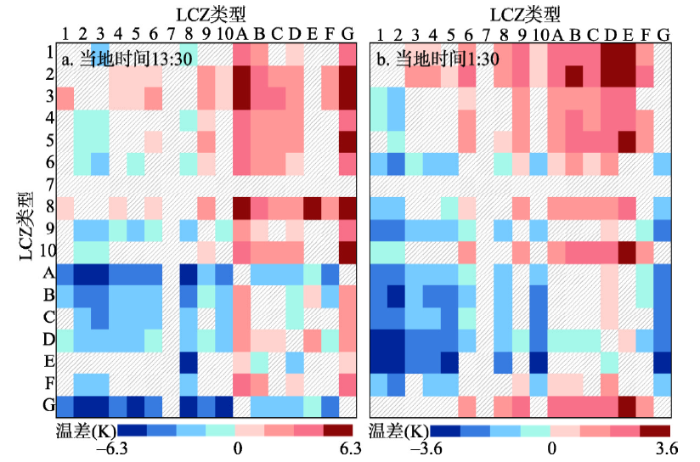
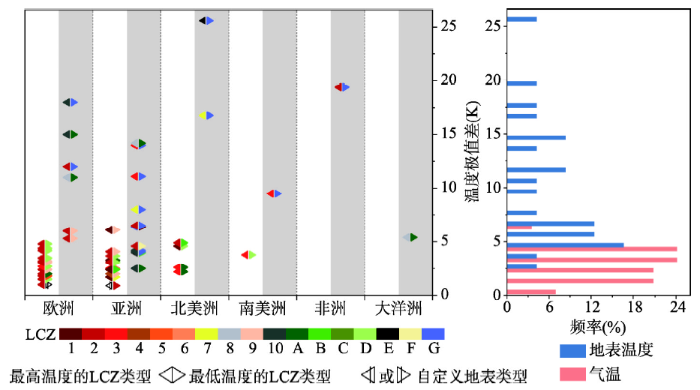
城市热岛时空格局一般是基于城市热岛强度进行定量分析。Stewart等****建议用LCZ间的温差表征城市热岛强度,即LCZ X均温与LCZ Y均温的差值(ΔTLCZ X-LCZ Y)[12]。目前,大部分研究的重点是不同类型LCZ的温差,即“类间热岛”(即X、Y不同)。少数研究在计算每类LCZ的均温时,发现分布在城市不同区域的同类别LCZ间亦存在较大温差,形成“类内热岛”(即X、Y相同)。因此下文将分别总结“类间热岛”和“类内热岛”时空格局的总体特征。3.2.1 类间热岛特征 在分析类间热岛时,通常采用“混淆矩阵”形式全面比较城市内不同类型LCZ间的温度差异(图5)。由于不同城市分布的LCZ类型不同,且部分文献中详细温度数据难以获取,因此本文主要提取既有文献中列出的温度最高值(Tmax)和最低值(Tmin)及其所对应的LCZ进行后续分析(详见表1和表2)。结果表明:类间的冠层热岛和地表热岛时空格局总体规律类似:无论在年际、季节、月和日内尺度上,建筑类型LCZ的气温和地表温度均普遍高于自然类型LCZ,且在夏季或冬季温度的差异较其他季节更为显著[67,68,69]。然而,类间冠层热岛和地表热岛的时空格局也存在一定的差异,主要体现在以下方面:① 极值差显著不同:不同城市的气温极值差范围为0.9~6.1 K,而地表温度极值差范围为2.5~25.6 K。所有城市的气温极值差(均值为3.1 K)均显著低于地表温度极值差(均值为9.8 K)(图6)。产生此现象的主要原因在于相比气温,地表温度直接反映地表热量差异,且异质性更大[67]。② 极值分布的LCZ类型有所不同:对于冠层热岛,LCZ 1~3(均属于密集型建筑)通常具有最高气温,而LCZ D(低矮植被)和LCZ 9(零散建筑)气温一般最低。就地表热岛而言,LCZ 8(大型低层建筑)和LCZ 10(工业厂房)是出现最高地表温度的常见类型,而LCZ A(茂密树林)是出现最低地表温度的类型(图6)。此外,在分布有LCZ G(水体)的城市,LCZ G白天地表温度通常最低,夜晚地表温度最高[70]。需要特别说明的是,在某些城市由于LCZ类型较少或背景气候较为特殊,出现温度极值的LCZ类型可能并非上述LCZ类型。例如,在美国芝加哥,LCZ 6(开阔低层建筑)达到气温最高值,主要原因在于该地区只划分出LCZ 3(密集低层建筑)和LCZ 6(开阔低层建筑)[71]。
图5
 新窗口打开|下载原图ZIP|生成PPT
图5由全球50座城市平均的LCZ类间地表温度差(行减去列)
注:斜纹方块表示对应行列的LCZ地表温度没有显著差异(K-S检验中显著性水平为0.05),数据来自Bechtel[20]。
Fig. 5Land surface temperature difference between LCZs for 50 cities (row value minus column value) (Twill squares indicate no significant differences (significance level is 0.05 in K-S test) and the source data are from Bechtel[20]).
Tab. 1
表1
表1不同城市LCZ气温极值情况(按大洲排列)
Tab. 1
| 城市(国家) | LCZ(Tmax) | LCZ(Tmin) | Tmax-Tmin(K) | 计算天数(d) | 背景气候* | 调查方法 | 数据源 |
|---|---|---|---|---|---|---|---|
| 安特卫普(比利时) | 2 | 9 | 3.2 | 20 | Cfb | 模型模拟 | 表1[72] |
| 布鲁塞尔(比利时) | 2 | 9 | 3.1 | 15 | Cfb | 模型模拟 | 表1[72] |
| 根特(比利时) | 2 | 9 | 2.0 | 16 | Cfb | 模型模拟 | 表1[72] |
| 奥洛穆茨(捷克) | 2 | 9 | 2.4 | 1 | Cfb | 移动测量 | |
| 柏林(德国) | 2 | D | 3.5 | - | Cfb | 站点观测 | |
| 布拉干萨(葡萄牙) | 2 | RCD | 1.0 | 1460 | Csb | 站点观测 | |
| 第戎(法国) | 2 | 5 | 1.8 | 1 | Cfb | 站点观测 | |
| 南锡(法国) | 2 | D | 4.4 | 26 | Cfb | 移动测量 | 表1[77] |
| 都柏林(爱尔兰) | 2 | D | 4.2 | 3 | Cfb | 移动测量 | |
| 格拉斯哥(英国) | 3 | D | 2.7 | - | Cfb | 站点观测 | |
| 米兰(意大利) | 2 | D | 1.5 | 1 | Cfa | 站点观测 | 表5[80] |
| 诺维萨德(塞尔维亚) | 2 | A | 2.0 | 1095 | Cfb | 站点观测 | |
| 塞格德(匈牙利) | 2 | D | 4.8 | 12 | Cfb | 站点观测 | |
| 乌普萨拉(瑞典) | 2 | D | 4.2 | 9 | Dfb | 移动测量 | |
| 成都(中国) | 1 | BG | 2.4 | 3 | Cwa | 移动测量 | 表2[83] |
| 重庆(中国) | H | 2 | 0.9 | 2 | Cfa | 移动测量 | |
| 南京(中国) | 24 | D | 3.1 | 78 | Cfa | 站点观测 | 表3[85] |
| 台北(中国) | 1 | A | 3.3 | 1 | Cfa | 移动测量 | |
| 香港(中国) | 1 | 9 | 6.1 | 2 | Cwa | 移动测量 | |
| 所有地区(新加坡) | 1 | 7 | 1.7 | 1 | Af | 模型模拟 | 表9[88] |
| 部分地区(新加坡) | 4 | 9 | 2.0 | 5 | Af | 站点观测 | 表2[89] |
| 长野(日本) | 24 | D | 3.7 | 9 | Cfa | 移动测量 | |
| 科钦(印度) | 2 | 9 | 4.1 | - | Am | 站点观测 | |
| 那格浦尔(印度) | 3 | 6 | 2.5 | 7 | Aw | 站点观测 | 表7[91] |
| 奥本(美国) | 3 | A | 2.6 | 7 | Cfa | 站点观测 | 表3[92] |
| 奥佩莱卡(美国) | 3 | A | 2.2 | 7 | Cfa | 站点观测 | 表2[92] |
| 温哥华(加拿大) | 1 | D | 4.6 | 4 | Csb | 移动测量 | |
| 克雷塔罗城(墨西哥) | 2 | B | 4.9 | - | Csa | 站点观测 | |
| 圣保罗(巴西) | 3 | D | 3.8 | 5 | Cfb | 移动测量 | 表3[94] |
新窗口打开|下载CSV
Tab. 2
表2
表2不同城市LCZ地表温度极值情况(按大洲排列)
Tab. 2
| 城市(国家) | 数据 | LCZ(Tmax) | LCZ(Tmin) | Tmax-Tmin(K) | 计算天数(d) | 数据源 |
|---|---|---|---|---|---|---|
| 布拉格(捷克) | TIRS | 10 | A | 15.0* | 1 | |
| 布尔诺(捷克) | TIRS | 10 | G | 18.0* | 1 | |
| 第戎(法国) | TIRS | 8 | A | 11.0* | 1 | |
| 日内瓦(瑞士) | TIRS | 2 | G | 12.0* | 1 | |
| 塞格德(匈牙利) | TIRS | 2 | 9 | 5.3* | 1 | 表3[96] |
| 塞格德(匈牙利) | 热红外成像仪 | 2 | 9 | 6.0* | 1 | |
| 重庆(中国) | TIRS | 10 | 4 | 4.6* | 1 | |
| 福州(中国) | TIRS | 8 | A | 14.2 | 1 | 表3[98] |
| 杭州(中国) | ASTER | G | A | 6.4* | 2 | |
| 南京(中国) | TIRS | 3 | G | 11.1 | 3 | |
| 上海(中国) | ASTER | G | D | 6.5* | 1 | |
| 台北(中国) | TIRS | 7 | G | 8.0 | 1 | |
| 武汉(中国) | TIRS | 3 | G | 14.0* | 1 | |
| 珠江三角洲(中国) | MODIS | 2 | G | 6.5* | 4 | |
| 昌迪加尔(印度) | TIRS | 10 | G | 4.2* | 1 | |
| 迪拜(阿联酋) | MODIS | 2 | F | 4.6* | - | |
| 曼谷(泰国) | TIRS | 10 | G | 4.1 | 3 | |
| 日惹(印度尼西亚) | TIRS | E | B | 4.0 | 1 | 表7[107] |
| 万隆(印度尼西亚) | TIRS | 10 | A | 2.5* | 1 | |
| 菲尼克斯(美国) | ASTER | E | G | 25.6 | 1 | 表6[109] |
| 拉斯维加斯(美国) | ASTER | 7 | G | 16.8 | 1 | 表6[109] |
| 圣保罗(巴西) | MODIS | 3 | G | 9.5* | - | |
| 哈拉雷(津巴布韦) | TIRS | 2 | G | 19.4 | 3 | |
| 悉尼(澳大利亚) | 热红外成像仪 | 8 | A | 5.4 | 2 |
新窗口打开|下载CSV
图6
 新窗口打开|下载原图ZIP|生成PPT
图6不同城市LCZ类间气温极值(白色区域内)和地表温度极值(灰色区域内)情况
Fig. 6The extreme values (maximum minus minimum) of the surface air temperature (white background) and land surface temperature (gray background) among LCZ types over various cities
3.2.2 类内热岛特征 在城市内部不同的地理位置,通常会存在一定的温度差异。由LCZ定义可知,其划分侧重于对地表形态与材质等的刻画,而相对忽略了LCZ所在的地理位置差异。因此,即使划分为同一类型的LCZ,由于其在城市内部的地理位置不同,也可能会存在一定温差。研究表明,分布在城市不同区域的单个LCZ之间均温存在显著区别,同时单个LCZ内部不同位点的温度也可能呈现较大差异,这些温差会导致类内热岛现象的出现[113,114,115,116]。
与类间热岛类似,类内热岛也可从类内冠层热岛和类内地表热岛两方面分析。目前学界对类内冠层热岛的研究相对较多,而极少关注类内地表热岛。为数不多的研究表明:① 类内冠层和地表热岛均未呈现普遍规律,亦没有鉴别出类内冠层和地表热岛强度显著较高或较低的特定LCZ,这可能是因为受城市所在地和测量时间的影响。例如,在中国香港地区,LCZ 6(开阔低层建筑)夏季白天类内气温差可达5.4 K[117],但在匈牙利塞格德,LCZ 6在夏季白天类内气温差却小于1.0 K,而在夏季夜晚类内气温差增至约1.5 K[81]。② 冠层类内热岛强度通常小于地表类内热岛强度,这同样是因为与气温相比,地表温度受地表物理属性的影响较大,其时空异质性相对更高[118]。
3.3 影响因素综述
不同LCZ的划分依据是地表覆盖、地表结构、地表材质和人类活动的差异[12],因此这4类因素通常是分析LCZ间温度差异的首要考虑对象,但在不同时间尺度下各因素的影响可能存在差异:(1)地表覆盖。通常将其直接量化为植被覆盖率。无论在年、月和日尺度,LCZ均温与植被覆盖率普遍呈负相关关系[119,120],且该关系在夏季或冬季更为显著[96, 110]。如捷克布拉格的夏季,LCZ A(茂密树林)的地表温度可比LCZ 10(工业厂房)低约15.0 K[17]。
(2)地表结构。通常将其量化为天空可视因子(Sky View Factor),在日尺度对LCZ温度的影响较大。在晴朗白天,不同高度和密度的建筑群区域的天空可视因子不同,造成建筑遮蔽效应,而建筑遮蔽与阴影能够产生显著的降温效应。研究普遍发现高层的LCZ 1(密集高层建筑)和LCZ 4(开阔高层建筑)气温低于中低层的LCZ 2(密集中层建筑)和LCZ 3(密集低层建筑),且温差可达1.5 K以上[87, 101, 112]。在夜晚,天空可视因子越大,降温速率越大,相应的LCZ温度则相对越低[78, 121]。
(3)地表材质。通常将其量化为地表反照率,但由于城市地表材质极为复杂,难以准确定量化,因此相关的定量研究较少[122]。对于大面积较为均质的自然类型LCZ,如LCZ A(茂密树林)、LCZ F(裸土或沙地)和LCZ G(水体),这三类LCZ地表反照率与其他类LCZ差异较大,LCZ温度特征明显;而对于异质性相对较高的建筑类型LCZ,LCZ间平均地表反照率的差异并不大,多数研究发现LCZ 2(密集中层建筑)和LCZ 3(密集低层建筑)的地表温度差异小于1.0 K[16, 96, 101]。
(4)人类活动。可将其量化为人为热排放[123],但由于人为热排放同样难以准确估算,故大多数研究采用人口密度数据[124]或夜间灯光数据[125]等间接表征人类活动的差异。该因素在日内尺度对LCZ温度有显著影响。在白天,人工热源相对集中的LCZ 8(大型低层建筑)和LCZ 10(工业厂房)的地表温度普遍较高,在部分城市甚至比LCZ 1~3(均属于密集型建筑)更高[17, 76, 98]。在夜晚,与以办公楼为主的LCZ相比,以居民楼为主的LCZ内人类活动更加频繁,两类LCZ的气温亦因此差异显著[126]。
大部分研究主要关注上述因素,但事实上还存在其他潜在因素发挥重要影响,这可能也是“类内热岛”现象产生的主要原因。这些因素包括:
(1)建筑布局。尤其体现在建筑密集的LCZ 1~3。“封闭庭院”或“开敞联排”可能会使得风速、风向等气象要素产生显著区别,形成不同的微气候,进而影响空气温度[114, 127]。“街道朝向”对地表接收的太阳短波辐射有所关联,也能够造成不同区域地表温度的差异[128]。
(2)建筑材质。即使在同类LCZ(按标准定义同类LCZ可看作地表材质近似),其内部建筑物既存在砂石、砖块、玻璃等不同建筑材料,亦存在深色和浅色房顶等不同的材料颜色。不同建筑材质的热属性(如反照率与热传导率)差异较大,由此造成地表温度的空间异质性相对较高[104]。
(3)邻近效应。由于局部大气环流的影响,在边缘效应的作用下,LCZ气温易受到邻近LCZ气温的影响。一般地,城市中心气温较高,而城市外围气温较低。因此,就同类LCZ而言,其处于城市中心区域气温较高,而处于城市外围或边缘区域气温较低。例如,LCZ 6(开阔低层建筑)和LCZ 9(零散建筑)[46, 90]通常从城市中心到外围广泛分布,受邻近效应影响较大。
除以上3类潜在因素外,风速风向、云覆盖量、降雨、湿度等气象条件对温度影响同样较大[129,130,131,132]。特别地,对于遥感地表温度,不同地表温度反演算法[17]以及热辐射方向性效应[128]等亦能够对热岛强度时空分异特征产生一定影响。
4 讨论与展望
在学界的共同努力下,基于LCZ框架的城市热岛研究已取得了显著进展,但仍存在以下不足:① 温度数据获取手段不够丰富;② 时空格局的探讨不够全面;③ 影响因素缺乏定量分析。下文将针对这些问题分别进行讨论,尝试提出针对性的建议,并对未来的研究方向做出展望。4.1 温度数据获取方面
获得在时间与空间维度足量的气温或地表温度数据是进行LCZ城市热岛研究的前提。就当前LCZ研究而言,气温主要基于城市内已有的为数不多的气象站点观测,但大区域内详细数据的可获得性不高;地表温度主要通过卫星热红外遥感获得,但受限于其时空分辨率难以兼顾和云遮挡效应,目前仅能分析少数时空位点的情况。以上两个方面严重阻碍了LCZ城市热岛时空格局研究进一步走向深入。在气温数据获取方面,可考虑以下方法:① 采用众包(Crowdsourcing)方法。例如,可以与环卫工作者合作,使其工作时随身携带测温仪,记录城市内不同街区的温度。相比于实地调查,利用众包方法有望获得更为丰富的数据。②充分利用公开数据网站和手机应用APP。部分气象网站和APP提供全球温度数据(例如网站
在地表温度数据获取方面,可以考虑以下方法:① 利用无人机搭载红外热像仪。随着无人机产业的快速发展,通过航空遥感获得地表温度数据的成本将大大降低。搭载红外热像仪的小型无人机可方便地进行多次重复观测,获得更加丰富的数据。② 充分利用各类卫星遥感数据。例如目前除了利用Landsat上午时刻的数据,还可尝试结合Landsat夜间观测数据[134],获得LCZ城市地表热岛的日、夜特征。又如,葵花八号(Himawari-8)气象卫星数据拥有时间分辨率高(10 min)的优势,尽管其空间分辨率较低(2 km),但对于异质性较低的区域值得尝试[135]。未来,随着搭载热红外传感器小卫星的发射,有望获得具有更高时空分辨率的地表温度数据,用于辅助LCZ城市热岛研究。③ 借助模型或算法获得时间连续的高空间分辨率地表温度数据。例如,可采用遥感地表温度年内变化(Annual Temperature Circle, ATC)或者日内变化(Diunral Temperature Circle, DTC)模型,重建LCZ年内或日内连续的地表温度数据集[20, 136-137]。又如,可考虑耦合地表温度时空降尺度模型与多源卫星遥感地表温度产品,获得高时空分辨率的地表温度数据[138,139]。此外,已有极少量研究利用城市气候模型模拟地表温度[54, 140],但其适用性仍需更多探讨。部分小尺度气候模型(例如ENVI-met与UrbClim等)在今后研究中亦有一定潜力。
4.2 时空格局分析方面
对城市热岛时空格局的全面认知是LCZ城市热岛研究中的重要课题。目前,就冠层热岛而言,空间分异特征仍不够明晰。在城市尺度下,部分特定LCZ(如LCZ E)的气温分布规律仍不够清楚。这主要是由于气温数据大多来源于少数离散的气象观测站点,而观测站点往往并未均匀分布于所有LCZ。在今后研究中可适当应用其他获取气温数据的方法。相对地,就地表热岛而言,其时间演变特征不够明晰,尤其体现于日尺度。这主要是因为目前仅能获取少量卫星过境时刻地表的瞬时温度产品。可尝试利用DTC模型(详见4.1节)模拟得到日内时间连续的地表温度数据[141]。此外,无论对于LCZ冠层还是地表热岛,都尚未在统一条件下,开展大范围城市间的区域乃至全球对比探索。尽管已有少数研究尝试比较了多座城市的LCZ城市冠层或地表热岛[20, 81, 85],然而其研究条件尚未完全统一。一方面,作为进行LCZ全球城市热岛研究的重要基础,LCZ全球制图仍未完全实现,各城市LCZ制图结果主要来自于不同****在不同时期的研究,这将难以保证制图结果统一性与时效性。另一方面,获取LCZ温度数据时间未统一。各研究对城市冠层热岛研究的时间尺度不同,LCZ空气温度数据的时间可比性较差。考虑到LCZ体系普适性高且适宜推广至全球,因此应当逐步开展长时间序列全球范围的LCZ热岛比较研究:首先,需得到大范围的LCZ制图结果。目前已有最新研究利用机器学习方法,将LCZ制图范围扩展到大洲尺度[142]。在相关研究项目支持下(例如WUDAPT项目[143]等),进一步深度应用各类高等机器学习算法,有望实现LCZ全球制图。其次,需获取详细的LCZ温度数据。拓展温度数据的获取手段在一定程度上将有助于丰富气温与地表温度数据源。最后,在区域乃至全球对比分析时需特别关注以下问题:① LCZ类型本身的变化。年内尺度下植被的物候效应、年际尺度下城市的扩张等因素可能会造成LCZ类型的改变[144,145,146]。②LCZ均温的计算方法。由于类内热岛现象的存在,同类LCZ温差可能过大,因而将城市内所有同类LCZ的温度进行简单平均,可能难以全面反映该城市各LCZ的温度特征。为了克服部分同类LCZ温差过大的不足,在LCZ均温可考虑引入其距离市中心距离等因素[46]。
4.3 影响因素研究方面
从形成机理层面深入分析LCZ城市热岛的影响因素,将对城市热岛缓解措施或政策制定具有直接指导意义。但目前研究仍主要聚焦于在理想气象条件(晴朗无风)下,定性分析地表覆盖、地表结构、地表材质和人类活动等因素的影响。因此仍需注意如下问题:① 对其他潜在影响因素缺乏探索。例如,在类内热岛方面,当类内热岛强度过大时,说明LCZ制图依据(即地表覆盖、地表结构、地表材质和人类活动)或许已不是类内热岛的主导影响因素,这也意味着其他影响因素(如LCZ空间尺度、邻近LCZ的温度)未得到充分考虑[113, 147-148]。又如,在传统二分法框架下已发现背景气候对热岛强度有较大影响[3]。类似地,背景气候亦可能对LCZ城市热岛强度计算造成的一定影响。② 对多数影响因素缺乏定量分析。各因素对LCZ城市热岛强度的影响程度仍不够明晰。例如,与LCZ冠层城市热岛相比,非理想气象条件下各气象要素对LCZ地表城市热岛有一定的影响,但各气象因子的影响程度还不清楚。针对上述问题,可考虑以下方法:① 增加潜在影响因素的信息。例如,在探究LCZ空间尺度的影响时,可考虑增加单个LCZ面积与形状等信息。又或在探究LCZ邻近效应时,可以附加相邻LCZ类型、与LCZ G(水体)的距离等[90, 149-150]。② 对各影响因素与LCZ热岛强度进行归因分析。在城郊二分法的分类框架下,现有研究已经总结出控制热岛强度时空格局的各类因子,并利用相关分析[10]、统计回归[151]、模型模拟[3]等方法对不同因子的作用进行定量化研究。近年来,已有少量研究初步探索了各因子与LCZ热岛强度的相关关系[152,153,154],未来可考虑将归因分析方法应用到LCZ尺度上。
5 结论
本文采用统计和“荟萃分析”方法,梳理并总结了LCZ冠层和地表热岛在温度数据获取手段、时空格局普遍规律以及主要影响因素等方面的进展,并展望了未来的研究重点。结果表明,迄今为止全球范围内已在超过130座城市开展了LCZ城市热岛研究,这些城市主要集中于中纬度(35°N~55°N)的亚洲和欧洲地区,且主要聚焦于冠层热岛和地表热岛。主要结论如下:(1)在温度数据获取方面:LCZ冠层和地表热岛的数据获取手段存在显著差别。就冠层热岛研究而言,虽然站点观测和移动测量仍较为常用,但模型模拟方法(文献数量占比38.3%)近年来逐渐受到重视。其他新方法值得进一步探索,如众包方法、共享网站数据利用、空气温度时空重建等。就地表热岛研究而言,目前以航天遥感为主(文献数量占比86.5%),但局限于TIRS、ASTER和MODIS的等热红外传感器地表温度数据产品。后续研究可考虑利用无人机热红外遥感或高空间分辨率静止卫星热红外遥感数据,以及借助模型或算法获得高时空分辨率遥感地表温度等。
(2)在时空格局方面:“LCZ类间热岛”现象普遍存在,而且“LCZ类内热岛”现象亦较为常见。就“类间热岛”而言,建筑类型(LCZ 1~10)的气温和地表温度普遍高于自然类型(LCZ A~G),LCZ类间气温极值差(均值为3.1 K)显著低于地表温度极值差(均值为9.8 K),该极值差在大部分城市往往在夏季或冬季达到最大。关于“类内热岛”的研究较少,亦没有鉴别出冠层和地表热岛强度显著较高的LCZ类型。今后研究可考虑:① 继续深入研究类内热岛的时空特征;② 发展更好的LCZ均温的计算方法;③ 逐步开展长时间序列全球范围LCZ热岛比较,但尤其要注意LCZ类型本身可能随时间变化。
(3)在影响因素方面:目前多数研究局限于定性分析热岛强度与地表结构、覆盖、材质和人类活动等因素的影响。今后应注重对各影响因素进行定量分析(如归因分析)。建筑布局、邻近效应、建筑材质、与LCZ G(水体)距离与背景气候等对LCZ热岛也有一定影响,尤其对类内热岛影响显著,故今后研究可考虑此类潜在的影响因素。
本文将有利于今后更好地从整体上把握LCZ城市热岛的研究现状和发展趋势,亦有望为缓解城市热岛效应做出贡献。
参考文献 原文顺序
文献年度倒序
文中引用次数倒序
被引期刊影响因子
DOI:10.1016/S0034-4257(03)00079-8URL [本文引用: 1]
DOI:10.11821/dlxb201311002URL [本文引用: 1]

Urban heat island is the interactive result between human factors and the local weather conditions. In terms of human factors, land use and land cover change, anthropogenic heat and atmospheric emissions of pollutants caused by the interaction between industrialization and urbanization are particularly important. This article reveals the impacting mechanism of urban heat islands effect from the three aspects including scale and intensity, types and layout, and patterns of land use changes exemplified by Shanghai. Empirical evidences show that: (1) Land urbanization is the most important factor affecting urban heat island intensity in Shanghai. In terms of the influence of built-up area expansion on heat island intensity, accumulative effect is greater than incremental effect; (2) Industrialization, real estate development, and population growth are the second more important factors impacting urban heat island intensity in Shanghai. As far as the influence of economic development and energy consumption on heat island intensity is concerned, density effect is often greater than size effect; in terms of the influence of floor space of completed buildings and buildings with over 20 storeys on heat island intensity, accumulative effect is less than incremental effect; as for the influence of population growth on heat island intensity, density effect and size effect are approximately equivalent; (3) Dissimilar urban land properties or types and urban development modes lead to spatial disparity in urban heat island intensity.
[本文引用: 1]
URLPMID:25008529 [本文引用: 3]
[本文引用: 1]
DOI:10.1038/s41558-018-0320-9URL [本文引用: 1]
DOI:10.11821/dlxb201903006URL [本文引用: 1]
Urban heat islands resulting from land use and land cover change have become a major barrier to urbanization and sustainable development of ecological urban environments. Although many studies have focused on the interannual and seasonal characteristics of urban heat islands, there has been no comparative analysis of the urban surface thermal landscape at multiple spatio-temporal scales. This study described the spatio-temporal patterns of the urban surface thermal landscape in different seasons and by time of day (daytime/nighttime) in terms of quantity, shape, and structure using MODIS LST products, and revealed the evolution of the urban surface thermal landscape using mapping techniques and analysis of barycenter trajectories in metropolitan Beijing between 2003 and 2017. The conclusions were as follows: (1) The characteristics of the urban surface thermal landscape vary significantly in different seasons and by time of day. (2) The medium-temperature zone constitutes the largest proportion of the area of metropolitan Beijing, which is the most unstable area during the daytime and the instability of the sub-high-temperature and sub-low-temperature zones increased at night. (3) The stable zone is most important in terms of the change in the land surface thermal landscape, followed by the repeated-changes zone and the zone where the change occurred in the first 5 years. The changes of different temperature zones usually increased or decreased progressively. There was a cooling trend in the mountains. In the north mountain-transition zone, the process of transferring between sub-low temperature and medium temperature was repeated. There was a warming trend in the south. (4) The area of the high-temperature zone increased from 2003 to 2017 and its barycenter was concentrated in the city center; the barycenter of the low-temperature zone moved to the urban fringe. The ecological conservation development zone made the greatest contribution to the surface thermal landscape in metropolitan Beijing. The spatio-temporal distribution and evolution of the urban surface thermal landscape support management decisions aimed at alleviating the effect of the urban heat island.
[本文引用: 1]
URLPMID:31485056 [本文引用: 1]
[本文引用: 1]
[本文引用: 1]
DOI:10.11821/xb200707005URL [本文引用: 1]
oC/10a in mega city. (2) The urban heat island (UHI) effect on regional mean air temperature in different seasons is summer > autumn > spring > winter. (3) The UHI intensity and the urban total population logarithm are creditable correlated. (4) The UHI effect made the regional annual mean air temperature increased 0.072 oC from 1961 to 2005 and 0.047 oC from 1991 to 2005, and the annual maximum air temperature increased 0.162 oC and 0.083 oC from 1991 to 2005, all indicating that the urban expansion in the Yangtze River Delta from 1991 to 2005 may be regarded as a serious climate signal.]]>
[本文引用: 1]
URLPMID:22142232 [本文引用: 2]
DOI:10.1002/joc.2141URL [本文引用: 1]
In the modern era of urban climatology, much emphasis has been placed on observing and documenting heat island magnitudes in cities around the world. Urban climate literature consequently boasts a remarkable accumulation of observational heat island studies. Through time, however, methodologists have raised concerns about the authenticity of these studies, especially regarding the measurement, definition and reporting of heat island magnitudes. This paper substantiates these concerns through a systematic review and scientific critique of heat island literature from the period 1950-2007. The review uses nine criteria of experimental design and communication to critically assess methodological quality in a sample of 190 heat island studies. Results of this assessment are discouraging: the mean quality score of the sample is just 50 percent, and nearly half of all urban heat island magnitudes reported in the sample are judged to be scientifically indefensible. Two areas of universal weakness in the literature sample are controlled measurement and openness of method: one-half of the sample studies fail to sufficiently control the confounding effects of weather, relief or time on reported 'urban' heat island magnitudes, and three-quarters fail to communicate basic metadata regarding instrumentation and field site characteristics. A large proportion of observational heat island literature is therefore compromised by poor scientific practice. This paper concludes with recommendations for improving method and communication in heat island studies through better scrutiny of findings and more rigorous reporting of primary research. Copyright. (C) 2010 Royal Meteorological Society
DOI:10.1175/BAMS-D-11-00019.1URL [本文引用: 7]
DOI:10.5937/GeoPan1303060SURL [本文引用: 1]
URLPMID:23007798 [本文引用: 1]
DOI:10.1016/j.scs.2015.04.010URL [本文引用: 1]
[本文引用: 3]
URL [本文引用: 6]
URL [本文引用: 1]
[本文引用: 1]
[本文引用: 1]
URL [本文引用: 5]
DOI:10.1175/1520-0450(1978)017<0636:COLUAC>2.0.CO;2URL [本文引用: 1]
DOI:10.1002/joc.2237URL [本文引用: 1]
Since their introduction 40 years ago, worldwide interest in urban climatic map (UCMap) studies has grown. Today, there are over 15 countries around the world processing their own climatic maps, developing urban climatic guidelines, and implementing mitigation measures for local planning practices. Facing the global issue of climate change, it is also necessary to include the changing climatic considerations holistically and strategically in the planning process, and to update city plans. This paper reviews progress in UCMap studies. The latest concepts, key methodologies, selected parameters, map structure, and the procedures of making UCMaps are described in the paper. The mitigation measures inspired by these studies and the associated urban climatic planning recommendations are also examined. More than 30 relevant studies around the world have been cited, and both significant developments and existing problems are discussed. The thermal environment and air ventilation condition within the urban canopy layer (UCL) of the city are important in the analytical processes of the climatic-environmental evaluation. Possible mitigation measures and planned actions include decreasing anthropogenic heat release, improving air ventilation at the pedestrian level, providing more shaded areas, increasing greenery, creating air paths, and controlling building morphologies. Further developments have and will continue to focus on the spatial analysis of human thermal comfort in urban outdoor environments and on the impacts and adaptations of climate change. Mapmakers must continue to share lessons and experiences with city planners and policy makers, especially in the rapidly expanding cities of developing countries and regions. Copyright (c) 2010 Royal Meteorological Society
DOI:10.1016/0378-7788(91)90097-MURL [本文引用: 1]
DOI:10.1016/S1352-2310(99)00161-2URL [本文引用: 1]
[本文引用: 1]
[本文引用: 1]
[本文引用: 1]
[本文引用: 1]
[本文引用: 1]
[本文引用: 1]
[本文引用: 1]
URLPMID:30147945 [本文引用: 1]
URL [本文引用: 1]
URL [本文引用: 1]
URL [本文引用: 1]
[本文引用: 1]
[本文引用: 1]
[本文引用: 1]
[本文引用: 1]
DOI:10.3390/ijgi4010199URL [本文引用: 1]
DOI:10.1016/j.uclim.2014.02.004URL [本文引用: 1]
URLPMID:31376601 [本文引用: 1]
DOI:10.1016/j.buildenv.2019.05.004URL [本文引用: 1]
[本文引用: 1]
[本文引用: 2]
[本文引用: 3]
[本文引用: 1]
[本文引用: 1]
DOI:10.15201/hungeobull.65.2.8URL [本文引用: 1]
DOI:10.1007/s11524-018-0322-yURLPMID:30353483 [本文引用: 1]
UrbClim, the urban climate model, is used for short- and long-term projections of climate for Delhi. The projections are performed for RCP8.5 using an ensemble of 11 GCM model outputs. Various heat stress indices were employed to understand the role of urban heat island (UHI) in influencing the present and future urban climate of the city. UHI intensity based on 5% warmest nights (TNp95) was 4.1 degrees C and exhibits negligible change over time. However, the impact of UHI on other heat stress indices is very strong. Combined hot days and tropical nights (CHT) that influenced 58-70% of the reference time frame are expected to rise to 68-77% in near-future and to 91-97% in far-future time periods. For reference time period, urban areas experience 2.3 more number of heat wave days (NHWD) than rural areas per summer season. This difference increases to 7.1 in short-term and 13.8 in long-term projections. Similar to this trend, frequency of heat waves (FHW) for urban areas is also expected to increase from 0.8 each summer season in reference time frame to 2.1 and 5.1 in short- and long-term projections. The urban-rural difference for duration of heat waves (DHW) appears to increase from 1.7 days in past to 2.3 and 2.2 days in future, illustrating that DHW for cities will be higher than non-urban areas at least by 2 days. The intensity of heat wave (IHW) for urban land uses increases from 40 degrees C in reference time frame to 45 degrees C in short-term projection to 49 degrees C in far future. These values for non-urban land use were 33 degrees C during the baseline time period and are expected to increase to 42 degrees C and 46 degrees C in near- and far-future time frames. The results clearly indicate the contribution of UHI effects in intensifying the impacts of extreme heat and heat stress in the city.
URL [本文引用: 1]
DOI:10.1016/j.enbuild.2019.04.001URL [本文引用: 1]
[本文引用: 1]
DOI:10.1016/j.landurbplan.2013.11.004URL [本文引用: 2]
This study investigates the impact of urban form and landscaping type on the mid-afternoon microclimate in semi-arid Phoenix, Arizona. The goal is to find effective urban form and design strategies to ameliorate temperatures during the summer months. We simulated near-ground air temperatures for typical residential neighborhoods in Phoenix using the three-dimensional microclimate model ENVI-met. The model was validated using weather observations from the North Desert Village (NDV) landscape experiment, located on the Arizona State University's Polytechnic campus. The NDV is an ideal site to determine the model's input parameters, since it is a controlled environment recreating three prevailing residential landscape types in the Phoenix metropolitan area (mesic, oasis, and xeric). After validation, we designed five neighborhoods with different urban forms that represent a realistic cross-section of typical residential neighborhoods in Phoenix. The scenarios follow the Local Climate Zone (LCZ) classification scheme after Stewart and Oke. We then combined the neighborhoods with three landscape designs and, using ENVI-met, simulated microclimate conditions for these neighborhoods for a typical summer day. Results were analyzed in terms of mid-afternoon air temperature distribution and variation, ventilation, surface temperatures, and shading. Findings show that advection is important for the distribution of within-design temperatures and that spatial differences in cooling are strongly related to solar radiation and local shading patterns. In mid-afternoon, dense urban forms can create local cool islands. Our approach suggests that the LCZ concept is useful for planning and design purposes. (C) 2013 The Authors. Published by Elsevier B.V.
URLPMID:30731408 [本文引用: 1]
[本文引用: 1]
DOI:10.15201/hungeobull.65.2.7URL [本文引用: 1]
[本文引用: 1]
DOI:10.1016/j.landurbplan.2018.06.004URL [本文引用: 1]
DOI:10.1016/j.uclim.2016.04.001URL [本文引用: 1]
[本文引用: 1]
[本文引用: 1]
URL [本文引用: 1]
DOI:10.1016/j.uclim.2017.05.010URL [本文引用: 2]
[本文引用: 1]
URL [本文引用: 1]
DOI:10.1002/qj.v145.724URL [本文引用: 2]
[本文引用: 1]
URL [本文引用: 1]
[本文引用: 1]
[本文引用: 1]
[本文引用: 1]
[本文引用: 3]
DOI:10.5937/gp22-19750URL [本文引用: 1]
DOI:10.1127/metz/2017/0861URL [本文引用: 1]
URL [本文引用: 1]
DOI:10.1016/j.uclim.2018.10.002URL [本文引用: 3]
DOI:10.1016/j.buildenv.2014.05.005URL [本文引用: 1]
DOI:10.3390/atmos5040755URL [本文引用: 2]
DOI:10.1016/j.buildenv.2012.01.020URL [本文引用: 1]
Given its long urban history of growth and decline, Glasgow, UK, provides a historically significant opportunity to study the local climatic changes brought about by urban variables. This study investigates the changes in air temperature within the central area of Glasgow using three data sources: the UK Meteorological Office historical data for Glasgow (climate normals and running data for a 50-year period), the Weather Underground network: MIDAS Surface Weather Stations network of the British Atmospheric Data Centre (BADC). Three approaches were used to evaluate Glasgow's local climate change: assessment of mean air temperature increases based on two concurrent climate normals, traditional UHI approach (i.e. differences between a 'rural' and an 'urban' site) and observed temperatures in locations with different land cover characteristics (using the Local Climate Zone LCZ concept. Planning and building scale implications for other shrinking cities are explored. (C) 2012 Elsevier Ltd.
URL [本文引用: 1]
DOI:10.1002/joc.2017.37.issue-S1URL [本文引用: 3]
DOI:10.1002/joc.3746URL [本文引用: 3]
Local climate zones' (LCZs) comprise a new and systematic classification of field sites for heat island studies. The classification divides urban and rural landscapes into 17 standard classes, each defined by structural and land cover properties that influence air temperature at screen height. This study is the first to evaluate the conceptual division of LCZs with temperature observations and simulation results from surface-atmosphere models. Results confirm that thermal contrasts exist among all LCZ classes, and that such contrasts are governed largely by building height and spacing, pervious surface fraction, tree density, and soil wetness. Therefore, partitioning of landscapes into structural and land cover classes, or LCZs,' is deemed justified for the purposes of field site classification in heat island studies. Also justified is the use of inter-zone temperature difference (TLCZ X-Y) to quantify heat island magnitude. To further improve the LCZ system, we encourage other researchers to observe and model the climatic conditions of its varied classes. Especially useful would be tests using field data from different urban and rural environments to those in this study, and running more advanced urban canopy models with demonstrated predictive capability.
[本文引用: 1]
[本文引用: 1]
DOI:10.15244/pjoes/63672URL [本文引用: 1]
DOI:10.1016/j.buildenv.2018.04.009URL [本文引用: 2]
DOI:10.1007/s00704-018-02764-xURL [本文引用: 1]
DOI:10.1016/j.uclim.2018.07.001URL [本文引用: 2]
DOI:10.1029/2018JD029796URL [本文引用: 1]
[本文引用: 1]
DOI:10.1016/j.proenv.2014.09.002URL [本文引用: 3]
Urban Heat Island (UHI), a measure of the near surface air temperature contrast between urbanised and adjoining rural areas, is the most pronounced effect of urbanisation. The definition of 'urban' varies in different contexts, which makes it difficult for direct comparison between cities in different regions. Local climate zone (LCZ) classification based method was adopted in Kochi in Southern India to study its UHI. Twelve mobile surveys were carried out from January 2011 to March 2013 to quantify UHI intensity. Pre-dawn UHI there was more intense than early night UHI, and its intensity in winter was stronger than in summer. UHI observed during winter were 4.6 degrees C and 3.7 degrees C in pre- dawn and early night respectively. The study area was classified into ten different local climate zones based on the standard zone properties. Thermal gradient between different zones and cooling rates observed in these zones were computed, which validates the LCZ classification. Maximum intensity was seen in Compact Midrise zones which cover the central part of the city. Most intense cooling was observed in openset and sparsely built regions in all seasons. Standard zone properties alone were inadequate to explain variation of UHI intensity of same classes with different surface area and diverse adjacent zones. Two more zone properties, radial distance to adjacent zone called Zone Boundary Distance, and the Nearest Adjacent Zone, are proposed here to overcome this. The use of these additional parameters gives a better understanding of the intra zone variation of UHI intensity of the same classes with different coverage area and diverse adjacent zones. (C) 2014 The Authors. Published by Elsevier B.V.
DOI:10.1016/j.landurbplan.2017.08.009URL [本文引用: 1]
[本文引用: 2]
DOI:10.20937/ATMURL [本文引用: 1]
[本文引用: 1]
[本文引用: 1]
DOI:10.1515/jengeo-2016-0004URL [本文引用: 3]
URL [本文引用: 1]
[本文引用: 2]
URLPMID:30057659 [本文引用: 1]
The Visible Infrared Imaging Radiometer Suite (VIIRS) instrument was launched 28 October 2011 onboard the Suomi National Polar-orbiting Partnership (SNPP) satellite. The VIIRS instrument is a whiskbroom system with 22 spectral and thermal bands split between 16 moderate resolution bands (M-bands), five imagery resolution bands (I-bands) and a day-night band. In this study we measure the along-scan and along-track band-to-band registration between the I-bands and M-bands from on-orbit data. This measurement is performed by computing the Normalized Mutual Information (NMI) between shifted image band pairs and finding the amount of shift required (if any) to produce the peak in NMI value. Subpixel accuracy is obtained by utilizing bicubic interpolation. The product of the NMI peak slope and the NMI peak value is shown to be a better criterion for evaluating the quality of the NMI result than just the NMI peak value. Registration shifts are found to be similar to pre-launch measurements and stable (within measurement error) over the instrument's first four years in orbit.
[本文引用: 1]
[本文引用: 3]
URL [本文引用: 1]
URL [本文引用: 1]
[本文引用: 2]
DOI:10.1016/j.jag.2016.05.004URL [本文引用: 1]
URLPMID:31466183 [本文引用: 1]
This study is focused on two aspects of the urban heat island (UHI). Firstly, the study is aimed at examining the difference in temperature between zones that are classified into different built areas and other land cover types instead of using the urban and rural classification, which is prevalent in the existing literature. Secondly, we consider the heat-intensity-related physical structure of the city such as the sky view, building coverage, building height, surface albedo, and pervious and impervious surfaces, as well as non-physical factors such as anthropogenic heat, travel demand, electricity consumption, and air pollutant concentration. The local climate zone (LCZ) is used as an approach for characterizing the landscape and physical structure of the study areas. The Bangkok Metropolitan Administration (BMA) is used as the case study and 2016 as the base year for examination. The LCZ is classified using Landsat data and the training areas are created using Google Earth and Google Street View. The heat intensity is studied by deriving the land surface temperature (LST) from the thermal band of the Landsat satellite images of March 3, April 4, and April 12, in 2016, which represent the summer season in Bangkok. The result shows that the industry building areas have the highest mean LST is 32.41 degrees C, while the lowest LST is 28.32 degrees C in areas of water bodies; the temperature difference was approximately 4 degrees C. The factors significantly influencing the warming in the BMA are pervious and impervious surfaces, the building coverage ratio, and the anthropogenic heat flux, while the sky view factor, vehicular traffic, and air pollutant concentration are the weak drivers of UHI.
URL [本文引用: 1]
DOI:10.1016/j.apgeog.2019.04.001URL [本文引用: 1]
DOI:10.1016/j.isprsjprs.2018.04.009URL [本文引用: 2]
DOI:10.1016/j.uclim.2018.11.002URL [本文引用: 2]
DOI:10.1016/j.uclim.2018.12.006URL [本文引用: 1]
DOI:10.1109/JSTARS.2018.2815004URL [本文引用: 2]
[本文引用: 2]
URL [本文引用: 2]
DOI:10.1016/j.buildenv.2019.04.011URL [本文引用: 1]
DOI:10.1002/joc.v39.14URL [本文引用: 1]
DOI:10.1016/j.buildenv.2019.03.005URL [本文引用: 1]
DOI:10.1016/j.proeng.2016.10.026URL [本文引用: 1]
DOI:10.1016/j.landurbplan.2015.02.012URL [本文引用: 1]
[本文引用: 1]
DOI:10.1007/s00704-016-1886-7URL [本文引用: 1]
URL [本文引用: 1]
URL [本文引用: 1]
URL [本文引用: 1]
DOI:10.1016/j.rse.2014.05.017URL [本文引用: 1]
DOI:10.1016/j.proeng.2017.09.904URL [本文引用: 1]
[本文引用: 1]
DOI:10.1016/j.buildenv.2018.03.005URL [本文引用: 2]
DOI:10.1016/j.uclim.2018.04.007URL [本文引用: 1]
[本文引用: 1]
URL [本文引用: 1]
URL [本文引用: 1]
DOI:10.1016/j.rse.2014.04.024URL [本文引用: 1]
Air temperature (Ta) stations have limited spatial coverage, particularly in rural areas. Since temperature can vary greatly both spatially and temporally, Ta stations are often inadequate for studies on the health effects of extreme temperature and climate change. Satellites can provide us with daily physical surface temperature (Ts) measurements, enabling us to estimate daily Ta. In this study, we aimed to extend our previous work on predicting Ta from Ts in Massachusetts by predicting 24 h Ta means on a 1 km grid across the Northeast and Mid-Atlantic states, extending both the temporal and spatial coverage, improving upon the methodology and validating our model in other geographical regions across the Northeastern part of the USA. We used mixed model regressions to first calibrate Ts and Ta measurements, regressing Ta measurements against day-specific random intercepts, and fixed and random Ts slopes. Then to capture the ability of neighboring cells to fill in the cells with missing Ts values, we regress the Ta predicted from the first mixed effects model against the mean of the Ta measurements on that day, separately for each grid cell. Out-of-sample tenfold cross-validation was used to quantify the accuracy of our predictions. Our model performance was excellent for both days with available Ts and days without Ts observations (mean out-of-sample R-2 = 0.95 and R-2 = 0.94 respectively). We demonstrate how Ts can be used reliably to predict daily Ta at high resolution in large geographical areas even in non-retrieval days while reducing exposure measurement error. (C) 2014 Elsevier Inc.
DOI:10.1016/j.rse.2017.10.025URL [本文引用: 1]
URL [本文引用: 1]
[本文引用: 1]
DOI:10.1016/j.isprsjprs.2018.06.008URL [本文引用: 1]
URL [本文引用: 1]
DOI:10.1016/j.rse.2012.12.014URL [本文引用: 1]
Land surface temperature (LST) is an important parameter highly responsive to surface energy fluxes and has become valuable to many disciplines. Prior to the advent of satellites, it was difficult to obtain LSTs over extensive areas. Even today, as a result of the resolution tradeoffs involved in using satellite data, it is difficult, and sometimes impossible, to acquire satellite LSTs with high spatial and temporal resolutions. This low resolution results in a thermal mixture effect, where the resolution cells are larger than the thermal elements. The disaggregation of remotely sensed land surface temperature (DLST), a research field that focuses on decomposing pixel-based temperatures, has been critical in related fields such as the surface flux downscaling, forest fire detection, and urban heat island monitoring and it is now growing rapidly as one of the thriving subbranches of thermal remote sensing. Various methods have been independently proposed for DLST in recent decades. However, this field is suffering a disorderly development. We thus critically investigate the interdisciplinary literature on DIST and identify the terms used to denote DLST in different disciplines. Two subtopics of DIST, thermal sharpening (TSP) and temperature unmixing (TUM), are identified as a dual pair of DLST because of their parallel areas of interest. Previous studieS are classified into different categories in chronological and taxonomic order. We formulate definitions of TSP, TUM, and DLST, and we then examine how TSP and TUM are connected to related fields in remote sensing. Based on the literature, we present the key issues related to DLST, the recommended DLST methods in different applications, and the caveats that must be considered in future work, including (1) four predetermined assumptions (i.e., additivity, separability, connectivity, and convertibility), (2) the utilization of diurnal thermal observations, and (3) the complication of aggregation. This overview will provide a generalization of TSP and TUM, promote the understanding of DLST, and guide future research. (c) 2013 Elsevier Inc.
[本文引用: 1]
URL [本文引用: 1]
URLPMID:31017939 [本文引用: 1]
Cities are major drivers of environmental change at all scales and are especially at risk from the ensuing effects, which include poor air quality, flooding and heat waves. Typically, these issues are studied on a city-by-city basis owing to the spatial complexity of built landscapes, local topography and emission patterns. However, to ensure knowledge sharing and to integrate local-scale processes with regional and global scale modelling initiatives, there is a pressing need for a world-wide database on cities that is suited for environmental studies. In this paper we present a European database that has a particular focus on characterising urbanised landscapes. It has been derived using tools and techniques developed as part of the World Urban Database and Access Portal Tools (WUDAPT) project, which has the goal of acquiring and disseminating climate-relevant information on cities worldwide. The European map is the first major step toward creating a global database on cities that can be integrated with existing topographic and natural land-cover databases to support modelling initiatives.
[本文引用: 1]
[本文引用: 1]
DOI:10.1016/j.uclim.2018.08.007URL [本文引用: 1]
DOI:10.1016/j.uclim.2018.01.006URL [本文引用: 1]
DOI:10.1007/s00704-019-02783-2URL [本文引用: 1]
[本文引用: 1]
DOI:10.1016/j.uclim.2018.11.003URL [本文引用: 1]
[本文引用: 1]
DOI:10.1016/j.scitotenv.2019.03.377URLPMID:30925333 [本文引用: 1]
Urban waterbodies can effectively mitigate the increasing UHI effects and thus enhance climate resilience of urban areas. To contribute to our limited understanding in cooling effect of waterbodies on surrounding thermal environments, we examine the quantitative relationship between the spatial distribution of urban waterbodies and the land surface temperature (LST) in Wuhan, China. This paper 1) applies two indicators, the fractional water cover and the gravity water index, for measuring the spatial distribution of urban waterbodies; 2) conducts simple linear regression and spatial regression analyses to explore the LST-water relationship at multiple scales; and 3) compares the individual regression results from different land use types. The results show that the spatial distribution of urban waterbodies affects the LST significantly, and the gravity water index sufficiently explains the LST variation at various scales. Furthermore, the impact of urban waterbody distribution on the LST does vary across different land use types. Conclusions from this study provide insights of the cooling effect of urban waterbodies, which can further assist city planners and decision makers in utilizing cooling effects of waterbodies to improve the thermal environment of urban areas.
DOI:10.3390/rs70403670URL [本文引用: 1]
[本文引用: 1]
[本文引用: 1]
URL [本文引用: 1]
URL [本文引用: 1]
