 ,1,2, 梁一行1,3, 李鹏,1,2, 肖池伟1,2
Occurrence characteristics and response to El Niño of MODIS-based active fires in Indonesia during 2001-2018
LIU Jia,1,2, LIANG Yihang1,3, LI Peng,1,2, XIAO Chiwei1,2通讯作者:
收稿日期:2019-10-23修回日期:2020-06-27网络出版日期:2020-09-25
| 基金资助: |
Received:2019-10-23Revised:2020-06-27Online:2020-09-25
| Fund supported: |
作者简介 About authors
刘佳(1994-), 女, 山西汾阳人, 硕士生, 主要从事资源地理与国土遥感监测研究。E-mail:

摘要
关键词:
Abstract
Keywords:
PDF (5450KB)元数据多维度评价相关文章导出EndNote|Ris|Bibtex收藏本文
本文引用格式
刘佳, 梁一行, 李鹏, 肖池伟. 2001—2018年印度尼西亚MODIS活跃火的发生特征与响应. 地理学报[J], 2020, 75(9): 1907-1920 doi:10.11821/dlxb202009007
LIU Jia, LIANG Yihang, LI Peng, XIAO Chiwei.
1 引言
活跃火(含植被火)是一种影响全球碳收支普遍而复杂的生物物理过程[1],对热带森林、寒温带针叶林等自然生态系统特性(如生物量)形成起着重要作用[2]。作为全球陆地生态系统最重要的干扰因子之一,活跃火不仅影响植被分布和结构,也对气候系统与生物地球化学循环产生实质影响[3,4]。21世纪以来,全球活跃火日益频发[5,6,7,8],主要集中在非洲(如刚果河流域)、南美洲(如亚马孙河流域)和东南亚等地区[9],大量活跃火释放的气溶胶和温室气体等进一步加剧了气候变化[10,11,12],同时也对人类生命健康与安全构成了威胁[13]。因此,加强全球不同时空尺度活跃火的发生发展、成因类型及其影响响应等研究,对评估植被生态系统功能演变、气候变化强度与影响等具有重要意义。东南亚特别是印度尼西亚的活跃火研究得到广泛关注[14,15,16],其原因可归结为3个方面:① 人类活动驱动的土地利用变化加剧了印度尼西亚活跃火的发生[17],如山区生计型刀耕火种农业[18]和热带森林与泥炭地转变为油棕与橡胶等工业种植园[19,20]。② 活跃火对区域空气质量和人类健康的影响是灾难性的,如1997—1998年和2015年活跃火骤增引起了严重的跨境特大烟霾事件[21,22,23,24,25]。③ 该区地跨赤道受大尺度气候异常影响深刻,由此引发的干旱与高温进一步增加了活跃火的发生风险[26,27]。值得注意的是,厄尔尼诺与上述3方面研究关联紧密。一方面,厄尔尼诺通过削弱沃克环流(Walker Circulation)引起区域不同程度的降水减少与升温,从而增加活跃火发生或复发风险[28];另一方面,厄尔尼诺明显降低了湿沉降对粒子的去除作用,加剧活跃火排放物从源区向邻国输送[29]。厄尔尼诺相关年份(2002—2003年、2004—2005年、2006—2007年及2009—2010年等),特别是2014—2016年超强厄尔尼诺与区域活跃火的相关性研究受到学界持续关注[30]。如有研究表明印度尼西亚活跃火的发生发展与海表温度异常的中心位置有关,即东太平洋型(Eastern Pacific, EP)厄尔尼诺年的活跃火强度大于中太平洋型(Central Pacific, CP),并且EP型厄尔尼诺引发的旱期时间更长[31];而CP型厄尔尼诺一般造成印度尼西亚轻度干旱,活跃火相对弱发[32]。随着厄尔尼诺日益频发,未来有关其与区域干旱程度、升温幅度以及活跃火强度等相关性研究仍是探索焦点。
然而,目前研究仍缺乏针对活跃火的精细尺度定量分析,如具体到每个小区域活跃火(含植被火)的发生概率与强度以及它们在空间上有什么特征与趋势?在此基础上,厄尔尼诺对区域活跃火频次影响(反之即响应)程度如何?对区域活跃火的贡献有多大?如何评估?厄尔尼诺从开始到消亡与活跃火有什么时空关联特征?等等。围绕上述问题,本文以2001—2018年印度尼西亚MODIS活跃火矢量产品为基础,基于GIS渔网方法定量研究活跃火发生概率、强度及其对厄尔尼诺的响应程度,并揭示了不同强度等级下活跃火分布的空间差异,以期为精细尺度(10 m、20 m、30 m)下的活跃火遥感算法构建以及关键区植被变化与演替等研究提供相关数据支持与启示。
2 研究区概况
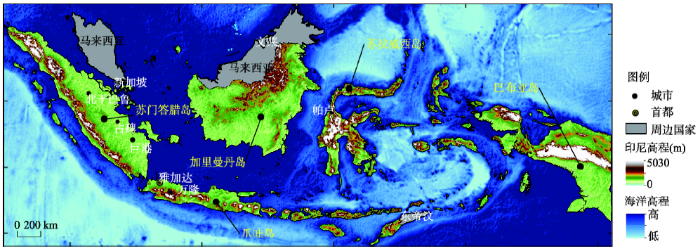
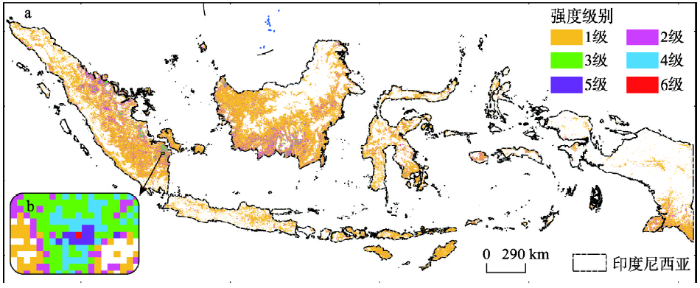
印度尼西亚共和国(简称“印度尼西亚”或“印尼”)是世界上最大的群岛国家,由17508个岛屿(约6000个有人居住)组成,国土面积为191万km2(图1)。其中,面积较大的5个岛屿依次为加里曼丹岛(53.9万km2)、苏门答腊岛(47.万km2)、巴布亚岛(42.1万km2)、苏拉威西岛(18.9万km2)和爪哇岛(13.2万km2),土地总面积占到91.78%。据联合国人口统计(图1
 新窗口打开|下载原图ZIP|生成PPT
图1印度尼西亚研究区及陆海地形分布图
注:该图基于国家测绘地理信息局标准地图服务网站审图号为GS(2016)1666号的标准地图制作,底图无修改。
Fig. 1Map showing the study area (Indonesia) and topographical features of the land (i.e., islands) and surrounding sea area
3 数据来源与研究方法
3.1 数据来源
3.1.1 海洋Niño指数 海洋Niño指数(Oceanic Niño Index, ONI)是美国国家海洋和大气管理局(National Oceanic and Atmospheric Administration, NOAA)气候预测中心(Tab. 1
表1
表12000年以来全球ONI
Tab. 1
| 月份 | 12—2 | 1—3 | 2—4 | 3—5 | 4—6 | 5—7 | 6—8 | 7—9 | 8—10 | 9—11 | 10—12 | 11—1 |
|---|---|---|---|---|---|---|---|---|---|---|---|---|
| 2000 | -1.7 | -1.4 | -1.1 | -0.8 | -0.7 | -0.6 | -0.6 | -0.5 | -0.5 | -0.6 | -0.7 | -0.7 |
| 2001 | -0.7 | -0.5 | -0.4 | -0.3 | -0.3 | -0.1 | -0.1 | -0.1 | -0.2 | -0.3 | -0.3 | -0.3 |
| 2002 | -0.1 | 0 | 0.1 | 0.2 | 0.4 | 0.7 | 0.8 | 0.9 | 1.0 | 1.2 | 1.3 | 1.1 |
| 2003 | 0.9 | 0.6 | 0.4 | 0 | -0.3 | -0.2 | 0.1 | 0.2 | 0.3 | 0.3 | 0.4 | 0.4 |
| 2004 | 0.4 | 0.3 | 0.2 | 0.2 | 0.2 | 0.3 | 0.5 | 0.6 | 0.7 | 0.7 | 0.7 | 0.7 |
| 2005 | 0.6 | 0.6 | 0.4 | 0.4 | 0.3 | 0.1 | -0.1 | -0.1 | -0.1 | -0.3 | -0.6 | -0.8 |
| 2006 | -0.8 | -0.7 | -0.5 | -0.3 | 0 | 0 | 0.1 | 0.3 | 0.5 | 0.7 | 0.9 | 0.9 |
| 2007 | 0.7 | 0.3 | 0 | -0.2 | -0.3 | -0.4 | -0.5 | -0.8 | -1.1 | -1.4 | -1.5 | -1.6 |
| 2008 | -1.6 | -1.4 | -1.2 | -0.9 | -0.8 | -0.5 | -0.4 | -0.3 | -0.3 | -0.4 | -0.6 | -0.7 |
| 2009 | -0.8 | -0.7 | -0.5 | -0.2 | 0.1 | 0.4 | 0.5 | 0.5 | 0.7 | 1.0 | 1.3 | 1.6 |
| 2010 | 1.5 | 1.3 | 0.9 | 0.4 | -0.1 | -0.6 | -1.0 | -1.4 | -1.6 | -1.7 | -1.7 | -1.6 |
| 2011 | -1.4 | -1.1 | -0.8 | -0.6 | -0.5 | -0.4 | -0.5 | -0.7 | -0.9 | -1.1 | -1.1 | -1.0 |
| 2012 | -0.8 | -0.6 | -0.5 | -0.4 | -0.2 | 0.1 | 0.3 | 0.3 | 0.3 | 0.2 | 0 | -0.2 |
| 2013 | -0.4 | -0.3 | -0.2 | -0.2 | -0.3 | -0.3 | -0.4 | -0.4 | -0.3 | -0.2 | -0.2 | -0.3 |
| 2014 | -0.4 | -0.4 | -0.2 | 0.1 | 0.3 | 0.2 | 0.1 | 0 | 0.2 | 0.4 | 0.6 | 0.7 |
| 2015 | 0.6 | 0.6 | 0.6 | 0.8 | 1.0 | 1.2 | 1.5 | 1.8 | 2.1 | 2.4 | 2.5 | 2.6 |
| 2016 | 2.5 | 2.2 | 1.7 | 1.0 | 0.5 | 0 | -0.3 | -0.6 | -0.7 | -0.7 | -0.7 | -0.6 |
| 2017 | -0.3 | -0.1 | 0.1 | 0.3 | 0.4 | 0.4 | 0.2 | -0.1 | -0.4 | -0.7 | -0.9 | -1.0 |
| 2018 | -0.9 | -0.8 | -0.6 | -0.4 | -0.1 | 0.1 | 0.1 | 0.2 | 0.4 | 0.7 | 0.9 | 0.8 |
新窗口打开|下载CSV
3.1.2 全球活跃火产品 美国国家航空航天局(NASA)火灾信息资源管理系统(Fire Information for Resource Management System, FIRMS)提供了MODIS与VIIRS两套不同重访周期、空间分辨率、幅宽的标准活跃火产品,数据格式包括矢量(Shapefile, WGS 1984)、Google Earth与文本文件3种[35],包含燃烧辐射功率、亮度温度、置信度及其对应的经纬度、获取日期/时间等信息(
本文旨在探索21世纪以来印尼活跃火的年际发生概率和每年可能的发生强度、及其对厄尔尼诺特征年与强弱年响应的时空差异,故仅采用2001—2018年MODIS C6 活跃火产品用于后续分析。其中2000年因仅有Terra获取当年11—12月的数据而未作考虑。统计表明:印度尼西亚18 a间活跃火平均发生频次为7.26万次,最大值(17.9万次)与最小值(1.51万次)分别出现在2015与2001年,且主要出现在当年8—10月。对比发现,活跃火在厄尔尼诺特征年的出现频数均在多年平均水平以上,并且超强厄尔尼诺年(2015年)与其他厄尔尼诺年的平均差异为5.66万次,最大差异和最小差异分别是7.62万次和2.36万次,而正常年份活跃火频次多年平均则为4.28万次。其中,加里曼丹岛、苏门答腊岛、巴布亚岛、苏拉威西岛和爪哇岛的活跃火发生频次占比依次为39.92%、39.02%、6.83%、6.03%和2.94%。就印尼而言,活跃火主要为植被火(Vegetation Fires),还可能包括少量火山火或油气井火焰[39]。基于ArcGIS 10.2进行数据质量检查发现,2001年2月7—8日、2001年6月16日—7月3日和2002年3月20—28日等,由于传感器中断等原因未采集有效活跃火信息。18 a间共有1.20%的日期无数据,对于开展年尺度上的活跃火发生概率、强度与响应分析,其影响可以忽略不计。此外,MODIS与VIIRS同为光学卫星,虽然其日重访周期很高,但是对于云/影覆盖下以及非过境时发生的火情仍不能有效监测。尽管如此,FIRMS发布的2套活跃火产品仍是当前最可信的数据集,可用于年尺度上的地学分析。
3.2 研究方法
3.2.1 基于GIS渔网(Fishnet)的空间统计分析 基于ArcGIS 10.2 Fishnet分析工具,创建印度尼西亚1 km×1 km渔网系统,用于该国活跃火的年际发生概率、强度及其对厄尔尼诺特征年、强弱年响应的时空差异分析。鉴于印度尼西亚所处的地理位置,本文采用墨卡托(Mercator)投影创建公里渔网(面要素,投影坐标为WGS_1984_World_Mercator,线性单位:m),并对所有格网(像元)进行编号处理。印尼全境(陆域与海域)的公里格网(渔网)个数共有9726678个,陆域(含其国界)渔网总数共1953491个(本文未将海域活跃火纳入考虑)。约22.79%的格网在过去18 a间至少出现了一次活跃火现象,即“有火区”;而剩余77.21%的地区从未发生,即“无火区”。3.2.2 印度尼西亚2001—2018年活跃火的发生概率 印度尼西亚2001—2018年活跃火的发生概率是指单个陆域格网内有活跃火产生的年数在18 a所占的比例,反映该区域活跃火出现的可能性大小。
式中:Pi表示对应格网活跃火的发生概率;X表示单个格网在2001—2018年有活跃火发生的年数(
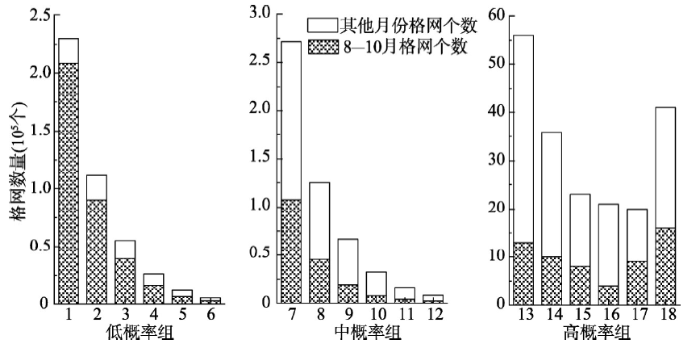
在此基础上,对18个发生概率进行等级划分(表2),将其从小到大排列,按照平均原则,每6个划分为一组,共划分为3组:低概率组(1/18~6/18)、中概率组(7/18~12/18)和高概率组(13/18~18/18)。
Tab. 2
表2
表2活跃火发生概率分组划分标准
Tab. 2
| 分组 | 发生概率 | |||||
|---|---|---|---|---|---|---|
| 低概率组 | 1/18 | 2/18 | 3/18 | 4/18 | 5/18 | 6/18 |
| 中概率组 | 7/18 | 8/18 | 9/18 | 10/18 | 11/18 | 12/18 |
| 高概率组 | 13/18 | 14/18 | 15/18 | 16/18 | 17/18 | 18/18 |
新窗口打开|下载CSV
3.2.3 印度尼西亚2001—2018年活跃火的发生强度 用发生强度I表征不同格网内活跃火每年可能的发生频次。结合发生概率即可知该格网活跃火产生的可能性及可能频次。
式中:I表示单个格网内活跃火的发生强度;X表示单个格网在2001—2018年有活跃火发生的年数;F表示该格网活跃火的累计发生频次。
活跃火强度从1~165不等且不连续分布,为便于分析,将强度按照其对应格网数的最高位数(十万、万、千、百、十、个位)进行分级,依次分为1~6级(表3)。
Tab. 3
表3
表3活跃火发生强度等级区间划分标准
Tab. 3
| 级别 | 强度范围(次/a) | 对应格网数量范围 |
|---|---|---|
| 1级 | 1 | 337816 |
| 2级 | 2~3 | 72230~17785 |
| 3级 | 4~7 | 7709~1269 |
| 4级 | 8~12 | 811~141 |
| 5级 | 13~22 | 97~13 |
| 6级 | 23~165 | 6~1 |
新窗口打开|下载CSV
4 结果分析
4.1 活跃火发生概率及其分布特征
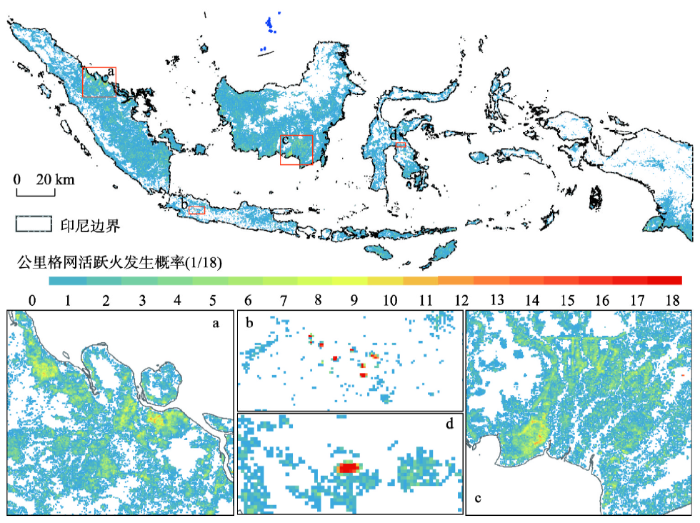
以印尼五大岛屿为例,“无火区”分布范围存在显著差异(图2)。其中,巴布亚岛“无火区”在岛内所占的比例最大(93.33%),成片分布在除南部以外的广大地区。爪哇岛和苏拉威西岛的“无火区”占比次之,分别为90.50%和82.84%,在岛内与“有火区”呈相间分布。苏门答腊岛和加里曼丹岛的“无火区”占比较小,分别是68.56%和67.07%,集中分布于苏门答腊岛西部的巴里桑山脉和加里曼丹岛北部山区。需要说明的是,这仅仅是基于MODIS观测数据显示这些区域过去18 a间从未发生过活跃火现象。考虑到卫星重访周期、空间分辨率及云影等影响,印尼“有火区”范围应该更大。换言之,过去18 a里有近1/4的国土持续受到活跃火影响,反映出印尼活跃火现象的普遍性与严重性。图2
 新窗口打开|下载原图ZIP|生成PPT
图22001—2018年印度尼西亚MODIS活跃火累计发生概率的空间分布
Fig. 2Spatial distribution of the cumulated occurrence probability of MODIS C6 active fire in Indonesia during 2001-2018
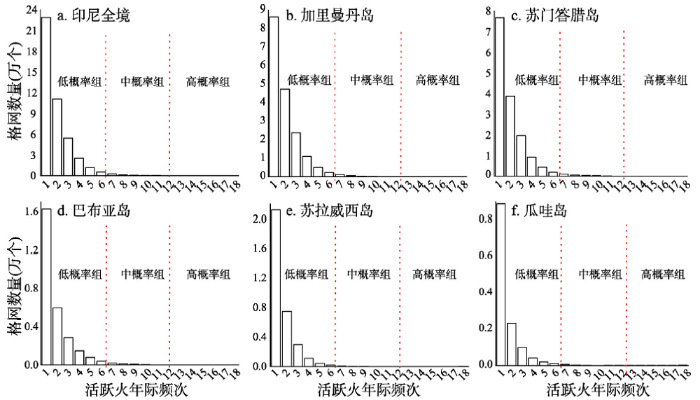
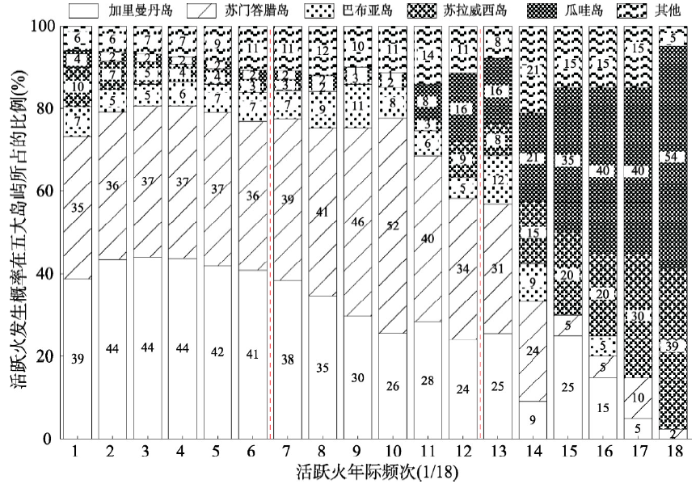
对“有火区”而言,活跃火发生概率存在明显时空差异。活跃火的发生以低概率为主,中概率次之,高概率最少(图3)。其中,发生概率为1/18的格网占“有火区”总面积的51.62%。概率为1/18~3/18的格网在低概率组占到了90.10%,在苏拉威西岛(94.38%)和爪哇岛(92.93%)的占比高于全境,在巴布亚岛(89.04%)、加里曼丹岛(88.66%)和苏门答腊岛(88.32%)低于全境,进一步说明低概率活跃火在印尼的普遍性。随着发生概率的增加,全境相关格网数量呈减少趋势,概率为17/18的格网数最少,仅为20个,18/18的格网却增加到41个。苏门答腊岛、加里曼丹岛和巴布亚岛活跃火格网数量随发生概率的增加呈断崖式减少,而苏拉威西岛和爪哇岛则先减少后少量增加。
图3
 新窗口打开|下载原图ZIP|生成PPT
图32001—2018年印度尼西亚及五大岛屿MODIS活跃火发生概率差异
Fig. 3The differences in the occurrence probability of MODIS (2001-2018) active fires in Indonesia (a), Kalimantan (b), Sumatra(c), Papua (d), Sulawesi (e) and Java (f)
其次,活跃火发生概率的空间分布不均匀(图4)。① 低概率组格网广泛分布于印尼全境,加里曼丹岛和苏门答腊岛占比分居第1位和第2位,苏拉威西岛和巴布亚岛次之,爪哇岛占比最小(2.95%)。② 中概率组格网在部分区域集聚分布,尤以苏门答腊岛东部低地平原(图2a)和加里曼丹岛南部及西南沿岸(图2c)最为集中,其次是巴布亚岛南部地区。③ 高概率组零星分布于各岛,以苏拉威西岛和爪哇岛为主体。其中,高概率格网在爪哇岛和苏拉威西岛上具有不同的分布特征,它们在前者集中连片分布(图2d),在后者相间分布(图2b)。特别地,巴布亚岛低、中概率组占比较为稳定,但高概率组格网出现零值。此外,加里曼丹岛过去18年并无逐年发生活跃火的格网。
图4
 新窗口打开|下载原图ZIP|生成PPT
图42001—2018年印度尼西亚5个主要岛屿MODIS活跃火发生概率差异
Fig. 4The differences in the occurrence probability of active fires based on MODIS (2001-2018) in the five major islands (Kalimantan, Sumatra, Papua, Sulawesi and Java) of Indonesia
再次,年内“有火区”集中出现在8—10月(图5)。印尼18 a间有18.71%的地区曾在8—10月有活跃火发生,占“有火区”的82.10%。类似地,8—10月活跃火发生概率也以低概率组为主(99.47%),中、高概率组占比很低,依次为0.51%、0.02%。特别地,8—10月间发生的活跃火集中分布在印尼82.08%的低概率组格网,其中概率为1/18的格网数占到90.65%。这表明超过4/5的低概率组格网曾在某年8—10月出现过活跃火,其中,年内只发生过一次活跃火的格网中有98.65%发生在8—10月。值得注意的是,8—10月活跃火格网在不同发生概率内占比有明显差异,并随发生概率递增而出现先减小后波动增加的变化趋势。
图5
 新窗口打开|下载原图ZIP|生成PPT
图52001—2018年印度尼西亚不同月份MODIS活跃火发生概率差异
Fig. 5Monthly occurrence probability of MODIS active fires in Indonesia during 2001-2018
4.2 活跃火发生强度及其空间分布
2001—2018年,基于公里格网的MODIS C6活跃火发生强度统计结果来看(表4),1级强度活跃火格网占主导地位,其次是2级强度,二者占比之和高达96.10%,表明约41.8万km2地区的活跃火发生强度为1~3次/a。3~4级强度占比为3.81%,即活跃火每年可能发生4~12次不等。5~6级强度占比最小仅0.09%(约409 km2),其中约44 km2土地上活跃火强度高于22次/a,个别地区最高平均每年发生165次。比较发现,各岛各级别的占比也随强度级别的增加而急剧减少,均以1级强度为主,2级强度次之,6级强度最少。其中,1~2级格网占比之和从高到低依次为99.18%(苏拉威西岛)、98.94%(爪哇岛)、98.50%(巴布亚岛)、95.96%(加里曼丹岛)和94.07%(苏门答腊岛)。虽然超9成的格网活跃火的发生强度以1~3次/a为主,但若其中10%的格网集中在同一年内爆发活跃火,其总频次约为5.63万次,是2001年活跃火总频次的3.75倍。这在一定程度上表明,9成活跃火的发生强度虽低但其影响仍不可小觑。Tab. 4
表4
表42001—2018年印度尼西亚“有火区”及五大岛屿不同强度级别活跃火占比
Tab. 4
| 级别 | 强度范围 (次/a) | 有火区及在各岛占比(%) | |||||
|---|---|---|---|---|---|---|---|
| 有火区 | 苏门答腊岛 | 加里曼丹岛 | 巴布亚岛 | 苏拉威西岛 | 爪哇岛 | ||
| 1级 | 1 | 75.88 | 70.48 | 74.35 | 81.76 | 85.57 | 89.59 |
| 2级 | 2~3 | 20.22 | 23.59 | 21.61 | 16.74 | 13.61 | 9.35 |
| 3级 | 4~7 | 3.38 | 5.06 | 3.59 | 1.28 | 0.68 | 0.70 |
| 4级 | 8~12 | 0.43 | 0.74 | 0.38 | 0.16 | 0.09 | 0.12 |
| 5级 | 13~22 | 0.08 | 0.12 | 0.07 | 0.06 | 0.02 | 0.15 |
| 6级 | 23~165 | 0.01 | 0.01 | 0.00 | 0 | 0.03 | 0.09 |
新窗口打开|下载CSV
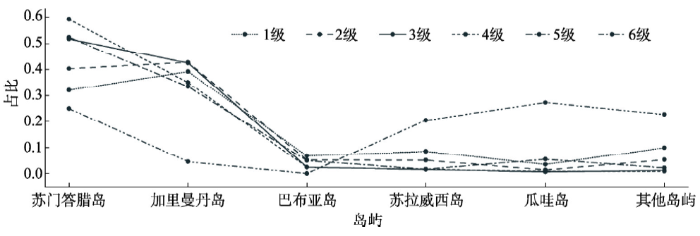
其次,活跃火发生强度在空间上分布不均(图6)。1级强度格网遍布各岛,其中39.18%分布在加里曼丹岛,32.09%在苏门答腊岛,其余各岛分布均低于10%(图7)。2级强度格网较分散但仍遍布各岛,与1级强度格网相间分布。其中,加里曼丹岛(42.74%)和苏门答腊岛(40.30%)分布最多,且前者南部及后者东部有明显的集中分布。3~4级强度格网数量较少,通常与集中分布的2级格网毗邻。具体而言,该级别格网在加里曼丹岛的南部即中加里曼丹省的沿河地区较为集中,此处刀耕火种活动较频繁;在苏门答腊岛东部平原呈小块集聚,这些聚集地从南到北依次属于南苏门答腊省、占碑省和廖内省。这些省份的种植园分布较多,活跃火强度较大可能与种植园的开发有关。强度最高的5~6级格网数量最少,但基本都分布在其他强度格网聚集的中心,即活跃火强度从中心向四周递减(图6b)。特别地,6级格网在巴布亚岛无分布,在爪哇岛(27.27%)、苏门答腊岛(25.00%)和苏拉威西岛(20.45%)上分布较多,但该三岛的6级平均强度却有很大差异,分别为38、26和66,并且多数6级格网在苏拉威西岛紧邻分布,在其他两岛则单个散布或两两靠近。
图6
 新窗口打开|下载原图ZIP|生成PPT
图62001—2018年印度尼西亚MODIS活跃火发生强度的空间分布
Fig. 6Spatial distribution of the occurrence intensity of MODIS C6 active fire in Indonesia during 2001-2018
图7
 新窗口打开|下载原图ZIP|生成PPT
图72001—2018年印度尼西亚MODIS活跃火发生强度在各岛的比重差异
Fig. 7The difference in the proportions of the occurrence intensity of MODIS C6 active fires in Indonesia during 2001-2018
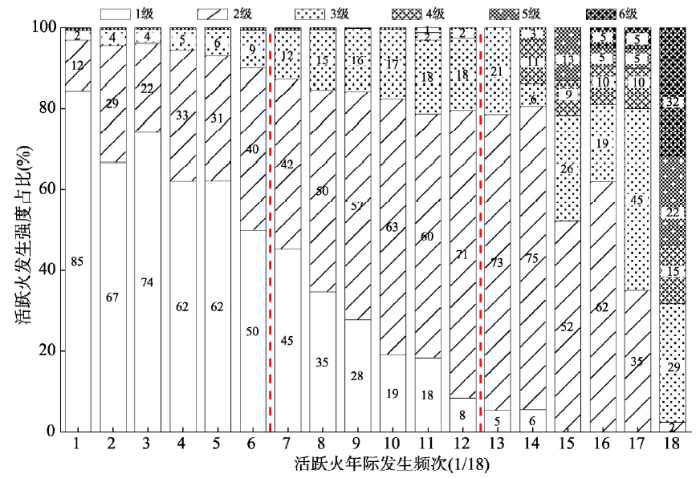
为直观体现活跃火发生概率与强度关系,比较了强度在各发生概率中所占百分比(图8)。从发生强度来看,1级强度主要存在于低、中概率组并随概率的增加而逐渐减少;2~3级强度涉及所有概率组,其占比呈增加趋势;4~6级强度以高概率组为主,并随概率增加而逐渐增加。从发生概率来看,低概率活跃火以1级强度为主,其次是2级强度,其余大部分为3级强度。中概率活跃火以2级强度为主,1级和3级强度次之,仅2%~3%的格网强度高于3级。高概率组格网虽涉及所有强度,但仍以2~3级强度为主。
图8
 新窗口打开|下载原图ZIP|生成PPT
图82001—2018年印度尼西亚3个概率组中MODIS活跃火发生强度差异
Fig. 8The differences in the occurrence intensity of active fires based on MODIS C6 (2001-2018) under the three levels of occurrence probability in Indonesia
4.3 活跃火发生频次对厄尔尼诺特征年、强弱年的响应差异
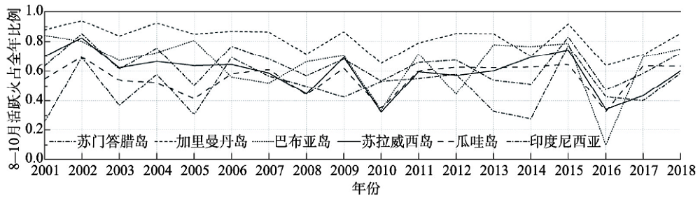
厄尔尼诺是目前全球活跃火年际变化的重要影响因子[40],印度尼西亚所处地理位置容易受到厄尔尼诺现象影响并造成降水显著减少与干旱加剧[31]。研究发现,1997—2016年6次厄尔尼诺在其发展周期早期(8—10月)增强时,活跃火在赤道亚洲达到高峰[41]。为此,利用8—10月活跃火频次占全年总频次的比例来分析印度尼西亚活跃火在正常年份、厄尔尼诺特征年、强弱年的响应差异(图9)。① 印尼8—10月活跃火占比(56%以上)整体较高,尤其是加里曼丹岛,平均占比约76.78%。这与印尼8—10月是农田秸秆焚烧、泥炭森林改造以及棕榈/橡胶种植园清理的高峰期有关[24]。② 印尼全境8—10月活跃火占比的年际变化呈上下波动,峰值出现在2002年、2004年、2006年、2009年和2015年,与厄尔尼诺现象出现时间较为一致,表明印尼8—10月活跃火对厄尔尼诺现象敏感,在其影响下占比明显增幅。③ 8—10月活跃火对强、弱厄尔尼诺的敏感度略有差别。超强厄尔尼诺2015年8—10月的ONI为2.1,活跃火敏感度最高,占比出现明显的先增后减趋势。其次敏感的是ONI为1的2002年厄尔尼诺,而后是指数为0.7、0.5和0.7的2004年、2006年和2009年。值得注意的是部分岛屿对厄尔尼诺的敏感度与ONI并不严格匹配,其内在机制有待进一步研究。此外,对8—10月活跃火格网进行同等分析,发现其占比变化趋势同频次相同,峰值均在厄尔尼诺年份出现。这表明厄尔尼诺不仅使当年8—10月活跃火发生频次增多,且其影响面积也大大增加。图9
 新窗口打开|下载原图ZIP|生成PPT
图9印度尼西亚及五大岛屿8—10月活跃火频次占全年比例的年际变化
Fig. 9Annual changes in the proportions of the active fire between August and October in Indonesia and its five major islands
从全国尺度来看,在厄尔尼诺特征年,全境8—10月活跃火频次的多年平均占比高出正常年份16.75%(表5),该值可表明印尼全境8—10月活跃火对厄尔尼诺响应的程度。具体到各岛,其响应程度从高到低依次是苏门答腊岛(19.67%)、印尼全境(16.75%)、苏拉威西岛(15.60%)、加里曼丹岛(10.28%)、爪哇岛(3.35%)和巴布亚岛(2.59%)。特别地,除苏门答腊岛以外,其他岛屿尤其是巴布亚岛和爪哇岛,厄尔尼诺非特征年的多年占比却低于正常年份,其原因可能是拉尼娜现象对印尼降水变率产生影响,使各地区活跃火受到不同程度的抑制[42],或厄尔尼诺特征年大量活跃火发生使得可燃物急剧减少。
Tab. 5
表5
表5印度尼西亚及五大岛屿8—10月活跃火频次的多年平均占比情况表(%)
Tab. 5
| 多年平均占比 | 苏门答腊岛 | 加里曼丹岛 | 巴布亚岛 | 苏拉威西岛 | 爪哇岛 | 全境 |
|---|---|---|---|---|---|---|
| 所有年份 | 49.04 | 81.73 | 64.87 | 59.58 | 55.75 | 64.37 |
| 正常年份 | 43.47 | 80.01 | 69.04 | 55.78 | 57.93 | 61.03 |
| 厄尔尼诺特征年 | 63.14 | 90.29 | 71.63 | 71.38 | 61.28 | 77.78 |
| 厄尔尼诺非特征年 | 43.92 | 76.78 | 48.71 | 50.25 | 44.65 | 56.04 |
新窗口打开|下载CSV
5 结论与讨论
本文以美国火灾信息资源管理系统(FIRMS)发布的MODIS C6活跃火数据为基础,基于GIS渔网方法构建公里格网,定量分析2001—2018年印度尼西亚活跃火发生的概率、强度及其对厄尔尼诺的响应程度,揭示活跃火分布的空间差异,主要研究结论有:(1)印度尼西亚近18 a“有火区”面积占到22.79%,其中加里曼丹岛“有火区”占比最大,巴布亚岛最小。活跃火发生以低概率为主,中概率次之,高概率最少。低概率格网分布广泛,以加里曼丹岛和苏门答腊岛为主,时间集中在8—10月。中概率格网以苏门答腊岛的东部低地平原和加里曼丹岛的南部及西南沿岸最为集中,高概率零星分布于各岛。
(2)印度尼西亚活跃火发生强度以1级强度为主,2级强度次之,6级强度最少。96.10%的“有火区”以1~3次/a的发生强度为主,3.81%以4~12次/a为主,低概率组格网活跃火发生强度以1次/a为主,其次是2~3次。中概率组格网以1~3次/a为主,4~7次/a次之。高概率组格网涉及所有强度,但仍以2~7次/a的发生强度为主。特别地,发生强度为23~165次/a活跃火仅在高概率格网中存在。活跃火发生强度在空间上分布不均,且强度从中心向四周递减。1~2级强度格网遍布各岛,3~4级强度格网集聚分布,5~6级强度格网数量最少,分布在其他强度格网中心。
(3)印度尼西亚活跃火时间集中在8—10月,且其全年占比的年际变化与厄尔尼诺年吻合,对厄尔尼诺的响应体现在8—10月活跃火频次显著增加。厄尔尼诺越强,活跃火响应程度越高。五大岛屿响应程度从高到低依次是苏门答腊岛、苏拉威西岛、加里曼丹岛、爪哇岛和巴布亚岛。
印度尼西亚是全球厄尔尼诺事件的重要影响区域之一,厄尔尼诺影响下的活跃火现象正呈加剧态势。本文在公里格网层面定量分析了2001—2018年活跃火发生概率、强度及其对厄尔尼诺的响应程度与区域差异。尽管格网大小可能会对评价结果认识造成一定干扰,且极少量活跃火矢量点数据(多年平均不及0.05%)因位于邻近格网的交界线上而未纳入分析,但本研究仍可为后续利用较高空间分辨率卫星影像开展典型区域(如中南半岛)活跃火动态监测指明方向,并为深入研究活跃火对厄尔尼诺的响应机制与过程奠定基础。后续研究将进一步聚焦特征时段、重点区域内的活跃火发生概率与强度分析,比较不同格网下对评估结果的客观表达。当然,厄尔尼诺作为大尺度的气候事件,其对区域等亚尺度层面活跃火的影响机制、以及厄尔尼诺从开始到消亡与活跃火发生发展的时空耦合特征等仍缺乏系统研究,也是今后拟加强的研究方向。
参考文献 原文顺序
文献年度倒序
文中引用次数倒序
被引期刊影响因子
[本文引用: 1]
DOI:10.1111/j.1469-8137.2004.01252.xURLPMID:15720663 [本文引用: 1]

This paper is the first global study of the extent to which fire determines global vegetation patterns by preventing ecosystems from achieving the potential height, biomass and dominant functional types expected under the ambient climate (climate potential). To determine climate potential, we simulated vegetation without fire using a dynamic global-vegetation model. Model results were tested against fire exclusion studies from different parts of the world. Simulated dominant growth forms and tree cover were compared with satellite-derived land- and tree-cover maps. Simulations were generally consistent with results of fire exclusion studies in southern Africa and elsewhere. Comparison of global 'fire off' simulations with landcover and treecover maps show that vast areas of humid C(4) grasslands and savannas, especially in South America and Africa, have the climate potential to form forests. These are the most frequently burnt ecosystems in the world. Without fire, closed forests would double from 27% to 56% of vegetated grid cells, mostly at the expense of C(4) plants but also of C(3) shrubs and grasses in cooler climates. C(4) grasses began spreading 6-8 Ma, long before human influence on fire regimes. Our results suggest that fire was a major factor in their spread into forested regions, splitting biotas into fire tolerant and intolerant taxa.
URLPMID:17734705 [本文引用: 1]
URLPMID:19390038 [本文引用: 1]
[本文引用: 1]
URLPMID:16825536 [本文引用: 1]
[本文引用: 1]
[本文引用: 1]
[本文引用: 1]
[本文引用: 1]
[本文引用: 1]
[本文引用: 1]
DOI:10.1038/nature15371URLPMID:26381985 [本文引用: 1]
Assessment of the global burden of disease is based on epidemiological cohort studies that connect premature mortality to a wide range of causes, including the long-term health impacts of ozone and fine particulate matter with a diameter smaller than 2.5 micrometres (PM2.5). It has proved difficult to quantify premature mortality related to air pollution, notably in regions where air quality is not monitored, and also because the toxicity of particles from various sources may vary. Here we use a global atmospheric chemistry model to investigate the link between premature mortality and seven emission source categories in urban and rural environments. In accord with the global burden of disease for 2010 (ref. 5), we calculate that outdoor air pollution, mostly by PM2.5, leads to 3.3 (95 per cent confidence interval 1.61-4.81) million premature deaths per year worldwide, predominantly in Asia. We primarily assume that all particles are equally toxic, but also include a sensitivity study that accounts for differential toxicity. We find that emissions from residential energy use such as heating and cooking, prevalent in India and China, have the largest impact on premature mortality globally, being even more dominant if carbonaceous particles are assumed to be most toxic. Whereas in much of the USA and in a few other countries emissions from traffic and power generation are important, in eastern USA, Europe, Russia and East Asia agricultural emissions make the largest relative contribution to PM2.5, with the estimate of overall health impact depending on assumptions regarding particle toxicity. Model projections based on a business-as-usual emission scenario indicate that the contribution of outdoor air pollution to premature mortality could double by 2050.
URLPMID:31092858 [本文引用: 1]
[本文引用: 1]
[本文引用: 1]
[本文引用: 1]
[本文引用: 1]
[本文引用: 1]
[本文引用: 1]
[本文引用: 1]
[本文引用: 1]
[本文引用: 1]
[本文引用: 2]
[本文引用: 1]
[本文引用: 1]
[本文引用: 1]
[本文引用: 1]
[本文引用: 1]
[本文引用: 1]
[本文引用: 2]
[本文引用: 1]
URLPMID:24233722 [本文引用: 1]
[本文引用: 1]
[本文引用: 1]
[本文引用: 1]
[本文引用: 1]
DOI:10.1016/j.rse.2016.02.054URLPMID:30158718 [本文引用: 1]
The two Moderate Resolution Imaging Spectroradiometer (MODIS) instruments, on-board NASA's Terra and Aqua satellites, have provided more than a decade of global fire data. Here we describe improvements made to the fire detection algorithm and swath-level product that were implemented as part of the Collection 6 land-product reprocessing, which commenced in May 2015. The updated algorithm is intended to address limitations observed with the previous Collection 5 fire product, notably the occurrence of false alarms caused by small forest clearings, and the omission of large fires obscured by thick smoke. Processing was also expanded to oceans and other large water bodies to facilitate monitoring of offshore gas flaring. Additionally, fire radiative power (FRP) is now retrieved using a radiance-based approach, generally decreasing FRP for all but the comparatively small fraction of high intensity fire pixels. We performed a Stage-3 validation of the Collection 5 and Collection 6 Terra MODIS fire products using reference fire maps derived from more than 2500 high-resolution Advanced Spaceborne Thermal Emission and Reflection Radiometer (ASTER) images. Our results indicated targeted improvements in the performance of the Collection 6 active fire detection algorithm compared to Collection 5, with reduced omission errors over large fires, and reduced false alarm rates in tropical ecosystems. Overall, the MOD14 Collection 6 daytime global commission error was 1.2%, compared to 2.4% in Collection 5. Regionally, the probability of detection for Collection 6 exhibited a ~3% absolute increase in Boreal North America and Boreal Asia compared to Collection 5, a ~1% absolute increase in Equatorial Asia and Central Asia, a ~1% absolute decrease in South America above the Equator, and little or no change in the remaining regions considered. Not unexpectedly, the observed variability in the probability of detection was strongly driven by regional differences in fire size. Overall, there was a net improvement in Collection 6 algorithm performance globally.
[本文引用: 2]
[本文引用: 2]
[本文引用: 1]
[本文引用: 1]
[本文引用: 1]
