 ,1,2, 祝巧玲1,2
Spatio-temporal pattern and driving forces of urbanization in China's border areas
SONG Zhouying,1,2, ZHU Qiaoling1,2收稿日期:2019-01-29修回日期:2020-05-6网络出版日期:2020-08-25
| 基金资助: |
Received:2019-01-29Revised:2020-05-6Online:2020-08-25
| Fund supported: |
作者简介 About authors
宋周莺(1983-), 女, 浙江缙云人, 博士, 副研究员, 硕士生导师, 主要从事经济地理与区域发展相关研究。E-mail:

摘要
关键词:
Abstract
Keywords:
PDF (3955KB)元数据多维度评价相关文章导出EndNote|Ris|Bibtex收藏本文
本文引用格式
宋周莺, 祝巧玲. 中国边境地区的城镇化格局及其驱动力. 地理学报[J], 2020, 75(8): 1603-1616 doi:10.11821/dlxb202008004
SONG Zhouying, ZHU Qiaoling.
1 引言
中国边境地区受地理区位、交通条件及资源禀赋的限制,人口比较稀疏,经济发展动力不足,城镇化进程相对较慢。边境地区的城镇化水平相对滞后,在一定程度上制约了中国全面建成小康社会、优化城镇空间格局的进程。2018年中国134个边境县级行政区中有36个国家扶贫开发工作重点县,是中国实现区域协调发展需重点关注的地区。另一方面,边境地区尤其边境口岸,是中国内陆开放的重要门户[1]。特别是2013年中国提出共建“一带一路”倡议以来,边境贸易取得了长足发展,对优化边境市场环境、推进双边合作、带动边境地区发展都产生了积极的影响。在此态势下,深入解析中国边境地区的城镇化发展格局、研究其城镇化发展驱动力,对优化中国城镇格局、实现区域协调发展、推进“一带一路”建设均具有重要意义。目前,已有不少****对中国城镇化格局进行研究[2,3,4,5,6],其中城镇化过程及其动力机制是地理学研究的热点问题,地理****从不同角度探讨中国城镇化发展的驱动机制。例如,陈明星等[7]研究发现城镇化动力因子呈现多元化特征,市场力是主要驱动力,其后依次是内源力、行政力和外向力;刘彦随等[8]研究县域城镇化的驱动因素,认为县域经济发展阶段、固定资产投资、离中心城市距离、二三产业水平、农民人均纯收入、人口密度是影响县域城镇化格局的主要因素;王建康等[9]基于全国285个地级市的面板数据分析发现,劳动力、投资水平、经济发展、政府能力、基础设施及产业结构均起到正向的促进作用;高金龙等[10]认为人口集聚、经济发展、产业结构、城市特性及地理区位等是中国县域土地城镇化差异较重要的影响因素;吴一凡等[11]认为经济发展水平、城市性质、人口规模、政府决策行为、地理区位和地区内部差距是人口与土地城镇化耦合态势的主要驱动因素。
总体来看,中国城镇化的研究多集中于全国层面或中东部地区,对于边境地区的研究相对较少。中国边境地区远离区域经济中心,城镇化进程相对滞后;而且由于边境地区特殊的地理区位和地缘环境,其城镇化发展的驱动机制必然与其他地区存在差异。同时,随着县域和中小城市在国民经济发展战略中的重要性提升,县域城镇化发展日益成为城镇化研究的重要领域[8, 10]。在此背景下,本文以中国边境地区的134个县级单元为研究对象,采用地理探测器等分析方法,研究2000—2015年中国边境地区的城镇化发展格局;并力图构建边境地区城镇化发展的驱动力框架,深入探析其发展驱动力,以期丰富城镇化、边境地区相关研究。
2 研究框架
2.1 边境地区城镇化发展的独特性
中国边境地区城镇化进程相对缓慢[11,12],比全国城镇化进程存在一定的滞后。同时,受特殊的自然环境、交通条件和地缘环境的影响[13],边境地区的城镇化驱动机制与以往研究成果既有相通之处、也有一定特殊性。自然环境方面,中国边境地区自然环境差异大,且制约城镇化发展的不利因素较多。天山山脉、喜马拉雅山脉、横断山脉等对边境地区的对外联系形成了一定的阻隔,不利于城市的建设和空间扩张。同时,内蒙古、新疆、西藏很多边境县域气候寒冷干旱,各种自然灾害频发,增加了经济发展的成本,不利于人口集聚。
人口及社会方面,边境地区少数民族人口占比高,这些民族大多跨境分布,为与临近国家的交往合作提供了社会基础[14]。此外,边境地区人口密度较低,由于没有足够的门槛人口数量,缺乏较高级别的教育、娱乐、甚至必要的基础设施,对城镇化造成了一定的阻碍[15]。
交通建设方面,边境地区涉及与国内和国际市场的双重接轨。对国内市场的内向延伸中,边境交通线路密度较低,与国内核心市场分割、经济空间布局分散,要素流动受阻[16]。对国际市场的外向开放中,受边境效应的影响,交通网络大多在边境截断,仅有偶尔的支线通过,缺少交通枢纽[17]。但随着“一带一路”倡议的提出,边境地区与国际市场的互联互通逐渐加强,边境地区交通边缘性特征有所改善[18]。
经贸合作方面,跨境的经贸合作是边境地区重要的经济活动。边境地区两边不同的要素禀赋和发展差异会给潜在的地区经济合作带来吸引和刺激,加上地理临近和文化亲近,边境地区倾向于发展成为具有共享、互换两侧资源的功能空间[19,20]。但边界“屏蔽效应”也可能对经贸交流产生阻碍作用[14]。
地缘环境方面,边境地区既是维护国家安全的缓冲地区,也是国家安全中的薄弱和敏感地区[21,22],其城镇化过程易受地缘政治影响。不稳定的地缘环境可能导致边境地区人口大量流失、开放程度低、边境安全受威胁等,不利于其城镇化[23]。
政策条件方面,中国城市发展很大程度上是国家、区域战略等引导的资本积累和资源配置结果,但区域政策条件的演变使边境地区的政策优势地位不断变化。西部大开发战略、“一带一路”倡议等为边境地区创造了巨大的发展机遇。
产业发展方面,边境地区工业落后、产业结构较为单一,城镇化的产业基础相对较弱。但边境县域旅游资源开发价值较高[24],边境旅游作为“兴边富民”的重要战略产业[25]是边境地区调整产业结构、推进城镇化发展的重要途径[26,27]。
2.2 城镇化驱动力体系构建
考虑到边境地区的独特性,将已有研究中相关性较强的驱动因素合并,将边境地区的城镇化驱动力归纳为自然力、行政力、市场力、产业力、交通力和社会力。如表1所示,自然力反映的城镇化的自然基础条件,衡量当地宜居程度及资源情况[28],即其对城市所集聚人口的吸引与容纳能力;考虑到边境地区的自然条件及资源情况,以年均降水、年均气温、平均海拔和耕地资源为代表指标。行政力为国家和地方政策为该地区提供的“先发权”,以支撑地区更好地调配资金、土地等要素实现经济建设和城市发展[29,30];本文选用地方财政支出、全社会固定资产投资和政策优惠指数等指标[31,32]。市场力衡量地区国内外市场规模及潜力;鉴于中国西南边境地区的城镇发展由边境贸易带动明显[22],本文在市场力指标选择上强调边境贸易、贸易双方的经济一体化水平、市场融合程度等[33]。产业力从总体经济规模、工业发展态势及边境地区具有前景和优势的产业3个方面[34,35,36]选择地区生产总值、工业产值和旅游业收入等3个指标。交通力衡量边境地区作为跨境运输通道的节点在对内连通和外向延伸两个方面的发展程度,包括陆路交通[37]及航空运输,本文选取交通线密度、外向通道中的地位、航空运输[38]等3个方面的指标。社会力反映地区的社会福利和保障水平,包括医疗、教育两个方面的指标;另外,由于边境地区是中国少数民族集聚区,也是边境地区跨境交流的重要人文因素,因此选取少数民族人口比重指标。
Tab. 1
表1
表1中国边境地区城镇发展驱动力及其指标权重
Tab. 1
| 指标 | 单位 | 指标解释 | 数据来源 | 权重 | |
|---|---|---|---|---|---|
| 自然力 | 年均降水 | mm | 衡量气候条件宜居程度,各县级单元各年的平均降水量 | 中国气象数据网 | 0.25 |
| 年均气温 | ℃ | 衡量气候条件宜居程度,各县级单元各年的平均气温 | 中国气象数据网 | 0.25 | |
| 平均海拔 | km | 衡量边境地区的地形条件,各县级单元的平均海拔 | 地理空间数据云 | 0.25 | |
| 耕地面积 | hm2 | 衡量边境地区的耕地资源规模 | 中国经济与社会发展统计数据库 | 0.25 | |
| 行政力 | 地方财政支出 | 万元 | 衡量地方政府的行政能力和调控能力 | 县域统计年鉴 | 0.30 |
| 全社会固定资产投资 | 万元 | 衡量地方政府的经济能力 | 县域统计年鉴 | 0.30 | |
| 政策优惠指数 | / | 衡量国家政策扶持力度(根据下述5项政策条件进行0~5的赋值,每一项对应1分) 1 西部大开发、东北振兴 2 沿边综合配套改革试验区、现代农业综合配套改革试验区 3 边境经济合作区、综合保税区或兴边富民试点 4 重点开发开放试验区 5 跨境经济合作区 | 商务部、发改委网站 | 0.40 | |
| 市场力 | 社会消费品零售总额 | 万元 | 衡量边境地区所占有的国内市场的规模 | 县域统计年鉴 | 0.40 |
| 双边贸易额 | 万美元 | 衡量边境地区的贸易发展水平 | 国际贸易中心数据库 | 0.20 | |
| 双边经济融合水平 | / | 衡量双边贸易环境(对融合水平进行0~3的赋值) 0 两国未加入任何贸易协议 1 两国都加入了经济组织或协议,如WTO、CAFTA、BRI等 2 两国进入双边贸易协商阶段 3 两国签署了自由贸易协定 | 商务部、发改委网站 | 0.20 | |
| 市场机会 | / | 衡量边境地区毗邻国家的市场规模、市场预期等(以邻国人均GDP/边境地区人均GDP表示) | 县域统计年鉴,世界银行数据库 | 0.20 | |
| 产业力 | 规模以上工业总产值 | 万元 | 衡量工业化的水平 | 县域统计年鉴 | 0.40 |
| 旅游收入 | 百万美元 | 衡量旅游业发展水平 | 中国统计年鉴 | 0.30 | |
| 地区生产总值 | 亿元 | 衡量产业发展的总体情况 | 县域统计年鉴 | 0.30 | |
| 交通力 | 运输线密度 | km/km2 | 衡量连接国内的交通通达水平(运输线长度与行政区域面积的比值,包括公路和铁路线路) | 中国统计年鉴 | 0.40 |
| 交通地位 | / | 判断县域是否是对外开放中重要的交通节点 | 商务部、发改委网站 | 0.30 | |
| 航空建设水平 | / | 衡量航空发展水平(对机场建设态势进行0~3的赋值) 0 无3C或以上等级机场 1 有3C等级机场 2 有4C等级机场 3 有4D等级机场 | 通航资源网 | 0.30 | |
| 社会力 | 少数民族人口比重 | / | 衡量与邻近国家社会文化融合 | 人口普查 | 0.40 |
| 教育水平 | 人 | 衡量每万人中小学生及普通中学在校生数 | 县域统计年鉴 | 0.30 | |
| 医疗水平 | 张 | 每万人所有的医疗机构床位数 | 县域统计年鉴 | 0.30 |
新窗口打开|下载CSV
关于各指标的权重,首先,本文参考已有文献和实地调研资料,对各指标权重进行初步赋值;其次,在边境地区政府官员、企业负责人、个体商户的实地调研与访谈中,进一步根据实际情况修订权重;同时,征求国家发改委西部开发司相关人员以及边境地区研究专家的意见,最终确定各指标的权重(表1)。
3 研究方法与数据
3.1 研究方法
(1)CV系数。本文运用CV系数衡量边境县域城镇化水平的空间差异,即134个边境县域城镇化水平的标准差除以平均值。(2)地理探测器。本文应用地理探测器进一步探析边境城镇化的驱动因子及其交互作用。地理探测器是探测空间分异、揭示其背后驱动力的一组统计学工具[8, 39],本文使用因子探测和交互探测。因子探测主要测度不同驱动因子对城镇化的解释程度,计算公式为:
式中,qD, H为驱动要素D对城镇化水平H的解释程度;n、σ2分别为样本量和方差;nh、σh分别为h层(h = 1, 2…L)样本量和方差。qD, H取值范围为[0, 1],数值越大表明驱动要素对城镇化水平的解释力越大,1说明驱动因素与城镇化水平完全相关。
交互探测用于识别多个主要驱动因子之间的交互作用,即驱动因子X1和X2共同作用是否会增加或减弱对因变量Y的解释力,或二者对Y的影响是独立的。
3.2 研究区域
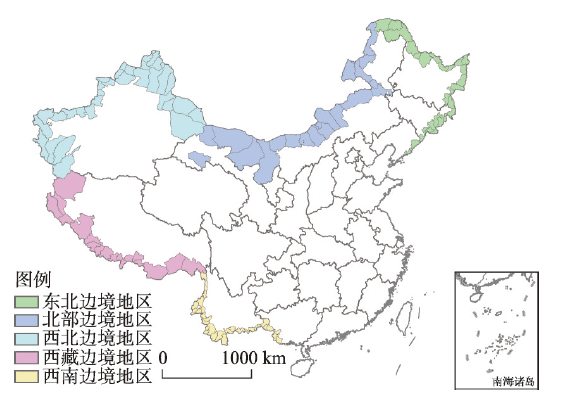
研究区域包含134个中国陆域边境县(图1)。为了分析方便,根据社会经济与自然环境的差异,将边境地区进一步划分为5个区域,即由东北三省边境县域组成的东北边境地区、由内蒙古和甘肃边境县域组成的北部边境地区、由新疆和西藏边境县域组成的西北边境地区和西藏边境地区,以及由云南、广西边境县域组成的西南边境地区[28]。图1
 新窗口打开|下载原图ZIP|生成PPT
图1研究区域
Fig. 1Study area
3.3 数据来源
边境地区城镇化水平以常住人口城镇化率为衡量指标,以第五次人口普查数据、第六次人口普查数据为基础,再根据《中国县域统计年鉴》进行补充;个别年份某些边境县域没有人口数据的,运用联合国人口测算法推算。降水、气温、海拔、耕地面积等自然环境与资源数据来源于中国气象数据网、地理空间数据云和经济与社会发展统计数据库;政策优惠数据主要来源于商务部、发改委等官方网站,以及国务院发布的《国务院关于支持沿边重点地区开发开放若干政策措施的意见》中的沿边重点地区名录。毗邻国家的GDP、贸易协议等数据来自于世界银行数据库、国际贸易中心数据库等官方网站。4 中国边境地区城镇化发展格局
4.1 发展态势
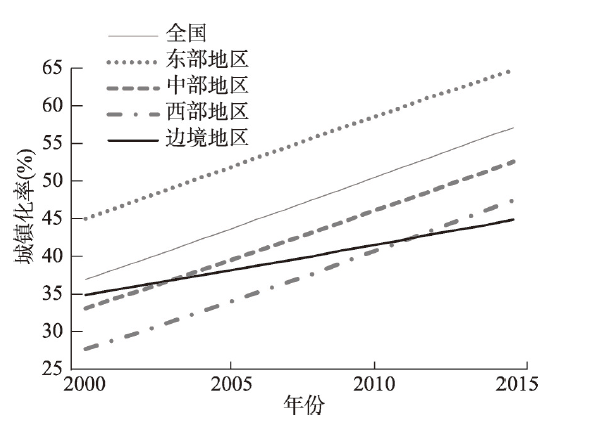
2000—2015年中国城镇化水平不断提升,但边境地区受区位偏远、交通落后等因素制约,城镇化发展非常缓慢,城镇化水平长期低于全国平均水平且与全国平均水平的差距不断拉大。如图2所示,2000年边境地区平均城镇化水平为34.81%,高于同期的西部、中部地区,接近全国平均水平。此后,随着西部大开发、中部崛起等区域发展战略的实施,中西部地区的城镇化水平迅速提高;而边境地区则相对较慢。2003年边境地区城镇化水平被中部地区超越,2012年被西部地区超越,2015年边境地区城镇化率为44.84%,低于中西部地区,比全国平均水平低12个百分点。图2
 新窗口打开|下载原图ZIP|生成PPT
图22000—2015年中国各区域的城镇化率变化
Fig. 2Changes in average urbanization rate in China by region, 2000-2015
4.2 时空格局
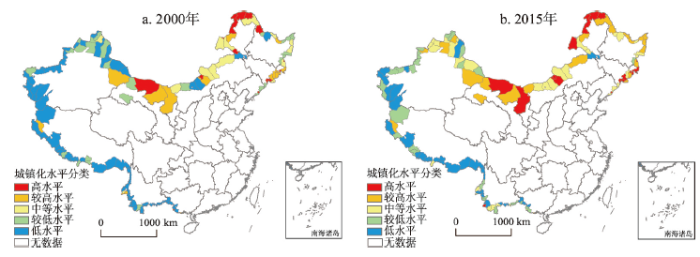
2000—2015年中国边境地区城镇化CV指数从0.713下降至0.520,空间差异呈较明显的缩小态势。但边境地区城镇化空间格局变化不大,东北及北部边境地区的城镇化水平较高,西北、西藏及西南边境地区的城镇化水平较低。根据自然间断点分级法,以25%、40%、55%和70%为分界点,将边境县域的城镇化分为低、较低、中等、较高和高水平5大类(图3)。图3
 新窗口打开|下载原图ZIP|生成PPT
图32000年和2015年中国边境地区城镇化格局
Fig. 3Spatial characteristics of urbanization in border areas of Chinain 2000 and 2015
2000年西北、西藏及西南边境地区除西南边境的防城港、东兴、凭祥、芒市、陇川、瑞丽,西藏边境的噶尔,以及西北边境的阿勒泰、哈密等县域外,其他县域的城镇化率均低于40%,为较低或低水平。其中西藏仲巴、萨嘎、定日、岗巴等县域的城镇化水平甚至低于5%,全国最低。东北及北部边境地区除东北边境的逊克、鸡东、绥滨、抚远、宽甸、东港,以及北部边境的科尔沁右翼前旗、四子王旗、达茂联合旗、乌拉特中旗等县域外,其他县域的城镇化率均高于40%,为中等及更高水平。其中二连浩特、满洲里、阿尔山、漠河、塔河等县域的城镇化水平最高,均超过90%。
2015年西北边境北部的博乐、塔城、福海、奇台,北部边境中部的肃北、阿拉善左旗、四王子旗,东北边境东部的呼玛、同江、抚远、东宁、珲春、抚远等县域的城镇化水平有明显提升。西北边境的北部县域城镇化率提升至中等水平以上,但和田、皮山、乌什、叶城、阿克陶等县域的城镇化率低于20%。西南边境的城镇化水平略有提升,但西藏边境仍处于连片的低水平阶段。东北及北部边境大部分县域的城镇化率高于55%,处于较高或高水平;仅科尔沁右翼前旗、穆棱的城镇化率低于40%。
4.3 发展模式
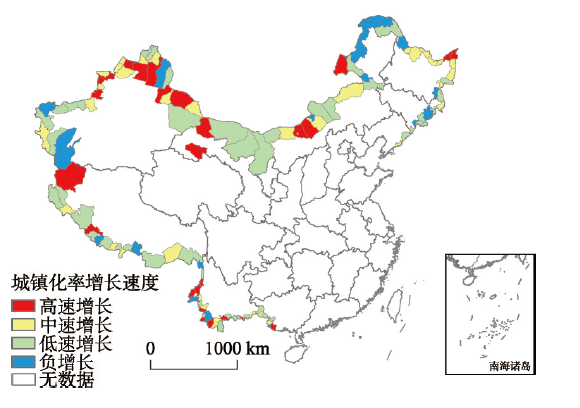
2000—2015年中国边境地区的城镇化率增长普遍较慢,大部分县域的城镇化率增长在10%以下,有些城镇甚至出现倒退。根据自然间断点分级法,以0、10%和20%为分界点,将其划分为负增长、低速增长、中速增长和高速增长4种类型(图4)。西北边境的北部和西南边境的部分地区的城镇化率呈高速增长;但西北边境的南部、北部边境的东部、东北边境的南部等部分县域面临人口流失问题,城镇化率呈负增长。图4
 新窗口打开|下载原图ZIP|生成PPT
图42000—2015年中国边境地区城镇化率增长速度
Fig. 4Growth rate of urbanization rate in border areas of China from 2000 to 2015
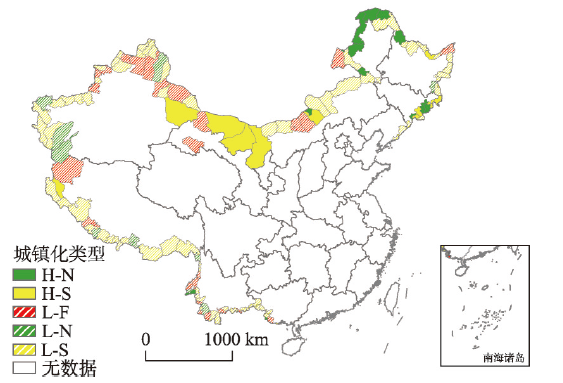
以2000年城镇化水平为准,将边境县域划分为中等水平以下(L)和中等水平以上(H);以2000—2015年城镇化率增长速度为准,划分负增长(N)、中低速增长(S)和高速增长(F);结合以上两个指标,将边境地区的城镇化发展模式划分为6种类型(图5)。H-N模式主要是东北边境、北部边境的东部;H-S模式主要是东北边境的南部、北部边境的西部;L-F模式集中在西北、西南边境;L-N模式县域较少,且在空间上零星分布;L-S模式县域最多,在空间上的分布较广。总体而言,西北、西南边境的城镇化水平偏低、城镇化率以中高速增长;西藏边境的城镇化水平最低、增长速度相对平缓;东北、北部边境的城镇化水平稍高、但城镇化速度缓慢甚至停滞。
图5
 新窗口打开|下载原图ZIP|生成PPT
图5中国边境地区城镇化发展模式的空间差异
Fig. 5Spatial characteristics of development types for urbanization in border areas of China
5 中国边境地区城镇化发展的驱动力分析
5.1 总体驱动力分析
因子探测结果显示(表2),交通力和产业力对边境城镇化的贡献最大,其次是社会力、自然力和行政力,市场力作用相对较小。① 交通力是边境地区城镇化的主要驱动因素。主要由于地理位置边缘性,边境地区交通条件仍普遍较薄弱,较小的交通条件改善就能获得较大的经济和社会效益;例如博乐、凭祥等边境县通过改善交通运输条件,吸引人流、物流,聚集商贸活动,极大带动了城市发展。② 产业力是边境地区城镇化发展的主要因素。具体来看,丹东、东港、鸡东、密山等东北边境县域的产业发展水平较高,带动城镇化水平提升;洛扎、错那、康马等西藏边境县域的产业规模小、发展严重滞后,制约了城镇化的发展。③ 社会力和自然力分别从社会服务和自然环境两个方面塑造宜居环境,吸引人口向城市集聚,但对于边境地区城镇化作用相对较小。地方和国家的政策支撑能给边境地区带来一定的发展优势,但由于近年来中国对边境地区的优惠政策相对弱化,在较大的地域范围上行政力对边境地区城镇化的作用很有限。另外,市场力对边境城镇化作用有限,这与边境地区产业规模有限、交通条件落后有关,缺乏充足的贸易商品供给,也没有足够的腹地支撑,边境地区的市场潜力未能发挥出来。Tab. 2
表2
表2中国边境地区城镇化驱动力因子探测结果
Tab. 2
| 自然力 | 行政力 | 市场力 | 产业力 | 交通力 | 社会力 | |
|---|---|---|---|---|---|---|
| 全部边境地区 | 0.103*** | 0.096*** | 0.058*** | 0.204*** | 0.224*** | 0.166*** |
| (0.000) | (0.000) | (0.000) | (0.000) | (0.000) | (0.000) | |
| 东北边境 | 0.248*** | 0.073*** | 0.018* | 0.014 | 0.133*** | 0.069*** |
| (0.000) | (0.000) | (0.068) | (0.135) | (0.000) | (0.000) | |
| 北部边境 | 0.092*** | 0.132*** | 0.199*** | 0.039** | 0.190*** | 0.151*** |
| (0.000) | (0.000) | (0.000) | (0.017) | (0.000) | (0.000) | |
| 西北边境 | 0.063*** | 0.099*** | 0.048*** | 0.232*** | 0.228*** | 0.016* |
| (0.000) | (0.000) | (0.000) | (0.000) | (0.000) | (0.084) | |
| 西藏边境 | 0.114*** | 0.036** | 0.052*** | 0.017 | 0.040 | 0.072*** |
| (0.000) | (0.042) | (0.007) | (0.324) | (0.256) | (0.000) | |
| 西南边境 | 0.037*** | 0.173*** | 0.198*** | 0.064*** | 0.138*** | 0.108*** |
| (0.000) | (0.000) | (0.000) | (0.000) | (0.000) | (0.000) |
新窗口打开|下载CSV
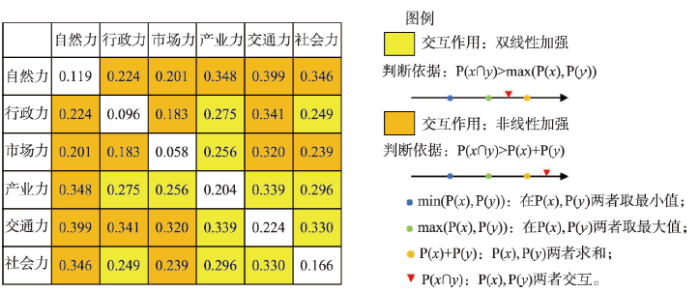
交互探测结果显示(图6),六大驱动力对边境地区城镇化的推动过程中存在交互作用,以非线性加强为主、部分双线性加强。可见,边境地区的城镇化发展是自然本底、经济、政策、产业、交通、社会等多种因素相互协调、共同作用的结果。其中自然力与社会力、交通力、产业力、市场力的交互作用最强,自然环境与资源仍然是城市发展的基础,影响了其他驱动力的作用效果。另外,市场力—交通力、行政力—市场力的交互加强效果显著,主要因为边境贸易活动需要通过交通线路连接供应市场和销售市场,较大的市场规模和便利的交通条件之间相互促进,有利于共同提升边境的城镇化水平。另外,在边境地区推进的跨境经济合作区、综合保税区、边境经济合作区等行政因素有利于扩大市场规模、提高地区的市场力,从而推动城镇化发展。
图6
 新窗口打开|下载原图ZIP|生成PPT
图6中国边境地区城镇化水平的驱动力交互探测结果
注:对角线数值为各驱动力单独的解释力度(q统计量),非对角线数值为两个驱动力交互作用后的解释力度(q统计量)。
Fig. 6Interactive detection results of driving forces for urbanization in border areas of China
5.2 分区域驱动力分析
东北边境的城镇化过程中,交通力、行政力、社会力和自然力均有显著作用,市场力作用次之,产业力作用不强。一方面,自然力贡献力最大,相对充沛的降水、广袤的平原和丰富的耕地资源,为东北边境的城镇发展提供了良好的条件。交通力的贡献力其次,主要因为东北地区绥芬河、黑河、珲春、和龙、丹东等口岸连接国际通道,汇集了国内外商品贸易流,通过溢出效应拉动城镇发展。另一方面,相邻的朝鲜开放程度低,俄罗斯人口稀少,临近国家的边境市场贸易有限,市场力对东北边境县域的贡献力较小。另外,随着东北地区的传统机械设备制造业渐渐衰弱、新兴产业竞争力不足,产业力不能为城镇发展提供有效动力。北部边境的城镇化,交通力、市场力、行政力、社会力和自然力均有显著作用,产业力相对较弱。市场力和交通力的贡献最大,因为二连浩特、满洲里等边境经济合作区和边境口岸在连接欧亚通道中(例如中蒙俄经济走廊)占有重要的地位,市场力和交通力均较强,能有效推动地方城市发展。
西北边境的城镇化,产业力、交通力、自然力、行政力和市场力均有显著作用,社会力相对较弱。产业力和交通力的贡献最大,主要因为西北边境是丝绸之路经济带中多条国际经济走廊的交通枢纽地区,霍尔果斯、博乐(阿拉山口)、塔城等对外开放重要口岸提升地区的交通地位,也增强了地方与国际、国内的连通性,能有效促进城镇化发展。同时,西北边境地区还有可可托海(富蕴)、喀纳斯(哈巴河)等5A级景区,加上少数民族的风俗文化和跨境旅游的开发,旅游业发展态势较好,有效促进城镇化发展。
西藏边境的城镇化,自然力、社会力和市场力有显著作用,交通力和行政力较显著,产业力和自然力的作用不显著;但相比其他边境地区,除自然力外,这些驱动力的作用都相对较小。西藏边境与毗邻国家有喜马拉雅山脉阻隔,自然条件恶劣、人口规模小、交通不完善、社会经济发展滞后,各项驱动力的强度偏弱。大部分西藏边境县域尚未培育出能有效带动城镇化的驱动力,是该区域城镇化水平和速度均持续偏低的原因。
西南边境的城镇化,六大驱动力均有显著作用,市场力和行政力的贡献最大,其次是社会力和交通力,产业力和自然力相对较小。因为西南边境有瑞丽、勐腊、东兴、凭祥等多个边境经济合作区、重点开发开放试验区、跨境经济合作区、综合保税区等,国家政策倾斜和地方财政投入为该地区城镇发展提供了有效支撑;且西南边境面向东南亚广阔的国际市场、对外开放条件好,中国—中南半岛国际经济走廊的建设也提升了西南边境的国内国际交通网络连通性,促进商品和资金流通,扩大了口岸所在城市的市场及腹地范围。另外,西南边境的地形相对平坦,与毗邻国家有怒江、澜沧江等河道连通,东南亚国家人口密度大,跨境民族占少数民族的比例高[40],便于双边居民的文化交流和经贸往来。这些市场、行政、社会、经济条件对西南边境的城镇化发展具有重要推动,促使其成为城镇化速度最快的区域。
综合来看,交通力在除西藏边境外的城镇化过程中均有重要作用,行政力、社会力和市场力在北部和西南边境城镇化发挥较重要的作用,自然力在东北和西藏边境城镇化发挥重要作用,产业力仅在西北边境的城镇化发挥较重要的作用。可见,交通力是边境地区城镇化的重要推动力,边境县域通过开放口岸、建设陆路通道中的重要节点可以实现交通网络的对内连通和向外延伸,在要素流通和集聚过程中产生溢出效应,从而促进城市发展。行政力对边境城镇化的推动作用有限,地方财政支出较高边境地区的行政力作用稍强。社会力和市场力在边境地区城镇化的作用与其临近国家的社会经济情况相关,与毗邻国家社会文化经贸往来密切的边境地区,其社会力、市场力的作用较强。作为城市发展的基础,在城镇化水平较高的东北边境和城市化水平最低的西藏边境,不同的自然条件分别产生了不同的城镇化结果。由于大部分边境地区产业发展水平均较落后,产业力的重要性偏低。
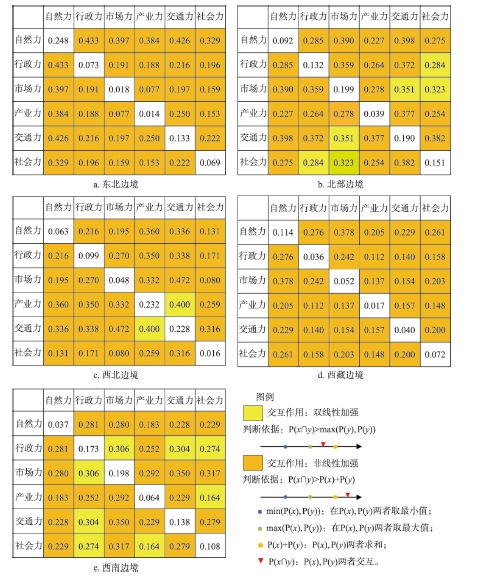
交互探测分析结果显示(图7):① 东北边境的驱动力交互作用对城镇化率的解释力为非线性加强。其中,自然力—市场力、自然力—行政力、产业力—交通力、行政力—市场力、行政力—产业力交互后的解释力增长明显。良好的自然条件有利于市场力与行政力的发挥。东北边境的工业发展基础较好,交通建设与产业发展相适应,能有效促进城市发展;另外,东北边境的政策和财政支出与市场扩张、产业发展相适应,能有效推动城镇化进程。② 北部边境的驱动力交互作用对城镇化率的解释力大部分为非线性加强效果。其中,产业力—交通力交互后的解释力增长明显,因为北部边境有一定工业基础,地方原料加工及其相应的后续产品能在交通支撑下流通,从而一起推进城市发展。③ 西北边境地区的市场力—交通力交互后的解释力增长明显,其次是行政力—市场力。因为西北边境的霍尔果斯、阿拉山口等口岸是新亚欧大陆桥、中国—中亚—西亚国际经济走廊的重要节点,直接连接中亚及欧洲市场,较大的市场规模和便利的交通条件之间相互促进,共同提升地方城镇化水平。另外,边境经济合作区、综合保税区、跨境经济合作区等政策有利于扩大市场规模、提高地区的市场力,进一步推动城镇化进程。④ 西藏边境的驱动力交互作用后解释力度得到明显加强。其中,自然力—市场力交互后解释力大幅增长,行政力—市场力增长幅度次之,说明恶劣的自然环境与资源条件对西藏边境地区的市场范围扩张起到了较强的负向影响,行政力对城镇化的直接驱动作用虽然较低,但其通过扩大市场潜力,间接推动了城镇化进程。⑤ 西南边境的驱动力交互作用加强效果略低于其他地区,自然力—社会力、自然力—产业力、自然力—行政力交互后的解释力增幅较大。自然力对西南边境城镇化的解释力虽较弱,但却是边境人口分布与流动、政策实施效果的基本影响因素,其与社会力和行政力一起的解释力更强。
图7
 新窗口打开|下载原图ZIP|生成PPT
图7中国边境地区城镇化水平的驱动力交互探测结果
注:对角线数值为各驱动力单独的解释力度(q统计量),非对角线数值为两个驱动力交互作用后的解释力度(q统计量)。
Fig. 7Interactive detection results of driving forces for urbanization in border areas of China
可见,边境地区的城镇化驱动力之间存在明显的相互加强作用,以非线性加强为主、部分双线性加强。自然力的交互作用最强,除西北边境地区外,自然力与其他驱动力之间均是交互作用更强的非线性加强。这表明基础自然环境仍是边境地区城镇化发展的基础要素。
6 结论与讨论
6.1 结论
本文深入解析2000—2015年中国边境地区的城镇化格局及其驱动机制,研究发现:① 2000—2015年中国边境地区城镇化水平长期低于全国平均水平且差距不断拉大。可见边境地区面临着城镇化发展滞后、动力不足的困境,部分边境县域甚至面临人口流失问题。② 同期,边境地区的城镇化空间差异有较明显缩小,CV值从0.713下降到0.520。从具体区域看,西北、西南边境的城镇化水平偏低、城镇化增速较快;西藏边境的城镇化水平最低、增长速度相对平缓;东北、北部边境地区的城镇化水平稍高、但城镇化速度缓慢甚至停滞。③ 交通力和产业力对边境地区城镇化贡献最大,市场力作用较小,各种驱动力之间存在明显的相互加强作用。④ 西北、西南边境分别形成了以产业力和交通力、市场力和行政力为主要驱动力的城镇化发展机制;西藏边境的自然、社会、经济条件薄弱,尚未形成具有较强贡献作用的城镇化驱动力;东北、北部边境的交通力对城镇化贡献较大,与市场、产业的交互增强效果明显。6.2 讨论
已有研究认为东部地区城镇化的主要驱动力包括经济水平、产业结构、外来投资、固定资产投资、人口规模、政策导向、区位条件、技术创新等因素影响[41,42]。与东部地区不同,边境地区受其自然环境、交通条件和地缘经济环境的影响,在对外开放中处于较边缘的位置。因此边境地区城镇化主要驱动力为交通力,尤其是城镇化基础较好的西北和北部边境地区;因为交通基础设施建设能改善边境地区相对边缘的地位,有效服务于城镇化的过程,提高要素的流动性,促进要素和人口的集聚。市场力在推动边境地区城镇化方面发挥的作用较小,仅在北部、西南边境等邻国市场条件较好的区域才有较明显驱动作用。此外,边境地区的城镇化驱动力存在正向交互作用,表明边境地区城镇化的驱动力之间存在典型的“木桶效应”,即任意因素的改变均可能影响城镇化速度。可见,在未来边境地区城镇化进程中,应综合考虑多项驱动机制的协调,结合当地的产业基础、地缘环境和自然环境等,选择适当发展模式。对东北、北部边境等城镇化水平相对较高的地区,建议在已有边境口岸和跨境贸易基础上,进一步给予地方边境贸易的税费优惠政策,增设边民互市贸易区、边境经济合作区、重点开发开放试验区等特殊功能平台,积极培育边境地区的市场环境,推动交通力、市场力、行政力等多驱动力交互作用,共同推动这些边境地区的城镇化发展。对西北、西南边境等城镇化水平稍低、但发展较好的地区,由于政策和市场条件较好,建议在“一带一路”建设框架下进一步推进跨境运输通道建设,加强边境地区与国内腹地、国外市场的联系,增强交通力与已有产业力、市场力的交互作用,推进其城镇化发展。西藏边境由于资源缺乏、自然环境恶劣、交通通达性差,建议进一步提高边民补贴额度,加强地方交通基础设施建设,提高教育和医疗等社会保障水平,阻止边境地区人口流失,争取在行政力主导下,结合以边境旅游为主的产业力、社会力等共同推动其城镇化发展。
参考文献 原文顺序
文献年度倒序
文中引用次数倒序
被引期刊影响因子
[本文引用: 1]
[本文引用: 1]
[本文引用: 1]
[本文引用: 1]
[本文引用: 1]
DOI:10.11821/dlxb201606010URL [本文引用: 1]

The development of the new-type urbanization in the future has aroused great attention from the government and the public. Initially, this research predicts the urbanization and population dynamics on both national and provincial levels from 2015 to 2030. On this basis, this study examines the spatial variation of urbanization given the national urbanization rate of 70.12%. Furthermore, it estimates the national and provincial demands of investment in the new urbanization. The main conclusions can be drawn as follows: (1) The population and urbanization rate will reach 1.445 billion and 70.12% respectively from 2015 to 2030. (2) The demographic dividend will be vanished when population pressure reaches its maximum. The re-production population will reach 70.16 million and a suburban population of 316.7 million will be urbanized, leaving an urban population of 386 million. (3) Although the urbanization rate of each province will increase during 2015-2030, the difference of urbanization rate and urbanization quality between provinces is substantial. In some provinces, urbanization quality and eco-social development are uncoordinated. (4) A total of 4,105,380 billion yuan is needed for the sake of new urbanization and the investment demand in each province varies largely: Guangdong province needs the most funding, which is 148.09 times as much as that of Tibet, which needs the least funding. In the final part, policy suggestions regarding the investment of the new urbanization are put forward.
[本文引用: 1]
[本文引用: 1]
[本文引用: 1]
DOI:10.11821/dlxb201602002URL [本文引用: 1]
New urbanization is one of China's key national policies. Scientific evaluation focusing upon the human being is the necessary basis of understanding China's recent urbanization and then developing the right policies. There are currently two main evaluation methods of urbanization: the proportion of urban population in a given country or region, and the development of cities and towns in a given region, which are based on the urban-rural dual system. These two methods have deeply reflected the economic and spatial changes than the social restructuring in the course of urbanization, which means the human being as the core of urbanization, particularly those living in the countryside, has not been paid enough attention. Based on the interaction between people's daily activities and urban environment, this paper established a new evaluation system of the population's urbanization quality with 7 modern life indexes, and analyzed the urbanization quality of the urban, rural and the total population at the two levels of the state and 31 provinces. The main findings are: (1) As a social restructuring process, urbanization has not only taken place in the cities and towns, although the urbanization speed in the urban areas is more faster than that in the rural areas. The urbanization quality of both urban and rural population has improved at state and provincial levels since 1995. (2) Two different urbanization spatial patterns of the urban and rural population have formed during the past two decades. The urban population has changed from a low level balance before 1995 to the rise of some provinces in 2000, to the dual structure of East and West in 2005, to the trichotomy of Eastern-Central-Western China after 2010, which is evolving to a higher balanced situation; While the urbanization of rural population has changed from a low level balance before 1995 to the two gradient patterns of Coastal East and Inland Middle and West in recently years. (3) The urbanization quality indexes of rural population in Beijing, Shanghai and Zhejiang Province have exceeded those of urban population in some inland lower urbanized provinces such as Jiangxi, Guizhou, Qinghai and Tibet, which indicates that the urbanization of rural population in the coastal areas is well developed compared with some inland urban areas. So this paper suggests that the evaluation ways and standard of urbanization should be changed, the institutional system of dual urban-rural system should be modified, in order to meet the demand of China's objective need of urbanization.
[本文引用: 1]
[本文引用: 1]
[本文引用: 1]
DOI:10.11821/xb201208001URL [本文引用: 3]
The spatial and temporal characteristics and the formation mechanism of the county urbanization in China since 1990 were analyzed systematically, using the methods including regional differences, transect and geography detectors. Results show that the temporal and spatial differences of the county urbanization were significant. The "herringbone" shape region pattern of high county urbanization was gradually highlighted, which were made by the counties along the north border and in eastern coastal areas. The county urbanization process of some regions were accelerated and enhanced, including Wuhan metropolitan region, Chengdu-Chongqing region and Guanzhong-Tianshui region. The low county urbanization level was maintained in Southwest China and Qinghai-Tibet Plateau regions. The differences of urbanization and the change rate of county urbanization were converged in China after 2000, but the rate has slowed down since 2000. The county urbanization trend of transects were significantly different, including Lianyungang-Lanzhou railway and Lanzhou-Urumqi railway transects, the Yangtze River transect, the border of north China transect, 106 National Road transect, and the eastern coastal transect. There are many factors affecting county urbanization, mainly including economic development stage, the level of secondary and tertiary industries, rural net income per capita, population density, leading position of grain production, demographic statistics and special arrangements for counties. The high county urbanization in northern border regions was a typical type of statistical unrealistically high urbanization. In the future county urbanization development should follow the geographical differences, highlight its leading function, and adopt multiple urbanization development models such as promoting urbanization intensively in key urban economic development areas, separating urbanization in cropland and grain producing areas, migrating urbanization in ecological and water resource protection areas, suburban areas and urban-based urbanization and other leading county urbanization patterns.
[本文引用: 3]
DOI:10.1329/j.cnki.sgs.2016.01.008URL [本文引用: 1]
The comprehensive level of new urbanization in 285 prefecture level cities of 2003-2012 was measured, and the spatial pattern of its evolution was analyzed. Based on reverse distance square weight matrix, this article tested the spatial correlation, established the spatial econometric model to analyze its influencing factors. The conclusions were as follows:in general, the spatial pattern of new urbanization showed a decreasing trend from east to west, continuously expanded to the inland area, and the level of big cities obviously was higher than the small and medium-sized cities; new urbanization level of cities had obvious spatial autocorrelation. Labor, investment, economic development, government capacity, infrastructure and industrial structure all played positive roles in promoting new urbanization. Economic development, labor and infrastructure had a positive and significant spatial spillover effect, the others showed a negative spillover. SDM model revealed that the local explanatory variables and surrounding areas variables affected new urbanization. Based on this, this article put forward some specific policy recommendations for new urbanization in China to provide a theoretical basis.
[本文引用: 1]
DOI:10.11821/dlxb201812005URL [本文引用: 2]
In the unprecedented urbanization process in China, urbanized land has expanded quickly at the same pace or even faster than the growth of the urban population. Employing both the ordinary least square and geographical weighted regression, we analyzed the spatial patterns and factors influencing land urbanization at the county level in 2000 and 2015. This analysis was assisted by land-use data for China acquired from the resource and environment data cloud platform. The research reveals the following points: (1) The annual growth rate of land urbanization experienced 2.77 percentages on average from 2000 to 2015. About 40% of the counties witnessed an annual increase of 3% or above. Land urbanization was manifested in a pattern of diffusion, which differed from the continued spatial polarization of demographic urbanization in China. (2) Geographically, the north-south differentiation of land urbanization was clearer than the east-west differentiation. And the high-value regions tended to be located to the southeast of "Hu Line". Counties surrounding those metropolitan areas were detected as hotspots of land urbanization. In general, there was a convergent trend of land urbanization among regions in China. (3) The factors of population growth, economic development, industrial structure, city/county features, and geographical location have played significant roles in the spatial disparities of land urbanization at the county level. Besides, the spatio-temporal dependence of their influences were also explored. This study on land urbanization and its influencing factors at the county level advances our theoretical and practical understandings of the new-type urbanization, urban and rural integration, and rural revitalization strategies in contemporary China.
[本文引用: 2]
DOI:10.11821/dlxb201810004URL [本文引用: 2]
Urbanization is an inevitable trend of modernization and the fundamental transition in socioeconomic structure, human production and life style. China is undergoing a rapid and unprecedented urbanization process, and has achieved the short-term goals that European and American countries attained in the past decades or even centuries ago. This kind of rapid expansion has inevitably led to a serious imbalance between urban land expansion and urban population growth. We used the demographic-landscape urbanization coupling relationship index (ratio of the annual average growth rate of demographic permanent population and urban development land) to explore the spatio-temporal characteristics of demographic-landscape urbanization coupling situation, and further explain its driving forces during the past decade in China. All analyses, based on the demographic statistics and landscape dataset of 636 cities in China, aimed to identify and diagnose six coupling types. Furthermore, we made the macro pattern of urbanization development level more visible with the help of Kernel Density spatial analysis tool. Results show that: (1) Over the past decade, the average annual growth rate of urban development land in China was 1.65 times that of the urban population, and demographic-landscape urbanization coupling situation was poorly coordinated. (2) We found that there is a spatial dependency between demographic urbanization and landscape urbanization. Moreover, the spatial agglomeration center of high-density urban population showed a gradual westward moving trend. Meanwhile, urbanization development mode shifted from "land lag" to "population lag". (3) Generally, the area of per capita urban development land has exceeded the standard threshold; and 41.96% of the cities currently have a development land area per capita more than five times of the ideal value. (4) The proportion of three coordination types was 73.25%, which is much higher than that of three incoordination types (26.75%). Among them, "Both Growth and Uncoordinated Type" took the largest proportion of 43.27%, which reflects the uncoordinated relationship between demographic urbanization and landscape urbanization. This situation will continue or even is intensified in the years to come. Additionally, the cities located at the edge of urban agglomeration seemed to be more uncoordinated than cities at the center. This is probably because that the cities at the edge of urban agglomeration, which had a small population and low property price, relied more on the "land finance" to earn their main source of urban economic income. (5) Economic development level, population size, governmental decision-making behaviors, geographical location and regional disparity were all driving factors of demographic-landscape urbanization. In addition, there are few obvious differences in the mechanism and effect of these factors. To sum up, urban population and land use management in the new era should get more attention according to the new trend in system diagnosis and comprehensive analysis, thus to provide a scientific basis in development decision for new urbanization and urban-rural integration strategy as well as the rural revitalization strategy.
[本文引用: 2]
DOI:10.13284/j.cnki.rddl.002925URL [本文引用: 1]
Based on the fourth, fifth and sixth population census data of China, econometrics method and the case of Guangxi on county scale, this paper analyzes the spatiotemporal evolution and driving forces of urbanization and migration. The results are as follows: 1) The county urbanization rate of border province has witnessed rapid growth and its gap with country’s average level becomes narrowed, but the rates in most of the counties are still below the national mean. The spatial distribution among counties shows a trend of imbalanced development of urbanization. The distribution of center municipal districts, which have higher urbanization level and play diffusion role, is dispersal. Those areas opening to the outside world earlier, such as the Beibu Gulf region, and the east and southeast of Guangxi adjacent to Guangdong, a developed province, have higher urbanization level than the west and north of Guangxi. 2) The population migration at county level in border province shows a strong trend of spatial autocorrelation, and the degree of spatial autocorrelation agglomeration increased from 2000 to 2010, but the spatial pattern remained stable during the study period. Migration flow and urbanization pattern are basically consistent and their high value regions are both concentrated in the southeastern Guangxi and the Beibu Gulf area. 3) There are three kinds of boundaries which influence the migration in Guangxi, i.e., national boundary, coast line and provincial border. The latter two types of boundaries play a significant role in “attracting” immigration and the development of urbanization and agglomeration along with them, while the national boundary is still having some shield or barrier effects on people movement. 4) From the perspective of immigration destination choosing, as for the spatial pattern of migration, service industries are becoming the main forces absorbing population to move-in. Free trade arrangements, business service, and passages or ports construction along the borders and “One Belt One Road Initiatives” are the main driving forces reshaping border geography in Southwest of China.
[本文引用: 1]
[本文引用: 1]
[本文引用: 1]
URL [本文引用: 2]
[本文引用: 2]
[本文引用: 1]
[本文引用: 1]
[本文引用: 1]
[本文引用: 1]
[本文引用: 1]
[本文引用: 1]
[本文引用: 1]
[本文引用: 1]
[本文引用: 1]
[本文引用: 1]
[本文引用: 2]
[本文引用: 1]
[本文引用: 1]
[本文引用: 1]
[本文引用: 1]
[本文引用: 1]
[本文引用: 1]
[本文引用: 1]
[本文引用: 1]
[本文引用: 1]
[本文引用: 1]
[本文引用: 2]
[本文引用: 1]
[本文引用: 1]
[本文引用: 1]
[D].
[本文引用: 1]
[D].
[本文引用: 1]
[本文引用: 1]
[本文引用: 1]
[本文引用: 1]
[本文引用: 1]
[本文引用: 1]
[本文引用: 1]
[本文引用: 1]
[本文引用: 1]
DOI:10.13249/j.cnki.sgs.2017.12.011URL [本文引用: 1]
Urbanization is closely related to transportation infrastructure development. On the basis of depth analysis of the internal transmission mechanism, using the data of social economy and actual road network in Yunnan Province from 2000 to 2014, by means of ArcGIS spatial analysis, transportation superiority model and coupling coordination model, the coupling coordination degree between county urbanization and transportation superiority in Yunnan Province was measured from time and space dimensions, and the changing situation and the characteristics of spatio-temporal cooperative evolution were analyzed. The results show that: 1) There are both positive and negative feedback relationship between urbanization and transportation infrastructure, both of them promote each other, but also restrict each other; The lag of infrastructure construction, the dualistic structure system of urban and rural areas and the sprawl of urban space are the main factors that lead to the spatial difference of coupling and coordination. 2) The overall level of urbanization in Yunnan Province is generally low from 2000 to 2014, although the region has been improved to varying degrees, about 90% counties are in the initial stage of urbanization. County urbanization pattern is basically stable, and the high value of urbanization is still dotted in some counties in Kunming, Dali, Xishuangbanna, Dehong, Red River and other cities, and the rest of the counties are at a lower level of urbanization. 3) The overall level of transportation superiority in Yunnan Province is increasing year by year, and the spatial heterogeneity is significant. From the “Yunling mountains-Yuanjiang Valley” as the boundary, transportation superiority of Eastern Yunnan Plateau is significantly higher than that of the Hengduan Mountains in western area, and the most obvious characteristic of gradient is in the Yuanjiang valley; The transportation superiority in Central Yunnan Province is generally higher than that in the periphery region, and both the high and the low value areas show strong spatial agglomeration. 4) During the study period, although the level of coupling coordination between county urbanization and transportation superiority in Yunnan Province has been greatly improved, the overall coordination degree is low, and the spatial differentiation phenomenon is still prominent. The coordination degree of the middle and eastern counties in Yunnan is higher than that in the northwest plateau, and the spatial coupling coordination degree shows a decreasing gradient trend from east to west; Among them, The high values of the coupling coordination degree are mainly distributed in the central Yunnan Urban Agglomeration and the sporadic counties (cities and districts) in the northeast of Yunnan Province, and the coupling coordination degree of the low value areas are concentrated in the northwest of Yunnan plateau mountain and Diqing Tibetan etc; The spatial distribution characteristics of the middle and high value counties (cities, districts) in the coupling coordination degree are basically identical with the layout of the highway skeleton network in Yunnan Province.
[本文引用: 1]
[本文引用: 1]
[本文引用: 1]
DOI:10.1080/13658810802443457URL [本文引用: 1]
[本文引用: 1]
[本文引用: 1]
[本文引用: 1]
[本文引用: 1]
[本文引用: 1]
[本文引用: 1]
