 ,11.
,11. 2.
Modelling the sustainability of China's growth based on the resource and environmental carrying capacity
NIU Fangqu1,2, SUN Dongqi,11. 2.
通讯作者:
收稿日期:2019-05-29修回日期:2019-11-26网络出版日期:2019-12-25
| 基金资助: |
Received:2019-05-29Revised:2019-11-26Online:2019-12-25
| Fund supported: |
作者简介 About authors
牛方曲(1979-),安徽淮南人,博士,副研究员,硕士生导师,主要从事区域与城市发展模拟分析研究,旁及交通地理、“一带一路”研究E-mail:niufq@lreis.ac.cn。

摘要
关键词:
Abstract
Keywords:
PDF (1476KB)元数据多维度评价相关文章导出EndNote|Ris|Bibtex收藏本文
本文引用格式
牛方曲, 孙东琪. 资源环境承载力与中国经济发展可持续性模拟. 地理学报[J], 2019, 74(12): 2604-2613 doi:10.11821/dlxb201912013
NIU Fangqu.
1 引言
中国自1978年改革开放以来,造就了近40年高速经济增长的奇迹,但同时也出现一系列严重的不平衡和不和谐的问题,突出表现为资源的过度消耗与环境污染的加剧。为缓解矛盾,中国面临调整发展速度的选择。但是中国在经历了如此长时间的高速发展,依然未能进入高收入行列,属于中等收入国家[1],为避免进入中等收入陷阱,需要继续保持一定发展速度。中国中长期发展目标是2050年建成现代化强国。现代化的重要标志是完成城市化和工业化,拥有发达的第三产业[2]。为缓解人—地关系并实现既定发展目标,中国转型发展势在必行。为此中央提出“稳增长、调结构”,并力促创新发展。对此政府和学术界需面临的问题是:中国适宜增长速度是多少、该如何转型发展?影响乃至决定国民经济增长的支撑因素包括资源供给、水土资源保障、环境和生态系统承载力等,以及建立在这些要素之上的产业增长潜力、发展模式[3]。各要素的供给是有限的,需考虑支撑因素的供给能力,避免透支这些要素。
关于发展与资源环境的研究在地理学发展长河中具有悠久历史。早期用因果关系来解释不同发展阶段国家的地理环境及其关系,形成了地理环境决定论与或然论。直到现代,才以相互作用论来解析发展与环境之间的关系。1972年来自世界各地的几十位科学家、经济学家、教育家聚集于罗马,共同编写出版了“增长的极限—罗马俱乐部关于人类困境的报告”一书,深刻地阐述了地球上人口增长、粮食生产、工业发展、资源消耗、环境污染等将使地球的支撑能力达到极限的原理,提醒人们要调整发展方式和生活方式来达到人与环境之间的协调[3]。1992年、2014年又出版了第二版和第三版,更加详细、系统地分析论证了人类发展已经大大超过地球生态系统的承载能力,即“过冲”现象的出现。2012年2月国际“未来地球过渡小组”研究出了一份框架文件:“未来地球:全球可持续发展研究”,强调人类活动可能对地球系统造成急剧的、不可逆转的变化,倡议开展资源环境和可持续发展的综合研究,为政府提供政策建议[4,5]。就具体研究方法上,****们也开展了大量探索,较为熟知的有人口论[6]、生态足迹[7,8,9]、能值[10,11]、NPP[12,13]等,为研究人地关系、实施可持续发展提供了有效途径。
中国地理学界对此响应集中体现在“人—地关系”及其对发展的影响方面。关于区域发展研究兴起于20世纪70年代中后期,80-90年代地理****开始了较为广泛的区域发展的理论和方法研究,但这些研究涉及到自然和人文的跨学科研究很少,基本上都是经济地理****承担完成的。中国政府于1994年发布了“中国21世纪议程”,由此在全国范围内出现了关于可持续发展的研究热潮。大量的研究聚焦到可持续发展的基本原理和中国的区域性可持续发展战略研究及规划。进入21世纪后,****广泛地研究了环境与发展各要素之间相互作用机制,突出表现为“资源环境承载力评价”研究[14,15,16,17,18,19,20,21,22],为实现可持续发展起到了有效的辅助决策作用。该领域有丰富的文献,封志明等****对近百年来的资源环境承载力研究进行了回顾[23]。但目前,对于结合实际的发展与环境研究和可持续发展研究仍然薄弱。在长时期内,中国****对于发展与环境的关系特别是如何评估高速增长的代价、如何确定中国不同时期合理的经济增长速度方面的关注较少。实践中诸多问题的出现说明前瞻性不足,在经济增长的模式和速度方面研究有待深化。
本文着眼于经济增长与资源环境要素相互作用关系,分析中国目前发展方式存在的问题,在此基础上模拟支撑要素对不同经济发展速度、模式的支撑能力,探寻适宜的发展速度和发展模式,为制定中国转型发展策略提供参考和依据。本研究有助于推动国内可持续发展研究,也是对“未来地球”框架文件倡议的重要响应。
2 中国经济增长问题简析
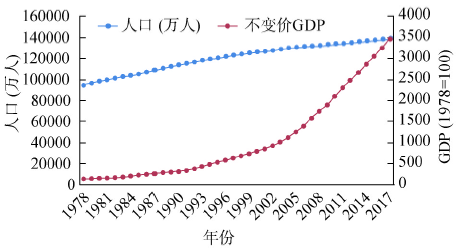
根据《中国统计年鉴(2018)》,1978年改革开放以来中国人口(不含港澳台地区)和GDP不断增长(图1),GDP增速明显高于人口,表明中国人均GDP不断提高。中国2017年经济增速为6.9%,人均GDP为8881美元,仍属中等收入水平[1]。人口方面,1978-2017年基本呈线性增长。2015年以前人口年均增长0.126亿人,而2015年放开二胎①(①中国1978年开始实行计划生育政策,要求一对夫妇生育一个孩子;2015年开始实行“二胎政策”,即一对夫妇可生育两个孩子。)之后年均增长0.075亿,增速有所下降。美国2010-2017年GDP年均增速2.1%,人口年均增长0.023亿,2017年人均GDP为59531美元。按照目前的经济和人口增长速度,2023年人均GDP将达到12838万美元,进入高收入行列,并于2048年超过美国2017年收入水平。图1
 新窗口打开|下载原图ZIP|生成PPT
图11978-2017年中国经济与人口发展状况
Fig. 1Economic and population growth in China from 1978 to 2017
参考美国、英国、日本等发达国家城市化及产业发展[24,25]状况可知,实现现代化需达到75%以上的城市化率(人口城市化),同时完成工业化并实现三产业占比达到60%以上。中国城市化率由1978年17.92%增长到2017年的58.52%,年均增长1.03个百分点;第三产业占比由1978年的24.6%升至2017年的51.6%,年均增长0.69个百分点。按照此速度,中国将于2030年实现60%的三产占比,2033年完成75%的人口城市化率。
水资源利用方面,2017年中国水资源总量为28761.2亿m3,用水总量6043.4亿m3 (21%),人均用水量435.91 m3。有关研究显示,区域用水总量超过其水资源总量的20%即为缺水,用水量超过40%为较严重缺水,而超过70%以上即为严重缺水[26,27]。按照目前的经济增速和用水强度,中国将在2028年进入较严重缺水状态。
水环境质量方面,化学需氧量(Chemical Oxygen Demand, COD)是水环境质量的重要衡量指标。根据地表水环境质量标准(Ⅰ类、Ⅱ类水COD容量≤ 15 mg/L)可计算得出中国水资源COD总容量为4314.18万t。2017年全国COD排放量为1021.97万t,剩余容量为3292.21万t。按照目前COD排放强度,随着经济发展,水环境容量将于2039年超载。
土地资源利用方面,2020年全国建设用地总规模控制为4071.93万hm2[28]。2017年全国建设用地为3957.41万hm2,剩余114.52万hm2。近5年建设用地年均增长52.94万hm2,按照该速度建设用地将于2021年用完,据此规划建设用地量可以满足2020年用地要求。
能源消耗方面,中国2017年能耗总量为435818.63万t标准煤。能源消费来自进口和本地开采两部分,以常用的煤炭、石油、天然气为例,三者总探明储量为18729894.81万t标准煤,2017年三者总消费为386176万t标准煤,其中来自国内开采量为297990万t标准煤。2007-2017年中国能源生产弹性系数(即能源生产量年均增速与国民经济年均增速的比值)为0.45,6.9%的经济增速对应能源消耗增速为3.11%,据此,2052年上述常用能源将枯竭。
根据上述分析,中国按照目前的增长模式,虽然可在2050年前进入高收入行列,实现现代化,但将面临严重的资源消耗和环境污染,表明资源环境支撑系统不足以支撑目前粗放的增长方式,探寻适宜发展速度与模式不容回避。
3 研究方法
3.1 模型及数据
系统动力学模型(System Dynamics, SD)适合于模拟真实世界非线性变化过程[29,30]。而人—地关系(或社会经济—环境)系统正是一个包含多要素相互作用的复杂动力系统。SD模型在资源环境承载力评价中也得到广泛应用[30,31,32]。鉴于研究问题的特点,本文构建SD模型,称作中国模型(China Model, CM),模拟中国社会经济与资源环境要素的相互作用过程,探索适宜的发展速度和发展模式。模型以2017年为基年,逐年预测未来情况直至2050年。开发平台采用VensimDSS。统计数据来自于《中国统计年鉴(2018)》《中国环境统计年鉴(2018)》《中国城市建设统计年鉴(2018)》。3.2 CM模型的建构
CM模型包括人口模块、经济模块、水资源利用模块、环境模块、能源模块、土地利用模块,各模块相互联系。(1)人口模块。人口模块根据历史变迁规律预测人口变化趋势、城市人口增长、城市化过程。在中国,人口的变迁除了受出生率、死亡率、移民等多种因素影响外,还会受计划生育政策和生育意愿影响。根据前文分析,在2015放开二胎之后中国人口增速反而下降,表明目前中国人的生育意愿并不强烈、生育观念已经发生变化。因此,可以预见中国人口增长将进入拐点。本文采用世界银行对中国人口总量的预测结果[25]。根据世界银行的预测,中国人口将于2028年达到峰值14.17亿,然后下降,2050年为13.36亿。2017年中国城市化率为58.52%,若到2050年完成75%的城市化率,年均需要增长0.50个百分点。
(2)经济模块。经济模块用于模拟经济增长、产业结构变迁过程。2017年中国GDP总量为12.3万亿美元。将各年份GDP预测值与上述人口预测值相结合可计算出人均GDP。产业结构方面,近几十年来中国的第一产业占比稳定,平均值为7.9%,CM模型依然设定第一产业占比稳定在该值;2017年三产占比51.6%,若在2050年完成产业升级、实现60%的三产占比,则三产占比年均需增长0.25个百分点;根据一产和三产占比可以求得二产占比。CM模型中,经济增速和产业结构是调整参数,即待确定的参数。
(3)水资源利用模块。水资源利用模块用于模拟用水总量的变化,包括生产用水和生活用水。中国水资源总量为28761.2亿m3,其中一产、二产、生活用水(包括三产)分别为3766.4亿m3、1277亿m3、838亿m3。而一产、二产GDP分别为65467.6亿元、334622.6亿元,人口为13.9亿。由此可得出生产和生活用水强度:一产用水强度0.385亿m3/亿美元、二产用水强度0.026亿m3/亿美元,生活用水强度0.0060亿m3/万人。另外,生态用水占用水总量的2.8%,CM模型采用该生态用水比例。未来各年份的总用水量是一产用水、二产用水、生活用水、生态用水之和,如公式(1)所示:
式中:w为总用水量;rpri、rter分别为一产和三产的占比;pop为人口数量;weco为生态用水量。
(4)环境模块。本模块用于模拟水环境质量的变化过程。水环境质量受很多因素影响,本文采用常用的COD含量表征水环境质量随经济发展的变化过程。根据经济和污染排放数据可以得出生产和生活污染排放强度:第一产业排放强度为0.0455万t/亿美元,第二产业排放强度为0.0026万t/亿美元,生活排放强度为0.0053万t/万人。据此可以求出COD排放总量,如公式(2)所示:
式中:ttlCOD为生产和生活COD排放总量;rpri、rsec分别为一产和二产的占比;pop为人口总量。为保持水环境质量,COD排放总量ttlCOD不能超过水环境总容量的上限。
(5)能源模块。能源模块用于模拟能源消耗变化过程,能源消费包括生产和生活两个方面。根据各产业能源消耗、生活能源消耗、GDP、人口可计算得出各类能耗强度:一产能耗强度为0.871万t/亿美元、二产能耗强度6.767万t/亿美元、三产能耗强度1.31万t/亿美元、居民能耗强度0.39万t/万人。据此,随着人口和经济的增长,可计算出各年份的能源消耗总量,如公式(3)所示:
式中:E为能耗总量;GDPp、GDPS、GDPt分别为一、二、三产GDP;pop为人口数量。
社会经济发展受可用能源总量的限制。可用能源来自本地或进口两个方面。以常用能源煤炭、石油、天然气计算,2017年消耗本地能源总量为297990万t标准煤,占总能耗的66.4%。而2017年三者探明储量总和为18729894.81万t标准煤。每年三类常用能源的剩余量为总储量减去消耗总量。如公式(4)所示:
式中:Ea为剩余能源总量;Ethree_ttl为三类常用能源总量;Ei为第i年份能源消费量。根据公式(3)和(4)可以计算出剩余储量能够支撑的经济和人口总量。
(6)土地利用模块。本模块用于模拟建设用地变化增长过程。2017年城市建设用地面积为55155.47 km2,包括居住用地、工业用地、三产用地。结合产业GDP和人口可计算得出各类建设用地强度:工业用地强度为0.2652 km2/亿美元、第三产业用地强度为0.0864 km2/亿美元、居住用地强度0.2087 km2/万人,据此可计算出产业发展和人口增长所需的用地增量,如公式(5)所示。
式中:
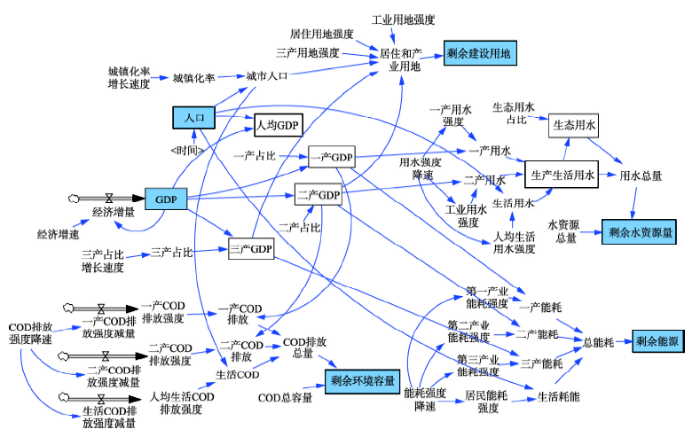
(7)模块的集成—CM的建构。将上述各个模块集成,建立系统动力学模型(图2)。各大模块的核心要素采用深色标注。该模型输入参数包括人口、GDP、产业结构、各产业和人口的资源消耗强度、污染排放强度、人口和GDP增速,以及其他的调控参数。输出是未来各个年份的剩余建设用地、剩余水资源量、剩余环境容量、剩余能源储量等预测变量。GDP、人口、产业结构的变化将导致模拟结果发生变化,同样地,资源消耗强度与污染排放强度的调整也会导致模拟结果发生变化。利用CM模型,根据要达到的发展目标,可求解适宜发展速度和发展模式。
图2
 新窗口打开|下载原图ZIP|生成PPT
图2系统动力学模型:中国模型
Fig. 2System dynamics: China Model
4 情景设置与结果分析
为实现2050年进入发达国家行列这一目标,本文设定了不同的发展情景,探索适宜发展速度和模式。本文设定发达国家标准:资源环境支撑系统良好、高收入、现代化。根据前文讨论,本文设定现代化标准为:75%以上的城市化率和60%以上三产占比。情景1,本情景用于求解在现有的技术水平下,可采取的最大发展速度。换而言之,若保持目前的资源消耗强度及污染排放强度,为于2050年进入发达国家行列,维持资源环境不超载,可采取的最大发展速度和发展模式是多少?为于2050年实现现代化,完成城市化率75%,并实现产业转型,三产占比达到60%,城市化率和三产占比年均增长分别为0.50个百分点、0.25个百分点。较之目前的态势,城市化速度和产业转型速度均有所下降。CM模拟结果显示,为保持2050年前不超载,最大能支撑的经济增长速度是3.8%。在该速度下,2027年人均GDP达12650美元,进入高收入国家行列。因此,采用3.8%的经济增速,中国可实现2050发展目标,进入发达国家行列,并且维持良好的资源环境支撑系统。
情景2,该情景参考美国的技术发展水平解析最乐观的发展速度。本情景是在情景1的基础上增加了技术进步的影响。技术的进步可提高资源利用效率、改善污染排放。可获取的数据显示美国近年资源消耗与污染排放较为平稳,2015水耗强度为0.029亿m3/亿美元[33,34],是中国目前水耗强度的60%,若中国2050达到该水平,则需年均下降1.22个百分点;美国2017能耗1.647万t标准煤/亿美元GDP[35],是中国能耗强度的45%,若中国2050年达到该值,需年均下降1.67个百分点;由于污染排放与能源消费有着直接的联系,本文设定污染排放与能耗同等的改善速度。在此基础上,CM模拟结果显示,最高可采取6.3%的发展速度。在该速度下中国可于2023年实现现代化、进入高收入行列。因此,若2050年中国的技术水平会达到美国目前水平的情况下,采取6.3%的速度发展,可确保中国于2050年前进入成为发达国家。
情景3,该情景用于解析最优发展速度,是在情景1的基础上加以合理的技术进步,模拟求解最大发展速度。对于该情景而言,度量技术进步速度是关键环节。国家信息中心评价结果显示,2000年后中国技术进步速度年均增长0.42%[36]。基于该研究,本文设定未来中国资源消耗强度、污染排放强度按照此速度不断改善,CM模拟结果显示,最大可采取4.4%的增长速度。该速度下,中国将于2025年进入高收入行列。因此,该速度可确保2050年前进入发达国家行列。
上述各发展情景对应的参数如表1所示。综合以上模拟结果,为于2050年实现现代化,城市化率和三产发展最低年均增长分别为0.50个百分点、0.25个百分点;发展速度方面,维持现有的技术条件,中国可以采取的最大发展速度为3.8%;在乐观的相信技术不断进步并于2050年达到美国目前水平,中国可以采取的最大增长速度为6.3%;参考中国2000年以来的技术进步速度,4.4%的增长速度较为适宜。据此,中国适宜发展速度区间为3.8%~6.3%。基于该模拟结果,3.8%~4.4%是较为安全的发展速度,而4.4%~6.3%的发展速度则面临更大的调整,要求足够的技术水平的提升。如果对技术进步足够乐观,可以考虑提升速度,否则需放缓发展速度,以降低对资源环境冲击。
Tab. 1
表1
表1各情景参数
Tab. 1
| 参数类型 | 参数 | 当前态势 | 情景1 | 情景2 | 情景3 | ||
|---|---|---|---|---|---|---|---|
| 人口、 城市化 | 人口增长 | 750万/年 | 世界银行 预测值 | 世界银行 预测值 | 世界银行 预测值 | ||
| 城市化速度(百分点/年) | 1.03 | 0.5 | 0.50 | 0.50 | |||
| 产业经济 | 三产发展占比增长(百分点/年) | 0.69 | 0.25 | 0.25 | 0.25 | ||
| 经济增长速度(%) | 6.9 | 3.8 | 6.3 | 4.4 | |||
| 水资源 | 一产用水强度(亿m3/亿美元) | 0.385 | 0.385 | 下降1.22百分点/年 | 年均改善0.42% | ||
| 二产用水强度(亿m3/亿美元) | 0.026 | 0.026 | 下降1.22百分点/年 | 年均改善0.42% | |||
| 生活用水强度(亿m3/万人) | 0.0060 | 0.0060 | 下降1.22百分点/年 | 年均改善0.42% | |||
| 水环境 | 一产COD排放强度(万t/亿美元) | 0.0455 | 0.0455 | 下降1.67百分点/年 | 年均改善0.42% | ||
| 二产COD排放强度(万t/亿美元) | 0.0026 | 0.0026 | 下降1.67百分点/年 | 年均改善0.42% | |||
| 生活COD排放强度(万t/万人) | 0.0053 | 0.0053 | 下降1.67百分点/年 | 年均改善0.42% | |||
| 能源 | 一产能耗强度(万t标准煤/亿美元) | 0.8710 | 0.871 | 下降1.67百分点/年 | 年均改善0.42% | ||
| 二产能耗强度(万t标准煤/亿美元) | 6.7670 | 6.767 | 下降1.67百分点/年 | 年均改善0.42% | |||
| 三产能耗强度(万t标准煤/亿美元) | 1.3100 | 1.3100 | 下降1.67百分点/年 | 年均改善0.42% | |||
| 生活能耗强度(万t标准煤/万人) | 0.3900 | 0.3900 | 下降1.67百分点/年 | 年均改善0.42% | |||
| 土地资源 | 工业用地强度(km2/亿美元) | 0.2652 | 0.2652 | 0.2652 | 0.2652 | ||
| 三产用地强度(km2/亿美元) | 0.0864 | 0.0864 | 0.0864 | 0.0864 | |||
| 居住用地强度(km2/万人) | 0.2087 | 0.2087 | 0.2087 | 0.2087 | |||
新窗口打开|下载CSV
5 讨论
诸多资源要素是可以通过市场流动实现跨区占用,因此资源的利用可以来自本地也可以进口。关注当地资源消耗,本文评价了社会经济系统对本地资源的消耗强度。未来社会经济系统的改变可能会增加进口的比例,降低对本地资源的利用强度。因此,为提升模拟结果的准确性与可靠性,需要进一步考虑社会经济系统对外部资源依赖的变化趋势。除此以外,技术的进步可使人类有能力提升资源利用效率、减少污染排放,甚至开发出新的替代资源。但技术进步速度难以量化和预测,而且技术进步也可能产生新的污染,成为一把双刃剑。这都增添了模拟结果的不确定性。为确保社会经济发展的可持续性,模拟过程中可以考虑给予技术进步较小的权重,毕竟较慢的发展速度和资源的盈余比过冲发展更具可持续性。本研究宏观上模拟了全国尺度上三大类产业发展及人口增长与资源环境支撑系统的作用关系,而不同产业部门资源环境效应存在差异,尤其是包含诸多部门的工业。为了辅助更为精细的产业决策,需在细分产业的基础上开展更为微观的模拟分析。同时,人口和产业分布受区位条件的影响,通常不会均匀分布于国土空间上,即便在全国层面,社会经济总体量处于可承受范围内,而在经济密度较高的区域可能已经出现超载情况。为实现对子区域可持续发展的决策支撑,需在更细尺度开展应用研究。
时间序列方面,本文结合中国的发展战略目标,模拟分析了2050年前实现现代化并进入高收入国家行列的发展情景,探寻相对优选速度和发展模式,未关注更长时间的发展,模拟结果并不能说明某种发展速度可以在2050年后一直持续下去。至于更长远的发展,有理由相信随着科学技术的发展,资源环境的支撑能力会有进一步提升。就本模型的作用而言,可用于检验不同发展情景,为决策提供参考,而非代替决策。
6 结论
中国经济的长期高速增长致使资源过度消耗、生态环境逐渐恶化。同时,为实现现代化、跻身高收入发达国家行列,中国又需要保持一定的发展速度。直面持续发展和改善环境两个方面的诉求,中国致力于稳增长、调结构,并力促创新发展。为此,****和政府面临的问题是,采取何种发展速度和发展模式较为适宜?本文构建了系统动力学模型,称作CM模型,模拟经济发展、城市化、产业结构与资源环境支撑系统的相互作用关系,解析适宜发展速度和发展模式。结果显示,为实现2050年进入发达国家行列并保持良好生态环境的发展目标,在考虑技术进步会改善资源利用效率和污染排放的前提下,采取3.8%~6.3%的发展速度较为适宜。在该发展区间内,为降低资源环境的压力,可适当降低增长速度,反之,如果对技术进步足够乐观,可以考虑提升发展速度。3.8%~4.4%是较为安全的发展速度,而4.4%~6.3%的发展速度则要求较高的技术进步。通过CM模型,可以对比分析不同发展情景,选择更优发展模式,辅助决策。本研究就适宜发展速度和模式方面,发展了资源环境承载力理论体系,具有重要的理论探索意义和应用价值。
本模型也有待深化和完善。目前依据中国的发展目标设置了基础情景,而实际社会经济的发展影响因素很多。未来可在细分产业的基础上纳入更多的社会经济和资源环境要素,开展更细尺度的应用研究,将模型拓展应用于产业结构调整、产业空间优化、资源环境管理与利用。模型准确性也依赖于经济学、人口学领域方法的改进。
参考文献 原文顺序
文献年度倒序
文中引用次数倒序
被引期刊影响因子
https://blogs.worldbank.org/opendata/new-country-classifications-income-level-2017-2018,
URL [本文引用: 2]
DOI:10.1080/09638288.2019.1699173URLPMID:31846594 [本文引用: 1]

Purpose: To analyse trends in quality of life (QoL) development among older stroke patients within the first year after rehabilitation discharge, and to investigate the impact of including proxy interviews in research and practice.Methods: A prospective cohort study with follow-up at 3, 6, and 12?months with 411 patients and proxy respondents was conducted. The EUROHIS-QOL 8-item index was used to assess QoL. By performing descriptive analyses, QoL development over time was compared among subgroups. Linear mixed models were calculated to estimate mean changes from baseline to 12-month follow-up. The effects of patient characteristics and time on QoL were investigated using comprehensive mixed models.Results: One year after rehabilitation discharge, the majority of patients had neither maintained nor regained their initial QoL. Proxy respondents reported significantly lower QoL (22.6-29.5 points, p?<?0.001). Characteristics associated with lower QoL were stroke severity, depression, and pain. Having a small social network was negatively associated with QoL (-1.66 points, 95%CI: -2.84/-0.48, p?=?0.006).Conclusions: Quality of life scores reported at the time of rehabilitation discharge are often not lasting. Including severely impaired patients via proxies reduces the risk of overestimating QoL outcomes. Outpatient's characteristics should be taken into account when planning therapy strategies to maintain previously achieved health goals. Regular re-assessments are required.Implications for rehabilitationThere should be an awareness that improvements in quality of life (QoL) achieved during rehabilitation are not sustainable.Regularly re-assessing pain status, psychological burden, and social network size could help clinicians to determine treatment strategies for maintaining and improving rehabilitation achievements.Conducting proxy interviews is required to assess disease burden of patients with severe stroke (e.g., non-linguistic patients).
[本文引用: 2]
URL [本文引用: 1]
DOI:10.11821/dlxb201408001URL [本文引用: 1]
In this paper, the important contents and purpose of the "Future Earth" are introduced briefly, and the background of this file is analyzed. It is extraordinary of the framework document to place emphasis on the integration between natural science and social science. The paper states that Mr. Tsien Hsueshen and Mr. Huang Bingwei have similar viewpoints 20 years ago, which is striking and prospective. According to the serious situation of China's environmental change and development of Chinese geographical science in recent years, the opportunities, direction and tasks of science are emphasized and discussed to achieve the transitional development of geographical research.
[本文引用: 1]
DOI:10.1016/j.envint.2019.105279URLPMID:31671313 [本文引用: 1]
On 11 May 2019, the Mauna Loa, Hawaii, Earth System Research Laboratory reported the highest CO2 concentration in human meteorological history. Continuing CO2 rise will devastate ecosystems, and ice dependent species like polar bears ultimately will disappear. Commercial aviation is presently a relatively small CO2 contributor, but this CO2 intensive mode of transportation is projected to increase greatly. Scientists and conservationists are often among the most frequent of flyers, despite their recognition that emissions must be reduced. Here we illustrate the carbon footprint of air travel in terms of its impact on the sea ice habitat necessary for polar bear persistence, and suggest our colleagues reduce their air travel where-ever possible. Each metric ton of CO2 emitted melts ~3?m2 of arctic summer sea ice, and current air travel melts over 5000?m2 each year. Each scientist making the short flight from Copenhagen to Oslo to join an IUCN polar bear meeting will melt ~1?m2 of Arctic summer sea-ice. Annually hundreds of scientists and conservationists make frequent flights of much greater distances for AMAP, CAFF, IUCN, and other conservation related meetings. Much of this travel could be avoided with better planning and employing internet linkages for remote participation. When air travel, such as for necessary fieldwork, cannot be easily substituted by Web linkage, we all should search for routes and carriers allowing the lowest CO2 emissions. We encourage all of our colleagues to join 'No Fly Climate Sci' to show their commitment to CO2 reduction and learn more about doing so. As scientists, if we are serious about preserving polar bears and their Arctic sea ice habitat, we need to walk the talk and show an example for the rest of society by significantly reducing our air travel.
DOI:10.1177/095624789200400212URL [本文引用: 1]
DOI:10.1016/j.ecolind.2011.03.008URL [本文引用: 1]
The earth provides myriad ecosystem services or 'benefits' that enable and enhance human existence. Humanity, in turn, imposes myriad environmental impacts or 'costs' on the earth. We explore the idea of mapping these 'costs' and 'benefits' using proxy measures. We set the total value of the world's ecosystem services to be equal to the total cost of anthropogenic environmental impacts at fifty trillion dollars (roughly the global GDP in the year 2000). A global representation of ecosystem service value is mapped at 1 km(2) resolution using Net Primary Productivity (NPP) as a proxy measure of ecosystem service value ('benefit'). A similar global representation of environmental impact is mapped using pavement (i.e., anthropogenically created impervious surface area or ISA) as a proxy measure of 'cost'. Subtracting the 50 trillion mapped onto ISA from the 50 trillion mapped onto NPP produces a 1 km(2) resolution map of those areas where: (1) human imposed costs exceed naturally supplied benefits, resulting in an ecological deficit, (2) human costs balance with environmental benefits and (3) environmental benefits exceed human costs, resulting in an ecological surplus. Mapping this ecological balance produces a spatially explicit and monetized representation of ecological sustainability that can be aggregated to national, sub-national, and regional levels. Aggregations of this map at the national level are compared with other national measures of biophysical sustainability such as the Global Footprint Network's 'Eco-Deficit'. An additional benefit of this approach is that the national values derived from this difference map suggest a starting point for discussions of the dollar values and costs of both under and over consumption of ecosystem services on the part of the nations of the world. Published by Elsevier Ltd.
DOI:10.1126/science.242.4882.1132URLPMID:17799729 [本文引用: 1]
Ecosystems and other self-organizing systems develop system designs and mathematics that reinforce energy use, characteristically with alternate pulsing of production and consumption, increasingly recognized as the new paradigm. Insights from the energetics of ecological food chains suggest the need to redefine work, distinguishing kinds of energy with a new quantity, the transformity (energy of one type required per unit of another). Transformities may be used as an energy-scaling factor for the hierarchies of the universe including information. Solar transformities in the biosphere, expressed as solar emjoules per joule, range from one for solar insolation to trillions for categories of shared information. Resource contributions multiplied by their transformities provide a scientifically based value system for human service, environmental mitigation, foreign trade equity, public policy alternatives, and economic vitality.
DOI:10.1016/j.ecolind.2015.03.017URL [本文引用: 1]
DOI:10.1111/j.1728-4457.2011.00450.xURLPMID:22319767 [本文引用: 1]
The human species has evolved to dominate the biosphere: global anthropomass is now an order of magnitude greater than the mass of all wild terrestrial mammals. As a result, our dependence on harvesting the products of photosynthesis for food, animal feed, raw materials, and energy has grown to make substantial global impacts. During the past two millennia these harvests, and changes of land use due to deforestation and conversions of grasslands and wetlands, have reduced the stock of global terrestrial plant mass by as much as 45 percent, with the twentieth-century reduction amounting to more than 15 percent. Current annual harvests of phytomass have been a significant share of the global net primary productivity (NPP, the total amount of new plant tissues created by photosynthesis). Some studies put the human appropriation of NPP (the ratio of these two variables) as high as 40 percent but the measure itself is problematic. Future population growth and improved quality of life will result in additional claims on the biosphere, but options to accommodate these demands exist without severely compromising the irreplaceable biospheric services.
DOI:10.1672/07-190.1URL [本文引用: 1]
Over 6,110 ha of the commercial production salt ponds surrounding South San Francisco Bay, CA, have been decommissioned and reconnected to the bay, most as part of the largest wetlands restoration program in the western United States. These open water ponds are critical habitat for millions of birds annually and restoration program managers must determine the appropriate balance between retention of ponds versus re-conversion to tidal salt marsh, knowing that both are essential ecosystems for endangered bird species. Our study describes the ecological value of the new open water pond ecosystems as feeding habitats for birds. We used the oxygen rate of change method to determine ecosystem metabolic parameters from high resolution time-series of dissolved oxygen concentration. Areal gross primary production (8.17 g O2 m−2 d−1) was roughly double the world’s most productive estuaries. High rates of phytoplankton photosynthesis were balanced by equally high rates of community respiration (8.25 g O2 m−2 d−1). Metabolic equilibrium was delicately poised: sharp irradiance and temperature shifts triggered short term photosynthesis reduction resulting in oxygen depletion. We converted net primary production (NPP) into potential carrying capacity of the forage biota that support targeted pond waterbirds. NPP was processed through both a pelagic food web, resulting in forage biota for piscivorous birds and a benthic food web, resulting in forage biota for shorebirds and diving benthivores. Both food webs included efficient algal-based and inefficient detrital trophic pathways. The result of all primary production being routed through simple food webs was high potential forage production and energy supply to waterbirds, equivalent to 11–163 million planktivorous fish or 19–78 billion small estuarine clams within the 330-ha pond between May and October. Food quantity does not necessarily equal quality and these systems have the potential to produce toxic or inedible algae. Our study provides the first measurement of primary production in the open water ponds of San Francisco Bay and presents a novel approach for transforming primary production into forage production as a metric of an ecosystem’s energetic carrying capacity.
DOI:10.2166/wst.2019.372URLPMID:31850876 [本文引用: 1]
A CuO/ZnO photocatalyst nanocomposite was successfully prepared by co-precipitation and characterized by investigating its chemical and physical properties by X-ray diffraction, scanning electron microscopy, energy dispersive spectroscopy, UV-vis diffuse reflectance spectroscopy and photoluminescence spectroscopy. The average particle size of CuO/ZnO composite was found to be around 80 nm. The degradation of chlortetracycline hydrochloride pollutants in marine aquaculture wastewater using ZnO and CuO/ZnO was compared and it was found that CuO/ZnO nanocomposite is more efficient than ZnO. The effects of external factors on the photocatalytic effectiveness of nanocomposite were investigated under visible light. Also, the photocatalytic conditions for the degradation of chlortetracycline hydrochloride by the nanocomposite were optimized. Based on both ability and efficiency of degradation, and on the cost and availability, 10:2 molar ratio of Zn2+/Cu2+ and 0.7 g/L nanocomposite, was found to be optimal, in which case the average photocatalytic degradation rate of chlortetracycline hydrochloride reached 91.10%.
DOI:10.1016/j.sjbs.2017.09.010URLPMID:29472771 [本文引用: 1]
Fog computing is a distributed computing paradigm at the edge of the network and requires cooperation of users and sharing of resources. When users in fog computing open their resources, their devices are easily intercepted and attacked because they are accessed through wireless network and present an extensive geographical distribution. In this study, a credible third party was introduced to supervise the behavior of users and protect the security of user cooperation. A fog computing security mechanism based on human nervous system is proposed, and the strategy for a stable system evolution is calculated. The MATLAB simulation results show that the proposed mechanism can reduce the number of attack behaviors effectively and stimulate users to cooperate in application tasks positively.
[本文引用: 1]
[本文引用: 1]
[本文引用: 1]
[本文引用: 1]
URL [本文引用: 1]
It is an innovative work of comprehensive deepening reforms of China to establish the mechanism of monitoring and early-warning of carrying capacity. Based on the scientific connotation of the carrying capacity of national resources and environment and oriented to regional sustainable development, this article explores the"pressure-state-response" process of the interaction between the carrying body: the natural foundation (which consists of resources, environment, ecology and disasters) with the carrying object: the human production and life activities, and presents the academic thought that the early-warning of the national resources and environment carrying capacity is an overload early-warning according to the cap of the constraints of resources and environment or the population and economic rational scales or other key thresholds, and also presents a process early-warning in terms of the changes of the natural basic conditions or the tendencies of the impact of resource utilization and environmental changes. According to the exploration on the principles of early-warning carrying capacity, this article constructs the differential indicator system and the overall technical process of early-warning of marine and terrestrial resources and environment carrying capacity. Land resources stress index, water resources use intensity index, environmental stress strength index and vegetation coverage change range index are chosen as basic indicators to conduct an overall regional evaluation, and different specific indicators, such as the pollution level of dust-haze, the increase and decrease of arable land, equilibrium index of grass and livestock and the variation of eco-environmental quality, are chosen to conduct the specific evaluation respectively for the urbanized areas, major grain producing areas, pastoral and semi-pastoral areas and ecological function areas, and then the key thresholds of these indicators are determined to conduct classifying evaluation. Finally, this article integrates all the evaluations and puts forward an evaluation method which shows the differentials in terms of major function oriented zone and evaluation results of consistent expression, and then carries out the process evaluation using two indexes of resource utilization efficiency and environment pollution pressure to reflect auxiliary the early-warning state of China's resources and environment carrying capacity and sustainable development abilities, thus providing a scientific basis for the proposed recommendations for restrictive measures and the improvement of monitoring and early-warning mechanisms.
DOI:10.18306/dlkxjz.2017.03.001URL [本文引用: 1]
This article discusses the design basis of the early-warning system of resource and environmental carrying capacity, explains the basic concepts of resource and environmental carrying capacity and its evaluation and early-warning mechanism, and builds the theoretical model and develops key technical points of the early-warning of the national resource and environmental carrying capacity evaluation (2016 version), including technical process, evaluation system, integration methods, and classification approaches, which can provide an important technical reference for carrying out the early-warning of national resource and environmental carrying capacity overloading. This research shows that "the limits to growth" is the theoretical basis of the early-warning of resource and environmental carrying capacity. Based on the county-level administrative regions, this work carries out evaluation of terrestrial and marine resource and environmental carrying capacity respectively, both include basic and specific evaluations. The basic evaluation adopts unified basic indicators to conduct an overall regional evaluation; and the specific evaluation is conducted for different major functional zones, including optimized development zones, priority development zones, and restricted development zones, with corresponding characteristic indicators. Then the worst performing one of all indicators is used to classify the evaluated units, which separates the evaluated regions into resource and environmental overloading, critical overloading, and non-overloading areas. Combining with the evaluation results of resource and environmental consumption, five early-warning levels—red (extremely serious warning), orange (serious warning), yellow (medium-level warning), blue (slight warning), and green (no warning) are divided based on the classification results. Finally, the three carrying capacity types and five early-warning levels of resource and environmental are verified through the terrestrial-marine coordinated test.
DOI:10.1016/j.scitotenv.2013.11.115URLPMID:24361570 [本文引用: 1]
Considering the limitation of the traditional method to assess the ecological carrying capacity and the complexity of the water ecological system, we used system dynamics, ANN, and CA-Markov to model a water ecological system. The social component was modeled according to Granger causality test by system dynamics. The natural component consists of the water resource and water environmental capacity, which were forecasted through the prediction of precipitation and change in land use cover. The interaction of the social component and the natural component mainly reflected environmental policies, such as the imposition of an environmental fee and environmental tax based on their values. Simulation results showed the different assessments on water ecological carrying capacity under the two policies. The population grew (2.9 million), and less pollution (86,632.37 t COD and 2854.5 t NH4N) was observed with the imposition of environmental tax compared with the imposition of an environmental fee (2.85 million population, 10,8381 t COD and 3543 t NH4N) at the same GDP level of 585 billion CNY in 2030. According to the causality loop, we discussed the different states under the policies and the reasons that caused the differences in water ecological carrying capacity state. According to game theory, we explained the limitation of the environmental fee policy on the basis of marginal benefit and cost. The externality was cleared up by the environmental tax policy.
DOI:10.1016/j.ecolind.2015.09.008URL [本文引用: 1]
[本文引用: 1]
[本文引用: 1]
DOI:10.18402/resci.2017.03.01URL [本文引用: 1]
Carrying Capacity(CC)was first coined in biology and ecology in the 1920s,and later developed rapidly in related sciences such as natural resources science and environment science. The concept of Resources and Environment Carrying Capacity(RECC),from theoretical investigation to practical implementation,has become an effective and operational tool to describe development restrictions and quantify regional sustainable development. RECC research has become a hot topic methodologically and theoretically in ecology,geography and natural resource and environment. It primarily focuses on the ultimate limit of population and economic development on earth. After briefly looking at the origin of the concept and early headway,we summarize RECC research from land resource carrying capacity,water resource carrying capacity,and environmental carrying capacity(environment capacity). The following evaluating methods,including ecological footprint and virtual land (or the biological productive land by ecological footprint),water footprint and virtual water (or the global flow of virtual water),emergy analysis and virtual energy(or energy equilibrium),are considered as important research progresses in the past century. However,there is still lack of a standard set of evaluation theories and methodologies for RECC research in China and globally,leading to much debate over the objectivity and comparability of resultant figures. Concerning this issue,we propose that RECC research in the future should pay more attention to enhancing exploratory studies in basic theories and carrying mechanisms,thresholds determination and synthetical calculation,technological standards/manuals setting,measurable assessment and systematical integration. More effort is needed to promote the standardization,digitalization and systematization of RECC research in China before according with national practical and operational demands.
URL [本文引用: 1]
URL [本文引用: 2]
URLPMID:22393438 [本文引用: 1]
Freshwater scarcity is a growing concern, placing considerable importance on the accuracy of indicators used to characterize and map water scarcity worldwide. We improve upon past efforts by using estimates of blue water footprints (consumptive use of ground- and surface water flows) rather than water withdrawals, accounting for the flows needed to sustain critical ecological functions and by considering monthly rather than annual values. We analyzed 405 river basins for the period 1996-2005. In 201 basins with 2.67 billion inhabitants there was severe water scarcity during at least one month of the year. The ecological and economic consequences of increasing degrees of water scarcity--as evidenced by the Rio Grande (Rio Bravo), Indus, and Murray-Darling River Basins--can include complete desiccation during dry seasons, decimation of aquatic biodiversity, and substantial economic disruption.
[本文引用: 1]
http://www.ndrc.gov.cn/fzgggz/fzgh/ghwb/gjjgh/201705/t20170517_847666.html,
URL [本文引用: 1]
http://www.ndrc.gov.cn/fzgggz/fzgh/ghwb/gjjgh/201705/t20170517_847666.html,
URL [本文引用: 1]
DOI:10.3390/ijerph16203834URLPMID:31614485 [本文引用: 1]
Due to the accelerated process of urbanization in China, urban agglomerations have become the core areas for human settlement and economic development. High population and economic density has brought great pressure on water supply. Water scarcity is increasingly becoming one of the most important issues for the sustainable and healthy development of China's urban agglomerations. In this paper, a system dynamics model was constructed to simulate the current conditions and future scenarios of urbanization development and water scarcity in the Beijing-Tianjin-Hebei (BTH) urban agglomeration in 2000-2030, by examining the interaction and feedback between the six major subsystems: water supply, water demand, water pollution, population urbanization, economic urbanization, and land urbanization. It is found that the South-to-North Water Diversion Project and the improved Reclaimed Water Reuse System may greatly increase the water supply. However, the speed of population urbanization and economic growth, the spatial structure of urban agglomeration and the water consumption pattern may determine the water demand. Although all scenarios may risk water scarcity in the future at some point, we could detect a comprehensive and relatively rational scenario to balance water scarcity, regional equity, and efficiency. It might help to synthetically understand the coordinated development mode between urbanization and water resources in Beijing-Tianjin-Hebei (BTH) urban agglomeration, and provide a useful analytical and decision support tool for scientists and policy-makers to achieve the sustainable urbanization development and water resource management.
DOI:10.1016/j.jclepro.2017.02.110URL [本文引用: 2]
DOI:10.1016/j.ecolmodel.2013.11.031URL [本文引用: 1]
In this study, system dynamics (SD) and analytic hierarchy process (AHP) were combined to establish an evaluation index system and a system dynamics simulation model for the regional water ecological carrying capacity (WECC). Six proposed planning schemes were used to address the existing water ecological environment problems in the Siping area of Jilin Province, China. The development trends in the WECC during the years 2008-2020 were simulated and evaluated under different planning schemes. The results showed that the water ecological environment in the Siping area would develop into a "poor carrying" state in 2020 with a WECC index of 0.1819 if current social development modes remain unchanged. However, a "good carrying" state with a corresponding WECC index of 0.6652 could be achieved in 2020 if the 5th scheme is applied, which is an integrated planning scheme that combines changes in water-saving, pollution control, water resource exploitation and economic development. The results of this study could provide a scientific basis for the coordinated development of the social economy and the water eco-environment in the Siping area. (C) 2013 Elsevier B.V.
DOI:10.1007/s12665-015-4230-0URL [本文引用: 1]
DOI:10.4315/0362-028X.JFP-18-185URLPMID:30212229 [本文引用: 1]
Several produce-borne outbreaks have been associated with the use of contaminated water during preharvest applications. Salmonella has been implicated in a number of these outbreaks. The purpose of this study was to evaluate the microbial quality of agricultural surface water used in preharvest production on the Eastern Shore of Virginia in accordance with the Food Safety Modernization Act's Produce Safety Rule water standards. The study also examined the prevalence, concentration, and diversity of Salmonella in those water sources. Water samples (1 L) from 20 agricultural ponds were collected during the 2015 and 2016 growing seasons ( n = 400). Total aerobic bacteria, total coliforms, and Escherichia coli were enumerated for each sample. Population levels of each microorganism were calculated per 100-mL sample and log transformed, when necessary. Samples (250 mL) were also enriched for Salmonella. Presumptive Salmonella isolates were confirmed by PCR ( invA gene) and were serotyped. In 2016, the concentration of Salmonella in each sample was also estimated by most probable number (MPN). Indicator bacteria and environmental and meteorological factors were analyzed for their association with the detection of a Salmonella-positive water sample by using logistic regression analysis. Seventeen of the 20 ponds met the Food Safety Modernization Act's Produce Safety Rule standards for production agricultural water. Three ponds did not meet the standards because the statistical threshold value exceeded the limit. Salmonella was detected in 19% of water samples in each year (38 of 200 in 2015 and 38 of 200 in 2016). Of the 118 Salmonella isolates serotyped, 14 serotypes were identified with the most prevalent being Salmonella Newport. E. coli concentration, farm, and total aerobic bacteria concentration were significantly associated with the likelihood of detecting a Salmonella-positive sample The average concentration of Salmonella in all samples was 4.44 MPN/100 mL, with the limit of detection being 3.00 MPN/100 mL. The highest concentration of Salmonella was 93.0 MPN/100 mL. These data will assist in a better understanding of the risks that production water poses to produce contamination events.
https://water.usgs.gov/watuse/wuto.html,
URL [本文引用: 1]
https://www.statista.com/topics/833/energy-consumption/,
URL [本文引用: 1]
URL [本文引用: 1]
(http://www.sic.gov.cn/News/455/6841.htm,
URL [本文引用: 1]
