 , 张强, 孙鹏
Variation, causes and future estimation of surface soil moisture on the Tibetan Plateau
FANKeke, ZHANGQiang, SUNPeng通讯作者:
收稿日期:2017-08-31
修回日期:2018-12-8
网络出版日期:2019-03-25
版权声明:2019《地理学报》编辑部本文是开放获取期刊文献,在以下情况下可以自由使用:学术研究、学术交流、科研教学等,但不允许用于商业目的.
基金资助:
作者简介:
-->
展开
摘要
关键词:
Abstract
Keywords:
-->0
PDF (6042KB)元数据多维度评价相关文章收藏文章
本文引用格式导出EndNoteRisBibtex收藏本文-->
1 引言
土壤水是地表和大气水热过程交换的重要纽带,也是水文循环和水热平衡的重要组成部分[1,2]。其对地表植被和土壤中微生物的生长和活动起着至关重要的作用,并减缓气候变暖引起的土壤有机碳含量的变化[3],是地球生态系统中植被更迭及土壤碳循环的重要控制因子[4,5]。土壤水通过改变地表反照率、蒸散发强度以及显热和潜热通量进而影响该地气候[6,7,8,9]。基于观测和模拟数据,研究表明土壤水对地表大气温度的演变[10,11,12,13,14]、降水的形成[15,16]和碳循环[17]有重要影响。另外,土壤水对干旱事件和高温热浪的形成和发展以及严重性程度等也有重大驱动作用[18,19],其对人类生存和生活产生重要影响。此外,土壤水在空间分布上具有极强的异质性,传统意义上的实测站点数据已不能准确刻画大尺度范围内土壤水的空间变化,因此,使用卫星遥感及同化数据对土壤水开展研究已成为气候变化研究的热点问题[20]。青藏高原作为“第三极”[21]和“世界屋脊”,平均海拔4000 m以上,其受高原地势和季风环流的影响,自东南至西北呈现出由湿变干、由暖变冷的气候变化特征[22]。有研究表明,在全球暖化的大背景下,青藏高原增温幅度明显高于全球其他地区,通常被认为是气候变化的敏感区,通过从热力和动力两种不同机制影响当地、周边乃至全球尺度的气候变化[23,24]。青藏高原的暖化一方面引起冻土冰雪融化、湖泊面积和水量增大、水温升高,另一方面还诱发水文循环过程变异、水资源和粮食安全、生物多样性减少等一系列挑战[25,26]。同时青藏高原作为亚洲水塔,是亚洲众多大河的发源地,如长江、黄河、湄公河、雅鲁藏布江等[21, 27],这些河流为下游广大人们的生存生活提供保障。
青藏高原土壤水的时空分布对当地及周边地区的气候有重要影响,影响到众多大河的水资源量。目前对青藏高原土壤水的研究主要集中在遥感和同化数据的验证方面,Chen等基于55个站点的实测数据对AMSR-E遥感数据和GLDAS中4个模型(VIC、Noah、Mosaic、CLM)模拟的土壤水数据分别从冻结期和融化期进行评估[28];Su等使用Tibet-Obs实测土壤水数据集对多套卫星遥感数据如AMSR-E、ASCAT-L2、SMOS以及ECMWF数据集进行评估[29,30];Zeng等使用青藏高原3个不同气候区的土壤水观测站网数据对7套遥感数据和一套同化土壤水数据进行评估[31];Bi等使用青藏高原两套实测土壤水数据集对GLDAS中不同模型模拟的不同深度的土壤水数据进行评估[32]。这些研究通过不同角度的分析验证,获取评估效果好的数据,但是选取的数据集差异性较大。另外,大部分遥感数据时间跨度较短,无法研究土壤水过去长期变化和潜在影响因子。本文根据以往研究,选择整体表现较好的ERA、ECV、MERRA和Noah 4种长序列土壤水数据集,通过严格评估程序,选择土壤水分估计最好的数据集,分析潜在气象因子对土壤水分时空格局的影响,并预估未来100年青藏高原土壤水的变化,探讨可能气候成因。本研究将使对全球气候变化背景下青藏高原土壤水分变化和潜在影响因子有更加清晰的认识,有利于我们进一步探讨土壤水分与气候因子之间的耦合机制,对探讨未来气候情景下土壤水分对气候变化的响应和气候因子的交互作用有重要意义。
2 研究区与数据
2.1 研究区概况
青藏高原西起帕米尔高原和喀喇昆仑山脉,东至横断山脉,南起喜马拉雅山脉南源,北至昆仑山、阿尔金山和祁连山,被称为“第三极”“世界屋脊”,总面积约为250万km2,平均海拔在4000 m以上,为全球范围内海拔最高的地区[6]。另外,青藏高原地势呈西北高东南低的特点,高原内部起伏程度较低,边缘区地势起伏大。高原腹地年平均气温在0 ℃之下,温度随高度和纬度的升高而降低,气温日差较大;受高山阻滞,南部海洋暖湿气流无法深入高原腹地,年平均降水量从2000 mm递减到50 mm以下,同时高原上分布众多河流湖泊,是亚洲众多河流的发源地[6]。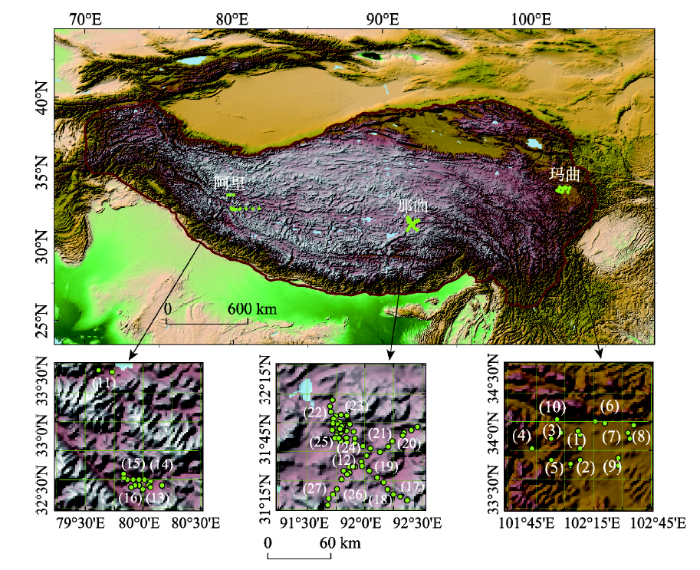 显示原图|下载原图ZIP|生成PPT
图1青藏高原区位和土壤水分观测站网分布图
-->Fig. 1Locations of the Tibetan Plateau and soil moisture observation stations
-->
2.2 实测数据
青藏高原土壤水实测数据主要来源于两套数据集:① 青藏高原土壤温湿度观测数据(Tibet-Obs,来自青藏高原数据中心),由3个区域尺度的实测观测站网组成,分别为阿里观测站网(寒冷干旱区)、那曲观测站网(寒冷半干旱区)和玛曲观测站网(寒冷湿润区),这些站网分布在不同气候和不同地表覆盖的典型地区,能够总体上反映该地区土壤水含量(下载地址:http://www.tpedatabase.cn/portal/MetaDataInfo.jsp?MetaDataId=249456)。② 青藏高原中部土壤温湿度监测网(CTP-SMTMN),全部站点皆分布在青藏高原中部地区,该地区平均海拔达到4650 m,地表起伏不大。该站网同时测量土壤水分含量和土壤温度,每30 min返回一次测量均值,将土层分为4层进行测量(下载地址:http://en.tpedatabase.cn/)。本文使用Tibet-Obs数据集中的43个站点,其中18个站点位于阿里,5个站点位于那曲,20个站点位于玛曲;CTP-SMTMN数据集中的57个站点均位于那曲地区[6]。2.3 土壤水估计数据
2.3.1 ECV 多源融合的遥感土壤水数据(Essential Climate Variable-Soil Moisture, ECV-SM)空间分辨率为0.25°×0.25°,时间分辨率为1 d,是第一套长历时的卫星遥感土壤水数据(1978年11月-2014年12月)。该数据是基于主动微波和被动微波卫星遥感的土壤水分产品,对主动和被动微波遥感数据使用LPRM算法和变化检测算法估算土壤水含量,包括3 套产品,分别为:主动微波遥感数据、被动微波遥感数据和主动与被动微波遥感融合的数据[4]。本文使用的是融合主动和被动遥感的数据集V02.2(http://catalogue.ceda.ac.uk/uuid/c89cb1c86f42456bb84e49ea06621c7e)。2.3.2 ERA-Interim ERA-Interim数据是由变分同化系统融合了大量观测数据(包括站点数据和遥感数据)而得到的同化数据。该同化系统将土壤分成4层,分别为0~7 cm、7~28 cm、28~100 cm、100~289 cm,空间分辨率为0.25°×0.25°,时间跨度由1979年1月至今,时间分辨率为6 h(0时、6时、12时、18时)[4]。本文使用0~7 cm上层土壤水分数据在日尺度上平均后再进行分析。
2.3.3 MERRA MERRA(Modern Era-Retrospective Analysis for Research and Application)是由GEOS-5模型(The Goddard Earth Observing System Model, Version 5 model)数据同化系统获得,该系统利用众多对地观测卫星产生的数据集输入到先进的GEOS-5陆面水文模型来模拟地表过程。本文使用的是上层(0~2 cm)每小时土壤水,通过算术平均获得每月土壤水数据,MERRA使用站点实测数据对降水驱动以及降水截流参数进行校正[33]。
2.3.4 Noah GLDAS(Global Land Data Assimilation Systems)利用数据同化技术融合实测站点数据和卫星遥感数据,获得全球水量和能量估计数据。该系统使用同一套输入数据驱动4种不同的陆面模型(Noah、Mosaic、CLM、VIC),步长设为15 min[32]。。模型月数据通过平均3 h的模型输出获得,可以得到两种分辨率数据,其中这4个模型均可得到1°分辨率的输出数据,时间跨度为1979年到现在,Noah模型可得到0.25°×0.25°分辨率输出数据,时间跨度为1979年。本文使用的是0.25°×0.25°的Noah数据。
2.4 气象数据
中国气象强迫数据集是中国科学院青藏高原研究所开发的一套近地表气象和环境再分析资料集[34]。该数据集涵盖了1979-2010年,是通过合并普林斯顿强迫数据,GLDAS数据,GEWEX-SRB辐射数据,TRMM卫星降水数据和中国气象局(CMA)在内的大量数据源制作成的。1.0版本的这个数据集目前已完成并公开,其时间分辨率为3 h,水平空间分辨率为0.1°×0.1°,本文选择4个可能的主要气候变量,即温度、降水、风速和地表下行短波辐射(SDSR)。以上数据信息如表1所示。Tab. 1
表1
表1遥感和同化土壤水分数据和气象数据信息
Tab. 1Information of soil moisture data by remotely sensed and reanalysis soil moisture datasets
| 数据集 | 时间 | 空间范围 | 空间分辨率(lon×lat) |
|---|---|---|---|
| ECV | 1979-2014 | 全球 | 0.25°×0.25° |
| MERRA | 1980-present | 全球 | 0.625°×0.5° |
| ERA-Interm | 1979-2016 | 全球 | 0.25°×0.25° |
| Noah_2.0(GLDAS) | 1948-2010 | 准全球 | 0.25°×0.25° |
| Noah_2.1(GLDAS) | 2000- | 准全球 | 0.25°×0.25° |
| 降水 | 1979-2016 | 中国 | 0.1°×0.1° |
| 温度 | 1979-2016 | 中国 | 0.1°×0.1° |
| 风速 | 1979-2016 | 中国 | 0.1°×0.1° |
| 太阳辐射(SDSR) | 1979-2016 | 中国 | 0.1°×0.1° |
新窗口打开
2.5 气候模式数据
CMIP是研究耦合陆—大气—海洋环流模式(GCM)输出的标准框架。本文使用耦合模式比较计划第五阶段(CMIP 5)中的26个GCMs中的表层土壤水分和41个模型的气候变量,包括降水、最高气温、最低气温、相对湿度和风速等。利用41个气候模型中的最高气温、最低气温、相对湿度和风速等计算潜在蒸散发,并结合降水量计算干旱指数来探讨未来土壤水分变化的潜在因素。所有使用的GCM输出数据可以从https://esgf-node.llnl.gov/projects/esgf-llnl/获得。3 研究方法
3.1 遥感和再分析土壤水数据评估方法
首先将实测土壤水观测站数据格点划分到0.25°×0.25°的空间栅格中,每个栅格中实测站点表层土壤水的平均值作为该栅格的实测土壤水真值,然后将温度、降水以及遥感和同化的土壤水数据通过反距离插值技术重采样至0.25°×0.25°,使不同数据格点分辨率一致,且相互对应,然后使用同样的评价标准对遥感和再分析数据进行评估。通过Pearson相关分析、Spearman相关分析和Kendall相关分析等方法对实测数据与ECV、ERA、MERRA、Noah_2.1(其时间跨度与实测数据一致,而Noah_2.0数据集仅到2010年)进行相关性分析,各方法所得主要结果基本一致。本文中仅展现Spearman相关性分析的结果(图2)。它是衡量两个变量的依赖性的非参数指标,优点在于不需要假设数据的正态性,且结果不会受单调变换的影响。相关性分析结果表明Noah_2.1更好地描述了2008-2014年期间土壤水分的变化特征。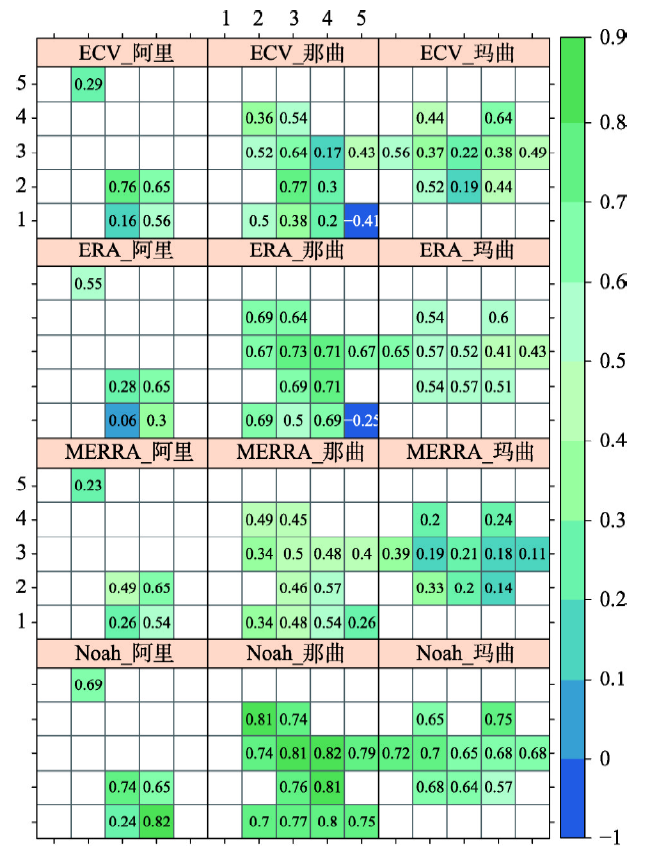 显示原图|下载原图ZIP|生成PPT
图2青藏高原3个观测站网中实测土壤水分和土壤水估计数据集Spearman相关性系数
-->Fig. 2Nonparametric Spearman correlation coefficients between in-situ soil moisture and estimated soil moisture products, that is, ECV, ERA, MERRA and Noah in the three observation networks on the Tibetan Plateau
-->
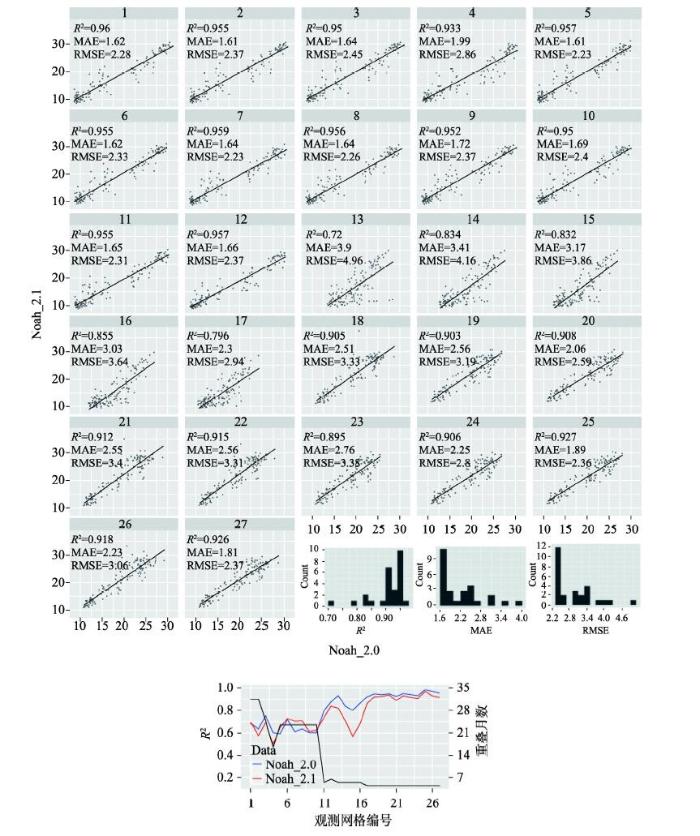
同时由于土壤水单位不一致,通过基于原始数据平均值和标准偏差的Z-score标准化方法对土壤水分数据进行归一化处理,并使用差分自回归移动平均模型(ARIMA)方法[35]定量实测土壤水分的置信区间。该方法提供了一个很好的基准来判断土壤水分估计值是否落在合理的置信区间内。由于Noah_2.1时间跨度为2000年至今,无法对长时期历史土壤水分进行分析,通过对两套数据集Noah_2.0和Noah_2.1重叠的时间范围内(2000-2010年)的估计值进行分析,发现Noah_2.0和Noah_2.1数据集对土壤水分的评估相当,另外在有实测数据的时间段内,Noah_2.0比Noah_2.1能更好地估计土壤水分(图4),因此,使用Noah_2.0来分析历史土壤水分的变化。
 显示原图|下载原图ZIP|生成PPT
图42000-2010年间Noah_2.0和Noah_2.1数据集之间的相关性、平均绝对误差和均方根误差以及2008年-2010年间Noah_2.0和Noah_2.1数据集与实测土壤水分重叠月数和相关性
-->Fig. 4Correlations, MAE and RMSE between Noah_2.0 and Noah_2.1 soil moisture products during the years of 2000-2010; correlations and overlapping months for Noah_2.0 and Noah_2.1 soil moisture products with in-situ SM for the period of 2008-2010
-->
3.2 土壤水分变化及成因诊断
为确定土壤水分变化的主要影响因子,在每个格点内使用多元逐步回归的方法来选择土壤水分变化的气象驱动因子,选择AIC信息准则[36,37]作为接受和拒绝变量的标准,AIC的计算公式如下:式中:K表示解释变量的个数;L为最大似然函数估计值。
然后利用多变量广义线性模型(GLM)计算方差贡献率[37,38]来量化每个气象变量对Noah土壤水分变化的贡献率。
气候模式本身具有较大的不确定性和误差,同时青藏高原的特殊性进一步增加预估的不确定性,为了减少气候模式的不确定性,本文选择CMIP 5中尽可能多的GCMs(共26个)以及Noah土壤水分来研究过去和未来不同情景下(RCP 2.6、RCP 4.5和RCP 8.5)土壤水分的变化特征,通过突变点检测方法[39]获得未来不同情景下土壤水分突变年份,并使用sen's slope方法[40]计算每个时间段土壤水分的变化情况。最后根据未来气候情景下GCMs(共41个)中的最高气温、最低气温、相对湿度和风速等气候变量通过彭曼公式[41]计算潜在蒸散发,通过降水除以潜在蒸散发作为干旱指数,并结合降水量分析未来土壤水分变化的潜在影响因素。
4 结果与讨论
4.1 ECV、ERA、MERRA和Noah土壤水分数据集评估
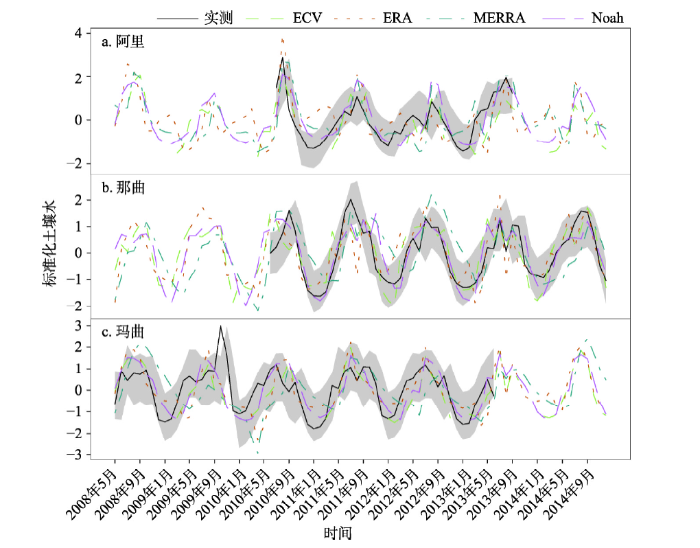
考虑到青藏高原地区气候和植被覆盖的空间差异性,3个区域的实测观测站网数据被用来作为评估标准,这些数据分别位于不同的气候区,能够代表青藏高原整体土壤水空间分布。图2为阿里、那曲和玛曲地区4套土壤水分估计数据与实测数据在0.25°×0.25°格点上的Spearman相关性。由图2可以看出,除个别格点外,所有的遥感和再分析土壤水分数据与实测数据具有较好的相关性,整体来看,Noah数据能够更好地模拟实测土壤水,在3个地区表现均为最优。对于MERRA数据集,其在阿里和那曲地区表现较好,在玛曲地区对土壤水估计效果较差,其相关性仅在0.1~0.4之间。而ERA和ECV数据集在阿里地区和那曲地区的个别格点土壤水估计值和实测土壤水的相关性接近于0,甚至为负相关。图3展示了青藏高原阿里、那曲和玛曲3个观测站网平均土壤水分的时间变化特征,由于不同土壤水分数据的单位不一致,而且不同数据集对土壤评估的量级存在一定的误差,首先通过Z-score标准化的方法将各地区不同土壤水分数据进行标准化。由图3可知,ECV、ERA、MERRA和Noah土壤水分在不同观测站网对土壤水分的评估具有不同的表现,尽管在3个观测站网中各土壤水估计产品均很好反映土壤水分随时间的变化,土壤水估计值基本落在实测土壤水分的置信区间内,但是难以准确估计土壤水分峰值和谷值。其结果基本和图2得到的结论基本一致,Noah最能反映实际土壤水分的变化特征。
 显示原图|下载原图ZIP|生成PPT
图3青藏高原3个观测站网中实测土壤水分和土壤水估计数据集时间序列对比
-->Fig. 3Comparison between in-situ soil moisture and estimated soil moisture products: ECV、ERA、MERRA and Noah in the three observation networks on the Tibetan Plateau
-->
4.2 Noah_2.0和Noah_2.1数据集选取
由表1知,Noah_2.1的时间范围为2000年至今,无法通过Noah_2.1数据集研究过去长时间范围内青藏高原土壤水分的变化特征,而Noah_2.0的时间范围为1948-2010年,其时间跨度较长,能反映历史时期青藏高原土壤水分的变化趋势,由上面的研究得知Noah_2.1数据集较ERA、ECV和MERRA数据集能更好地估计青藏高原土壤水分的变化,因此,通过探讨在两套数据的重叠期2000-2010年期间,两套数据对土壤水分的评估效果,进而可以判断Noah_2.0是否可以用于评估过去青藏高原土壤水分变化。图4中上子图为2000-2010年间Noah_2.0和Noah_2.1数据集之间的线性拟合、相关性、平均绝对误差和均方根误差以及各指标柱形图。由图4中的上子图得知,在27个0.25°×0.25°的空间格网中,大部分格网的两套土壤水数据的R2大于0.9,数据点基本均匀地分布在拟合线附近,其MAE值大约为1.7,其RMSE值约等于2.3,由R2、MAE和RMSE的柱形图可以看出,R2主要集中在高值区,MAE和RMSE集中在低值区,说明Noah_2.0在该时间段内可以替代Noah_2.1产品,来评估该区域土壤水分变化。图4中下子图反映了2008-2010年间Noah_2.0和Noah_2.1数据集与实测土壤水分重叠月数和相关性。由于玛曲地区的实测土壤水的时间范围为2008-2013年,所以两套数据集与实测土壤水分重叠的时间较长,各格点重叠月数超过20个月,而对于那曲和阿里地区,其重叠时间不到10个月。由图知,在玛曲地区,两套数据集与实测土壤水分相关性差异不大,在1~4、6号格点中Noah_2.0比Noah_2.1有更好的表现,而其他格点Noah_2.1相关性更好。而在那曲和阿里地区,Noah_2.0有更好的表现,其中在阿里地区,Noah_2.0明显优于Noah_2.1数据集。由此可知,Noah_2.0整体表现优于Noah_2.1,可以用来分析过去长时间青藏高原土壤水分的变化特征。
4.3 历史土壤水变化趋势和影响因子
分析土壤水分变化的气象驱动因子,对认识青藏高原土壤水分的影响机制有重要作用。图5为通过多元逐步回归技术和AIC准则选择主要驱动因子,并使用GLM回归分析各主要驱动因子对土壤水分的贡献率。由图5可以看出,不同气象因子对土壤水分的贡献存在很大的空间差异性。在青藏高原的大部分地区,降水对土壤水分变化的贡献比例较大,贡献大于60%,甚至大于80%,其中在喜马拉雅山脉南部,降水仍为主要影响因子,但贡献率在50%左右,在喜马拉雅山脉北侧,由于印度洋夏季季风无法绕过喜马拉雅山脉,使水汽无法到达北侧,故降水量减少,降水不是该区域土壤水分变化的主导影响因子,同时由于该地区地势较高,常年有积雪和冻土存在,故温度和太阳辐射为该地区主要的影响因子。就温度,风速和太阳辐射而言,只有较小部分区域其贡献率达到80%以上,大部分区域的贡献率小于40%,其主要影响青藏高原南部地区,可能是由于该区域处于低纬度地区,温度、太阳辐射和风速较强且年内和年际变化明显,所以对土壤水分有较大的影响。因此,可以得出结论,尽管降水对土壤水分变化的相对贡献表现出显著的空间变异性,但降水是青藏高原大部分地区土壤水分变化的主要驱动因素,而在喜马拉雅山脉北侧,降水不是土壤水分变化的主要影响因子,温度和太阳辐射对其影响较大。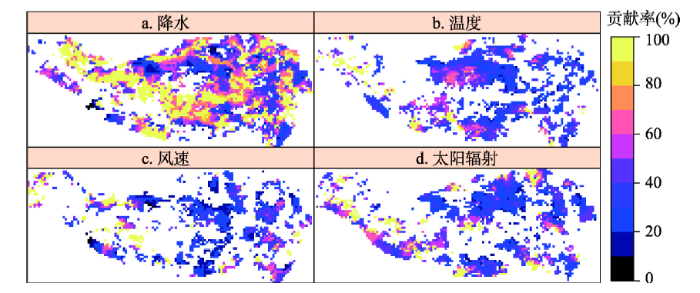 显示原图|下载原图ZIP|生成PPT
图5Noah_2.0土壤水分的主要影响因子和相对贡献
-->Fig. 5Identification and relative contribution of major climate drivers for soil moisture changes (Noah_2.0)
-->
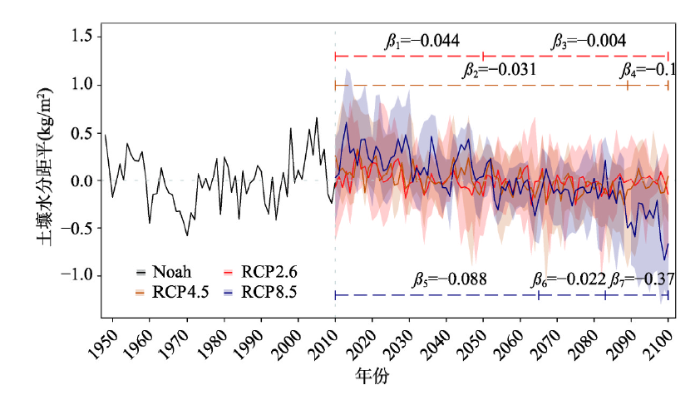
图6说明了土壤水分变化的历史观察和未来趋势。由图6知,1948-2010年间土壤水分含量波动明显。1948-1970年土壤水分有明显的下降趋势。随后的时间段,即1970-2010年,土壤水分整体呈持续增加的态势,尽管在1970-1990年间土壤水分呈波动变化,并无明显趋势,而1990-2005年间土壤水分呈一定的上升趋势,2005年至今土壤水分有明显快速下降趋势。
 显示原图|下载原图ZIP|生成PPT
图6历史和未来3种情景下基于Noah和CMIP5数据的土壤水分距平(β单位为kg/m2/10a)
-->Fig. 6Soil moisture anomaly based on Noah and 26 models under three scenarios: RCP2.6, RCP4.5 and RCP8.5 during the past (1948-2010) and the future (2010-2100)(the unit of β: kg/m2/10a)
-->
4.4 未来气候情景下土壤水分的变化特征
Algergel等强调检测未来土壤水分趋势的重要性[42]。根据CMIP5的26个GCM模型的输出结果,在RCP 2.6,RCP 4.5和RCP 8.5的情景下,对未来土壤水分突变点进行识别,然后对变化趋势进行量化。图6显示了不同气候情景下,未来土壤水分的变化存在明显的差异,但是在2010年后土壤含水量整体均呈持续下降趋势。土壤水分在不同的时段内有不同的下降速率,通过突变点识别技术,在RCP 2.6气候情景下,存在一个大约位于2052年的突变点。在2052年之前,土壤水分的变化趋势为-0.044 kg/m2/10a;在1952年之后,变化幅度为-0.004 kg/m2/10a,无明显变化趋势;在RCP 4.5情景下,存在一个在2090年的突变点,突变前土壤水分以-0.031 kg/m2/10a的速度减少,突变后其变化幅度为-0.1 kg/m2/10a,减少速度增快;在RCP 8.5气候情景下,识别出两个突变点分别为2065年和2083年,在2010-2065年土壤水分以-0.088 kg/m2/10a的幅度减少,在2065-2083年,土壤水分的变化趋势为-0.022 kg/m2/10a,在2083年以后,其变化幅度为-0.372 kg/m2/10a。同时,RCP 8.5情景下的土壤含水量平均下降速度是RCP 2.6情景下的两倍。在2083-2100年间,土壤水分骤降,RCP 8.5情景下的土壤水分下降尤为明显。因此,更高的增温强度会伴随着更快的土壤水分下降速率。已有研究基于不同空间尺度探讨土壤水分的未来变化趋势,如Cheng等根据CMIP5的20个模型的RCP 4.5和RCP 8.5情景的输出结果,发现土壤水在21世纪比20世纪有更加明显的下降趋势,其中RCP 8.5情景下土壤水持续下降,而RCP 4.5情景下土壤水先持续下降,在2050年后无明显变化。至于土壤水分变化背后的驱动因素[43],Cheng等指出土壤干燥主要是由降水减少引起,但由于气候变暖,土壤干燥度增加了将近两倍[43]。土壤水分变化背后的潜在驱动因素应该进一步深入分析。4.4 未来土壤水分的变化成因探讨
降水是土壤水分变化的主要驱动因素,是否将土壤水的减少归因于降水量的变化需要得到进一步研究[43]。本文中,降水对土壤水分的贡献率较高,由于温度升高导致的蒸散发以及永久冻土和冰雪融化等可能也是其他重要因素(图5)。有研究表明在全球范围内,蒸散量增幅大于降水量,即平均降水量增加率约为1.7%/℃,而PET增长率为5.3%/℃,导致P/PET下降3.4%/℃,并带来更干燥的陆地气候[44]。同样,由气候模式输出结果可以预计青藏高原地区降水量呈增加趋势,但蒸散量的增加速率大于降水量(图7)。在RCP 2.6,RCP 4.5和RCP 8.5气候情景下,到21世纪末,降水量增加率分别为2.2%~3.1%、1.2%~1.4%、4.9%~8.7%,而蒸散量增加率分别为1.4%~2.3%、3.8%~7.1%、11.9%~16.3%。可以看到,在RCP 8.5气候情景下,蒸散量的增加速率约是降水量增速的2~3倍,导致干旱指数(降水/蒸散发)呈下降趋势,进而使青藏高原在未来近百年内土壤水分减少(图6),其中在2083年后干旱指数和土壤水分的下降速度均有所加快。而在RCP 2.6和RCP 4.5气候情景下,干旱指数和土壤水均呈微弱的下降趋势。干旱指数和土壤水分在未来不同气候情景下相似的变化规律,表明两者有很大的相关性。Fu等也观察到在CMIP5瞬态CO2 1%/年增加实验中,由于大气中CO2浓度增加,降水量和潜在蒸散量增加,进而导致P/PET减少[44]。在这里,可以将土壤含水量下降归因于未来几十年的P/PET降低。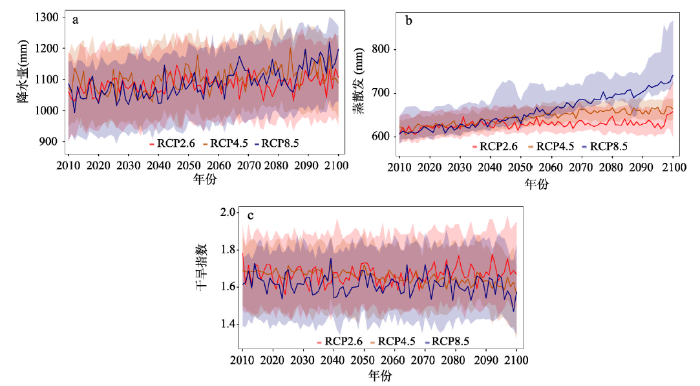 显示原图|下载原图ZIP|生成PPT
图7基于CMIP5中40个模型在RCP 2.6(27个模型)、RCP 4.5(37个模型)和RCP 8.5(40个模型)气候情景下输出获得的降水、蒸散发和干旱指数的未来变化趋势
-->Fig. 7Future changes of precipitation, Penman-Monteith evapotranspiration and aridity index based on the 40 models in CMIP5 under RCP2.6, RCP4.5 and RCP8.5 scenarios (27 models for RCP2.6, 37 models for RCP4.5 and 40 models for RCP8.5)
-->
5 结论
本文将4套遥感和再分析土壤水分数据集与100个站点的观测数据进行了评估,选择合适的土壤水数据集,分析了气象要素对土壤水分时空变化格局的影响,并基于CMIP5气候模式的输出量化了土壤水分的未来趋势,探讨土壤水分变化的气候成因。一些重要的结论和发现如下:(1)Noah_2.1在2008-2014年评估期间表现优于其他数据集:ECV,ERA和MERRA。Noah_2.0在重叠时期能反映甚至优于Noah_2.1的土壤水分数据。选择Noah_2.0作为基准来探索土壤水分的过去变化和气候变量对土壤水分的贡献。
(2)在各种气象因子中,降水是影响大部分地区土壤水分时空变化的主要驱动力,由于气候变暖导致的蒸散量增加以及冰雪冻土融化,也是造成土壤水分时空变化的原因。但在喜马拉雅山脉地带,尤其山脉北坡,温度和太阳辐射有较高的影响。
(3)不同的时间段土壤水分有不同的变化趋势。1948-1970年期间土壤水分呈下降趋势,1970-1990年土壤水分呈波动变化,无明显趋势,1990年-2005年土壤水分有一定的上升趋势,2005年后至今土壤水分有明显快速下降趋势。
(4)不同未来情景,土壤水分均有下降趋势,其中在RCP 8.5情景下,土壤水分下降最为明显,在2080年之后有更加显著的下降趋势;同时未来降水和温度均呈上升趋势,在RCP 8.5情景下最为明显,蒸散量的增加速率大于降水量,导致干旱指数变化在RCP 8.5情景下呈下降趋势,在RCP 2.6和RCP 4.5情景下无明显变化,干旱指数在一定程度上能解释未来土壤水分的变化格局。
The authors have declared that no competing interests exist.
参考文献 原文顺序
文献年度倒序
文中引用次数倒序
被引期刊影响因子
| [1] | . |
| [2] | . Nowadays large-scale hydrological models are mostly calibrated using observed discharge. Although this may lead to accurate hydrograph estimation, calibration on discharge is restricted to parameters that directly affect discharge. As a result, a large part of the hydrological system that is not directly linked to discharge, in particular the unsaturated zone, remains uncalibrated, or might be modified unrealistically. Soil moisture observations from satellites have the potential to fill this gap, as these provide a direct measurement of the state of the unsaturated zone, and thus are potentially useful in calibrating unsaturated zone model parameters. This is expected to result in a better identification of the complete hydrological system, potentially leading to improved forecasts of the hydrograph as well. Here we evaluate this added value of remotely sensed soil moisture in calibration of large-scale hydrological models by addressing two research questions: 1) Does calibration on remotely sensed soil moisture lead to an improved identification of hydrological models compared to approaches that calibrate on discharge alone? 2) If this is the case, what is the improvement in the forecasted hydrograph? To answer these questions we use a dual state and parameter ensemble Kalman filter to calibrate the hydrological model LISFLOOD for the Upper-Danube area. Calibration is done with discharge and remotely sensed soil moisture from AMSR-E, SMOS and ASCAT. Estimates and spatial correlation are derived from a previous published study on the quantification of the errors and spatial error structure of microwave remote sensing techniques. Four scenarios are studied, namely, no calibration (expert knowledge), calibration on discharge, calibration on remote sensing data and calibration on both discharge and remote sensing data. Using a split-sample approach, the model is calibrated for a period of 2 years and validated using a validation period of 10 years with the calibrated model parameters. Results show that calibration with discharge data improves the estimation of groundwater parameters (e.g. groundwater reservoir constant) and routing parameters, compared to a priori estimated values from expert knowledge. On the other hand, calibration with only remotely sensed soil moisture results in a very accurate calibration of parameters related to land surface process (e.g the saturated conductivity), which is not the case for calibration on discharge. Using remotely sensed soil moisture data, routing and groundwater parameters can not be calibrated. This is mainly due to the lack of information from the microwave sensors concerning the routing of the discharge and groundwater levels. Discharge calibration gives a NS of 0.5 for the 10-year validation and a lower overall RMSE compared to the reference run (without calibration). When validation is performed for both discharge and soil moisture the RMSE is reduced by 10-30% for the upstream area compared to the discharge calibration. Downstream, the model performance due to assimilation of remotely sensed soil moisture is not increased or slightly decreased due to the relative importance of the routing and contribution of groundwater. The conclusion is that remotely sensed soil moisture holds potential for calibration of hydrological models especially in upstream areas with sparse discharge observations. |
| [3] | . Abstract The majority of the Earth's terrestrial carbon is stored in the soil. If anthropogenic warming stimulates the loss of this carbon to the atmosphere, it could drive further planetary warming. Despite evidence that warming enhances carbon fluxes to and from the soil, the net global balance between these responses remains uncertain. Here we present a comprehensive analysis of warming-induced changes in soil carbon stocks by assembling data from 49 field experiments located across North America, Europe and Asia. We find that the effects of warming are contingent on the size of the initial soil carbon stock, with considerable losses occurring in high-latitude areas. By extrapolating this empirical relationship to the global scale, we provide estimates of soil carbon sensitivity to warming that may help to constrain Earth system model projections. Our empirical relationship suggests that global soil carbon stocks in the upper soil horizons will fall by 3009000900±09000930 petagrams of carbon to 20309000900±090009161 petagrams of carbon under one degree of warming, depending on the rate at which the effects of warming are realized. Under the conservative assumption that the response of soil carbon to warming occurs within a year, a business-as-usual climate scenario would drive the loss of 5509000900±09000950 petagrams of carbon from the upper soil horizons by 2050. This value is around 12-17 per cent of the expected anthropogenic emissions over this period. Despite the considerable uncertainty in our estimates, the direction of the global soil carbon response is consistent across all scenarios. This provides strong empirical support for the idea that rising temperatures will stimulate the net loss of soil carbon to the atmosphere, driving a positive land carbon-climate feedback that could accelerate climate change. |
| [4] | . http://linkinghub.elsevier.com/retrieve/pii/S0034425715001042 |
| [5] | . 利用中国100E以东139站1951~1999年逐月反演的土壤湿度资料(0cm~100cm, 共11层),重点分析了中国东北、华北和西北东部三个地区的土壤湿度在年际—年代际时间尺度上的演变特征。研究表明:不同层次上土壤湿度的变化特征有很好的一致性。华北地区在20世纪60年代末到70年代末为显著偏湿的阶段,之后发生突变直到90年代末土壤湿度持续降低并以90年代中后期为甚。东北区在70年代前后为一显著的干旱时段,此后土壤湿度有所恢复,但90年代以来该区的土壤湿度仍然较低。值得注意的是,华北夏季土壤湿度自80年代以来并未有明显的下降。另外,北方地区土壤在秋季普遍存在干化趋势,其中以东北地区最为显著。本文还分析了土壤湿度演变趋势的地理分布特征。 . 利用中国100E以东139站1951~1999年逐月反演的土壤湿度资料(0cm~100cm, 共11层),重点分析了中国东北、华北和西北东部三个地区的土壤湿度在年际—年代际时间尺度上的演变特征。研究表明:不同层次上土壤湿度的变化特征有很好的一致性。华北地区在20世纪60年代末到70年代末为显著偏湿的阶段,之后发生突变直到90年代末土壤湿度持续降低并以90年代中后期为甚。东北区在70年代前后为一显著的干旱时段,此后土壤湿度有所恢复,但90年代以来该区的土壤湿度仍然较低。值得注意的是,华北夏季土壤湿度自80年代以来并未有明显的下降。另外,北方地区土壤在秋季普遍存在干化趋势,其中以东北地区最为显著。本文还分析了土壤湿度演变趋势的地理分布特征。 |
| [6] | . 土壤水是地表与大气在水热交换方面的关键纽带,是关键水循环要素,更是地表产汇流过程的关键控制因子。青藏高原是地球第三极,也是亚洲水塔,探讨青藏高原土壤水变化对于探讨青藏高原热力学特征变化及其对东亚乃至全球气候变化的影响具有重要意义,而获取高精度长序列大尺度土壤水数据集则是其关键。本文利用青藏高原100个土壤水站点观测数据,从多空间尺度(0.25°×0.25°,0.5°×0.5°,1°×1°)、多时间段(冻结和融化期)等角度,采用多评价指标(、RMSE、Bias),对多套遥感反演和同化数据(ECV、ERA-Interim、MERRA、Noah)进行全面评估。结果表明:①除ERA外,其他数据均能反映青藏高原土壤水变化,且与降水量变化一致。而在那曲地区,遥感反演和同化数据均明显低估实测土壤水含量。从空间分布来看,MERRA和Noah与植被指数最为一致,可很好地反映土壤水空间变化特征;② 青藏高原大部分地区土壤水变化主要受降水影响,其中青藏高原西部边缘与喜马拉雅地区土壤水变化则受冰雪融水和降水的共同影响;③ 除阿里地区外,大部分遥感反演和同化数据在融化期与实测土壤水相关性高于冻结期,其中在那曲地区,遥感反演和同化数据均高估冻结期土壤含水量,却低估融化期土壤含水量。另外,遥感反演和同化数据对中大空间尺度土壤水的估计要好于对小空间尺度土壤水的估计。本研究为青藏高原土壤水研究的数据集选择提供重要理论依据。 . 土壤水是地表与大气在水热交换方面的关键纽带,是关键水循环要素,更是地表产汇流过程的关键控制因子。青藏高原是地球第三极,也是亚洲水塔,探讨青藏高原土壤水变化对于探讨青藏高原热力学特征变化及其对东亚乃至全球气候变化的影响具有重要意义,而获取高精度长序列大尺度土壤水数据集则是其关键。本文利用青藏高原100个土壤水站点观测数据,从多空间尺度(0.25°×0.25°,0.5°×0.5°,1°×1°)、多时间段(冻结和融化期)等角度,采用多评价指标(、RMSE、Bias),对多套遥感反演和同化数据(ECV、ERA-Interim、MERRA、Noah)进行全面评估。结果表明:①除ERA外,其他数据均能反映青藏高原土壤水变化,且与降水量变化一致。而在那曲地区,遥感反演和同化数据均明显低估实测土壤水含量。从空间分布来看,MERRA和Noah与植被指数最为一致,可很好地反映土壤水空间变化特征;② 青藏高原大部分地区土壤水变化主要受降水影响,其中青藏高原西部边缘与喜马拉雅地区土壤水变化则受冰雪融水和降水的共同影响;③ 除阿里地区外,大部分遥感反演和同化数据在融化期与实测土壤水相关性高于冻结期,其中在那曲地区,遥感反演和同化数据均高估冻结期土壤含水量,却低估融化期土壤含水量。另外,遥感反演和同化数据对中大空间尺度土壤水的估计要好于对小空间尺度土壤水的估计。本研究为青藏高原土壤水研究的数据集选择提供重要理论依据。 |
| [7] | . Calculations with a numerical model of the atmosphere show that the global fields of rainfall, temperature, and motion strongly depend on the landsurface evapotranspiration. This confirms the long-held idea that the surface vegetation, which produces the evapotransporation, is an important factor in the earth's climate. |
| [8] | . 1 Introduction Soil freezing-thawing process in cryosphere plays an important role in regional climate and environmental change. Permafrost is a sensitive indicator (Pavlov, 1994). Because the seasonal freeze-thaw layer (activity layer) occurs in the u |
| [9] | . |
| [10] | . ABSTRACT The hydroclimatic conditions under which a seasonal meteorological drought (below-normal seasonal rainfall) can induce an increase in seasonal air temperature are investigated, first with an atmospheric general circulation model (AGCM) and then with observations. Geographical differences in the dryness-warmth connection abound in the AGCM; in the United States, for example, identified evaporative controls tend to tie meteorological droughts to warmer temperatures in the South but not in the Northeast. The strong agreement between AGCM and observations-based geographical patterns of drought-induced warming supports the idea that the same evaporative controls are also present in nature.A powerful side benefit of the analysis of drought-induced warming is a Northern Hemisphere map, derived solely from observations, showing where total boreal summer evaporation is controlled by soil moisture, energy availability, or both. |
| [11] | . Processes acting at the interface between the land surface and the atmosphere have a strong impact on the European summer climate, particularly during extreme years. These processes are to a large extent associated with soil moisture (SM). This study investigates the role of soil moisture–atmosphere coupling for the European summer climate over the period 1959–2006 using simulations with a regional climate model. The focus of this study is set on temperature and precipitation extremes and trends. The analysis is based on simulations performed with the regional climate model CLM, driven with ECMWF reanalysis and operational analysis data. The set of experiments consists of a control simulation (CTL) with interactive SM, and sensitivity experiments with prescribed SM: a dry and a wet run to determine the impact of extreme values of SM, as well as experiments with lowpass-filtered SM from CTL to quantify the impact of the temporal variability of SM on different time scales. Soil moisture–climate interactions are found to have significant effects on temperature extremes in the experiments, and impacts on precipitation extremes are also identified. Case studies of selected major summer heat waves reveal that the intraseasonal and interannual variability of SM account for 5–30% and 10–40% of the simulated heat wave anomaly, respectively. For extreme precipitation events on the other hand, only the wet-day frequency is impacted in the experiments with prescribed soil moisture. Simulated trends for the past decades, which appear consistent with projected changes for the 21st century, are identified to be at least partly linked to SM-atmosphere feedbacks. |
| [12] | . The Global Land-Atmosphere Climate Experiment-Coupled Model Intercomparison Project phase 5 (GLACE-CMIP5) is a multimodel experiment investigating the impact of soil moisture-climate feedbacks in CMIP5 projections. We present here first GLACE-CMIP5 results based on five Earth System Models, focusing on impacts of projected changes in regional soil moisture dryness (mostly increases) on late 21st century climate. Projected soil moisture changes substantially impact climate in several regions in both boreal and austral summer. Strong and consistent effects are found on temperature, especially for extremes (about 1-1.5K for mean temperature and 2-2.5K for extreme daytime temperature). In the Northern Hemisphere, effects on mean and heavy precipitation are also found in most models, but the results are less consistent than for temperature. A direct scaling between soil moisture-induced changes in evaporative cooling and resulting changes in temperature mean and extremes is found in the simulations. In the Mediterranean region, the projected soil moisture changes affect about 25% of the projected changes in extreme temperature. |
| [13] | . 61Soil moisture–temperature coupling analyzed using remote-sensing soil moisture61Global patterns of coupling from remote sensing and SPI drought index comparable61Strength of the coupling appears underestimated with remote sensing soil moisture61Temporal variability less pronounced in remote sensing soil moisture compared to SPI61Role of different soil depths for soil moisture–temperature coupling is enlightened |
| [14] | . Land-atmosphere interactions play an important role for hot temperature extremes in Europe. Dry soils may amplify such extremes through feedbacks with evapotranspiration. While previous observational studies generally focused on the relationship between precipitation deficits and the number of hot days, we investigate here the influence of soil moisture (SM) on summer monthly maximum temperatures (TXx) using water balance model-based SM estimates (driven with observations) and temperature observations. Generalized extreme value distributions are fitted to TXx using SM as a covariate. We identify a negative relationship between SM and TXx, whereby a 100mm decrease in model-based SM is associated with a 1.6 C increase in TXx in Southern-Central and Southeastern Europe. Dry SM conditions result in a 2 4 C increase in the 20-year return value of TXx compared to wet conditions in these two regions. In contrast with SM impacts on the number of hot days (NHD), where low and high surface-moisture conditions lead to different variability, we find a mostly linear dependency of the 20-year return value on surface-moisture conditions. We attribute this difference to the non-linear relationship between TXx and NHD that stems from the threshold-based calculation of NHD. Furthermore the employed SM data and the Standardized Precipitation Index (SPI) are only weakly correlated in the investigated regions, highlighting the importance of evapotranspiration and runoff for resulting SM. Finally, in a case study for the hot 2003 summer we illustrate that if 2003 spring conditions in Southern-Central Europe had been as dry as in the more recent 2011 event, temperature extremes in summer would have been higher by about 1 C, further enhancing the already extreme conditions which prevailed in that year. |
| [15] | . Land oppervlakte-eigenschappen, zoals vegetatie en bodemvocht, invloed hebben op de verdeling van stralingsenergie tussen latente en voelbare warmte fluxen in daguren. Tijdens droge periodes, kan de bodem-water tekort te beperken verdamping, wat leidt tot warmere en drogere condities in de lagere atmosfeer 1 , 2 . Bodemvocht kan invloed hebben op de ontwikkeling van convectieve stormen door middel van dergelijke wijzigingen van low-level atmosferische temperatuur en luchtvochtigheid 1 , 3 , die terug op zijn beurt voedt zich met bodemvocht. Toch is er grote onzekerheid over hoe bodemvocht invloed convectieve stormen over de hele wereld, als gevolg van een gebrek aan observationeel bewijs en onzekerheid in grootschalige modellen 4 . Hier presenteren we een wereldwijde schaal observationele analyse van de koppeling tussen bodemvocht en neerslag. We laten zien dat in alle onderzochte zes continenten, 's middags regen voorkeur valt over gronden die relatief droog zijn ten opzichte van de omgeving. Het signaal komt het duidelijkst in de waarnemingen over semi-aride gebieden, waar het oppervlak fluxen zijn gevoelig voor bodemvocht en convectieve gebeurtenissen zijn frequent. Mechanistisch, onze resultaten zijn in overeenstemming met verbeterde middag vochtige convectie gedreven door toegenomen voelbare warmte flux dan droger bodems, en / of mesoschaal variabiliteit in het bodemvocht. We vinden geen bewijs in onze analyse van een positieve feedback, dat wil zeggen een voorkeur voor regen over wetter bodem-bij de ruimtelijke schaal (50-100 kilometer) bestudeerd. In tegenstelling, vinden we dat een positieve feedback van bodemvocht op gesimuleerde neerslag niet domineren in zes state-of-the-art mondiale weer-en klimaatmodellen-een verschil dat kan bijdragen aan overmatige gesimuleerde droogte in grootschalige modellen. |
| [16] | . Abstract Soil moisture impacts on precipitation have been strongly debated. Recent observational evidence of afternoon rain falling preferentially over land parcels that are drier than the surrounding areas (negative spatial effect), contrasts with previous reports of a predominant positive temporal effect. However, whether spatial effects relating to soil moisture heterogeneity translate into similar temporal effects remains unknown. Here we show that afternoon precipitation events tend to occur during wet and heterogeneous soil moisture conditions, while being located over comparatively drier patches. Using remote-sensing data and a common analysis framework, spatial and temporal correlations with opposite signs are shown to coexist within the same region and data set. Positive temporal coupling might enhance precipitation persistence, while negative spatial coupling tends to regionally homogenize land surface conditions. Although the apparent positive temporal coupling does not necessarily imply a causal relationship, these results reconcile the notions of moisture recycling with local, spatially negative feedbacks. |
| [17] | . The growth rate of atmospheric carbon dioxide (CO2) concentrations since industrialization is characterized by large interannual variability, mostly resulting from variability in CO2 uptake by terrestrial ecosystems (typically termed carbon sink). However, the contributions of regional ecosystems to that variability are not well known. Using an ensemble of ecosystem and land-surface models and an empirical observation-based product of global gross primary production, we show that the mean sink, trend, and interannual variability in CO2 uptake by terrestrial ecosystems are dominated by distinct biogeographic regions. Whereas the mean sink is dominated by highly productive lands (mainly tropical forests), the trend and interannual variability of the sink are dominated by semi-arid ecosystems whose carbon balance is strongly associated with circulation-driven variations in both precipitation and temperature. |
| [18] | . The recent European mega-heatwaves of 2003 and 2010 broke temperature records across Europe(1-5). Although events of this magnitude were unprecedented from a historical perspective, they are expected to become common by the end of the century(6,7). However, our understanding of extreme heatwave events is limited and their representation in climate models remains imperfect(8). Here we investigate the physical processes underlying recent mega-heatwaves using satellite and balloon measurements of land and atmospheric conditions from the summers of 2003 in France and 2010 in Russia, in combination with a soil-water-atmosphere model. We find that, in both events, persistent atmospheric pressure patterns induced land-atmosphere feedbacks that led to extreme temperatures. During daytime, heat was supplied by large-scale horizontal advection, warming of an increasingly desiccated land surface and enhanced entrainment of warm air into the atmospheric boundary layer. Overnight, the heat generated during the day was preserved in an anomalous kilometres-deep atmospheric layer located several hundred metres above the surface, available to re-enter the atmospheric boundary layer during the next diurnal cycle. This resulted in a progressive accumulation of heat over several days, which enhanced soil desiccation and led to further escalation in air temperatures. Our findings suggest that the extreme temperatures in mega-heatwaves can be explained by the combined multi-day memory of the land surface and the atmospheric boundary layer. |
| [19] | . The severe 2010 heat wave in western Russia was found to be influenced by anthropogenic climate change. Additionally, soil moisture-temperature feedbacks were deemed important for the buildup of the exceptionally high temperatures. We quantify the relative role of both factors by applying the probabilistic event attribution framework and analyze ensemble simulations to distinguish the effect of climate change and the 2010 soil moisture conditions for annual maximum temperatures. The dry 2010 soil moisture alone has increased the risk of a severe heat wave in western Russia sixfold, while climate change from 1960 to 2000 has approximately tripled it. The combined effect of climate change and 2010 soil moisture yields a 13 times higher heat wave risk. We conclude that internal climate variability causing the dry 2010 soil moisture conditions formed a necessary basis for the extreme heat wave. |
| [20] | . [1] A multi-scale soil moisture and temperature monitoring network, consisting of 55 soil moisture and temperature measurement stations, has been established in central Tibetan Plateau (TP). In this study, the station-averaged surface soil moisture data from the network are used to evaluate four soil moisture products retrieved from the Advanced Microwave Scanning Radiometer-Earth Observing System (AMSR-E) and four land surface modeling products from the Global Land Data Assimilation System (GLDAS). Major findings are (1) none of the four AMSR-E products provides reliable estimates in the unfrozen season, in terms of the mission requirement of the root mean square error (RMSE)090009<0900090.06090009m3m0908083. These algorithms either evidently overestimate soil moisture or obviously underestimate it, although some of them showed the soil moisture dynamic range, indicating that the retrieval algorithms have much space to be improved for the cold semi-arid regions. (2) The four GLDAS models tend to systematically underestimate the surface soil moisture (00900095090009cm) while well simulate the soil moisture for 2009000940090009cm layer. In comparison with the satellite surface soil moisture products, three among the four models give low RMSE and BIAS values, but still falling out of the acceptable range. The causes for the modeling biases in this cold region were discussed. |
| [21] | . The hydrological regimes for the major river basins in the Tibetan Plateau (TP), including the source regions of the Yellow (UYE), Yangtze (UYA), Mekong (UM), Salween (US), Brahmaputra (UB), and Indus (UI) rivers, were investigated through a land surface model and regression analyses between climate variables and runoff data. A hydrologic modeling framework was established across the TP to link the Variable Infiltration Capacity (VIC) land surface hydrology model with a degree-day glacier-melt scheme (VIC-glacier model) at a 1/12 degrees x1/12 degrees. The model performance was evaluated over the upper basins of the six rivers. The heterogeneity and scarcity of the meteorological stations are the major limitation for hydrological modeling over the TP. The relative contributions to streamflow from rainfall, snowmelt, and glacier melt for the six basins were quantified via the model framework and simulation. The results suggest that monsoon precipitation has a dominant role in sustaining seasonal streamflow over southeastern regions, contributing 65-78% of annual runoff among the UYE, UYA, UM, US, and UB basins. For the UI, the runoff regime is largely controlled by the glacier melt and snow cover in spring and summer. The contribution of glacier runoff is minor for the UYE and UM (less than 2% of total annual flow), and moderate for the UYA and US basins (5-7% of yearly flow), while glacier melt makes up about 12% and 48% of annual flow for the UB and UI basins, respectively. |
| [22] | . The phase transition of pore water in soil during freeze-thaw process has a great impact on hydrologic cycle, meteorology and soil erosion on both regional and global scale. A useful indicator to evaluate the soil freeze-thaw intensity is the amount of Phase Transition Water Content(PTWC)in soil pores. However, the coarse resolution of passive microwave data(about 25 km)has limited availabilities for many applications in environmental monitoring. In this research, we attempted to obtain high resolution PTWC using MODIS and AMSR2 products. We analyzed the ground measured soil moisture and temperature data obtained in Tibet during the winter of 2012 and found that there was a power function relationship between Temperature Index(TI)and PTWC. Then a downscaling approach combining TI calculated by MODIS products and AMSR2 PTWC was performed to retrieve high resolution PTWC. A satifying result was achieved that the MODIS TI and AMSR2 PTWC also followed the power function trend with a of 0.8068. The downscaling PTWC had more variation information and added the mission data of AMSR2 PTWC at 25 km. The downscaling PTWC at 1 km was validated with in situ data measured from November 2011 to March 2012 in CTP-SMTMN small scale area. The result showed that the downscaling PTWC was closer to the 1:1 line and it quite followed the trend of ground data with a RMSE of 0.0085(m/m)and MAE of 0.0059(m/m)when PTWC was higher than 0.01(m/m). But this method also has some disadvantages. The precision of AMSR2 soil moisture products directly influence the accuracy of the downscaling PTWC. At the same time, we use a power function to do the downscaling approach, the PWTC is increasing very quickly as TI decreasing when TI is near 0. A little change of TI may generate a large change of PTWC. The characteristic of power function may cause errors between retrieved and observed PTWC. In addition, the unmatched scale between the remote sensing pixels and in situ points, the spatial variability by factors other than LST such as soil initial moisture, soil texture, topography and vegetation may also generate errors. In the future research, we can improve the precision of downscaling PTWC by using a high precision soil moisture product, or developing a high accuracy algorithm to calculate PTWC. Introducing the topography, vegetation to the downscaling approach maybe also worth to try. In general, the TI-PTWC model in this research has combined the advantage of microwave remote sensing and thermal-infrared remote sensing; it has a high precision and can generate PTWC in small scale. . The phase transition of pore water in soil during freeze-thaw process has a great impact on hydrologic cycle, meteorology and soil erosion on both regional and global scale. A useful indicator to evaluate the soil freeze-thaw intensity is the amount of Phase Transition Water Content(PTWC)in soil pores. However, the coarse resolution of passive microwave data(about 25 km)has limited availabilities for many applications in environmental monitoring. In this research, we attempted to obtain high resolution PTWC using MODIS and AMSR2 products. We analyzed the ground measured soil moisture and temperature data obtained in Tibet during the winter of 2012 and found that there was a power function relationship between Temperature Index(TI)and PTWC. Then a downscaling approach combining TI calculated by MODIS products and AMSR2 PTWC was performed to retrieve high resolution PTWC. A satifying result was achieved that the MODIS TI and AMSR2 PTWC also followed the power function trend with a of 0.8068. The downscaling PTWC had more variation information and added the mission data of AMSR2 PTWC at 25 km. The downscaling PTWC at 1 km was validated with in situ data measured from November 2011 to March 2012 in CTP-SMTMN small scale area. The result showed that the downscaling PTWC was closer to the 1:1 line and it quite followed the trend of ground data with a RMSE of 0.0085(m/m)and MAE of 0.0059(m/m)when PTWC was higher than 0.01(m/m). But this method also has some disadvantages. The precision of AMSR2 soil moisture products directly influence the accuracy of the downscaling PTWC. At the same time, we use a power function to do the downscaling approach, the PWTC is increasing very quickly as TI decreasing when TI is near 0. A little change of TI may generate a large change of PTWC. The characteristic of power function may cause errors between retrieved and observed PTWC. In addition, the unmatched scale between the remote sensing pixels and in situ points, the spatial variability by factors other than LST such as soil initial moisture, soil texture, topography and vegetation may also generate errors. In the future research, we can improve the precision of downscaling PTWC by using a high precision soil moisture product, or developing a high accuracy algorithm to calculate PTWC. Introducing the topography, vegetation to the downscaling approach maybe also worth to try. In general, the TI-PTWC model in this research has combined the advantage of microwave remote sensing and thermal-infrared remote sensing; it has a high precision and can generate PTWC in small scale. |
| [23] | . |
| [24] | . In recent two decades, North and Northeast China have suffered from severe and persistent droughts while the Yangtze River basin and South China have undergone much more significant heavy rainfall/floods events. This long-term change in the summer precipitation and associated large-scale monsoon circulation features have been examined by using the new dataset of 740 surface stations for recent 54 years (1951-2004) and about 123-yr (1880-2002) records of precipitation in East China. The following new findings have been highlighted: (1) One dominating mode of the inter-decadal variability of the summer precipitation in China is the near-80-yr oscillation. Other modes of 12-yr and 30-40-yr oscillations also play an important role in affecting regional inter-decadal variability. (2) In recent 54 years, the spatial pattern of the inter-decadal variability of summer precipitation in China is mainly structured with two meridional modes: the dipole pattern and the positive-negative-positive (+ - + pattern). In this period, a regime transition of meridional precipitation mode from + - + pattern to dipole pattern has been completed. In the process of southward movement of much precipitation zone, two abrupt climate changing points that occurred in 1978 and 1992, respectively, were identified. (3) Accompanying the afore-described precipitation changes, the East Asian summer monsoon have experienced significant weakening, with northward moisture transport and convergence by the East Asian summer monsoon greatly weakened, thus leading to much deficient moisture supply for precipitation in North China. (4) The significant weakening of the component of the tropical upper-level easterly jet (TEJ) has made a dominating contribution to the weakening of the Asian summer monsoon system. The cooling in the high troposphere at mid- and high latitudes and the possible warming at low latitude in the Asian region is likely to be responsible for the inter-decadal weakening of the TEJ. Copyright 2007 Royal Meteorological Society |
| [25] | . <p>利用1970年航测地形图、1991和2004年二期影像数据、1971~2004年纳木错流域附近气象站点气象资料以及纳木错实测水深数据, 综合运用遥感、GIS技术、空间分析、统计分析等方法, 定量分析了近34年来纳木错湖面面积和水量的变化情况, 并从气象要素和水量平衡两方面对其变化原因进行了探讨. 结果表明, 1971~2004年期间, 湖面面积从1920 km<sup>2</sup>增加到2015.38 km<sup>2</sup>, 增加速率为2.37 km<sup>2</sup>?a<sup>–1</sup>; 湖泊水量从783.23×10⁸ m<sup>3</sup>增加到863.77×108 m<sup>3</sup>, 平均增加速率为2.37×10⁸ m<sup>3</sup>?a<sup>–1</sup>. 其中, 湖面面积和水量在1992~2004年的增加速率(4.01 km<sup>2</sup>?a<sup>–1</sup>和3.61×108 m<sup>3</sup>?a<sup>–1</sup>)均明显大于其在1971~1991年的增加速率(2.06 km<sup>2</sup>?a<sup>–1</sup>和1.60×108 m<sup>3</sup>?a<sup>–1</sup>). 气象要素变化分析表明, 纳木错流域气温升高引起的冰川融水增加、流域降水量增长、湖面蒸发量减小共同构成了湖泊水量增加的原因. 从湖泊水量平衡来分析, 两个研究时段内, 湖面降水与陆面降水产生的径流补给分别占湖泊总补给量的63%和61.91%, 而冰川融水补给仅占总补给量的8.55%和11.48%, 显示降水是构成湖泊补给的主要来源; 从湖泊水量增加的原因来分析, 降水增加及其产生的径流对湖泊总补给增量的贡献率占46.67%, 而冰川融水增加对湖泊总补给增量的贡献率则高达52.86%. 湖泊蒸发与水量增加的比例显示, 湖泊总补给增量的95.71%贡献给湖泊水量的增加, 因此, 冰川融水增加在近期湖泊水量增加的比例占到50.6%左右, 显示气候变暖引起的冰川融水增加是引起近年纳木错湖面迅速扩张的主要原因.</p> . <p>利用1970年航测地形图、1991和2004年二期影像数据、1971~2004年纳木错流域附近气象站点气象资料以及纳木错实测水深数据, 综合运用遥感、GIS技术、空间分析、统计分析等方法, 定量分析了近34年来纳木错湖面面积和水量的变化情况, 并从气象要素和水量平衡两方面对其变化原因进行了探讨. 结果表明, 1971~2004年期间, 湖面面积从1920 km<sup>2</sup>增加到2015.38 km<sup>2</sup>, 增加速率为2.37 km<sup>2</sup>?a<sup>–1</sup>; 湖泊水量从783.23×10⁸ m<sup>3</sup>增加到863.77×108 m<sup>3</sup>, 平均增加速率为2.37×10⁸ m<sup>3</sup>?a<sup>–1</sup>. 其中, 湖面面积和水量在1992~2004年的增加速率(4.01 km<sup>2</sup>?a<sup>–1</sup>和3.61×108 m<sup>3</sup>?a<sup>–1</sup>)均明显大于其在1971~1991年的增加速率(2.06 km<sup>2</sup>?a<sup>–1</sup>和1.60×108 m<sup>3</sup>?a<sup>–1</sup>). 气象要素变化分析表明, 纳木错流域气温升高引起的冰川融水增加、流域降水量增长、湖面蒸发量减小共同构成了湖泊水量增加的原因. 从湖泊水量平衡来分析, 两个研究时段内, 湖面降水与陆面降水产生的径流补给分别占湖泊总补给量的63%和61.91%, 而冰川融水补给仅占总补给量的8.55%和11.48%, 显示降水是构成湖泊补给的主要来源; 从湖泊水量增加的原因来分析, 降水增加及其产生的径流对湖泊总补给增量的贡献率占46.67%, 而冰川融水增加对湖泊总补给增量的贡献率则高达52.86%. 湖泊蒸发与水量增加的比例显示, 湖泊总补给增量的95.71%贡献给湖泊水量的增加, 因此, 冰川融水增加在近期湖泊水量增加的比例占到50.6%左右, 显示气候变暖引起的冰川融水增加是引起近年纳木错湖面迅速扩张的主要原因.</p> |
| [26] | . 利用1976、1988和2006年的3期陆地卫星遥感数据,采用面向对象的解译方法并结合专家知识分类规则自动提取珠穆朗玛峰国家自然保护区(以下简称珠峰保护区)3个时期的冰川信息,并利用遥感、地理信息系统和图谱的方法对冰川时空分布特征和变化及其原因与不确定性进行了分析。结果如下:(1)2006年珠峰保护区内冰川面积为2710.17±0.011km^2,为研究区总面积的7.41%,主要分布在研究区南部海拔4700~6800m的高山区 (2)1976-2006年,珠峰保护区冰川持续退缩明显,总面积减少501.91±0.035km^2,冰湖扩张迅速(净增加36.88±0.035km^2) 研究区南坡子流域冰川退缩率(16.79%)高于北坡子流域(14.40%) 珠峰保护区冰川以退缩为主,退缩冰川主要分布于海拔4700~6400m,退缩区上限海拔为6600~6700m (3)1976年以来,气温显著上升和降水减少是冰川退缩的关键因素。 . 利用1976、1988和2006年的3期陆地卫星遥感数据,采用面向对象的解译方法并结合专家知识分类规则自动提取珠穆朗玛峰国家自然保护区(以下简称珠峰保护区)3个时期的冰川信息,并利用遥感、地理信息系统和图谱的方法对冰川时空分布特征和变化及其原因与不确定性进行了分析。结果如下:(1)2006年珠峰保护区内冰川面积为2710.17±0.011km^2,为研究区总面积的7.41%,主要分布在研究区南部海拔4700~6800m的高山区 (2)1976-2006年,珠峰保护区冰川持续退缩明显,总面积减少501.91±0.035km^2,冰湖扩张迅速(净增加36.88±0.035km^2) 研究区南坡子流域冰川退缩率(16.79%)高于北坡子流域(14.40%) 珠峰保护区冰川以退缩为主,退缩冰川主要分布于海拔4700~6400m,退缩区上限海拔为6600~6700m (3)1976年以来,气温显著上升和降水减少是冰川退缩的关键因素。 |
| [27] | . At high latitudes, changes in soil moisture could alter soil temperatures independently of air temperature changes by interacting with the snow thermal rectifier. The authors investigated this mechanism with model experiments in the Community Land Model 4 (CLM4) with prescribed atmospheric forcing and vegetation state. Under equilibriumhistorical conditions, increasing CO2 concentrations experienced by plants from 285 to 857 ppm caused local increases in soil water-filled pore space of 0.1-0.2 in some regions throughout the globe. In permafrost regions that experienced this moistening, vertical-and annual-mean soil temperatures increased by up to 3 degrees C (0.27 degrees C averaged over all permafrost areas). A similar pattern of moistening and consequent warming occurred in simulations with prescribed June-September (JJAS) rainfall increases of 25% over historical values, a level of increase commensurate with projected future rainfall increases. There was a strong sensitivity of the moistening responses to the baseline hydrological state. Experiments with perturbed physics confirmed that the simulated warming in permafrost soils was caused by increases in the soil latent heat of fusion per unit volume and in the soil thermal conductivity due to the increased moisture. In transient Representative Concentration Pathway 8.5 (RCP8.5) scenario experiments, soil warming due to increased CO2 or JJAS rainfall was smaller in magnitude and spatial extent than in the equilibrium experiments. Active-layer deepening associated with soil moisture changes occurred over less than 8% of the current permafrost area because increased heat of fusion and soil thermal conductivity had compensating effects on active-layer depth. Ongoing modeling challenges make these results tentative. |
| [28] | . [1] A multi-scale soil moisture and temperature monitoring network, consisting of 55 soil moisture and temperature measurement stations, has been established in central Tibetan Plateau (TP). In this study, the station-averaged surface soil moisture data from the network are used to evaluate four soil moisture products retrieved from the Advanced Microwave Scanning Radiometer-Earth Observing System (AMSR-E) and four land surface modeling products from the Global Land Data Assimilation System (GLDAS). Major findings are (1) none of the four AMSR-E products provides reliable estimates in the unfrozen season, in terms of the mission requirement of the root mean square error (RMSE)090009<0900090.06090009m3m0908083. These algorithms either evidently overestimate soil moisture or obviously underestimate it, although some of them showed the soil moisture dynamic range, indicating that the retrieval algorithms have much space to be improved for the cold semi-arid regions. (2) The four GLDAS models tend to systematically underestimate the surface soil moisture (00900095090009cm) while well simulate the soil moisture for 2009000940090009cm layer. In comparison with the satellite surface soil moisture products, three among the four models give low RMSE and BIAS values, but still falling out of the acceptable range. The causes for the modeling biases in this cold region were discussed. |
| [29] | . A plateau scale soil moisture and soil temperature observatory is established on the Tibetan Plateau for quantifying uncertainties in coarse resolution satellite and model products of soil moisture and soil temperature. The Tibetan Plateau observatory of plateau scale soil moisture and soil temperature (Tibet-Obs) consists of three regional scale in-situ reference networks, including the Naqu network in a cold semiarid climate, the Maqu network in a cold humid climate and the Ngari network in a cold arid climate. These networks provide a representative coverage of the different climate and land surface hydrometeorological conditions on the Tibetan plateau. In this paper the details of the Tibet-Obs are reported. To demonstrate the uniqueness of the Tibet-Obs in quantifying and explaining soil moisture uncertainties in existing coarse satellite products, an analysis is carried out to assess the reliability of several satellite products for the Naqu and the Maqu network areas. It is concluded that global coarse resolution soil moisture products are useful but exhibit till now unreported uncertainties in cold and semiarid regions ??? use of them would be critically enhanced if uncertainties can be quantified and reduced using in-situ measurements. |
| [30] | . An analysis is carried out for two hydrologically contrasting but thermodynamically similar areas on the Tibetan Plateau, to evaluate soil moisture analysis based on the European Centre for Medium-Range Weather Forecasts (ECMWF) previous optimum interpolation scheme and the current point-wise extended Kalman filter scheme. To implement the analysis, this study used two regional soil moisture and soil temperature networks (i.e., Naqu and Maqu) on the Tibetan Plateau. For the cold-semiarid Naqu area, both ECMWF soil moisture analyses significantly overestimate the regional soil moisture in the monsoon seasons. For the cold-humid Maqu network area, the ECMWF products have comparable accuracy as reported by previous studies in the humid monsoon period. The comparisons were made among the liquid soil moisture analysis from ECMWF, the ground station's measurements and the satellite estimates from the Advanced Scatterometer sensor. The results show reasonable performances of the ECMWF soil moisture analyses (i.e., both optimum interpolation and extended Kalman filter products) and the Advanced Scatterometer level 2 products, when compared to the in situ measurements. |
| [31] | . http://linkinghub.elsevier.com/retrieve/pii/S0034425715001042 |
| [32] | . Soil moisture is a key state variable in many hydrological processes. The Global Land Data Assimilation System (GLDAS) can produce global and continuous soil moisture data sets which have been used in many applications. In this study, simulated soil moisture from four land surface models (LSM) (Mosaic, Noah, Community Land Model, and Variable Infiltration Capacity) in GLDAS-1 and the more recent GLDAS-2 were evaluated against in situ soil moisture measurements collected from two soil moisture networks located on the Tibetan Plateau at different soil depths. The two networks provide a representation of different climates and land surface conditions on the Tibetan Plateau which can make the evaluation results more robust and reliable. The results show that all the LSMs can well capture the temporal variation of observed soil moisture with the correlation coefficients mostly being above 0.5. However, they all display biases with the surface soil moisture being systematically underestimated in both of two network regions, and the Mosaic model always shows the largest bias that even reaches 0.192 m/m. The causes of the biases were investigated in detail, and we found that the biases may mainly be caused by the soil stratification phenomenon over the Tibetan Plateau. Moreover, errors in model parameters, especially the soil properties data, deficiencies in model structures, and mismatch of the spatial scale and soil depth between LSM simulations and in situ measurements may contribute to the biases as well. Additionally, it was found that GLDAS-2 nearly does not show superior performance than GLDAS-1 over the Tibetan Plateau. |
| [33] | . 61CCI-SM products and SMOS Level-3 SM were evaluated over India with MERRA-L.61Simplitude between spatial distribution of CCI-PAS and CCI-COMBINED noise61CCI-ACT show lowest noise levels over India out of the three CCI-SM products.61SMOS show high noise levels over India but low sensitive to NDVI changes.61MLR shows RFI, NDVI and soil texture affect CCI-SM and SMOS in varying degrees. |
| [34] | . The downward solar or shortwave radiation (SWD) and atmospheric longwave radiation (LWD) play essential roles in controlling alpine environment and ecosystem. Meanwhile, utilization of solar energy has a growing demand by local residents, due to high energy cost in high altitude regions. However, it is always costly for acquiring the radiation data and there are few studies on the radiation modeling in these regions. This paper presented the major characteristics of SWD and LWD over the Tibetan Plateau (TP), which were measured at 11 stations built in the region. The results showed that LWD received by TP is much lower than that of its surrounding areas and their monthly-mean differences can be up to 100 W m 612. On the contrary, SWD over TP is significantly higher than that over its surrounding areas, due to low extinction rate of airmass, water vapor, and aerosol occurred in TP. The recorded maximum value (650.9) of daily-mean transmittances much exceeds the upper bound (650.75) implied in most of the Angstr02m–Prescott models; therefore, these models may under-estimate SWD over TP. One set of surface data-based estimate by a non-Angstr02m–Prescott model and two sets of satellite estimates were also evaluated against the measurements. It is found that the surface data-based estimate, though not calibrated locally, shows a good agreement with the measurements and has an advantage of producing less root-mean-square errors and higher correlation coefficients than the satellite estimates. Under this condition, it is suggested to combine both the surface data-based estimate together with the satellite estimates in order to improve the accuracy of the SWD and LWD data. |
| [35] | |
| [36] | . |
| [37] | . Abstract Lakes are widely distributed on the Mongolian Plateau and, as critical water sources, have sustained Mongolian pastures for hundreds of years. However, the plateau has experienced significant lake shrinkage and grassland degradation during the past several decades. To quantify the changes in all of the lakes on the plateau and the associated driving factors, we performed a satellite-based survey using multitemporal Landsat images from the 1970s to 2000s, combined with ground-based censuses. Our results document a rapid loss of lakes on the plateau in the past decades: the number of lakes with a water surface area >1 km(2) decreased from 785 in the late 1980s to 577 in 2010, with a greater rate of decrease (34.0%) in Inner Mongolia of China than in Mongolia (17.6%). This decrease has been particularly pronounced since the late 1990s in Inner Mongolia and the number of lakes >10 km(2) has declined by 30.0%. The statistical analyses suggested that in Mongolia precipitation was the dominant driver for the lake changes, and in Inner Mongolia coal mining was most important in its grassland area and irrigation was the leading factor in its cultivated area. The deterioration of lakes is expected to continue in the following decades not only because of changing climate but also increasing exploitation of underground mineral and groundwater resources on the plateau. To protect grasslands and the indigenous nomads, effective action is urgently required to save these valuable lakes from further deterioration. |
| [38] | . |
| [39] | . In this study, we analyze the long streamflow series of three hydrological stations of the lower Pearl River basin and the streamflow ratio between Makou and Sanshui stations by using statistical techniques. Furthermore, we also attempt to address influences of precipitation and human activities (human-induced deepening of river channels) on streamflow ratio. The results indicate that: (1) the streamflow variations show remarkable relations with precipitation changes in West and East River basins, implying tremendous influences of climate changes on hydrological processes. Decreasing precipitation was observed in North River basin. However, the streamflow amount of the Sanshui station largely increased due to enlarged streamflow allocation from the West River to the North River; (2) increasing streamflow ratio of Sanshui/(Makou + Sanshui) is the result of morphological changes (downcut) of river channels in the upper Pearl River Delta. The fast downcut of river channels is mainly due to intensive sand mining. Larger magnitude of increase in streamflow ratio corresponds well to the higher intensity of in-channel sand dredging; (3) after late-1990s, decreasing precipitation of the Pearl River basin abates the streamflow amount and also the streamflow ratio. The influences of human activities and climate changes are varying in different time intervals and in different river basins. Due to tremendous impacts of increased streamflow ratio between Sanshui and Makou station, relations between streamflow and precipitation relations in the North River basin are not statistically good. This study helps to improve understandings of the causes underlying altered streamflow variations in the lower Pearl River basin and the hydrological alterations within the Pearl River Delta region. |
| [40] | . |
| [41] | . This guide to estimating daily and monthly actual, potential, reference crop and pan evaporation covers topics that are of interest to researchers, consulting hydrologists and practicing engineers. Topics include estimating actual evaporation from deep lakes and from farm dams and for catchment water balance studies, estimating potential evaporation as input to rainfall-runoff models, and reference crop evapotranspiration for small irrigation areas, and for irrigation within large irrigation districts. Inspiration for this guide arose in response to the authors' experiences in reviewing research papers and consulting reports where estimation of the actual evaporation component in catchment and water balance studies was often inadequately handled. Practical guides using consistent terminology that cover both theory and practice are not readily available. Here we provide such a guide, which is divided into three parts. The first part provides background theory and an outline of the conceptual models of potential evaporation of Penman, Penman???Monteith and Priestley???Taylor, as well as discussions of reference crop evapotranspiration and Class-A pan evaporation. The last two sub-sections in this first part include techniques to estimate actual evaporation from (i) open-surface water and (ii) landscapes and catchments (Morton and the advection-aridity models). The second part addresses topics confronting a practicing hydrologist, e.g. estimating actual evaporation for deep lakes, shallow lakes and farm dams, lakes covered with vegetation, catchments, irrigation areas and bare soil. The third part addresses six related issues: (i) automatic (hard wired) calculation of evaporation estimates in commercial weather stations, (ii) evaporation estimates without wind data, (iii) at-site meteorological data, (iv) dealing with evaporation in a climate change environment, (v) 24 h versus day-light hour estimation of meteorological variables, and (vi) uncertainty in evaporation estimates. <br><br> This paper is supported by a Supplement that includes 21 sections enhancing the material in the text, worked examples of many procedures discussed in the paper, a program listing (Fortran 90) of Morton's WREVAP evaporation models along with tables of monthly Class-A pan coefficients for 68 locations across Australia and other information. |
| [42] | . |
| [43] | . Abstract The variability of soil moisture over East Asia was analyzed using a long-term data set from the Global Land Data Assimilation System. Overall, a clear decreasing trend occurred over a period of 63 ears, with pronounced drying over northeast China, north China, part of Mongolia, and Russia near lake Baikal. Statistical analyses show that decreasing precipitation and global warming have different effects on the decrease in soil moisture. The qualitative analysis and quantitative contributions illustrated that soil drying is driven primarily by decreasing precipitation and is enhanced almost twofold by increasing temperatures. As soil moisture decreases, the positive feedback between soil moisture and temperature may result in future water shortages. Following the Representative Concentration Pathways 8.5 (RCP8.5) and 4.5 (RCP4.5) simulation scenarios of Coupled Model Intercomparison Project phase 5, the model-predicted soil moisture demonstrated a continuously decreasing trend during the 21st century. |
| [44] | . The dryness of terrestrial climate can be measured by the ratio of annual precipitation (P) to potential evapotranspiration (PET), where the latter represents the evaporative demand of the atmosphere, which depends on the surface air temperature, relative humidity, wind speed, and available energy. This study examines how the terrestrial mean aridity responds to global warming in terms of P/PET using the Coupled Model Intercomparison Project phase 5 transient CO2 increase to 2 x CO2 simulations. We show that the (percentage) increase (rate) in P averaged over land is similar to 1.7%/degrees C ocean mean surface air temperature increase, while the increase in PET is 5.3%/degrees C, leading to a decrease in P/PET (i.e., a drier terrestrial climate) by similar to 3.4%/degrees C. Noting a similar rate of percentage increase in P over land to that in evaporation (E) over ocean, we propose a framework for examining the change in P/PET, in which we compare the change in PET over land and E over ocean, both expressed using the Penman-Monteith formula. We show that a drier terrestrial climate is caused by (i) enhanced land warming relative to the ocean, (ii) a decrease in relative humidity over land but an increase over ocean, (iii) part of increase in net downward surface radiation going into the deep ocean, and (iv) different responses of PET over land and E over ocean for given changes in atmospheric conditions (largely associated with changes in temperatures). The relative contributions to the change in terrestrial mean aridity from these four factors are about 35%, 35%, 15%, and 15%, respectively. The slight slowdown of the surface wind over both land and ocean has little impact on the terrestrial mean aridity. |
