 , 王欣, 魏俊峰
Chinese glacial lake inventory based on 3S technology method
YANGChengde, WANGXin, WEIJunfeng通讯作者:
收稿日期:2018-03-5
修回日期:2018-12-15
网络出版日期:2019-03-25
版权声明:2019《地理学报》编辑部本文是开放获取期刊文献,在以下情况下可以自由使用:学术研究、学术交流、科研教学等,但不允许用于商业目的.
基金资助:
作者简介:
-->
展开
摘要
关键词:
Abstract
Keywords:
-->0
PDF (2767KB)元数据多维度评价相关文章收藏文章
本文引用格式导出EndNoteRisBibtex收藏本文-->
1 引言
冰湖是与冰川或冰川作用相关的湖泊,包括冰蚀凹地湖、冰川阻塞湖、冰碛阻塞湖等[1],在中国西部冰川作用区广泛分布。作为冰川变化与气候变化的敏感因子之一,冰湖能够有效地指示气候变化状况[2,3,4],对于深入了解气候变化与冰川变化之间的响应过程、认识冰川作用区水资源状况及灾害等研究意义重大,日益引起研究者的关注。然而,现有冰湖的定义由于其时空概念等的模糊性不利于冰湖编目的实际操作,近年来姚晓军等[5]面向冰湖编目和冰湖灾害的研究,尝试从冰湖识别的角度建立冰湖分类体系,在一定程度上有利于统一冰湖识别规范和提高不同冰湖编目数据之间的可对比性。陆地卫星Landsat数据因其覆盖范围广、有效数据周期长、数据易获取等特性,成为获取冰湖动态变化信息的重要数据来源和技术手段。近年来,基于遥感影像的冰湖边界提取方法主要分为人工目视解译和计算机自动提取两大类。其中,人工目视解译法主要利用图像纹理与颜色等特征识别冰湖,因其操作的简易性与提取结果的高精度等特征被广泛应用于喜马拉雅山[6,7]、朋曲流域[8]、波曲流域[9]、柯西流域[10]、印度—喜马拉雅山[11]、青藏高原[3, 12]、玻利维亚安第斯山[13]、乌兹别克斯坦[14]及不丹[15]等区域的冰湖编目中。而计算机自动提取技术主要运用不同的算法如水体指数、事件树、波谱变换、阈值法、分步迭代等从遥感数据中获取冰湖边界信息,在天山[16]、横断山[17]、巴颜喀拉山[18]、喜马拉雅山[19,20]、塔里木河流域[2]、瑞士阿尔卑斯山[21]、尼泊尔[22,23,24,25]、秘鲁[26]等地区的冰湖编目中得到广泛应用。
然而,已有的研究大多着眼于特定流域与山脉的冰湖面积、水位变化及冰湖溃决事件,由于冰湖分布区域的特征差异及研究者关注点的不同,各地区冰湖编目数据的阈值选取、属性收录、边界提取方法及影像选取时相等各异,导致研究者对于中国冰湖的整体分布与变化特征尚缺乏全面了解。因此,为深入了解中国冰湖的分布、变化及其影响,亟待一套基于统一规范的、相对完善的、覆盖中国冰川作用区的冰湖编目数据库。本文基于159景Landsat 8 OLI卫星遥感影像,采用人工目视解译的方法,在研制一整套冰湖编目规范的基础上,开展中国冰湖调查与编目工作,为相关科研工作者与政府决策者提供一套基于统一规范的中国冰湖编目数据库。
2 数据与方法
2.1 数据
冰湖编目中使用的数据主要包括Landsat 8 OLI影像、数字高程模型数据及中国第二次冰川编目数据等。Landsat 8不仅继承原有Landsat 7卫星的基本特点,同时增加了多个波段,提高了光谱分辨率,能够有效地区分不透水信息与水体信息,并且对地物信息细节的显示效果更佳,有利于使用目视解译的方法提取地物信息。此外,为保证冰湖边界的提取精度和准确度,选用的Landsat 8 OLI影像应满足如下的条件:① 单景影像的云量应低于10%;② 影像拍摄时间为2015年,当某些区域该年份影像缺失时或质量不高,选取临近1~2年的影像代替;③ 优先选取夏秋季节(6-11月)的影像数据,以尽量避免冰湖面积受季节变化的影响。基于上述原则,从中国地理空间数据云网站(http://www.gscloud.cn/)共获取159景空间分辨率为30 m的Landsat8 OLI影像,其中,时相为夏秋季节的影像占总影像数量的86.8%(图1)。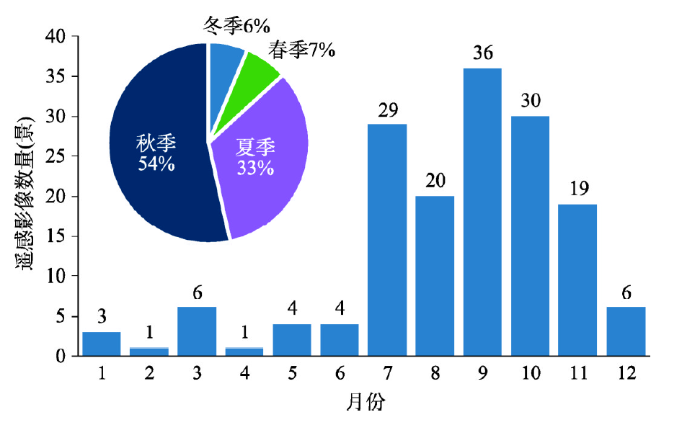 显示原图|下载原图ZIP|生成PPT
图1中国冰湖编目选取遥感影像数量
-->Fig. 1Remote sensing images used in the Chinses glacial lake inventory
-->
数字高程数据(DEM)为30 m空间分辨率(1″)的SRTM数据(http://imagico.de/map/ demsearch.php),用于提取冰湖对应的高程信息。在提取冰湖的高程信息时,选取冰湖边界所在质心点的高程值作为冰湖的高程。中国第二次冰川编目数据主要用于辅助判断冰湖类型、补充冰湖所处区域的属性信息等,数据来源于“寒区旱区科学数据中心”(http://westdc.westgjs.ac.cn)。
2.2 方法
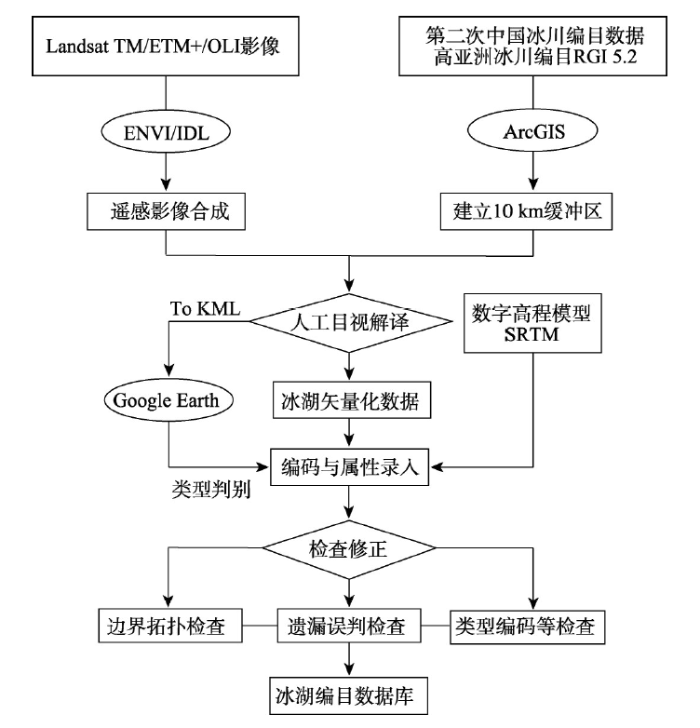
文中采用人机交互式的目视解译方法开展中国冰湖编目,编目流程主要包括规范制定、数据预处理、边界提取、属性录入及检查修正等多个环节(图2)。由于人工目视解译容易受到不同操作人员的专业知识水平和主观意识等方面的影响,为保证冰湖边界提取标准的一致性,对冰湖边界提取制定如下规范:① 判别标准,提取冰湖边界时,轮廓线向纯像元外扩充的距离应该小于或等于相邻混合像元的一半;② 面积阈值,选取4个纯像元作为冰湖的最小阈值单元;③ 编目范围,提取中国第二次冰川编目中距离冰川末端10 km缓冲区范围内的湖泊。编目中主要录入冰湖编码、冰湖空间位置、冰湖表征属性、遥感影像来源、母冰川等5类属性信息。其中,① 冰湖编码参照美国雪冰数据中心制定的冰川编码方式,基于冰湖质心点所在的位置对冰湖编码,其编码格式为:GLmmmmmmEnnnnnN,其中m、n分别表示冰湖质心点经、纬度值乘1000之后的结果,当经度值的整数位为两位时在前面补零;GL为Glacial Lake的缩写,E、N分别代表东经和北纬。② 冰湖空间位置信息包括地理坐标位置和区域位置两类:地理坐标位置为冰湖质心点的经纬度坐标和以冰湖质心点为中心、半径为30 m的缓冲区从SRTM中提取的高程平均值;区域位置包括冰湖所在的流域、山脉、省区及城市等信息,与冰湖所属母冰川的信息一致。③ 冰湖表征属性包括冰湖类型、面积及周长等属性信息;冰湖分类结合遥感影像与Google Earth的三维地形数据,通过判断冰湖所处位置的地形条件能否接收到附近冰川的融水补给将其划分为冰川补给湖与非冰川补给湖两类,根据与冰川末端之间的距离不同又可将冰川补给湖进一步划分为3个亚类:① 冰面湖,是指发育/生成于冰川表面的湖泊;② 冰川接触湖,是指发育于冰川末端,并且与冰川末端直接接触的湖泊;③ 非接触型冰川补给湖,是指冰川能够直接补给,并且未与冰川末端直接接触的湖泊;面积与周长基于统一得到投影与地理坐标系统计算得出,为保证面积的不变性,采用GCS_WGS_1984地理坐标系统和Asia_North_Albers_Equal_Area_Conic投影系统;高程信息取以冰湖质心点为中心、半径为30 m的缓冲区从SRTM中提取的高程平均值。④ 影像信息即提取冰湖边界时使用的影像信息,包括影像编号及拍摄时间。⑤ 母冰川信息为形成或/和补给冰湖的冰川编码。
本文主要参照Hanshaw等[26]提出的估算冰湖面积误差的方法,即假设解译造成的面积误差符合高斯分布,首先用冰湖周长(P)除以影像分辨率(G)得出冰湖边缘的像元数量;之后将边缘像元数量乘以0.6872,即假设约69%(1
式中:Error为最大面积误差;P为冰湖周长(m);G为遥感影像的空间分辨率(30 m);
 显示原图|下载原图ZIP|生成PPT
图2中国冰湖编目流程图
-->Fig. 2Flow chart of the Chinese glacial lake inventory
-->
3 结果
3.1 冰湖规模结构特征
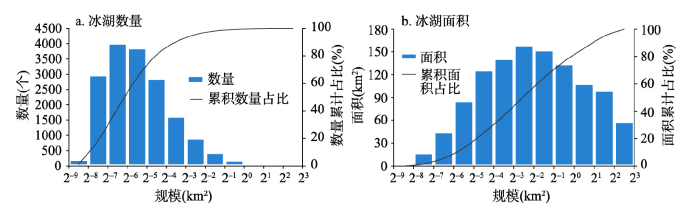
2015年中国共分布有冰湖17300个,单个冰湖面积介于0.0036~5.83 km2,总面积1132.83±147.449 km2。不同规模的冰湖在数量和面积上呈现出不同的特征。其中,面积小于2-4 km2的冰湖在数量上占据主导地位,共有13976个,约占中国总数量的80.8%;相反,面积上则以2-4 km2以上规模的冰湖为主(856.48±71.09 km2),约占中国冰湖总面积的75.6%。从数量上来看,中国冰湖规模与数量之间大致表现为反比的关系,但不同规模的冰湖数量差异显著,数量累计比重曲线在规模小于2-2 km2时呈现出快速上升的趋势,之后逐渐趋于平缓,其中规模介于2-7~2-5 km2范围内的冰湖数量最多(7895个),约占中国冰湖总数量的45.6%(图3a)。面积上,中国冰湖的规模结构大致呈现近似正态分布的特征,其累计百分比曲线随规模的增大而呈现出近似线性增加的趋势,规模介于2-4~20 km2的冰湖面积分布最广(588.75±60.41 km2),约占中国冰湖总面积的52.0%;其中,规模大于20 km2的冰湖对于面积的贡献尤为突出,此规模范围内的冰湖仅占总数量的0.8%(133个),但其面积约267.73±10.67 km2,占总面积的23.6%(图3b)。
 显示原图|下载原图ZIP|生成PPT
图3中国西部冰湖规模结构
-->Fig. 3Size structure of glacial lakes in western China
-->
3.2 冰湖类型结构特征
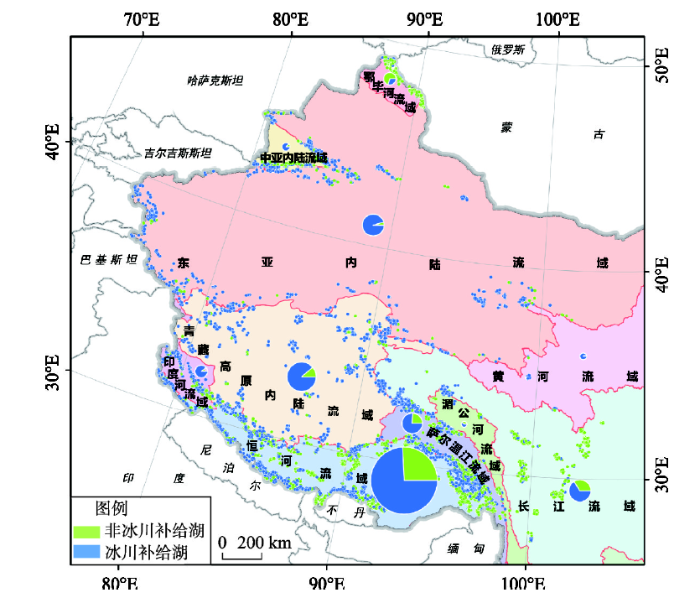
冰川补给湖在中国西部广泛分布,当前共有11501个,面积约845.41±100.96 km2,分别占中国冰湖总面积的74.6%和总数量的66.5%;非冰川补给湖仅5799个,面积约287.42±46.53 km2(图4),且主要分布于念青唐古拉山、喜马拉雅山、横断山、冈底斯山及阿尔泰山等地区,其中,念青唐古拉山是中国西部非冰川补给湖最为发育的地区,约占该类冰湖总面积的40.6%(116.63±17.96 km2)。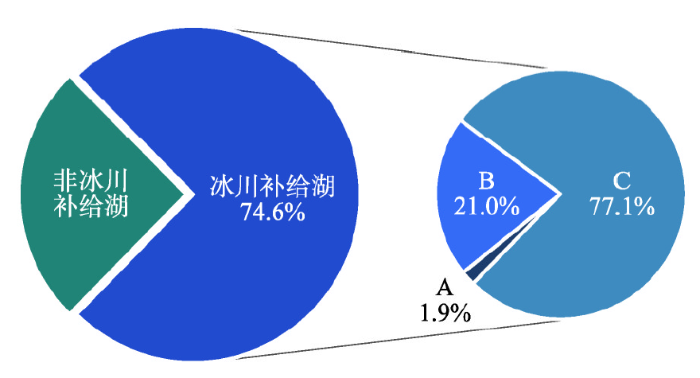 显示原图|下载原图ZIP|生成PPT
图4中国西部冰湖类型结构
-->Fig. 4Type structure of glacial lakes in western China
-->
此外,在冰川补给湖的3个亚类中,非接触型冰川补给湖在中国的分布数量最多(9841个)、面积最大(652.08±82.55 km2),分别占中国冰湖总面积的57.6%、总数量的56.9%;冰川接触湖的平均规模最大(约为0.14±0.01 km2),共有177.48±15.78 km2,约占总面积的15.7%,但仅占总数量的7.3%(1271个);冰面湖分布最少,仅占总面积的1.4%(15.85±2.62 km2)和数量的2.2%(389个)。
3.3 不同水系分布特征
参照国际冰川流域编目规范,将中国冰湖分布区划分为10个一级流域。当前中国内流区和外流区分别分布有冰湖4478个和12822个,对应面积分别为255.88±34.45 km2(22.6%)和876.95±113.04 km2(77.4%)(表1),即外流区的冰湖数量约为内流区的2倍,而其冰湖面积是内流区冰湖面积的近4倍。中国冰湖的整体规模较小,其中内流区冰湖的平均规模为0.06±0.01 km2,而外流区冰湖的平均规模为0.07±0.01 km2。Tab. 1
表1
表1中国西部不同水系的冰湖分布
Tab. 1Distribution of glacial lakes in different basins of western China
| 流域分区 | 流域代码 | 流域名称 | 面积(km2) | 数量(个) | 平均规模(km2) |
|---|---|---|---|---|---|
| 内流区 | 5X | 中亚内陆流域 | 15.39±2.73 | 410 | 0.04±0.01 |
| 5Y | 东亚内陆流域 | 92.26±12.07 | 1602 | 0.06±0.01 | |
| 5Z | 青藏高原内陆流域 | 148.23±19.65 | 2466 | 0.06±0.01 | |
| 合计 | 255.88±34.45 | 4478 | 0.06±0.01 | ||
| 外流区 | 5A | 鄂毕河流域 | 32.47±5.44 | 658 | 0.05±0.01 |
| 5J | 黄河流域 | 11.37±1.17 | 159 | 0.07±0.01 | |
| 5K | 长江流域 | 91.09±13.66 | 1985 | 0.05±0.01 | |
| 5L | 湄公河流域 | 8.85±1.53 | 211 | 0.04±0.01 | |
| 5N | 萨尔温江流域 | 77.68±11.45 | 1437 | 0.05±0.01 | |
| 5O | 恒河-雅鲁藏布江流域 | 622.42±75.55 | 7898 | 0.08±0.01 | |
| 5Q | 印度河流域 | 33.06±4.25 | 474 | 0.07±0.01 | |
| 合计 | 876.95±113.04 | 12822 | 0.07±0.01 | ||
| 总计 | 1132.83±147.49 | 17300 | 0.07±0.01 | ||
新窗口打开
如图5所示,10个一级流域中,中国境内的恒河—雅鲁藏布江流域(5O)冰湖分布最广,数量(7898个)和面积(622.42±75.55 km2)分别占对应总量的48.7%和57.0%,其次为青藏高原内流区(5Z),其数量(2466个)和面积(148.23±19.65 km2)分别占总量的14.3%和13.1%,是中国内流区冰湖发育最多的流域(表1)。黄河流域是中国冰湖分布最少的流域,仅占冰湖总数量的0.9%(159个)和总面积的1.0%(11.37±1.17 km2);湄公河流域是中国冰湖面积最少的流域,仅存冰湖面积8.85±1.53 km2,约占总面积的0.8%,平均规模仅0.04±0.01 km2。
 显示原图|下载原图ZIP|生成PPT
图5中国西部各流域冰湖分布状况
-->Fig. 5Glacial lake distribution in major river basins of western China
-->
3.4 不同山脉分布特征
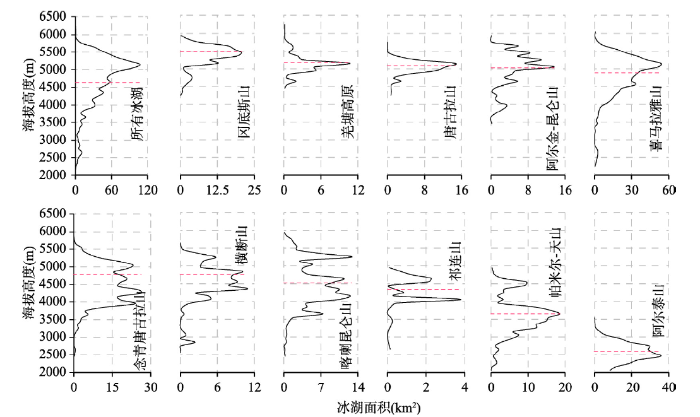
念青唐古拉山是中国冰湖分布最广泛的区域,不仅冰湖数量最多(4016个),面积也最广(320.96±40.06 km2),分别占中国冰湖各自总量的28.3%和23.2%;喜马拉雅山分布有冰湖3603个,面积达299.62±33.87 km2,分别占各自总量的20.8%和26.4%,仅次于念青唐古拉山,同时两地的冰湖平均规模约0.08±0.01 km2,为中国较大冰湖集中分布的区域。阿尔金山相对海拔较低,山体较小,无法为冰湖的发育提供有效的积累空间,是中国冰湖分布最少且平均规模最小的山脉,仅有冰湖34个,覆盖面积约0.65±0.15 km2。各山脉在2000~6500 m的高程范围内均有冰湖分布,且主要集中分布于4000~6000 m的高程范围内(图6),约占冰湖总数量的88.3%(13817个),占冰湖总面积的86.1% (975.06±128.83 km2)。不同山脉冰湖分布的平均海拔整体上呈现出自北向南递增和自西向东递减的趋势,其中自西向东递减的趋势可分为南北两支,北支的平均海拔自阿尔金—昆仑山(5027 m)递减至祁连山(4338 m),南支主要位于青藏高原地区,自冈底斯山脉(5493 m)一侧经念青唐古拉山(4787 m)递减至横断山附近(4754 m),且南支的递减幅度较北支略小。另外,中国冰湖面积分布的平均海拔约为4630 m,除阿尔泰山及天山的冰湖几乎全部分布于4000 m以下外(约占冰湖总面积的6.8%),其余地区的冰湖面积均在4500~5500 m的高程范围内呈现出明显的峰值。此外,各山脉冰湖分布的相对高差不一,尤以念青唐古拉山、喜马拉雅山、横断山及昆仑山相对高差最大,但总体而言,中国冰湖分布的最低海拔约为2167 m,最高海拔约6547 m,海拔6000 m以上的冰湖分布较少,仅分布于羌塘高原和喜马拉雅山。
 显示原图|下载原图ZIP|生成PPT
图6中国西部冰湖垂向分布(虚线为冰湖分布的平均海拔)
-->Fig. 6Altitudinal distribution of glacial lakes in western China (The red solid line is the average distribution elevation of glacial lakes)
-->
4 讨论
4.1 冰湖界定与解译方法
由于目前对冰湖的定义及其分类体系存在很大的争议,不同****及部门机构的冰湖编目数据的可比性较低[5]。基于实际应用研究的视角,文中采用《冰冻圈科学辞典》[1]中对于冰湖的定义,强调现代冰川在冰湖形成中的作用,但由于冰川作用与湖泊补给源等信息很难基于遥感影像直接识别出来,导致实际分类结果与理论分类体系很难一一对应。因此,预先设定现代冰湖的分布范围是冰湖编目通常做法,操作上,研究者主要通过设定冰湖分布的最低海拔[14, 27]和冰湖与现代冰川末端的距离阈值[3, 15, 16, 20, 28-29]来确定,两者本质上都是基于现代冰川的作用范围来确定冰湖的可能分布范围。以最低海拔为阈值定义冰湖编目范围的做法一般与区域的气候背景密切相关,如Mool等[27]以海拔3000 m为喜马拉雅山南坡冰湖编目的最低海拔,Petrov等[14]取1500 m为乌兹别克斯坦冰湖编目的最低海拔。相对而言,由于冰川末端与现代气候背景一致,以冰川末端为基准划定一定的范围作为冰湖编目范围的做法,能够根据局地区域的现代气候背景差异(即冰川末端高度差异)建立与局地区域气候背景相一致冰湖编目范围,适合大区域尺度的冰湖编目。如研究者在对喜马拉雅山[30]及横断山[17]等地区进行冰湖编目时,以小冰期以来的冰川作用范围(大致为现代冰川末端10 km的范围内)开展冰湖编目;张国庆等[3]通对比现代冰川作用区不同范围内的冰湖分布状况,分别就冰川边界2 km、5 km、10 km、20 km缓冲区进行讨论,距离冰川末端10km的范围是较为合理的冰湖编目区。因此,本文中使用中国第二次冰川编目数据集作为现代冰川的边界,并提取该边界向外10 km范围内的冰湖作为编目的基础数据。冰湖边界矢量化是研究冰湖分布与变化情况的基础,但由于冰湖分布区地形复杂、冰川广布,冰湖与光谱相近的山体阴影及冰川、积雪等信息容易混淆,基于遥感影像的冰湖边界信息的提取在一定程度上受到限制。近年来众多****基于包括地形图、航拍数据、遥感影像等多种数据[14-15, 31-35],就冰湖信息的提取方法展开了广泛的研究。其中,冰湖边界自动识别算法具有能够节省面积提取过程中的时间消耗、避免操作人员的主观性影响、能有效识别影像中目标信息与背景信息反差较大的地物边界等优势,一般适用于对中小尺度区域较大面积目标地物的提取。但对于冰湖这类整体面积较小且分散分布的地物提取难度较大,并且容易与周围的阴影、积雪等地物信息混淆,在自动提取后仍需大量的人工检验与修正工作。相比之下,人工目视解译能够灵活的适应区域尺度大、背景信息复杂、影像质量差异较大的编目工作,并可通过专家知识很好地控制阴影、积雪、冰川及云层遮挡等不利因素对冰湖提取的影响,因此精度更高、更有利于误差的系统检查与修正,相对更适合大区域尺度的冰湖编目。
此外,由于区域覆盖范围广、山地广布、地形复杂、多冰川积雪覆盖,对冰湖边界的准确识别非常不利;尤其是冰湖多分布于山谷等低洼地区,周围山体的阴影对冰湖边界提取的影响十分突出,自动化提取多采用DEM等高程数据生成山体阴影掩膜[21, 36-38],并使用全局或自适应的阈值去除阴影的影响,可见阴影与冰湖信息的区分完全取决于阈值设定的准确程度,而为地形结构复杂的研究区设定合理的阴影阈值是极其复杂的,并且所需数据量与计算量均偏大。而人工目视解译可以通过采用不同的波段组合,通过结合Google Earth相应年份的三维地形数据,能够有效区分阴影与冰湖,从而大量减少积雪、冰川和云层遮挡等不利因素对冰湖边界提取的影响。因此尽管人工目视解译耗时耗力,且对操作人员专业背景要求较高,但在现有影像质量下并保证操作规范的一致性和进行系统的误差控制条件下,能够获得更高精度的冰湖边界,更适用于本文研究区的冰湖边界提取。
4.2 冰湖边界提取误差
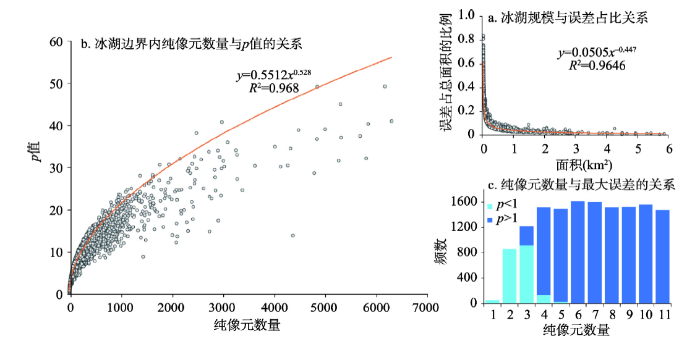
由于冰湖广泛分布于冰川作用区,地形复杂、自然环境恶劣,且分布分散,无法开展普遍的实地调查研究。随着遥感技术在冰湖研究中的大量应用,研究者就高亚洲及其他地区的冰湖识别与边界提取的研究中,通过一些半定量化的方法估算出湖泊面积的误差范围。一般而言,基于遥感影像目视解译地物信息的精度主要与操作人员的经验、遥感影像本身的质量(包括积雪覆盖、云量、阴影、几何配准与大气校正等)及分类阈值等有关[3, 36, 39-41]。另外,尽管冰湖面积存在明显地季节性差异,但由于选取的卫星遥感影像中约有84.3%拍摄时间集中于7-11月,冰湖面积相对处于年内最大的时期,对于研究大尺度、长时间序列的冰湖变化的影响不大。一般而言,冰湖边界提取的误差与影像的空间分辨率相关,研究认为冰湖边界提取的误差为边界上的像元面积之和的一半[39, 42]。本文在评估冰湖边界提取误差的过程中发现,误差面积占冰湖总面积的比重与冰湖面积之间呈现出较为明显的幂指数关系,冰湖规模越小误差面积占比越大(图7a)。单个冰湖面积误差可以通过其纯像元面积与边界像元面积的比值p来表征,p值与确定冰湖面积(纯像元)之间呈现出乘幂关系(图7b),p值越大误差越小,因此以p = 1(即最大误差面积为50%)为界可以将冰湖按照边界提取的误差大小大致划分为两类(图7c)。因此,从误差大小的角度,取4个纯像元作为冰湖提取的最小阈值,即冰湖编目面积阈值为0.0036 km2较为合理。最终,冰湖编目的绝对误差面积为±147.49 km2,占中国冰湖总面积的±13.0%。
 显示原图|下载原图ZIP|生成PPT
图7冰湖面积提取误差估算
-->Fig. 7Error estimation of glacial lake area extraction
-->
4.3 冰湖分布影响因素
中国冰湖的发育及其分布特征与地形地貌、气候环境及冰川状况等要素紧密相关。由编目结果可知,中国冰湖集中分布于恒河—雅鲁藏布流域等青藏高原南部地区。青藏高原位于亚洲中部,平均海拔4000 m以上,总面积约2.5×10⁶ km2,是中国最大、世界上最高的高原[43,44],面积广阔、地形复杂,其南部地区喜马拉雅山、念青唐古拉山、横断山等高大山体纵横分布,地形起伏大、相对海拔高,为冰川和冰湖的发育提供了十分有利的发展空间。另外,受印度季风环流、东亚季风环流、西风环流及局部山地环流等大气环流的共同作用,气候类型复杂多样且季节性显著,降水集中于夏秋季节(6-9月),尤其是青藏高原南部地区受印度季风暖湿气流和东亚季风的影响,雨热同期、水热充足,春季的积雪融化和夏季高温下的冰川消融为冰湖的发育提供了充足的补给来源,是中国冰湖面积分布最广、最为密集的区域。从垂直方向上来看,中国冰湖与冰川的分布特征基本趋于一致,均呈现出自北向南递增和自西向东递减的趋势,并且冰湖的跨度范围(2000~6500 m)略小于冰川(2000~8500 m)。其中,中国冰湖面积集中的海拔范围与冰川集中范围基本一致,大致在4500~6000 m之间,但受温度的影响,中国冰湖分布的最高海拔(~6247 m)低于冰川分布的上界海拔(7000 m以上);从水平方向来看,中国冰川集中分布于内流区,而冰湖则在外流区广泛分布,由此可见,大量的冰川分布仅是冰湖发育与扩张的一个必要条件,二者并不是正相关的关系,气温升高、积雪融水增加、冻土消融、降水量的增加和蒸发量的减少等因素均有利于冰湖的发育与扩张[45,46]。
在当前气候变暖的背景下,大量冰川随着气温的升高和降水的增加不断退缩,大量的物质损失为冰湖的形成和扩张提供了丰富的补给来源。冰川在退缩的过程中不仅会增加融水量,而且为冰前湖、冰川侵蚀湖[5]等冰川补给型湖泊的发育与扩张提供了有利地发展空间[29, 47-48]。张国庆等[49]基于第二次中国冰川编目数据发现,1970-2010年间青藏高原不同流域的冰川以9.5%~26%不等的速率呈现出明显地缩减,其中恒河—雅鲁藏布江流域和黄河流域的冰川面积缩减率均高达26%。可见冰湖的发育不仅与冰川数量与面积有关,并且与冰川的消融速度相关,冰川数量越多、规模越大、消融越快则越有利于冰湖的发育与扩张。此外,有表碛覆盖的冰川由于存在差异性消融,更有利于冰湖(尤其是冰面湖)的形成与扩张[50]。中国表碛覆盖型冰川最为集中的流域中除中亚内陆流域(5X0)冰湖面积和数量较少外,恒河—雅鲁藏布流域(5O)及塔里木河流域(5Y6)分别是中国内流区和外流区冰湖分布最广的流域。
中国西部地区冰湖分布的区域差异显著、较小规模的冰湖(< 2-4 km2)数量众多,对气候变化的响应往往更为敏感、变化也更加剧烈,能够有效地反映区域气候与冰川的变化,对区域环境及生态循环的研究有十分重要的作用[3]。研究表明,由于与冰川接触关系及其距离的不同,不同类型的冰湖能够指示不同的气候变化信号。如冰川接触湖能够指示区域温度的变化趋势,非接触型冰川补给湖则能够有效反映区域降水、气温等综合变化情况,而非冰川补给湖的补给主要来源于降水,因此,对于区域降水的变化十分敏感[2]。并且已有的冰湖研究表明[16, 19, 29, 31, 49, 51-52],尽管中国西部各区域的冰湖面积变化模式与速度各异,但总体以扩张趋势为主;而冰湖的持续扩张可能会使得冰湖(尤其是冰碛湖)的潜在危险性增加,在一定条件下,可能会诱发冰湖溃决灾害,对下游居民的生产与生活造成严重的威胁[4, 13, 53-54]。因此,为深入研究中国冰湖时空变化特征、冰湖溃决灾害及其与气候、冰川等要素之间的耦合关系等研究,团队将加强冰湖遥感调查,完成多期冰湖编目数据库建设,进一步分析中国冰湖的变化特征。
5 结论
基于159景Landsat 8 OLI遥感影像,结合Google Earth三维影像数据、中国第二次冰川编目数据及SRTM等数据,建立一整套基于3S技术的冰湖编目规范,完成中国2015年冰湖编目数据库。结果显示,当前中国共有冰湖17300个,总面积约1132.83±147.449 km2,数量上以较小规模的冰湖(< 2-4 km2)为主,约占冰湖总数量的80.8%,2-4 km2以上规模的冰湖在面积上占据主导地位,约占总面积的75.6%(856.48±71.09 km2)。在不同类型的冰湖中,冰川补给湖在数量和面积上均占绝对优势,分别占中国冰湖总面积的74.6%和总数量的66.5%。冰湖空间分布差异显著,外流区冰湖数量和面积远大于内流区,约54.9%的冰湖面积集中于恒河—雅鲁藏布江流域;从垂直方向上来看,88.3%(15278个)的冰湖分布于4000~6000 m之间,该范围的冰湖面积占中国冰湖总面积的86.1%(975.06±128.83 km2),其中5000~5500 m的高程范围内冰湖面积分布最为集中,约占总面积的36.7%(415.58±55.33 km2)。
中国西部广泛分布的高大山体和冰川为冰湖发育提供了基础条件,当前气候变暖背景下大量冰川退缩减薄,所产生的冰川物质损失及冰川退缩后形成的洼地为冰湖的发育与扩张提供了充足的补给水源与发展空间。为深入研究冰湖分布与变化的时空异质性、相关灾害与影响及其与其他要素之间的耦合关系,未来应进一步加强冰湖的连续监测与编目工作。
致谢:陈诗音、彭鑫、黄容、李悦佳、朱晓曦、向李丽、易颖、刘艳玲、符永悄等先后在冰湖目视解译、修订和检查工作中付出了辛勤劳动,在此对上述人员表示谢忱!
The authors have declared that no competing interests exist.
参考文献 原文顺序
文献年度倒序
文中引用次数倒序
被引期刊影响因子
| [1] | |
| [2] | . |
| [3] | . 61The first glacier lake inventory across the Third Pole was developed.61Glacial lakes were primarily located in Brahmaputra (39%), Indus (28%), and Amu Darya (10%) basins.61Glacier-fed lakes showed faster expansion than non-glacier-fed lakes.61Glacier-melt water may play a dominant source for most glacial lake expansion from 1990–2010. |
| [4] | . 中国科学院机构知识库(CAS IR GRID)以发展机构知识能力和知识管理能力为目标,快速实现对本机构知识资产的收集、长期保存、合理传播利用,积极建设对知识内容进行捕获、转化、传播、利用和审计的能力,逐步建设包括知识内容分析、关系分析和能力审计在内的知识服务能力,开展综合知识管理。 . 中国科学院机构知识库(CAS IR GRID)以发展机构知识能力和知识管理能力为目标,快速实现对本机构知识资产的收集、长期保存、合理传播利用,积极建设对知识内容进行捕获、转化、传播、利用和审计的能力,逐步建设包括知识内容分析、关系分析和能力审计在内的知识服务能力,开展综合知识管理。 |
| [5] | . 冰川湖泊(简称冰湖)不仅是高山区重要的水资源,而且是许多冰川灾害的孕育者和发源地,在冰冻圈科学、气候变化和山地灾害研究中具有重要地位。本文系统讨论了现有冰湖定义及存在的问题,从冰湖编目和冰湖灾害研究视角提出冰湖的定义,指出现有冰湖研究主要是基于"以现代冰川融水为主要补给源或在冰碛垄洼地内积水形成的天然水体"这一冰湖定义的。同时,从冰湖形成机理、地貌形态和空间分布位置将冰湖划分为冰川侵蚀湖(冰斗湖、冰川槽谷湖和其他冰川侵蚀湖)、冰碛阻塞湖(终碛阻塞湖、侧碛阻塞湖、冰碛垄热融湖)、冰川阻塞湖(冰川前进阻塞湖和其他冰川阻塞湖)、冰面湖、冰下(内)湖和其他冰川湖6大类及8个亚类,并给出各冰湖类型相应的遥感判识指标和定量指标,以期建立具有普适性和可操作性的冰湖分类体系。 . 冰川湖泊(简称冰湖)不仅是高山区重要的水资源,而且是许多冰川灾害的孕育者和发源地,在冰冻圈科学、气候变化和山地灾害研究中具有重要地位。本文系统讨论了现有冰湖定义及存在的问题,从冰湖编目和冰湖灾害研究视角提出冰湖的定义,指出现有冰湖研究主要是基于"以现代冰川融水为主要补给源或在冰碛垄洼地内积水形成的天然水体"这一冰湖定义的。同时,从冰湖形成机理、地貌形态和空间分布位置将冰湖划分为冰川侵蚀湖(冰斗湖、冰川槽谷湖和其他冰川侵蚀湖)、冰碛阻塞湖(终碛阻塞湖、侧碛阻塞湖、冰碛垄热融湖)、冰川阻塞湖(冰川前进阻塞湖和其他冰川阻塞湖)、冰面湖、冰下(内)湖和其他冰川湖6大类及8个亚类,并给出各冰湖类型相应的遥感判识指标和定量指标,以期建立具有普适性和可操作性的冰湖分类体系。 |
| [6] | . The first phase of Sino-Nepalese Joint Expedition of Glacial lake Outburst Flood to theCentral Section of Xizang Himalayas was carried out in 1987. . The first phase of Sino-Nepalese Joint Expedition of Glacial lake Outburst Flood to theCentral Section of Xizang Himalayas was carried out in 1987. |
| [7] | . Glacial lake outburst floods (GLOFs) are a unique type of natural hazard in the cryosphere that may result in catastrophic fatalities and damages. The Himalayas are known as one of the world's most GLOF-vulnerable zones. Effective hazard assessments and risk management require a thorough inventory of historical GLOF events across the Himalayas, which is hitherto absent. Existing studies imply that numerous historical GLOF events are contentious because of discrepant geographic coordinates, names, or outburst time, requiring further verifications. This study reviews and verifies over 60 historical GLOF events across the Himalayas using a comprehensive method that combines literature documentations, archival remote sensing observations, geomorphological analysis, and field investigations. As a result, three unreported GLOF events were discovered from remote sensing images and geomorphological analysis. Eleven suspicious events were identified and suggested to be excluded. The properties of five outburst lakes, i.e., Degaco, Chongbaxia Tsho, Geiqu, Lemthang Tsho, and a lake on Tshojo Glacier, were corrected or updated. A total of 51 GLOF events were verified to be convincing, and these outburst lakes were classified into three categories according to their statuses in the past decades, namely disappeared (12), stable (30), and expanding (9). Statistics of the verified GLOF events show that GLOF tended to occur between April and October in the Himalayas. We suggest that more attention should be paid to rapidly expanding glacial lakes with high possibility of repetitive outbursts. This study also demonstrates the effectiveness of integrating remote sensing and geomorphic interpretations in identifying and verifying GLOF events in remote alpine environments. This inventory of GLOFs with a range of critical attributes (e.g., locations, time, and mechanisms) will benefit the continuous monitoring and prediction of potentially dangerous glacial lakes and contribute to outburst-induced risk assessments and hazard mitigations. |
| [8] | . 全球气候变暖,青藏高原冰川普遍处于退缩趋势,由此引发的冰湖溃决洪水的灾害也随之增加.通过对2000/2001年度卫星遥感数据解译结果和1987年国际联合考察的朋曲流域冰湖溃决洪水结果的分析,研究了近20a来朋曲流域内冰湖的变化.结果显示,该流域中的冰湖数量有减少,但冰湖的面积却在增加,这是同期全球气候变暖的结果.在提供了冰湖编目数据的基础上,识别了有潜在危险的冰湖,为冰湖溃决洪水早期预警系统提供了科学依据. . 全球气候变暖,青藏高原冰川普遍处于退缩趋势,由此引发的冰湖溃决洪水的灾害也随之增加.通过对2000/2001年度卫星遥感数据解译结果和1987年国际联合考察的朋曲流域冰湖溃决洪水结果的分析,研究了近20a来朋曲流域内冰湖的变化.结果显示,该流域中的冰湖数量有减少,但冰湖的面积却在增加,这是同期全球气候变暖的结果.在提供了冰湖编目数据的基础上,识别了有潜在危险的冰湖,为冰湖溃决洪水早期预警系统提供了科学依据. |
| [9] | . 西藏聂拉木县波曲流域内分布有大量的冰川和冰湖,通过对2000/2001年度遥感数据解译并与1987年的数据对比,发现近15 a来该流域内的冰川面积、冰湖数量和面积等均发生了巨大的变化,结果表明:冰川总面积减小了20%,>0.020 km<sup>2</sup>的冰湖数量增加了11%,冰湖面积增加了47%.其中位于西夏邦马峰东侧的嘎龙错和扛西错最为典型,面积分别增加了104%和118%.2005年夏季野外考察对以上资料进行了核实.在全球气候变暖的趋势下,预计该流域内的冰川面积将进一步缩小,冰湖数量在小幅增加后将会出现大规模的冰湖溃决,导致严重的泥石流灾害. . 西藏聂拉木县波曲流域内分布有大量的冰川和冰湖,通过对2000/2001年度遥感数据解译并与1987年的数据对比,发现近15 a来该流域内的冰川面积、冰湖数量和面积等均发生了巨大的变化,结果表明:冰川总面积减小了20%,>0.020 km<sup>2</sup>的冰湖数量增加了11%,冰湖面积增加了47%.其中位于西夏邦马峰东侧的嘎龙错和扛西错最为典型,面积分别增加了104%和118%.2005年夏季野外考察对以上资料进行了核实.在全球气候变暖的趋势下,预计该流域内的冰川面积将进一步缩小,冰湖数量在小幅增加后将会出现大规模的冰湖溃决,导致严重的泥石流灾害. |
| [10] | . 冰湖是高山寒区气候变化的灵敏指示器和诱发山地溃决洪水或泥石流的灾害源。基于1960s—2010s多源遥感影像数据(Corona、Landsat MSS/TM/ETM+OLI)、地形图、冰川编目和气象数据,利用RS和GIS技术综合分析科西河流域近50年冰湖(≥0.05 km2)时空变化特征及其对冰川变化影响。研究结果表明:(1)近50年来科西河流域冰湖整体经历了“先平稳后扩张”的过程,其中1960s至1980s初期,科西河流域有37个冰湖消失,但总面积趋于平稳状态;1980s中期至2010s初期,流域内冰湖规模迅速扩张,且2000s之后冰湖扩张速率明显加快,至2010s初期增加为321个冰湖(88.43 km2)。(2)科西河流域冰湖集中分布于海拔5000—5500 m,面积小于0.25 km2的小规模冰湖占总数量的74.45%,而面积大于1 km2和介于0.05—0.25 km2的冰湖占总面积的64.18%。(3)除利库科拉(Likhu Khola)流域外,科西河流域其它5个子流域冰湖均呈扩张趋势,其中尤以阿润(Arun)流域冰湖扩张最为显著。(4)气候变暖及其引发的冰川退缩是科西河流域冰湖扩张的根本原因,当冰川末端伸入冰湖时,冰水物质与能量交换在一定程度上加速了冰川消融与退缩。 . 冰湖是高山寒区气候变化的灵敏指示器和诱发山地溃决洪水或泥石流的灾害源。基于1960s—2010s多源遥感影像数据(Corona、Landsat MSS/TM/ETM+OLI)、地形图、冰川编目和气象数据,利用RS和GIS技术综合分析科西河流域近50年冰湖(≥0.05 km2)时空变化特征及其对冰川变化影响。研究结果表明:(1)近50年来科西河流域冰湖整体经历了“先平稳后扩张”的过程,其中1960s至1980s初期,科西河流域有37个冰湖消失,但总面积趋于平稳状态;1980s中期至2010s初期,流域内冰湖规模迅速扩张,且2000s之后冰湖扩张速率明显加快,至2010s初期增加为321个冰湖(88.43 km2)。(2)科西河流域冰湖集中分布于海拔5000—5500 m,面积小于0.25 km2的小规模冰湖占总数量的74.45%,而面积大于1 km2和介于0.05—0.25 km2的冰湖占总面积的64.18%。(3)除利库科拉(Likhu Khola)流域外,科西河流域其它5个子流域冰湖均呈扩张趋势,其中尤以阿润(Arun)流域冰湖扩张最为显著。(4)气候变暖及其引发的冰川退缩是科西河流域冰湖扩张的根本原因,当冰川末端伸入冰湖时,冰水物质与能量交换在一定程度上加速了冰川消融与退缩。 |
| [11] | . Glacier recession and the expansion of glacial lakes in the recent decade is an observable fact in the Himalayan Cryosphere. The present study used the potential of Indian Remote Sensing (IRS) high... |
| [12] | . Long-term datasets of number and size of lakes over the Tibetan Plateau (TP) are among the most critical components for better understanding the interactions among the cryosphere, hydrosphere, and atmosphere at regional and global scales. Due to the harsh environment and the scarcity of data over the TP, data accumulation and sharing become more valuable for scientists worldwide to make new discoveries in this region. This paper, for the first time, presents a comprehensive and freely available data set of lakes’ status (name, location, shape, area, perimeter, etc.) over the TP region dating back to the 1960s, including three time series, i.e., the 1960s, 2005, and 2014, derived from ground survey (the 1960s) or high-spatial-resolution satellite images from the China-Brazil Earth Resources Satellite (CBERS) (2005) and China’s newly launched GaoFen-1 (GF-1, which means high-resolution images in Chinese) satellite (2014). The data set could provide scientists with useful information for revealing environmental changes and mechanisms over the TP region. |
| [13] | . |
| [14] | . Climate change has been shown to increase the number of mountain lakes across various mountain ranges in the World. In Central Asia, and in particular on the territory of Uzbekistan, a detailed assessment of glacier lakes and their evolution over time is, however lacking. For this reason we created the first detailed inventory of mountain lakes of Uzbekistan based on recent (2002 2014) satellite observations using WorldView-2, SPOT5, and IKONOS imagery with a spatial resolution from 2 to 10 m. This record was complemented with data from field studies of the last 50 years. The previous data were mostly in the form of inventories of lakes, available in Soviet archives, and primarily included localized in-situ data. The inventory of mountain lakes presented here, by contrast, includes an overview of all lakes of the territory of Uzbekistan. Lakes were considered if they were located at altitudes above 1500 m and if lakes had an area exceeding 100 m 2 . As in other mountain regions of the World, the ongoing increase of air temperatures has led to an increase in lake number and area. Moreover, the frequency and overall number of lake outburst events have been on the rise as well. Therefore, we also present the first outburst assessment with an updated version of well-known approaches considering local climate features and event histories. As a result, out of the 242 lakes identified on the territory of Uzbekistan, 15% are considered prone to outburst, 10% of these lakes have been assigned low outburst potential and the remainder of the lakes have an average level of outburst potential. We conclude that the distribution of lakes by elevation shows a significant influence on lake area and hazard potential. No significant differences, by contrast, exist between the distribution of lake area, outburst potential, and lake location with respect to glaciers by regions. |
| [15] | . The Advanced Land Observing Satellite (ALOS) is relatively new. Its optical sensors are capable of making high-resolution digital surface models (DSMs). For the first time, the task of constructing a regional-scale inventory of glacial lakes based on ALOS data has been undertaken. This study presents the data-processing methods and the results of validation and analysis on the ALOS-based glacial lake inventory of Bhutan in the Himalaya. The analysis based on GPS measurements taken at Metatshota lake in the Mangde Chu sub-basin, one of the glacial lakes assessed as presenting a potential flood danger, shows a validation estimate of 9.5 m for the location of the ALOS-based polygon, with a root mean square of 11.7 m. A comparison with digitized data from the International Centre for Integrated Mountain Development (ICIMOD) shows that positioning and evaluation of terrain changes can be significantly improved using ALOS data. Preliminary analysis of the glacial lakes in four subbasins, Mo Chu, Pho Chu, Mangde Chu and Dangme Chu, reveals that the frequency distribution of lake sizes biases towards smaller lakes. Glacial lakes 0.01 0.05 kmin area account for 55% of the total number and occupy 13% of the total area. Together our results demonstrate the usefulness of highresolution ALOS data with accurate DSMs for studying glacial lakes. High priority must be given to continuously improving and updating the glacial lake inventory with high-resolution satellite data. |
| [16] | . |
| [17] | . Surface meltwater can refreeze within firn layers and crevasses to warm ice through latent-heat transfer on decadal to millennial timescales. Earlier work posited that the consequent softening of the ice might accelerate ice flow, potentially increasing ice-sheet mass loss. Here, we calculate the effect of meltwater refreezing on ice temperature and softness in the P0104kitsoq (near Swiss Camp) and Jakobshavn Isbr0107 regions of western Greenland using a numeric model and existing borehole measurements. We show that in the Jakobshavn catchment, meltwater percolation within the firn warms the ice at depth by 3090009500°C. By contrast, meltwater refreezing in crevasses (cryo-hydrologic warming) at depths of ~300 m warms the ice in P0104kitsoq by up to 1000°C, but this causes minimal increase in ice motion (0908081</sup>). P0104kitsoq is representative of western Greenland's land-terminating ice, where the slow movement of ice through a wide ablation zone provides ideal conditions for cryo-hydrologic warming to occur. We find that only ~37% of the western Greenland ice flux, however, travels through such areas. Overall, our findings suggest that cryo-hydrologic warming will likely have only a limited effect on the dynamic evolution of the Greenland ice sheet. |
| [18] | . Glaciers in the Bugyai Kangri are located in a transition zone from southeast Tibet, where monsoonal temperate glaciers dominate, to inner Tibet, where continental glaciers dominate. Here we analyze glacier and glacial lake changes in this region using multi-year inventories based on Landsat images from 19810900092013. Results show that the total area of 141 glaciers in the region decreased by 30.44 00±0.89 km2 from 198.35 00±9.54 km2 (1980s) to 167.93 00±4.52 km2 (2010s). The annual area shrinkage rate (0900090.48% a0900091) is lower than that reported for southeastern Tibet but higher than that of inner Tibet. Both the number and total area of glacial lakes increased between 1981 and 2013. Among all lakes, proglacial lakes contribute most (~81 %) to the expansion. The total area of ten proglacial lakes increased by 150.3 00± 13.17% and of these ten lakes the four that expanded most sharply showed increased calving at their upper margins, resulting in more rapid retreat of lake-terminating glaciers than land-terminating glaciers. Owing to rapid calving, several lakes may undergo further growth in the near future, increasing the potential risk of glacial lake outburst floods. |
| [19] | . 中国科学院机构知识库(CAS IR GRID)以发展机构知识能力和知识管理能力为目标,快速实现对本机构知识资产的收集、长期保存、合理传播利用,积极建设对知识内容进行捕获、转化、传播、利用和审计的能力,逐步建设包括知识内容分析、关系分析和能力审计在内的知识服务能力,开展综合知识管理。 |
| [20] | . 随着我国新一期冰川编目工作的进行和深入,开展全国范围内的冰湖编目已提上日程。基于278幅大比例尺地形图(20世纪70-80年代)、38景ASTER影像和7景TM(2004-2008年),通过建立冰湖编目规范,对我国喜马拉雅山区冰湖进行遥感调查与编目,分析近30年来冰湖的分布及其变化特征。结果显示:(1)本区2004-2008年间共有冰湖1680个,总面积215.28km2;(2)近30年来我国喜马拉雅山地区冰湖变化总体呈现数量减少、面积增大的趋势,数量减少了4%;总面积增大了29%;(3)近30年来有294个冰湖消失,新增加224个冰湖,变化最快的为冰碛湖,在消失的冰湖中66%为冰碛湖,新增加的冰湖中88%为冰碛湖。进一步分析表明冰湖面积增加是气候变暖、冰川退缩和冰川加速消融的产物。 . 随着我国新一期冰川编目工作的进行和深入,开展全国范围内的冰湖编目已提上日程。基于278幅大比例尺地形图(20世纪70-80年代)、38景ASTER影像和7景TM(2004-2008年),通过建立冰湖编目规范,对我国喜马拉雅山区冰湖进行遥感调查与编目,分析近30年来冰湖的分布及其变化特征。结果显示:(1)本区2004-2008年间共有冰湖1680个,总面积215.28km2;(2)近30年来我国喜马拉雅山地区冰湖变化总体呈现数量减少、面积增大的趋势,数量减少了4%;总面积增大了29%;(3)近30年来有294个冰湖消失,新增加224个冰湖,变化最快的为冰碛湖,在消失的冰湖中66%为冰碛湖,新增加的冰湖中88%为冰碛湖。进一步分析表明冰湖面积增加是气候变暖、冰川退缩和冰川加速消融的产物。 |
| [21] | . |
| [22] | . |
| [23] | . Glacial lakes in the Nepal Himalaya can threaten downstream communities and have large socio-economic consequences if an outburst flood occurs. This study identified 131 glacial lakes in Nepal in 2015 that are greater than 0.1 km2 and performed a first-pass hazard and risk assessment for each lake. The hazard assessment included mass entering the lake, the moraine stability, and how lake expansion will alter the lake hazard in the next 15 30 years. A geometric flood model was used to quantify potential hydropower systems, buildings, agricultural land, and bridges that could be affected by a glacial lake outburst flood. The hazard and downstream impacts were combined to classify the risk associated with each lake. 11 lakes were classified as very high risk and 31 as high risk. The potential flood volume was also estimated and used to prioritize the glacial lakes that are the highest risk, which included Phoksundo Tal, Tsho Rolpa, Chamlang North Tsho, Chamlang South Tsho, and Lumding Tsho. These results are intended to assist stakeholders and decision makers in making well-informed decisions with respect to the glacial lakes that should be the focus of future field studies, modeling efforts, and risk-mitigation actions. |
| [24] | . This publication contains the results of a detailed inventory of glaciers and glacial lakes, and of potential or actual glacial lake outburst flood (GLOF) sites, in the Hindu Kush-Himalayan region in Bhutan. The methods used to identify these glaciers and glacial lakes are described. A brief review of the causes and effects of known GLOF events in Bhutan is presented. GLOF mitigation measures, ... |
| [25] | . Glacial lake outburst floods (GLOFs) pose a significant threat to downstream communities and infrastructure due to their potential to rapidly unleash stored lake water. The most common triggers of these GLOFs are mass movement entering the lake and/or the self-destruction of the terminal moraine due to hydrostatic pressures or a buried ice core. This study initially uses previous qualitative and quantitative assessments to understand the hazards associated with eight glacial lakes in the Nepal Himalaya that are widely considered to be highly dangerous. The previous assessments yield conflicting classifications with respect to each glacial lake, which spurred the development of a new holistic, reproducible, and objective approach based solely on remotely sensed data. This remote hazard assessment analyzes mass movement entering the lake, the stability of the moraine, and lake growth in conjunction with a geometric GLOF to determine the downstream impacts such that the present and future risk associated with each glacial lake may be quantified. The new approach is developed within a hazard, risk, and management action framework with the aim that this remote assessment may guide future field campaigns, modeling efforts, and ultimately risk-mitigation strategies. The remote assessment was found to provide valuable information regarding the hazards faced by each glacial lake and results were discussed within the context of the current state of knowledge to help guide future efforts. |
| [26] | . |
| [27] | . This publication contains the results of a detailed inventory of glaciers and glacial lakes, and of potential or actual glacial lake outburst flood (GLOF) sites, in the Hindu Kush-Himalayan region in Bhutan. The methods used to identify these glaciers and glacial lakes are described. A brief review of the causes and effects of known GLOF events in Bhutan is presented. GLOF mitigation measures, ... |
| [28] | . |
| [29] | . The Himalaya, the world's highest mountain ranges, are home to a large group of glaciers and glacial lakes. Glacial lake outburst floods (GLOFs) in this region have resulted in catastrophic damages and fatalities in the past decades. The recent warming has caused dramatic glacial lake changes and increased potential GLOF risk in the Himalaya. However, our knowledge on the current state and change of glacial lakes in the entire Himalaya is limited. This study maps the current (2015) distribution of glacial lakes across the entire Himalaya and monitors the spatially-explicit evolution of glacial lakes over five time periods from 1990 to 2015 using a total of 348 Landsat images at 3002m resolution. The results show that 4950 glacial lakes in 2015 cover a total area of 455.302±0272.702km 2 , mainly located between 400002m and 570002m above sea level. Himalayan glacial lakes expanded by approximately 14.1% from 1990 to 2015. The changing patterns of supraglacial lakes and proglacial lakes are rather complex, involving both lake disappearance and emergence. Many emergent glacial lakes are found at higher elevations, especially the new proglacial lakes, which have formed as a result of glacier retreat. Spatially heterogeneous changes of Himalayan glacial lakes are observed, with the most significant expansion occurring in the southern slopes of the central Himalaya. Increasing glacier meltwater induced by the Himalayan atmospheric warming is a primary cause for the observed lake expansion. This study provides primary data for future GLOF risk assessments. A total of 118 rapidly expanded glacial lakes are identified as potential vulnerable lakes for the priority of risk assessment. |
| [30] | . Glacial lakes in alpine regions are sensitive to climate change. Mapping and monitoring these lakes would improve our understanding of regional climate change and glacier-related hazards. However, glacial lake mapping over large areas using remote sensing remains a challenge because of various disturbing factors in glacial and periglacial environments. This article presents an automated mapping algorithm based on hierarchical image segmentation and terrain analysis to delineate glacial lake extents. In this algorithm, each glacial lake is delineated with a local segmentation value, and the topographic features derived from digital elevation models (DEMs) are also used to separate mountain shadows from glacial lakes. About 100 scenes of Landsat Thematic Mapper/Enhanced Thematic Mapper Plus (TM/ETM+) images from circa 1990, circa 2000 and 2009 were used to map the glacial lakes and their changes over the entire Himalayas. The results show that the algorithm can map the glacial lakes effectively and efficiently. Mountain shadows or melting glaciers can be differentiated from glacial lakes automatically, and those lakes with mountain shadows can also be identified. Area changes of more than 1000 glacial lakes show that the glacial lakes in the Himalayas have experienced mixed directions of change, while the overall lake areas are expanding at an accelerated rate in the past two decades, indicating great changes to the glacial lakes in the Himalayas. |
| [31] | . Glacial lake outburst flood (GLOF) is a serious hazard in high, mountainous regions. In the Himalayas, catastrophic risks of GLOFs have increased in recent years because most Himalayan glaciers have experienced remarkable downwasting under a warming climate. However, current knowledge about the distribution and recent changes in glacial lakes within the central Himalaya mountain range is still limited. Here, we conducted a systematic investigation of the glacial lakes within the entire central Himalaya range by using an object-oriented image processing method based on the Landsat Thematic Mapper (TM) or Enhanced Thematic Mapper (ETM) images from 1990 to 2010. We extracted the lake boundaries for four time points (1990, 2000, 2005 and 2010) and used a time series inspection method combined with a consistent spatial resolution of Landsat images that consistently revealed lake expansion. Our results show that the glacial lakes expanded rapidly by 17.11% from 1990 to 2010. The pre-existing, larger glacial lakes, rather than the newly formed lakes, contributed most to the areal expansion. The greatest expansions occurred at the altitudinal zones between 4800 m and 5600 m at the north side of the main Himalayan range and between 4500 m and 5600 m at the south side, respectively. Based on the expansion rate, area and type of glacial lakes, we identified 67 rapidly expanding glacial lakes in the central Himalayan region that need to be closely monitored in the future. The warming and increasing amounts of light-absorbing constituents of snow and ice could have accelerated the melting that directly affected the glacial lake expansion. Across the main central Himalayas, glacial lakes at the north side show more remarkable expansion than those at the south side. An effective monitoring and warning system for critical glacial lakes is urgently needed. |
| [32] | . Glacial lakes show a wide range of turbidity. Owing to this, the normalized difference water indices (NDWIs) as proposed by many researchers, do not give appropriate results in case of glacial lakes. In addition, the sub-pixel proportion of water and use of different optical band combinations are also reported to produce varying results. In the wake of the changing climate and increasing GLOFs (glacial lake outburst floods), there is a need to utilize wide optical and thermal capabilities of Landsat 8 data for the automated detection of glacial lakes. In the present study, the optical and thermal bandwidths of Landsat 8 data were explored along with the terrain slope parameter derived from Advanced Spaceborne Thermal Emission and Reflection Radiometer Global Digital Elevation Model Version2 (ASTER GDEM V2), for detecting and mapping glacial lakes. The validation of the algorithm was performed using manually digitized and subsequently field corrected lake boundaries. The pre-existing NDWIs were also evaluated to determine the supremacy and the stability of the proposed algorithm for glacial lake detection. Two new parameters, LDI (lake detection index) and LF (lake fraction) were proposed to comment on the performances of the indices. The lake detection algorithm (LDA) performed best in case of both, mixed lake pixels and pure lake pixels with no false detections (LDI=0.98) and very less areal underestimation (LF=0.73). The coefficient of determination (R2) between areal extents of lake pixels, extracted using the LDA and the actual lake area, was very high (0.99). With understanding of the terrain conditions and slight threshold adjustments, this work can be replicated for any mountainous region of the world. |
| [33] | . 由于地震灾害的影响,冰湖上游的冰滑坡、冰崩、滑坡、泥石流会进入湖泊,通过冲击波或抬高水位,造成冰川坝或冰碛坝突然垮塌导致冰湖迅速排水而形成洪水或洪水泥石流。首先基于Landsat8遥感影像通过人工目视解译的方法构建尼泊尔2015年4月25日地震震前冰湖数据,为我国和尼泊尔的抗震救灾提供重要的数据支撑。然后利用历史遥感数据解译获取研究区2015年以前的历史冰湖数据,对历史冰湖数据和2015年的冰湖数据进行地理空间分析,计算其面积变化和长度变化。最后结合尼泊尔2015年4月25日地震峰值地面加速度数据通过空间分析识别地震影响区的潜在危险冰湖。研究表明:研究区面积>0.02km<sup>2</sup>的冰湖有1847个,面积263.18km<sup>2</sup>,其中快速变化冰湖87个,位于地震影响区的潜在危险冰湖49个,应重点关注潜在危险冰湖。 . 由于地震灾害的影响,冰湖上游的冰滑坡、冰崩、滑坡、泥石流会进入湖泊,通过冲击波或抬高水位,造成冰川坝或冰碛坝突然垮塌导致冰湖迅速排水而形成洪水或洪水泥石流。首先基于Landsat8遥感影像通过人工目视解译的方法构建尼泊尔2015年4月25日地震震前冰湖数据,为我国和尼泊尔的抗震救灾提供重要的数据支撑。然后利用历史遥感数据解译获取研究区2015年以前的历史冰湖数据,对历史冰湖数据和2015年的冰湖数据进行地理空间分析,计算其面积变化和长度变化。最后结合尼泊尔2015年4月25日地震峰值地面加速度数据通过空间分析识别地震影响区的潜在危险冰湖。研究表明:研究区面积>0.02km<sup>2</sup>的冰湖有1847个,面积263.18km<sup>2</sup>,其中快速变化冰湖87个,位于地震影响区的潜在危险冰湖49个,应重点关注潜在危险冰湖。 |
| [34] | . |
| [35] | . In past Nepal has encountered a number of glacial lake outburst flood (GLOF) events causing loss of billions of rupees. Still there are a number of glacial lakes forming and there are chances of new glacial lake formation. Hence there is intense need to monitor glaciers and glacial lakes. The development on remote sensing technology has eased the researches on glacier and glacial lakes. Identification of locations of potential glacial lakes through the use of remote sensing technology has been proven and hence is opted for identification of locations of potential glacial lake in Khumbu Valley of Sagarmatha Zone, Nepal. The probable sites for glacial lake formation are at Ngojumpa, Lobuche, Khumbu, Bhotekoshi, Inkhu, Kyasar, Lumsumna, etc. As per study, the biggest glacial lake could form at Ngozumpa glacier. Even in other glaciers potential supra-glacial lakes could merge together to form lakes that occupy significant area. Nepalese Journal on Geoinformatics -12, 2070 (2013AD): 10-16 |
| [36] | . In this study, we present a first regional assessment of glacial lake distribution and evolution in the Hindu Kush Himalaya (HKH). Seven sites have been selected between Bhutan and Afghanistan, to capture the climatic variability along the 2000-km long mountain range. For each site, glacial lakes have been mapped with LANDSAT satellite imagery acquired in 1990, 2000 and 2009, using an automatic classification. In the East (India, Nepal and Bhutan), glacial lakes are bigger and more numerous than in the West (Pakistan, Afghanistan), and have grown continuously between 1990 and 2009 by 20% to 65%. On the other hand, during the same period, the glacial lake coverage has shrunk in the Hindu Kush (6150%) and the Karakorum (6130%). This east/west pattern of lake changes seems in agreement with sparse glaciological measurements that suggest less (or even no) ice loss in the western part of the HKH. |
| [37] | . 在“全域―局部”分步迭代水体信息提取方法的基础上, 通过对水体信息提取指标――水体指数的物理特性的分析实现了算法中全域阈值的自动选择与局部阈值的自适应调整, 并结合DEM 生成的山体坡度和阴影信息,减少局部迭代过程中对其他地表特征与水体信息的误判。在此基础上, 建立一种适合于高山地区冰川湖泊的自动化提取方案。试验采用Landsat 数据对喜马拉雅山地区的冰川湖泊进行信息提取, 结果表明该方法能够快速准确地完成大区域范围内的冰川湖泊制图, 并能最大程度地消除高山地区湖泊水体识别中冰川和山体阴影的影响。 . 在“全域―局部”分步迭代水体信息提取方法的基础上, 通过对水体信息提取指标――水体指数的物理特性的分析实现了算法中全域阈值的自动选择与局部阈值的自适应调整, 并结合DEM 生成的山体坡度和阴影信息,减少局部迭代过程中对其他地表特征与水体信息的误判。在此基础上, 建立一种适合于高山地区冰川湖泊的自动化提取方案。试验采用Landsat 数据对喜马拉雅山地区的冰川湖泊进行信息提取, 结果表明该方法能够快速准确地完成大区域范围内的冰川湖泊制图, 并能最大程度地消除高山地区湖泊水体识别中冰川和山体阴影的影响。 |
| [38] | . Glacial lakes in the High Mountain Asia(HMA)are sensitive to global warming and can result in much more severe flood disasters than some largesized lakes.An accurate and robust method for the extraction of glacial lakes is critical to effective management of these natural water resources.Conventional methods often have limitations in terms of low spectral contrast and heterogeneous backgrounds in an image.This study presents a robust and automated method for the yearly mapping of glacial lake over a large scale,which took advantage of the complementarity between the modified normalized difference water index(MNDWI)and the nonlocal active contour model,required only local homogeneity in reflectance features of lake.The cloud computing approach with the Google Earth Engine(GEE)platform was used to process the intensive amount of Landsat 8 images from 2015 (344 path/rows and approximately 7504 scenes).The experimental results were validated by very high resolution images from Chinese GaoFen-1 (GF-1) panchromatic multi-spectral(PMS)and appeared a general good agreement.This is the first time that information regarding the spatial distribution of glacial lakes over the HMA has been derived automatically within quite a short period of time.By integrating it with the relevant indices,it can also be applied to detect other land cover types such as snow or vegetation with improved accuracy. |
| [39] | . 78The glacier slopes upstream and downstream are able to predict 90% of the supraglacial lake surfaces. 78The evolution of lakes not directly connected with glaciers can be used as an helpful sign of the precipitation trend. 78The uncertainty of measurement when satellite imagery is used for mapping glacial lakes and glaciers is assessed in this study. |
| [40] | . Automated glacier mapping from satellite multispectral image data is hampered by debris cover on glacier surfaces. Supraglacial debris exhibits the same spectral properties as lateral and terminal moraines, fluvioglacial deposits, and bedrock outside the glacier margin, and is thus not detectable by means of multispectral classification alone. Based on the observation of low slope angles for debris-covered glacier tongues, we developed a multisource method for mapping supraglacial debris. The method combines the advantages of automated multispectral classification for clean glacier ice and vegetation with slope information derived from a digital elevation model (DEM). Neighbourhood analysis and change detection is applied for further improvement of the resulting glacier/debris map. A significant percentage of the processing can be done automatically. In order to test the sensitivity of our method against different DEM qualities, it was also applied to a DEM obtained from ASTER stereo data. Additionally, we compared our multisource approach to an artificial neural network (ANN) classification of debris, using only multispectral data. While the combination with an ASTER-derived DEM revealed promising results, the ANN classification without DEM data does not. |
| [41] | . The historical record of in situ measurements of the terminus positions of the Pasterze and Kleines Flei08kees glaciers in the eastern Alps of Austria is used to assess uncertainties in the measurement of decadal scale changes using satellite data. Topographic maps beginning in 1893, and satellite data from 1976 to 2001, were studied in concert with ground measurements to measure glacier changes. Ground measurements show that the tongue of the Pasterze Glacier receded 651150 m from 1893 to 2001, while satellite-derived measurements, using August 2001 Landsat Enhanced Thematic Mapper Plus (ETM+) data registered to an 1893 topographic map, show a recession of 1300–1800 m, with an unknown error. The measurement accuracy depends on the registration technique and the pixel resolution of the sensor when two satellite images are used. When using topographic maps, an additional source of error is the accuracy of the glacier position shown on the map. Between 1976 and 2001, Landsat-derived measurements show a recession of the terminus of the Pasterze Glacier of 479±136 m (at an average rate of 19.1 m a 611) while measurements from the ground showed a recession of 428 m (at an average rate of 17.1 m a 611). Four-meter resolution Ikonos satellite images from 2000 and 2001 reveal a shrinkage of 22,096±46 m 2 in the Pasterze tongue. The nearby Kleines Flei08kees glacier lost 30% of its area between 1984 and 2001, and the area of exposed ice increased by 0.44±0.0023 km 2, according to Landsat satellite measurements. As more recent satellite images are utilized, especially data that are geocoded, the uncertainty associated with measuring glacier changes has decreased. It is not possible to assess the uncertainty when an old topographic map and a satellite image are coregistered. |
| [42] | . Changes in the area and bathymetry of Imja Glacial Lake and in the elevation of its damming moraine, Khumbu region, Nepal Himalaya are investigated. Previously reported changes in the lake area have been updated by multi-temporal ASTER images, which revealed a decreased expansion rate after 2000. A provisional expansion of the lake observed in 2004, from which some studies concluded an accelerated lake expansion due to global warming, has, from 2005, subsided to the glacier surface. Bathymetric changes for the period 1992-2002 that were first obtained for Himalayan glacial lakes suggest that the melting of debris-covered ice beneath the lake is insignificant in terms of the increase in lake volume, and that the retreat of a glacier in contact with the lake by calving is essential for the lake's expansion. Changes in the height of a damming moraine for the period 2001-2007 suggest a continuous surface lowering near the lake, though the lowering rates are smaller than those for the period 1989-1994. |
| [43] | . Lakes on the Tibetan Plateau (TP) are of great interest due to their value as water resources but also as an important indicator of climate change. However, in situ data in this region are extremely scarce and only a few lakes have gauge measurements. Satellite altimetry has been used successfully to monitor lake levels. In this study, Cryosat-2 SARIn mode data over the period 2010 to 2015 are used to investigate recent lake level variations. The estimated water levels of the 70 largest lakes (> 100 km2) on the TP show that 48 lakes reveal a rising trend (avg. 0.28 0.06 m/yr) while the other 22 show a slightly decreasing trend (avg. -0.10 0.04 m/yr). To compare with the change rates during 2003-2009, ICESat data which cover 42 of the 70 lakes are also used. When combining the data, the results show that during the period of 2003-2015, 28 lakes maintained a rising trend and the change rates are comparable. Lakes in the northern part of the TP experienced pronounced rising (avg. 0.37 0.10 m/yr), while lakes in southern part were steady or decreasing even in glaciated basins with high precipitation. Factor analysis indicates that driving factors for lake change are variable due to high spatial heterogeneity. However, autumn/winter temperature plays an important role in lake level change. These results demonstrate that lakes on the TP are still rapidly changing under climate change, especially in northern part of the TP, but the driving factors are variable and more research is needed to understand the mechanisms behind observed changes. |
| [44] | . |
| [45] | . The Tibetan Plateau (TP) exerts strong thermal forcing on the atmosphere over Asian monsoon region and supplies water resources to adjacent river basins. Recently, the Plateau experienced evident climate changes, which have changed atmospheric and hydrological cycles and thus reshaped the local environment. This study reviewed recent research progress in the climate changes and explored their impacts on the Plateau energy and water cycle, based on which a conceptual model to synthesize these changes was proposed and urgent issues to be explored were summarized. The TP has experienced an overall surface air warming and moistening, solar dimming, and wind stilling since the beginning of the 1980s. The surface warming depends on elevation and its horizontal pattern is consistent with the one of the glacier change. Accompanying the warming was air moistening, and both facilitated the trigger of more deep-clouds, which resulted in solar dimming. Surface wind speed declined from the 1970s, as a result of atmospheric circulation adjustment caused by the differential surface warming between the Asian high-latitude and low-latitude. The climate changes had weakened the thermal forcing over the TP. The warming and wind stilling lowered the Bowen ratio and led to less surface sensible heating. Atmospheric radiative cooling was enhanced, mainly by outgoing longwave emission from the warming planetary system and slightly by solar radiation reflection. Both processes contributed to the thermal forcing weakening over the Plateau. The water cycle was also altered by the climate changes. The wind stilling may have weakened water vapor exchange between the Asia monsoon region and the Plateau and thus led to less precipitation in the monsoon-impacted southern and eastern Plateau, but the warming enhanced land evaporation. Their overlap resulted in runoff reduction in the southern and eastern Plateau regions. By contrast, more convective precipitation over the central TP was triggered under the warmer and moister condition and yielded more runoff; meanwhile, the solar dimming weakened lake evaporation. The two together with enhanced glacier melts contributed to the lake expansion in the central TP. |
| [46] | . The Tibetan Plateau and surroundings contain the largest number of glaciers outside the polar regions. These glaciers are at the headwaters of many prominent Asian rivers and are largely experiencing shrinkage, which affects the water discharge of large rivers such as the Indus. The resulting potential geohazards merit a comprehensive study of glacier status in the Tibetan Plateau and surroundings. Here we report on the glacier status over the past 30 years by investigating the glacial retreat of 82 glaciers, area reduction of 7,090 glaciers and mass-balance change of 15 glaciers. Systematic differences in glacier status are apparent from region to region, with the most intensive shrinkage in the Himalayas (excluding the Karakorum) characterized by the greatest reduction in glacial length and area and the most negative mass balance. The shrinkage generally decreases from the Himalayas to the continental interior and is the least in the eastern Pamir, characterized by the least glacial retreat, area reduction and positive mass balance. In addition to rising temperature, decreased precipitation in the Himalayas and increasing precipitation in the eastern Pamir accompanied by different atmospheric circulation patterns is probably driving these systematic differences. |
| [47] | . Glacial lakes, as an important component of the cryosphere in the southeastern Tibetan Plateau (SETP) in response to climate change, pose significant threats to the downstream lives and properties of people, engineering construction, and ecological environment via outburst floods, yet we currently have limited knowledge of their distribution, evolution, and the driving mechanism of rapid expansions due to the low accessibility and harsh natural conditions. By integrating optical imagery, satellite altimetry and digital elevation model (DEM), this study presents a regional-scale investigation of glacial lake dynamics across two river basins of the SETP during 1988–2013andfurther explores the glacial-hydrogeomorphic process of rapidly expanding lakes. In total 1278and1396 glacial lakes were inventoried in 1988and2013, respectively. Approximately 92.4% of the lakes in 2013 are not in contact with modern glaciers, and the remaining 7.6% includes 27 (1.9%) debris-contact lakes (in contact with debris-covered ice) and 80 (5.7%) cirque lakes. In categorizing lake variations, we found that debris-contact proglacial lakes experienced much more rapid expansions (6575%) than cirque lakes (657%) and non-glacier-contact lakes (653%). To explore the cause of rapid expansion for these debris-contact lakes, we further investigated the mass balance of parent glaciers and elevation changes in lake surfaces and debris-covered glacier tongues using time-series Landsat images, ICESat altimetry, and DEM. Results reveal that the upstream expansion of debris-contact proglacial lakes was not directly associated with rising water levels but with a geomorphological alternation of upstream lake basins caused by melting-induced debris subsidence at glacier termini. This suggests that the hydrogeomorphic process of glacier thinning and retreat, in comparison with direct glacial meltwater alone, may have played a dominant role in the recent glacial lake expansion observed across the SETP. Our findings assist in understanding the expansion mechanism of debris-contact proglacial lakes, which facilitates early recognition of potential glacial lake hazards in this region. |
| [48] | . Abstract Glacial lake outburst floods are among the most serious natural hazards in the Himalayas. Such floods are of high scientific and political importance because they exert trans-boundary impacts on bordering countries. The preparation of an updated inventory of glacial lakes and the analysis of their evolution are an important first step in assessment of hazards from glacial lake outbursts. Here, we report the spatiotemporal developments of the glacial lakes in the Poiqu River basin, a trans-boundary basin in the Central Himalayas, from 1976 to 2010 based on multi-temporal Landsat images. Studied glacial lakes are classified as glacier-fed lakes and non-glacier-fed lakes according to their hydrologic connection to glacial watersheds. A total of 119 glacial lakes larger than 0.0165km2 with an overall surface area of 20.2265km2 (±10.8%) were mapped in 2010, with glacier-fed lakes being predominant in both number (69, 58.0%) and area (16.2265km2, 80.2%). We found that lakes connected to glacial watersheds (glacier-fed lakes) significantly expanded (122.1%) from 1976 to 2010, whereas lakes not connected to glacial watersheds (non-glacier-fed lakes) remained stable (+2.8%) during the same period. This contrast can be attributed to the impact of glaciers. Retreating glaciers not only supply meltwater to lakes but also leave space for them to expand. Compared with other regions of the Hindu Kush Himalayas (HKH), the lake area per glacier area in the Poiqu River basin was the highest. This observation might be attributed to the different climate regimes and glacier status along the HKH. The results presented in this study confirm the significant role of glacier retreat on the evolution of glacial lakes. Copyright 08 2014 John Wiley & Sons, Ltd. |
| [49] | . Asia’s high plateaus are sensitive to climate change and have been experiencing rapid warming over the past few decades. We found 99 new lakes and extensive lake expansion on the Tibetan Plateau during the last four decades, 1970–2013, due to increased precipitation and cryospheric contributions to its water balance. This contrasts with disappearing lakes and drastic shrinkage of lake areas on the adjacent Mongolian Plateau: 208 lakes disappeared, and 75% of the remaining lakes have shrunk. We detected a statistically significant coincidental timing of lake area changes in both plateaus, associated with the climate regime shift that occurred during 1997/1998. This distinct change in 1997/1998 is thought to be driven by large-scale atmospheric circulation changes in response to climate warming. Our findings reveal that these two adjacent plateaus have been changing in opposite directions in response to climate change. These findings shed light on the complex role of the regional climate and water cycles and provide useful information for ecological and water resource planning in these fragile landscapes. |
| [50] | . Although the processes by which glacial debris mantles alter the melting of glacier ice have been well studied, the mass balance and runoff patterns of Himalayan debris-covered glaciers and the response of these factors to climate change are not well understood. Many previous studies have addressed mechanisms of ice melt under debris mantles by applying multiplicative parameters derived from field experiments, and other studies have calculated the details of heat conduction through the debris layer. However, those approaches cannot be applied at catchment scale because distributions of thickness and thermal property of debris are heterogeneous and difficult to measure. Here, we established a runoff model for a Himalayan debris-covered glacier in which the spatial distribution of the thermal properties of the debris mantle is estimated from remotely sensed multi-temporal data. We applied the model to the Tsho Rolpa Glacial Lake???Trambau Glacier basin in the Nepal Himalaya, using hydro-meteorological observations obtained for a 3.5-year period (1993???1996). We calculated long-term averages of runoff components for the period 1980???2007 using gridded reanalysis datasets. Our calculations suggest that excess meltwater, which implies the additional water runoff compared with the ice-free terrain, from the debris-covered area contributes significantly to the total runoff, mainly because of its location at a lower elevation. Uncertainties in runoff simulation due to estimations of the thermal properties and albedo of the debris-covered surface were assessed to be approximately 8% of the runoff from the debris-covered area. We evaluated the sensitivities of runoff components to changes in air temperature and precipitation. As expected, warmer air temperatures increase the total runoff by increasing the melting rate; however, increased precipitation slightly reduces the total runoff, as ice melting is suppressed by the increased snow cover and associated high albedo. The response of total runoff to changing precipitation is complex because of the different responses of individual components (glacier, debris, and ice-free terrain) to precipitation. |
| [51] | . 主要基于Landsat TM/ETM+影像等数据,分析1990-2010年来天山地区冰湖变化特征及其对冰川融水径流的影响。近20年来,天山冰湖面积平均以0.689 km2a-1或0.8%a-1的速度扩张,其中一半以上是由东天山(0.352 km2a-1)贡献的,其次为北天山,面积年均增率为0.165km2a-1,西天山和中央天山的面积年均增率最小,分别为0.089 km2a-1和0.083 km2a-1。除在相对较低海拔(4100 m)范围内冰湖面积出现减少的现象,其他各高度带的冰湖面积均在扩张,其中增率最快的在3500~3900 m之间,平均增速达1.6%a-1。冰湖扩张是本区气候变暖和冰川普遍退缩共同作用的结果,以中小规模的冰湖(<0.6 km2)对冰川退缩响应最为敏感。冰湖扩张能在一定程度上延缓因气候变暖而导致的区域冰川水资源的亏损,每年大约有0.006 Gt的冰川融水滞留在冰湖中,约占天山冰川年消融量的2‰,但也将加剧本区冰湖溃决洪水/泥石流灾害的频次和强度。 . 主要基于Landsat TM/ETM+影像等数据,分析1990-2010年来天山地区冰湖变化特征及其对冰川融水径流的影响。近20年来,天山冰湖面积平均以0.689 km2a-1或0.8%a-1的速度扩张,其中一半以上是由东天山(0.352 km2a-1)贡献的,其次为北天山,面积年均增率为0.165km2a-1,西天山和中央天山的面积年均增率最小,分别为0.089 km2a-1和0.083 km2a-1。除在相对较低海拔(4100 m)范围内冰湖面积出现减少的现象,其他各高度带的冰湖面积均在扩张,其中增率最快的在3500~3900 m之间,平均增速达1.6%a-1。冰湖扩张是本区气候变暖和冰川普遍退缩共同作用的结果,以中小规模的冰湖(<0.6 km2)对冰川退缩响应最为敏感。冰湖扩张能在一定程度上延缓因气候变暖而导致的区域冰川水资源的亏损,每年大约有0.006 Gt的冰川融水滞留在冰湖中,约占天山冰川年消融量的2‰,但也将加剧本区冰湖溃决洪水/泥石流灾害的频次和强度。 |
| [52] | ccelerated lake expansion in the 2000s has been confirmed by both dramatic lake-area increases (for 312 lakes larger than 10 km2) derived from optical images, and rapid water-level rises (for 117 lakes with water-level data) measured by satellite altimetry. However, the underlying climate causes remain unclear. This paper analyzes the relationship between the water-level changes of lakes on the plateau and the potential driving factors, such as the glacier meltwater supply and a dependency on precipitation and runoff over the whole plateau and in each zone. The results show that the rates of change of non-glacier-fed lakes in the 2000s were as high as those of glacier-fed lakes across the whole plateau and the lake-level changes were closely associated with the lake supply coefficients (the basin/lake area ratio). The lake variations agreed well with the spatial pattern of precipitation changes. However, in different zones, especially at around 33 N north of the plateau, glacier-fed lakes did exhibit faster lake level increases than no-glacier-fed lakes, indicating that the presence of a glacier meltwater supply augmented the precipitation-driven lake expansions in these areas. Despite the absence of quantitative modeling due to limited data availability, this study provides qualitative support that the lake expansions on the Tibetan Plateau in the 2000s have been driven primarily by changes in precipitation and evapotranspiration and not solely by the effect of glacier wastage. |
| [53] | . 近年来,随着全球气候的变暖,冰碛湖溃决灾害正日益严重地威胁着人们生命和财产安全,在我国喜马拉雅山区尤其突出,对冰碛湖溃决灾害的研究也日益受到重视。基于大比例尺地形图、DEM和2004-2008年间的ASTER影像等数据,应用直接判别方法和基于事件树模型,通过确定不同类型冰碛湖溃决模式发生的定性描述和概率转换关系,对我国喜马拉雅山地区冰湖进行潜在危险性冰碛湖的识别和危险性冰碛湖溃决概率等级估算。结果显示,在2004-2008年间,我国喜马拉雅山区共有143个具有潜在危险性冰湖,其中溃决概率等级为"非常高"的44个、"高"的47个、"中"的24个、"低"的24个、"非常低"的4个,溃决概率为"非常高"和"高"等级的91个潜在危险性冰碛湖亟需进一步进行溃决风险评价。 . 近年来,随着全球气候的变暖,冰碛湖溃决灾害正日益严重地威胁着人们生命和财产安全,在我国喜马拉雅山区尤其突出,对冰碛湖溃决灾害的研究也日益受到重视。基于大比例尺地形图、DEM和2004-2008年间的ASTER影像等数据,应用直接判别方法和基于事件树模型,通过确定不同类型冰碛湖溃决模式发生的定性描述和概率转换关系,对我国喜马拉雅山地区冰湖进行潜在危险性冰碛湖的识别和危险性冰碛湖溃决概率等级估算。结果显示,在2004-2008年间,我国喜马拉雅山区共有143个具有潜在危险性冰湖,其中溃决概率等级为"非常高"的44个、"高"的47个、"中"的24个、"低"的24个、"非常低"的4个,溃决概率为"非常高"和"高"等级的91个潜在危险性冰碛湖亟需进一步进行溃决风险评价。 |
| [54] | . Abstract To better understand the risk of disasters due to glacial lake outburst floods (GLOFs), we synthetically analyze the spatial distribution and evolution of moraine-dammed lakes and potentially dangerous glacial lakes (PDGLs) in the Chinese Himalaya. Our county-based assessment of GLOF disaster risk combines PDGL outburst hazard, regional exposure, vulnerability of exposed elements and adaptation capability (risk management) using the analytic hierarchy process. We synthetically analyze the disaster risk using the weighted comprehensive method. Remote-sensing data show there are 329 moraine-dammed lakes (>0.02 km2; total area 125.43 km2) in the Chinese Himalaya, of which 116 (total area 49.49 km2) are identified as PDGLs. The zones at highest risk of GLOF disaster are mainly located in Nyalam, Tingri, Dinggy , Lhozhag, Kangmar and Zhongba, in the mid-eastern Himalaya. Lowest-risk zones are located in the eastern Himalaya. On the county scale, Lhozhag and Lhunze have the highest hazard degrees and exposure, while Zhongba and Zando have the highest degree of vulnerability and lowest adaptation capacity. Our regionalization results for GLOF disaster risk are consistent with the distribution of historical disaster sites across the Chinese Himalaya. |
