 , 王晓玥
, 王晓玥Emergy analysis of ecosystem services supply and flow in Beijing ecological conservation area
MACheng, WANGXiaoyue通讯作者:
收稿日期:2016-03-30
修回日期:2017-01-14
网络出版日期:2017-06-25
版权声明:2017《地理学报》编辑部本文是开放获取期刊文献,在以下情况下可以自由使用:学术研究、学术交流、科研教学等,但不允许用于商业目的.
基金资助:
作者简介:
-->
展开
摘要
关键词:
Abstract
Keywords:
-->0
PDF (1828KB)元数据多维度评价相关文章收藏文章
本文引用格式导出EndNoteRisBibtex收藏本文-->
1 引言
城市周边地区可以为人类社会提供多种生态系统服务[1-2],如食品[3]、涵养水源[4]、洪水控制[5-6]、气候调节[7]、碳吸收[8]、文化景观[9]和社会教育[10]等功能,是实现城市可持续发展的有机组成部分[11]。然而,城市周边地区也是对城市扩张最敏感、变化最大且迅速的地区。近年来,全球城市化进程的加快导致城市周边区域土地利用格局发生了剧烈的变化。在一些国家或地区,城市周边区的土地利用由于缺乏有效的规划和管理,出现郊区职能逐渐丧失并导致其生态系统服务产生退化或者消失的现象[1]。为了更好地应对城市扩张对城市周边地区的影响,国内外****对城市周边地区土地利用做了大量研究。例如,Aubry等尝试以可持续发展和城市农业多功能性的两个原则为基础,对马达加斯加(Madagascar)首都塔那那利佛(Antananarivo)的城市化发展进行了土地利用规划[2];Vejre等和Overbeek提出,城市和农村的利益相关方与土地使用者应该建立对话,以评估城市周边地区应该为城市提供何种服务以及利益如何分配[12-13];Huang等以台北半城市化地区为研究区域,在识别生态系统服务的基础之上核算了各子生态系统的能值,从而分析了生态组分之间的关系以及城市化进程对于半城市化地区生态系统服务产生的影响[14]。谢花林等从北京山区的地理区位、资源环境特征及首都整体功能要求等方面探讨了北京山区土地的多功能性,认为其应有生产、生态效应和休闲等3个层次的功能[15]。黄姣以北京及其周边为例,基于DEM流域划分技术构建“生态系统服务区”,探讨了北京与周边地区土地管理模式,为北京周边地区土地利用规划提供建议[16]。
就目前看来,局地和区域尺度上关于城市周边土地利用与生态系统管理、生态系统服务之间定量关系的研究仍然非常缺乏[17],特别是缺少景观尺度上特定土地管理方式下生态系统服务簇的定性、定量分析和价值评估的研究案例[18]。从国内土地生态系统服务研究成果看,单纯从LUCC出发评估生态系统服务的研究居多,缺乏从能量和能值角度对系统内生态系统服务流转的研究。
本文以北京市生态涵养发展区为研究案例,将研究区自然生态系统分为森林生态系统、农田生态系统、水域生态系统3个子系统,采用能值分析方法对3个子系统生态系统服务进行核算。同时,将北京市城市系统即以人为核心的社会经济系统纳入到研究系统中,在此基础上通过计算各子系统组分能值的流动的情况建立能值流动矩阵,识别各组分在生态系统中的互相影响情况和重要程度。最后比较了2004年、2008年、2012年生态系统服务变化和生态组分重要程度的变化,揭示城市化进程对生态系统服务产生的影响。研究结果可对生态涵养区土地利用规划和生态系统服务管理提供合理化建议。
2 研究区概况
为了实现北京市功能定位,《北京城市总体规划(2004-2020)》将首都分为4个区域:首都功能核心区、城市功能拓展区、城市发展新区和生态涵养发展区。其中,生态涵养发展区范围包括门头沟区、怀柔区、平谷区、密云区和延庆区,面积达8746.6 km2,占全市面积的53.3%(根据2012北京市土地变更调查数据统计)。2012年,该区域人口数占全市的12.6%,其中城镇人口为主体,占区域总人口的61%,生产总值为7146741万元,农林牧渔业总产值134亿元。该区域大部分处于山区或者浅山区,其面积占北京市生态涵养区面积的80%以上,土地利用类型兼具有林地、耕地、水域等多种类型。作为北京市“绿色屏障”,该区域承担水源涵养和生态屏障的重要作用,区域内的密云水库作为北京市唯一饮用水源,为城市提供饮用水供给服务。作为城市化周边区域,北京生态涵养发展区为城市发展提供多种生态系统服务,例如植被恢复、水源涵养和保护、水土流失治理、风沙防治、优质景观等。然而,随着近年来北京市建成区迅速扩张,城乡用地矛盾逐渐突出,给生态涵养区的生态系统服务供给造成很大的压力[18]。因此,本文将北京市生态涵养发展区作为研究案例区(图1),评估该区生态系统服务及其与城市扩张的关系,可为生态涵养区土地利用规划和生态系统服务管理提供科学依据。 显示原图|下载原图ZIP|生成PPT
图1研究区地理位置
-->Fig. 1The geographical location of the study area
-->
3 数据与方法
3.1 数据来源与处理
本文采用的数据主要来源于2004年、2008年和2012年的各类官方统计资料,包括《北京市统计年鉴》、《北京市分县域统计年鉴》、《中国环境统计年鉴》、《北京市环境状况公报》、《北京市水务局水资源公报》和《北京市森林资源情况统计》。同时,还包括中国人地系统主题数据库、中国统计数据库和中经网统计数据库等大型权威数据库,以及首都园林绿化政务网、北京市统计信息网、中国生态系统与生态区划数据库等相关官方网站上公布的统计数据,还有一些数据来自于研究资料和文献。在北京市生态涵养区生态服务价值的分类计算中,需要大量的原始数据,本文在查阅收集大量相关统计年鉴、统计公报、经济社会发展报告和其他相关统计资料、文献的基础之上,进行了详细的筛选和计算。需要说明的是,由于能值计算所需数据量较大并且详细,本文在前人关于北京市生态涵养区研究基础之上,对个别数据进行了推算。在涉及到相关林地计算时,均默认为暖温带落叶阔叶林。
3.2 能值核算
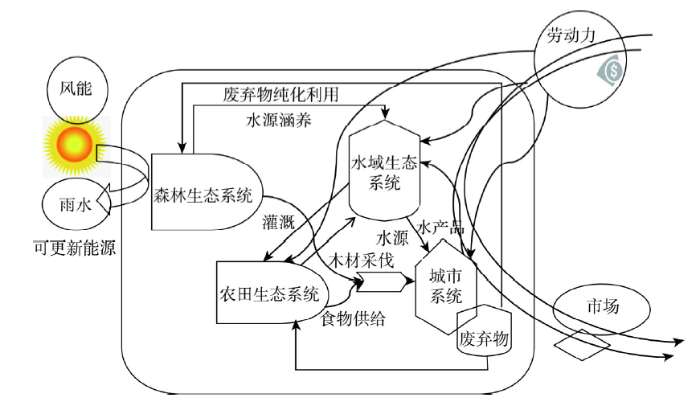
能值核算和分析方法由著名生态学家H.T.Odum首创。能值理论从生态热力学角度出发,认为人类生存所需的一切都最终依赖于自然供给的资源,在不同时空尺度上均由太阳能作为根本驱动[19],因而可以把不同种类、不可比较的能量转换成可进行比较的统一标准――太阳能值。能值分析可以方便地将输入输出系统的各种形式的能量以及系统内部能量的流转进行量化,来表征生态系统复杂的自然过程。与价值评估、物质量评估方法相比较,能值理论建立在紧密的连接经济系统和生态系统基础之上,更契合生态系统服务的研究。基于能值与生态系统联系的紧密性以及数据的可获取性,本文采用能值分析方法来评估生态系统服务。根据涵养发展区的土地利用类型,将涵养区自然生态系统划分为3个子系统——森林生态系统、农田生态系统和水域生态系统,而将反映生产力和生产关系的社会经济系统定义为城市系统。在此基础上建立能值核算系统,绘制研究区的能值系统如图2所示。采用Huang等[14]的方法,结合北京市生态涵养区的土地利用类型,将生态系统服务分为调节服务、供给服务和支持服务3大类别12个小类(表1),计算核算方法参见文献[19-21]。
 显示原图|下载原图ZIP|生成PPT
图2生态—经济系统能值图
-->Fig. 2Emergy diagram of ecological-economic system
-->
Tab. 1
表1
表1北京市生态涵养区生态系统服务分类
Tab. 1Ecosystem services classification of urban ecological conservation area in Beijing
| 生态系统类型 | 生态系统服务 | ||
|---|---|---|---|
| 供给服务 | 支持服务 | 调节服务 | |
| 森林生态系统 | 木材采伐 | 土壤形成 | 固碳释氧 |
| 有机物生产 | |||
| 水源涵养 | |||
| 农田生态系统 | 粮食供给 | 营养元素循环 | |
| 土壤形成 | |||
| 水域生态系统 | 水产品供给 | 气候调节 | |
| 水源供给 | 洪水调蓄 | ||
新窗口打开
3.3 能值影响矩阵
本文运用能值影响矩阵方法识别每个子系统组分在整个系统中的“角色”。能值影响矩阵是Vester和Hesler在一个被广泛应用的生物物理学模型——敏感度模型(sensitivity model, SM)中提出的(表2)。矩阵中的每个组分占据了一行和一列,矩阵中单独的一行代表能量从组分X流向其他组分,单独的一列代表能量从其他组分流向组分X[22]。每一行的能流加和(主动加和AS)代表一个组分在系统的主动程度,即该组分对其他组分的影响程度。每一列的能流加和(被动加和PS)代表该组分的被动程度,即其他组分对该组分的影响程度。将“主动加和(AS)”与“被动加和(PS)”直接相加得到的总加和(TS)来衡量组分在系统的重要程度,TS越高,说明该组分对于系统越重要。通过主动加和(AS)与被动加和(PS)的比值Q来确定各组分在整个系统中的“角色”,如果比值Q大于1,说明该组分对其他组分的影响大于其他组分对该组分的影响,该组分“角色”就是“主动”,相反,如果Q小于1,该组分“角色”就是“被动”。Tab. 2
表2
表2系统组分互相影响矩阵示意
Tab. 2Impact matrix showing interaction between components and indices that measure systemic components
| 能量方向 | 组分1 组分2 组分3 组分4··· | 主动加和(AS) |
|---|---|---|
| 组分1 | ||
| 组分2 | ||
| 组分3 | ||
| 组分4 ··· | ||
| 被动加和(PS) | ||
| 总和(AS+PS) | ||
| 比值Q(AS/PS) |
新窗口打开
在北京市生态涵养区中,森林生态系统和农田生态系统均包括土壤水、土壤营养、生物量3个组分,水域生态系统包括上游、下游、地下水3个组分。这些组分并不是孤立存在,而是相互联系相互支持,并与城市系统相互影响。森林土壤水通过渗透作用转化为地表水和地下水,森林土壤营养一部分转化为森林生物量,一部分随土壤侵蚀流失到上游水中,森林生物量则大部分以木材的形式供给到城市系统,极少部分枯枝落叶转化为森林土壤营养;农田土壤水常用来补给地下水,农田土壤营养绝大部分转化为农田生物量,极少部分随土壤侵蚀流失到下游水中,农田生物量则主要以食物的形式供给到城市系统;对于水域生态系统,一部分地表水和地下水以灌溉的形式转变为农田土壤水,而大部分地表水地下水供给到城市系统;城市系统分别通过植树造林、播种、施肥、水域治理对森林生物量、农田生物量、农田土壤营养和上下游水域施加影响。本文通过核算不同系统各组分间的能值流动,揭示不同系统组分的重要性和系统角色。
4 结果分析
4.1 各子系统生态系统服务能值
以2012年为例,从生态系统类型上看,北京市森林生态系统服务对涵养区生态系统服务贡献最大,总能值为3.51×10²⁰ sej,占到生态系统服务总能值的79.7%,其次为农田生态系统服务和水域生态系统服务,能值分别为8.66×10¹⁹ sej和2.48×10¹⁸ sej,占生态系统服务总能值的19.7%和0.6%(图3)。森林生态系统服务能值较大一方面是由于生态涵养区山区面积较大,占总面积的89%,森林蓄积量较大;另一方面,与农田生态系统相比,森林生态系统可以提供生态系统服务种类较为丰富。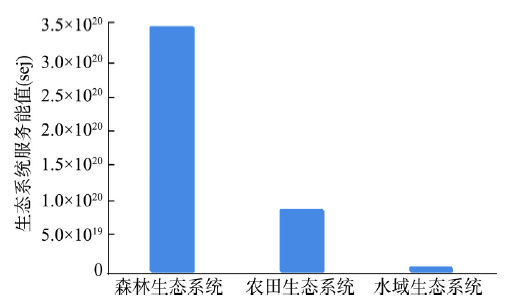 显示原图|下载原图ZIP|生成PPT
图32012年北京市生态涵养区子系统生态系统服务能值
-->Fig. 3Ecosystem services emergy of different subsystems of urban ecological conservation area in Beijing in 2012
-->
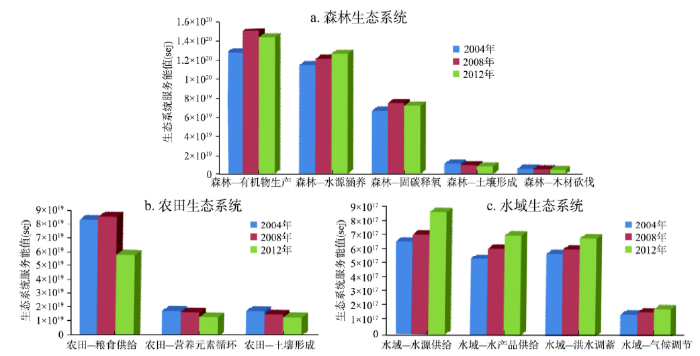
2012年北京市森林生态系统提供的各项服务能值如图4所示。其中,所占比例最大的是有机物生产和水源涵养服务,能值为1.42×10²⁰ sej和1.25×10²⁰ sej,分别占森林生态系统服务总能值的40.4%和35.8%,其次为固碳释氧服务,能值为7.10×10¹⁹ sej,占森林生态系统服务总能值的20.2%。相对于水源涵养和有机物生产服务,土壤形成和木材采伐的能值较低,仅占森林生态系统能值总输出的2.3%和1.3%。木材采伐服务较低是因为北京市为了发挥涵养区生态保护和水源涵养功能,严格控制森林砍伐量,因而每年的木材砍伐输出量保持在较低的水平。但同时也应该关注到森林生态系统土壤形成能值较低,反映了生态涵养区森林生态系统水土流失的现象亟需得到治理。
 显示原图|下载原图ZIP|生成PPT
图42012年北京市生态涵养区森林生态系统各项生态系统服务能值
-->Fig. 4Ecosystem services emergy of forest ecosystem of urban ecological conservation area in Beijing in 2012
-->
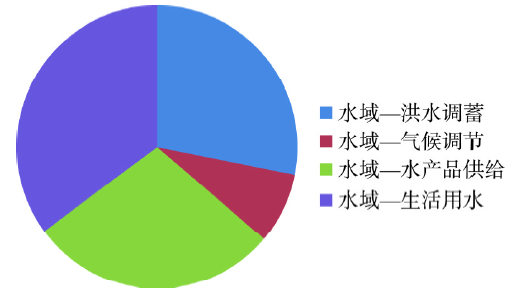
对于农田生态系统(图5),从生态系统服务能值组成来看,粮食供给服务是农田生态系统的主要能值输出,能值大小为6.07×10¹⁹ sej,占农田生态系统服务能值的70.0%。在水域提供的生态系统服务中(图6),能值从高到底依次为水源供给(8.70×10¹⁷ sej)、水产品供给(7.09×10¹⁷ sej)、洪水调蓄(6.97×10¹⁷ sej)和气候调节(2.00×10¹⁷ sej),分别占水域生态系统能值的35.1%、28.6%、28.2%、8.1%。水源供给能值占比较高表明为城市提供用水是生态涵养区水域生态系统提供的主要服务,保护好该区域的水源环境对城市水安全至关重要。
 显示原图|下载原图ZIP|生成PPT
图52012年北京市生态涵养区农田生态系统服务能值组成
-->Fig. 5Ecosystem services emergy of cropland ecosystem of urban ecological conservation area in Beijing in 2012
-->
 显示原图|下载原图ZIP|生成PPT
图62012年北京市生态涵养区水域生态系统服务能值组成
-->Fig. 6Ecosystem services emergy of aquatic ecosystem of urban ecological conservation area in Beijing in 2012
-->
4.2 系统内生态组分相互作用及系统角色
为了清晰地显示系统组分在生态系统中的重要性,以2012年为例,根据互相影响矩阵制作了系统网格图(图7)。图7中,水平轴表示被动累加的对数,数值越大代表越容易受到其他组分的影响。纵轴表示主动累加的对数,数值越大,代表影响其他组分的程度越大。将表格区域分为4个区域来解释不同组分的重要程度(被动供给、主动接受、重要和中立)。越靠近右上角说明组分在整个系统中越重要,越靠近左下角则表明对于系统重要程度越低。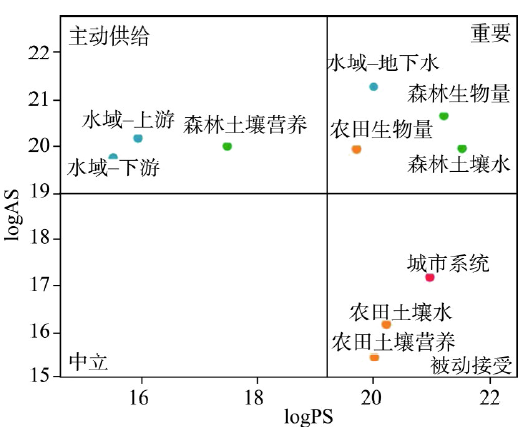 显示原图|下载原图ZIP|生成PPT
图7生态涵养区生态组分重要程度象限分布
注:AS—某组分流向其他组分的能流之和(主动加和),代表该组分对其他组分的影响程度;PS—其他组分流向该组分的能流之和(被动加和),代表其他组分对该组分的影响程度。
-->Fig. 7Systemic role of ecosystem in ecological conservation area
-->
从组分间互相作用上看,受森林生态系统组分影响较大的是水域生态系统和城市系统。森林生态系统一方面通过水源涵养以土壤水的形式补充地下水(能值为1.25×10²⁰ sej),另一方面通过森林土壤养分流失进入到水域的上游(能值为5.54×10¹⁵ sej)。森林生态组分对城市系统的影响表现为木材供给,这一过程有3.16×10¹⁹ sej的能值流入城市系统。此外,森林生态系统内部组分之间也存在能量的交互利用,有2.48×10¹⁷ sej的能值通过凋落物等形式转换为森林土壤营养支持森林的生长。而对于森林生态系统本身来讲,其被动接受主要来源于城市的劳动力和货币的投入,2012年城市系统向森林生态系统的总能值投入为6.25×10¹¹ sej。从组分的活跃程度来看,森林生物量、土壤水和土壤营养主动累加均大于被动累加,Q>1,因此在系统中处于活跃状态。活跃程度表现为土壤水>生物量>土壤营养。
对于农田生态系统来说,农田生物量具有较高的主动累加和被动累加,农田生物量能值大小一方面受投入劳动力和肥料的影响,另一方面受到水源供给、营养元素循环等影响。同时,农田生物量的多少也决定了其向城市系统提供粮食供给服务能力的大小。相对于生物量,农田土壤营养具有较低的主动累加、较高的被动累加,主要由于农田土壤营养除了受到自然系统的影响外,更多取决于人类向农田施加肥料的多少。农田生态系统主动影响的组分为城市,2012年农田以粮食供给的形式向城市提供了6.07×10¹⁹ sej的能值。农田生态系统则主要受地下水、城市的影响,城市以施用肥料和劳动力等形式投入农田(能值为1.3×10¹⁹ sej),水域生态系统主要供给作物生长的水分能(能值为2.15×10²⁰ sej)。农田生态系统总体而言容易受其他组分影响,而影响其他组分的能力较弱,其被动累加大于主动累加。从组分看,农田土壤营养和土壤水Q值均小于1,处于被动地位,而生物量由于大量的供给城市,其主动累加大于被动累加,表现为较为活跃的状态。
水域生态系统在整个区域起到重要作用,其流向城市系统的能值大于农田生态系统。同时,水域生态系统受到森林和农田土壤水的补给,其被动接受能值为1.25×10²⁰ sej。水域生态系统各组分的主动累加均大于被动累加,在整个系统中处于活跃状态。
4.3 涵养区生态系统服务的动态变化
本文从生态系统服务能值的变化和生态组分重要性变化两个方面来探究该时期内城市化进程对生态涵养区生态系统服务的影响进行探究。图8所示为2004年、2008年和2012年各项生态系统服务的变化情况。2004-2012年期间,森林和农田生态系统服务总能值呈现下降趋势,水域生态系统服务总能值呈现上升趋势。具体到各生态系统子服务:由于森林面积总体呈现减少趋势,因此其有机物生产、固碳释氧呈现下降趋势,与2004年相比分别下降了11.3%和8.1%;由于降雨量的增加,森林水源涵养服务能值比2004年增加了11%;而在森林面积减少和降雨增加的共同作用下,森林土壤形成服务下降了25.3%。对于农田生态系统,耕地面积的减少导致食物供给服务的下降,能值比2004年下降了41%。此外,耕地面积的减少也使得人类向农田的投入减少,加之土壤流失严重,营养元素循环和土壤形成能值呈现下降趋势。对于水域生态系统,增加最明显的是水源供给服务,其能值比2004年增加了32.3%,表明城市系统对水源供给服务需求日益上升。同时,由于2012年水量增加以及人类向水域生态系统投入逐年增加,水产品供给、气候调节和洪水调蓄服务也呈上升趋势。
 显示原图|下载原图ZIP|生成PPT
图8不同年份北京市生态涵养区生态系统服务能值
-->Fig. 8Ecosystem services emergy in different years of urban ecological conservation area in Beijing
-->
表3总结了不同生态系统类型的生态系统服务在2004年、2008年、2012年的主动累加(active sum, AS),被动累加(passive sum, PS)、总累加(total sum, TS)和主动累加与被动累加的比值(Q)。在不同的年份由于系统内部互相影响的作用不同,其值也出现波动。
Tab. 3
表3
表32004年、2008年和2012年北京市生态涵养区不同生态组分在系统中重要性比较
Tab. 3Importance of different ecological components in the system in 2004, 2008 and 2012
| 主动累加AS | 被动累加PS | 总累加TS | 主动累加/被动累加Q | ||||||||||||
|---|---|---|---|---|---|---|---|---|---|---|---|---|---|---|---|
| 2004 | 2008 | 2012 | 2004 | 2008 | 2012 | 2004 | 2008 | 2012 | 2004 | 2008 | 2012 | ||||
| 森林生态系统 | 1.4E+20 | 1.7E+20 | 3.0E+20 | 8.7E+19 | 1.3E+20 | 2.2E+20 | 2.3E+20 | 3.1E+20 | 5.1E+20 | 1.61 | 1.32 | 1.33 | |||
| 土壤水 | 3.3E+19 | 5.7E+19 | 1.3E+20 | 9.5E+18 | 3.3E+19 | 5.4E+19 | 4.2E+19 | 9.0E+19 | 1.8E+20 | 3.41 | 1.73 | 4.34 | |||
| 土壤营养 | 6.8E+19 | 8.2E+19 | 1.4E+20 | 9.8E+18 | 1.4E+19 | 2.5E+19 | 7.8E+19 | 9.7E+19 | 1.7E+20 | 6.96 | 5.84 | 5.72 | |||
| 生物量 | 4.1E+19 | 3.5E+19 | 2.5E+19 | 6.8E+19 | 8.4E+19 | 1.4E+20 | 1.1E+20 | 1.2E+20 | 1.7E+20 | 0.59 | 0.41 | 0.18 | |||
| 农田生态系统 | 7.8E+20 | 5.0E+20 | 1.5E+20 | 2.3E+20 | 2.0E+20 | 2.9E+20 | 1.0E+21 | 7.0E+20 | 4.4E+20 | 3.45 | 2.47 | 0.52 | |||
| 土壤水 | 7.9E+19 | 6.6E+19 | 1.1E+19 | 8.5E+19 | 9.2E+19 | 2.2E+20 | 1.6E+20 | 1.6E+20 | 2.3E+20 | 0.93 | 0.72 | 0.05 | |||
| 土壤营养 | 7.8E+19 | 4.9E+19 | 1.9E+19 | 5.1E+19 | 3.6E+19 | 1.3E+19 | 1.3E+20 | 8.5E+19 | 3.2E+19 | 1.51 | 1.36 | 1.47 | |||
| 生物量 | 6.2E+20 | 3.9E+20 | 1.2E+20 | 9.1E+19 | 7.6E+19 | 6.1E+19 | 7.1E+20 | 4.6E+20 | 1.8E+20 | 6.90 | 5.11 | 2.00 | |||
| 水域生态系统 | 6.5E+19 | 1.5E+20 | 2.9E+20 | 2.3E+19 | 1.1E+20 | 2.3E+20 | 8.8E+19 | 2.6E+20 | 5.2E+20 | 2.85 | 1.36 | 1.27 | |||
| 上游 | 5.2E+19 | 8.3E+19 | 2.2E+20 | 1.4E+19 | 7.4E+19 | 1.9E+20 | 6.5E+19 | 1.6E+20 | 4.0E+20 | 3.79 | 1.12 | 1.16 | |||
| 下游 | 1.4E+19 | 6.5E+19 | 7.6E+19 | 9.3E+18 | 3.5E+19 | 4.3E+19 | 2.3E+19 | 1.0E+20 | 1.2E+20 | 1.47 | 1.85 | 1.78 | |||
| 地下水 | 8.5E+15 | 1.0E+16 | 3.3E+16 | 6.6E+16 | 4.8E+16 | 4.9E+17 | 7.4E+16 | 5.8E+16 | 5.2E+17 | 0.13 | 0.22 | 0.07 | |||
| 城市系统 | 6.5E+21 | 9.9E+21 | 2.3E+22 | 2.4E+21 | 9.7E+21 | 2.4E+22 | 8.9E+21 | 2.0E+22 | 4.7E+22 | 2.71 | 1.03 | 0.95 | |||
新窗口打开
对于森林生态系统,森林面积的减少使得森林生物量的主动累加(AS)减少了80%,而降雨量的增加增强了土壤水的涵养能力及土壤营养流向其他组分的能力,因而土壤营养和土壤水的主动累加(AS)呈增加趋势。在此期间,大规模的森林保育工作使得各组分被动累加值(PS)增加。总体而言,森林生态系统表现为重要性(TS)增加,而由于森林生态系统的被动累加增幅大于主动累加,森林在整个系统中的活跃程度降低,但仍然发挥主导作用。
对于农田生态系统,伴随着耕地面积的减少,农田生态系统各组分的正向累积(AS)均随之减少,农田生态系统2012年总正向累积比2004年减少了81%。与此同时,其他系统对农田系统的能值投入也随之减少,表现为农田土壤营养和生物量被动累加(PS)减少。总体而言,农田生态系统的重要程度(TS)随着城市化进程的推进而降低,活跃程度也从主动状态(Q>1)变为被动状态(Q<1)。
对于水域生态系统,一方面,由于对水资源的需求量增加,上游、下游和地下水的主动累加(AS)均呈现增加趋势,另一方面,城市系统为获得更多水资源,对水域生态系统投入了更多能值进行资源开发和污染治理,使得水域生态系统的被动累积(PS)也有所增加。总体而言,这两方面作用共同促进了水域生态系统重要程度(TS)的提升。
对于城市系统,城市化进程的不断推进使得城市系统对生态系统服务的需求增加,即被动累加(PS)增加。与此同时,城市系统为了从自然系统获得更多的产品和服务,对自然系统的能值投入也在增加,即主动累加(AS)增加。从活跃程度来看,由于主动累加的增加幅度小于被动累加,城市系统由活跃性(Q>1)转向被动性(Q<1)。
5 讨论与结论
5.1 讨论
5.1.1 城市对生态系统的依赖 一个城市或城市群健康持续发展,离不开城市内部和周边生态系统提供多种多样的服务(表4)。Folke等运用生态足迹法估计,为欧洲波罗的海地区29个大城市提供资源消耗和废弃物同化的森林、农业、海洋和湿地生态系统的总面积,至少应是这29个大城市本身面积的565到1130倍[23]。Xie等引入生态足迹距离概念对北京市食物生态足迹的向外扩展进行测算,结果显示2008-2012年期间,北京市食物生态足迹距离从567 km增长到677 km,城市对外部生态资源的依赖范围和距离持续扩大,依赖程度也持续上升[24]。本文也证实了城市系统对周边地区生态系统服务的依赖。从能值影响矩阵的累加分析结果看,城市系统的被动累加值最大,分别是森林生态系统的110倍、农田生态系统的84倍、水域生态系统的106倍,这说明城市系统最容易受到其他组分的影响,是生态系统服务的主要消费者和汇。相比于其他方法,基于能值的核算可以把不同类型的生态系统服务在能值尺度上统一起来进行综合分析,能值影响矩阵在揭示城市对生态系统依赖程度的同时,还可以分析系统内各组分的相互作用及角色。Tab. 4
表4
表4相关研究结果对比
Tab. 4Comparison with relevant research results
| 年份 | 研究区域 | 研究方法 | 研究结果 | 数据来源 |
|---|---|---|---|---|
| 1997年 | 波罗的海地区29个大城市 | 生态足迹法 | 为欧洲波罗的海地区29个大城市提供资源消耗和废弃物同化的森林、农业、海洋和湿地生态系统的总面积,至少应是这29个大城市本身面积的565到1130倍 | [23] |
| 2008-2012年 | 北京市 | 生态足迹距离法 | 北京市食物消耗生态足迹从567 km增长到677 km,平均每年增长25 km | [24] |
| 2012年 | 北京市 | 能值核算和能值影响矩阵法 | 城市系统的被动累加值最大,是森林生态系统的110倍、农田生态系统的84倍、水域生态系统的106倍 | 本文 |
新窗口打开
5.1.2 城市化对生态系统服务的影响 城市化常常伴随着剧烈的土地利用变化,使原本的自然生态系统过程转变为以人类为中心的自然—社会经济系统过程,改变了系统内物质循环和能量流动,从而导致了生态系统功能和服务的变化,并影响各子系统在整个系统中的重要程度。具体到北京市生态涵养区,一方面,城市扩张侵占大量生态用地,直接导致森林生态系统有机物生产、固碳释氧服务和农田生态系统粮食供给服务能值产出的减少。另一方面,城市蔓延加剧了生态系统的破碎化,影响了生态系统自身的物质循环,加之气候变化的作用,使得森林和农田生态系统土壤形成服务、农田生态系统营养元素循环服务能值输出也有所减少。生态系统服务的变化进一步影响了各子系统间的能值流动。其中,森林生态系统和水域生态系统的总累加增加,在整个系统中的重要程度在增加,农田生态系统的总累加呈减少趋势,在整个系统中的重要程度降低。在未来的城市化进程中,森林和水域生态系统应成为重点保育的对象。
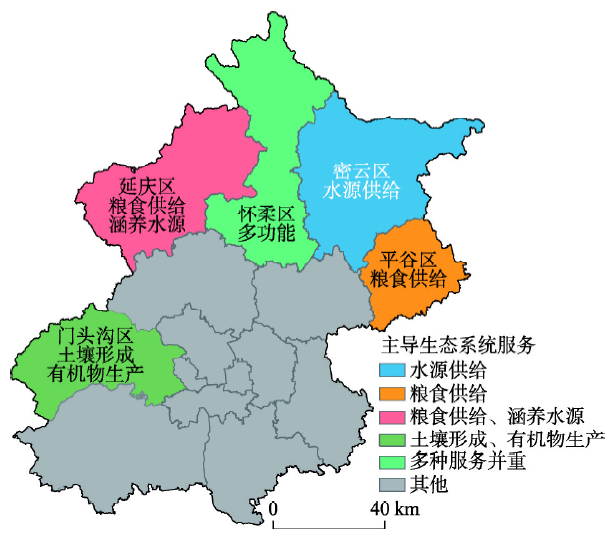
5.1.3 生态涵养区管理政策建议 在行政区管理方面(图9),门头沟区林地面积占比最大,达到70%,其主导的生态系统服务也与森林生态系统密切相关,能值排在前两位的土壤形成和有机物生产服务分别占该区域生态系统服务能值总量的25%和22.5%。该区域今后发展要着重注意森林的抚育和保护,充分发挥涵养区生态屏障的作用。平谷区有三分之一以上的土地属于京津唐城郊农业生态区,其土壤质量较高,因而粮食供给服务能值占该区域生态系统服务总能值比重最大,为25.6%。然而该地区土壤形成与保持服务能值仅占15%,远小于门头沟区,因此,该区域今后一方面要发挥其在农业上的优势,推行绿色农业生态农业,另一方面也要采取山坡防护工程和山沟治理工程等措施来防治水土流失。延庆区主导的生态系统服务为粮食供给和涵养水源,占总能值的20.2%和16.7%。然而,作为主要的水源涵养地,该区域水土流失近年来比较严重,在今后的发展中应该禁止乱砍滥伐,重点保护白河堡自然保护区的林、灌、草组成的水源涵养林及饮用水源。密云区提供的主要生态系统服务为水源供给和洪水调蓄,能值分别占该区域的20%和14.2%。由于该区域对于首都水源供给的重要作用,在未来的土地利用规划中,应严格保证水域面积,尽量防止周边地区的农业面源污染、工业点源污染,提高水源供给的质量。与其他区域相比,怀柔区的生态系统服务分布上比较均匀,水源涵养、森林有机物生产、土壤形成服务排列前三,分别占该区域总能值的20%、17.5%、16.3%。在今后的土地利用规划上,可以开发该区域生态用地的多功能性,尤其是依托当地的旅游资源,发展生态旅游。
 显示原图|下载原图ZIP|生成PPT
图9北京市各区主导生态系统服务
-->Fig. 9Dominative ecosystem services in each county of Beijing
-->
需要说明的是,由于数据获取的局限性,本文仅核算了城市周边一些重要的生态系统服务以揭示系统内组分能量的流动和转化。今后的研究可以考虑结合高分辨率的遥感数据,更精细地核算各类生态系统服务并展现系统内各组分的相互关系。
5.2 结论
本文应用能值分析方法研究了北京市生态涵养区的生态系统服务类型、数量、变化和流动,及其与城市系统的相互关系,主要研究结论如下:(1)从产生的生态系统服务能值量衡量,2012年北京市生态涵养区森林生态系统的生态系统服务贡献最大,其次为农田和水域生态系统。
(2)从各系统主导的生态系统服务类型上看,森林生态系统的有机物生产和水源涵养是其主要提供的生态系统服务,粮食供给是农田系统的主要能值输出,而水域提供的生态系统服务中,能值比例较高的依次为水源供给、洪水调蓄和水产品供给。
(3)城市是生态系统服务的主要消费区,也是生态系统服务的自然汇。对城市系统来说,森林生物量、森林土壤水、水域地下水和农田生物量是重要的生态系统服务供给组分。
(4)随着城市化进程的加快,北京市生态涵养区生态系统的重要性处在不断变化之中。2004-2012年,北京市生态涵养区森林和水域生态系统重要程度增加,农田生态系统重要程度有所减少。
The authors have declared that no competing interests exist.
参考文献 原文顺序
文献年度倒序
文中引用次数倒序
被引期刊影响因子
| [1] | . Peri-urban areas around urban agglomerations in Europe and elsewhere have been subject to agricultural and land use research for the past three decades. The manner in which farming responds to urban pressures, socio-economic changes and development opportunities has been the main focus of examination, with urban demand for rural goods and services representing a driving factor to adapt farming activities in a multifunctional way. Working within the peri-urban framework, this review pays particular attention to the relevance of multifunctional agriculture. Academic discourses and empirical insights related to farm structure and practices beyond conventional agriculture are analysed. Diversification, recreational and environmental farming, landscape management and specialisation, as well as direct marketing are all taken into consideration and discussed within the context of landscape functions. The provision of rural goods and services is contrasted with societal demands on peri-urban agriculture. This review finds that multifunctional agriculture has been commonly recognised in peri-urban areas a phenomenon that includes a large variety of activities and diversification approaches within the context of environmental, social and economic functions of agriculture. In response to the post-productive, consumption-oriented requirements of the urban society, peri-urban farmers have intensified their uptake of multifunctional activities. Nevertheless, not all multifunctional opportunities are being fully developed when one considers the large and growing urban demand for goods and services provided by agriculture carried out near the city. This paper discusses policy and planning approaches to support multifunctional agriculture in peri-urban areas. |
| [2] | . Urban planners are increasingly interested in agriculture around cities and have to decide whether to maintain or not areas of agricultural land use within and close to growing cities. There is therefore a need for researchers to design tools to guide public decision-making on land use. Various approaches, originating from different disciplines, may be adopted in this respect. We designed an interdisciplinary research program in order to test two related concepts: the "sustainability" and the "multi-functionality" of agriculture. We show that these concepts provide a useful framework for obtaining appropriate knowledge about urban agriculture, which urban planners could apply in real situations. In close collaboration with urban planners, we applied an interdisciplinary research methodology, based on common farm surveys and territorial approaches, to the Antananarivo area (Madagascar). The main functions analyzed were the food production and environmental roles of urban agriculture. Two aspects of sustainability were assessed: the farm sustainability and the territorial sustainability, with expert scores. This approach identified a wide diversity of farming systems that performed differently, depending on their intra- or suburban location. The food supply function appeared to be important not only for fresh produce but also for rice consumption. The function of protection against flooding is now important and this importance will increase with climate change. A diagnosis of sustainability was made and discussed with urban planners: several farming systems and zones were identified in which agriculture was considered important as a means of maintaining or developing the food supply, employment and incomes, and even landscape or environmental quality. We also identified other areas in which poor production conditions and/or the negative effects of urbanization on agriculture jeopardized its sustainability. This methodology appeared to be useful for determining the most appropriate role of urban agriculture in the land-use planning of this city. Our study raises new questions on the subject and should lead to more focused research programmes. We discuss several points of interest and the limitations and possible extension of this method. (C) 2011 Elsevier Ltd. All rights reserved. |
| [3] | . |
| [4] | . Assessment of the environmental impact of urban sprawl being understood here as the conversion of non-urban to urban land is still a subject for debate. Another shortcoming of the current discourse on urban sprawl is that it largely fails to reflect the interconnection of environmental and socio-economic aspects. In presenting a case study on the German city of Leipzig and applying the conceptual framework of driving forces, pressure, state, impact, and response (DPSIR-concept), this paper strives to assess the impact of urban sprawl on water balance and explores the repercussions of this impact upon the causation of and policies on urban sprawl. The study establishes that urban sprawl and related surface sealing have considerable impact on water fluxes and the urban water balance that may become imminent in the longer run. However, the study also shows that societal reactions on urban sprawl, first of all the attempts of both authorities and public initiatives to contain sprawl, are hardly motivated or influenced by concerns about environmental problems in a particular place (affected by urban sprawl). These attempts are mainly carried out on a national and regional level and reflect a general orientation in environmental politics rather than the desire to respond to individual urban developments. The study thus shows that the environmental impact of sprawl elicits only indirect repercussions in society. |
| [5] | . Sustainable flood management is moving up the policy agenda due to drivers such as climate change, the EU Water Framework Directive and the forthcoming EU floods Directive. At the same time, reform of the Common Agricultural Policy is under way. While there are currently few institutional links between flood risk management and agriculture, there is great potential for agriculture to become part of the solution to flood risk management rather than being part of the problem. A policy delphi study is carried out with an expert panel to investigate potential links, opportunities and barriers to integration in these two areas. The findings reveal that first, government policy needs to be “flood proofed” so that perverse incentives that could lead to increased flooding are avoided. Second, that the provision of accessible and effective advice and education for farmers and farm advisers on flood management is crucial and finally that future agricultural policy needs to offer connectivity both in terms of a comprehensive package of measures to address flood risk and in terms of addressing flood risk at both catchment-wide and single farm scales. |
| [6] | . Human activities have profoundly changed the land on which we live. In particular, land use and land management change affect the hydrology that determines flood hazard, water resources (for human and environmental needs) and the transport and dilution of pollutants. It is increasingly recognised that the management of land and water are inextricably linked (e.g. Defra, 2004). “Historical context, state of the science and current management issues” section of this paper addresses the science underlying those linkages, for both rural and urban areas. In “Historical context, state of the science and current management issues” section we discuss future drivers for change and their management implications. Detailed analyses are available for flood risk, from the Foresight Future Flooding project (Evans et al., 2004a,b) and other recent studies, and so we use flooding as an exemplar, with a more limited treatment of water resource and water quality aspects. Finally in “Science needs and developments” section we discuss science needs and likely progress. This paper does not address the important topic of water demand except for some reference to the Environment Agency's Water Resources Strategy for England and Wales (Environment Agency, 2009). |
| [7] | . The climate sensitivity to specification of agricultural and urban land cover was investigated using the climate version of the Pennsylvania State University/National Center for Atmospheric Research Mesoscale Model (MM5) for 1990 over northeastern United States. The simulations were for 5 yr at a spatial resolution of 36 km. Urbanization resulted in near-surface temperature increases of more than 1 K over the urban sites during both winter and summer. The increase in summer temperature due to urbanization was more widespread than that due to the effect of agricultural land use. The conversion of forest to agricultural land resulted in a decrease in temperature of more than 0.5 K during winter and an increase of more than 1 K during summer over the sites of perturbation. The reduced temperature during winter is related to snow cover. Agricultural lands are covered by snow while the trees in non-agricultural areas protrude through the snow, reducing the albedo of the surface. The warming during summer reflects reduced evaporation. Urbanization also reduces the diurnal temperature range (DTR) by about 0.4 K. |
| [8] | . One of the main options for greenhouse gas (GHG) mitigation identified by the IPCC is the sequestration of carbon in soils. Since the breaking of agricultural land in most regions, the carbon stocks have been depleted to such an extent, that they now represent a potential sink for CO 2 removal from the atmosphere. Improved management will however, be required to increase the inputs of organic matter in the top soil and/or decrease decomposition rates. In this paper we use data from selected regions to explore the global potential for carbon sequestration in arable soils. While realising that C sequestration is not limited to the selected regions, we have, however, focussed our review on two regions: (i) Canadian Prairies and (ii) The Tropics. In temperate regions, management changes for an increase in C involve increase in cropping frequency (reducing bare fallow), increasing use of forages in crop rotations, reducing tillage intensity and frequency, better crop residue management, and adopting agroforestry. In the tropics, agroforestry remains the primary method by which sequestration rates may be significantly increased. Increases in soil C may be achieved through improved fertility of cropland/pasture; on extensive systems with shifting cultivation cropped fallows and cover crops may be beneficial, and adopting agro forestry or foresting marginal cropland is also an alternative. In addition, in the tropics it is imperative to reduce the clearing of forests for conversion to cropland. Some regional analyses of soil C sequestration and sequestration potential have been performed, mainly for temperate industrialized North America where the majority of research pertaining to C sequestration has been carried out. More research is needed, especially for the Tropics, to more accurately capture the impact of region-specific interactions between climate, soil, and management of resources on C sequestration, which are lost in global level assessments. By itself, C sequestration in agricultural soils can make only modest contributions (3鈥6% of fossil fuel contributions) to mitigation of overall greenhouse gas emissions. However, effective mitigation policies will not be based on any single agic bullet solutions, but rather on many modest reductions which are economically efficient and which confer additional benefits to society. In this context, soil C sequestration is a significant mitigation option. |
| [9] | . We set the scene for this special issue by tracing some of the origins and history of the concept of urban-rural relationships. We then look at the more recent evolution of the concept in both the academic and policy literature. |
| [10] | . |
| [11] | . Rapid growth at the rural–urban fringe has resulted in increased commercial development along arterial roads connecting cities and the countryside. These developments, often termed “commercial strips” or “linear commercial complexes”, are characterized by a mix of many different types of businesses that often lack any separation from the road, spatial definition, or natural features such as trees. The result is too often an open, barren, confusing setting with little aesthetic appeal. Could a change in the design of the commercial setting or the addition of natural features improve the visual quality of the roadway at the rural–urban fringe? This study examines the extent to which local citizens prefer various development patterns for a roadway corridor at the fringe of a medium-sized community. Participants responded to a photo-questionnaire that included images of alternative design treatments for the roadside and written items dealing with visual quality. The results revealed moderate preference for the existing condition that showed a typical Midwestern US agricultural setting. The addition of various types of commercial development to the settings caused preference ratings to plummet. However, the addition of trees to the commercial development scenes increased preference ratings substantially. In fact, this low cost alteration in the design not only caused preference ratings to rebound, but actually exceed the ratings for the existing condition. Ratings were higher still for scenes in which trees were added to the existing condition. The findings suggest that nature plays an important role in the aesthetics of developed settings at the rural–urban fringe, and that trees in particular can be used to improve visual quality. This study has implications for the design of roadways and commercial developments at the fringe. |
| [12] | . |
| [13] | . Increasingly rural areas find themselves in an ambivalent urban context, tending both to build and to preserve the rural landscape. The question is how rural areas could overcome this ambivalence by establishing better relationships between urban and rural areas. In this paper, we aim to reflect on the role of rural–urban relationships. First, we will discuss the divergent perceptions on urban pressure in rural areas. Second, we will analyse the (f)actors for RGS development to enhance the rural landscape. Finally, we will elaborate a territorial approach based on different rural–urban relationships and establish an integrated supply of rural goods and services. The empirical content of this paper has been based on the results of the European project ‘Building new relationships in rural areas under urban pressure’ (RURBAN) conducted in five EU countries. |
| [14] | . Peri-urban areas are often characterized by valuable natural environments that provide essential life-support functions and ecosystem services for urban residents. Global environmental change has raised concerns over how urbanization and land use and land cover change affect ecosystem services. This study applied systems ecology theory and ecological energetic analysis to value the worth of natural environment and ecosystem services to a socioeconomic system. We begin with a general discussion of peri-urban areas and their ecosystem services. An emergy approach is applied to establish a framework for evaluating the ecosystem services by identifying systemic roles of each system components. The two-part framework includes: (1) an emergy evaluation of energetic flows of ecosystem services; and (2) an impact matrix to analyze systemic roles of services in the analyzed system. On the basis of the proposed valuation framework and land cover types in the greater Taipei area, this study analyzed ten ecosystems to determine how they interact, via energy flows, to contribute services to human society. By converting all stocks and flows into common emergy units, an impact matrix is constructed to analyze the systemic role of ecosystem components by classifying their status of being active, reactive, critical or indifferent. The analytical results indicate that the soil component of forest ecosystems, upstream rivers and agricultural productivity play critical role of ecosystem services in the study region. The effect of land cover change during 1971 2006 in the study region on ecosystem services is also analyzed. Finally, the implications of biophysical valuation of ecosystem service for spatial planning as related to adapting to global environmental change are discussed. |
| [15] | . 根据山区景观所具有的3层次功能和指标体系选取的原则,从美学、社会、生态3个方面,初步构建了4个层次的评价指标体系。在此基础上建立综合评判模型,应用于北京市怀柔区9个乡镇,得到如下结果:景观功能评价综合指数处在"较好"标准的有宝山镇和怀北镇;在"一般"标准的有喇叭沟门乡、雁栖镇、九渡河镇、长哨营乡;处在"较差"标准的有渤海镇、玻璃庙镇、汤河口镇。评价结果基本与实际相符,说明建立的评价指标体系与模型是可行的。 . 根据山区景观所具有的3层次功能和指标体系选取的原则,从美学、社会、生态3个方面,初步构建了4个层次的评价指标体系。在此基础上建立综合评判模型,应用于北京市怀柔区9个乡镇,得到如下结果:景观功能评价综合指数处在"较好"标准的有宝山镇和怀北镇;在"一般"标准的有喇叭沟门乡、雁栖镇、九渡河镇、长哨营乡;处在"较差"标准的有渤海镇、玻璃庙镇、汤河口镇。评价结果基本与实际相符,说明建立的评价指标体系与模型是可行的。 |
| [16] | [D]. [D]. |
| [17] | . 本文对北京市生态涵养区实施生态补偿的必要性进行论证,在调查制约生态涵养区发展现实困境的基础上,分析生态补偿实行现状与存在问题,阐明生态补偿的内涵与原则,对北京市生态涵养区生态补偿机制的实施途径进行深入系统的研究,探讨完善生态补偿机制的政策措施。 . 本文对北京市生态涵养区实施生态补偿的必要性进行论证,在调查制约生态涵养区发展现实困境的基础上,分析生态补偿实行现状与存在问题,阐明生态补偿的内涵与原则,对北京市生态涵养区生态补偿机制的实施途径进行深入系统的研究,探讨完善生态补偿机制的政策措施。 |
| [18] | |
| [19] | . 运用能值分析理论与方法对祁连山北坡东段的哈溪林区森林生态系统能值流以及生态服务功能价值进行了估算。结果表明:研究区森林生态系统输入能流高于输出能流,处于能量积累的过程中,低质能量通过能量流动向高质能量转化,生态系统处于较为安全的生长环境中;生态服务功能能值货币价值估算结果为有机质生产、涵养水源、土壤保持、CO2固定、净化空气5项生态系统服务功能总能值为9.35×10²¹sej,总能值货币价值为7.77×10⁸US$,涵养水源和土壤保持两项功能的能值货币价值明显高于其他服务功能,各项服务功能总价值大小顺序依次为:涵养水源〉土壤保持〉净化空气〉有机质生产〉CO2固定;涵养水源是哈溪林区森林生态系统最重要的生态服务功能,其能值货币价值占总能值货币价值的69.6%,各植被类型中灌木林提供的能值货币价值最大,而单位面积提供的能值货币价值最高的是乔木林。 . 运用能值分析理论与方法对祁连山北坡东段的哈溪林区森林生态系统能值流以及生态服务功能价值进行了估算。结果表明:研究区森林生态系统输入能流高于输出能流,处于能量积累的过程中,低质能量通过能量流动向高质能量转化,生态系统处于较为安全的生长环境中;生态服务功能能值货币价值估算结果为有机质生产、涵养水源、土壤保持、CO2固定、净化空气5项生态系统服务功能总能值为9.35×10²¹sej,总能值货币价值为7.77×10⁸US$,涵养水源和土壤保持两项功能的能值货币价值明显高于其他服务功能,各项服务功能总价值大小顺序依次为:涵养水源〉土壤保持〉净化空气〉有机质生产〉CO2固定;涵养水源是哈溪林区森林生态系统最重要的生态服务功能,其能值货币价值占总能值货币价值的69.6%,各植被类型中灌木林提供的能值货币价值最大,而单位面积提供的能值货币价值最高的是乔木林。 |
| [20] | . . |
| [21] | . . |
| [22] | . In this paper, Professor Vester introduces the readers of Systems Practice to his biocybernetic approach to systems planning, an approach that he has shown to be fruitful both in concrete applications and in many best-selling didactic publications, including children's books and games. Based on this approach he proposes a “cybernetic senstivity model,” a conceptual framework for ecologically sound systems design based on a biocybernetic redefinition of conventional techniques of systems modeling and simulation. The author explains the basic structure of the model and presents eight pertinent biocybernetic principles of good-systems practice. (Editor). |
| [23] | . |
| [24] | . A biologically productive area was used in the ecological footprint method to measure the demand and impact of human activities on the natural capital, and further, to judge whether the impact is within the scope of the regional bio-capacity. In this presentation, an indicator “ecological footprint distance (Def)” is proposed. The results indicated that the proposed indicator Def could identify the outward extension of a city’s ecological footprint with the city’s rapid expansion. From 2008 to 2012, the proportion of imported bio-capacity increased approximately from 48% to 64%, which implied that the ecological impact of Beijing had expanded year by year. The Def of Beijing increased from 567 km in 2008 to 677 km in 2012, with an average annual increase of about 25 km. From the perspective of seasonal change, Beijing’s ecological footprint distance in winter and spring was much higher than in summer and fall. The main features of provincial-spatial distribution of Beijing’s Def were as follows: grain and oil and meat and eggs were mainly supplied by Heilongjiang, Jilin, Liaoning, Hebei and Inner Mongolia; yet vegetable and fruit were mainly supplied by Hainan, Guangdong, Hebei and Shandong. Measures should be taken to decentralize the sources of imported bio-capacity, so as to ensure a sustainable development in Metropolitan cities. |
