Evaluation and uncertainty analysis of a two-source evapotranspiration model
WUGenan收稿日期:2016-04-7
修回日期:2016-07-18
网络出版日期:2016-11-25
版权声明:2016《地理学报》编辑部本文是开放获取期刊文献,在以下情况下可以自由使用:学术研究、学术交流、科研教学等,但不允许用于商业目的.
基金资助:
作者简介:
-->
展开
摘要
关键词:
Abstract
Keywords:
-->0
PDF (2480KB)元数据多维度评价相关文章收藏文章
本文引用格式导出EndNoteRisBibtex收藏本文-->
1 引言
蒸散(evapotranspiration, ET)是陆地生态系统最重要的过程之一,是水、能量与碳循环的核心,与生态系统生产力密切相关[1-2]。在水循环过程中,陆地上大约67%的降水会通过蒸散返回大气中,除南极洲外,全世界绝大多数流域蒸散量超过了径流量[3]。因此,研究区域尺度陆地生态系统蒸散的时空格局与变异规律对于区域及全球水、碳循环以及其对全球变化的响应非常重要。借助模型和遥感技术是刻画区域尺度蒸散时空格局与变化规律的基本手段。长期以来,蒸散模型得到了长足发展。其中,基于K理论的Penman-Monteith模型(P-M模型)是估算ET的经典方程,在此基础上,研究者进一步提出Shuttleworth-Wallace模型(S-W模型),从而在模拟蒸散总量的同时又对其组分,即土壤蒸发与植物蒸腾实现了拆分。S-W模型考虑到了生态系统水通量最重要的过程,计算过程相对简单,参数较少,同时取得了较好的模拟效果[3-5],因而得到广泛引用。研究表明S-W模型在不同的生态系统估算ET值相对其他模型具有较好的优势,特别是对于ET组分的拆分有很好的效果。例如,Kato[6]以波文比能量平衡法得到的蒸散量为实测值,比较了S-W模型和Penman-Monteith模型对蒸散模拟的差异,认为S-W模型在估算稀疏冠层的蒸散值时有较高的精确性[7]。Brisson比较了S-W模型的模拟值和实测值之间的差异,得出了同样的结论[8]。
虽然S-W模型在站点尺度上具有较好的模拟效果并得到广泛应用,然而,在区域尺度上,一些关键参数如气孔导度难以获取,其应用大大受到限制。针对该瓶颈问题,Hu等对S-W模型进行了改进,首先引入了Ball-Berry气孔导度模型,实现了基于气象数据和植被总初级生产力(Gross primary productivity, GPP)对冠层气孔导度的估算,在此基础上,通过引入基于光能利用率的GPP模型,实现了基于遥感数据的GPP和冠层导度的模拟[9],解决了S-W模型在区域尺度应用的关键问题,形成了新的SWH双源蒸散模型[10-11]。与其他模型相比较,SWH模型将蒸散过程模型与遥感模型相结合,兼具蒸散模拟的机理性与适用性,其驱动数据仅需植被覆盖指数(NDVI)、叶面积指数(LAI)等遥感数据及降水量等8个气象因子,数据易获取,便于进行大尺度和区域性的ET、GPP估算。SWH模型能够分别估算植物蒸腾与土壤蒸发,同时还模拟总初级生产力,便于蒸散过程机理的深入解析以及揭示生态系统碳水循环的耦合关系。另外,Zhang等还通过文献整合分析的方法,确定了全球主要植被类型的消光系数,大大解决了模型区域应用参数化问题[12]。初步结果表明,改进后的S-W模型,即SWH模型在中国一个森林生态系统站和一个草地生态系统站取得较理想的模拟效果[10]。
虽然SWH模型在少数站点取得较高的模拟精度,然而在区域尺度上其模拟效果尚未得到全面评价,另外,对于该模型的不确定性也缺乏深入的分析。本文旨在一方面评价该模型在中国区域对ET模拟的精度,另一方面基于模型主要参数与驱动变量的敏感性分析和不确定性分析的结果,量化模型不确定性大小与来源,并分析在不同生态系统(森林、草地、农田)和不同站点关键参数和驱动变量对模型模拟不确定性的贡献大小。本文首先收集了中国通量网(ChinaFLUX)在8个陆地生态系统的长期定位监测的ET数据,以及文献发表的基于涡度相关实测的中国境内43个站点的ET数据,用于评价模型在日尺度和年尺度上ET的模拟效果。其次量化了模型关键参数和驱动变量的敏感性和不确定性,在此基础上评价了参数和驱动变量对模型模拟不确定性的贡献大小。
2 材料与方法
2.1 SWH双源蒸散模型概述
SWH双源蒸散模型是基于S-W模型发展而来,Shuttleworth和Wallace提出了由串联双层模型衍生的Penman-Monteith公式,即S-W模型。S-W模型假设冠层和土壤的水热汇于冠层内的假想高度处,并作为水热通量源与大气进行湍流交换,即基于能量平衡原理和电学类比的方法描述H2O在土壤、植被、大气间的传输过程,并将冠层视为一片“大叶”,而不考虑这些过程在冠层内部的相互作用。其中,土壤表面阻抗rss和冠层阻抗rsc是SWH模型估算的关键参数[11],通过引入土壤表面阻抗方程和Ball-Berry气孔导度模型实现了对这两个参数的估算。SWH模型其他过程与参数估算方法与S-W模型一致[13],具体方法可参见原文或Hu等[10-11]。土壤表面阻抗rss估算方法为:式中:SW和SWS分别为土壤表层含水量和土壤表层的饱和含水量(m3 m-3);b1、b2和b3为经验参数(s m-1),b1取值为3.5 s m-1。
估算冠层阻抗rsc是结合气孔阻抗模型Ball-Berry模型求得:
式中:g0、a1为经验参数;Pn为光合速率(μmol m2 s-1);hs为冠层表面空气相对湿度(此处用空气相对湿度代替);Cs为气孔胞间的CO2浓度(可用涡度相关红外气体分析仪测得的冠层上方空气CO2浓度代替,取值为390 ppm)。Pn是估算rsc的关键驱动因子之一,此处,使用光能利用率模型估算的GPP代替Pn[2]:
式中:PAR为光合有效辐射;FPAR为植被冠层吸收的PAR占总入射PAR的比例(根据NDVI计算FPAR=1.24NDVI-0.618);ε为根据气温、土壤表层含水量、饱和水汽压差标准化后的光能利用率(
式中:εmax为表观量子效率或最大光能利用率;?(T)和?(VPD)分别为减量调节后温度和饱和水汽压差标量;Tmin、Tmax和Topt分别为温度最小值、温度最大值和光合作用最适温度。如果温度低于最小温度值或高于最大温度值,?(T)为0;Tmin、Tmax和Topt分别取值为0 oC、20 oC、40 oC。如果VPD<0.5 kPa,?(VPD)为1。如果估算出的?(VPD)小于0,则?(VPD)取值为0。VPDmax取值3.5 kPa。
2.2 数据来源
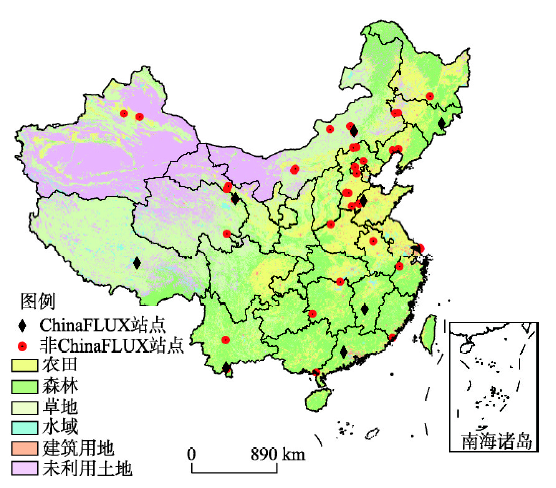
SWH模型驱动数据包括气候因子,如气温、降水、大气相对湿度、光合有效辐射、风速等及遥感数据归一化植被指数(NDVI)[10]。气候因子数据通过Anuspline软件包对中国750个观测站气候数据进行了空间插值得到(分辨率10 km)。NDVI来自GIMMS(global inventory modelling and mapping studies)NDVI产品和MODIS卫星影像产品中的MOD13Q1陆地专题产品。但由于影像受天气等因素的影响,使用TIMESAT 3.0软件包对影像进行处理,剔除质量较差的NDVI数据并进行插补。由于卫星影像数据为8天时间步长,因此模型的所有输入数据与输出数据皆为8天平均值。本文分别在8天尺度和年尺度验证模型的模拟效果,相应地,用于模型模拟效果验证的ET、GPP数据来自两个方面。其中,ChinaFLUX的8个地面监测站的长期监测数据用于8天尺度的模拟效果验证(图1),8个站点分别为长白山(CBS,2003-2006年)、鼎湖山(DHS,2003-2006年)、当雄(DX,2004-2005年)、海北灌丛(GCT,2003-2006年)、内蒙(NM,2004年)、千烟洲(QYZ,2003-2006年)、海北湿地(SD,2003-2006年)、禹城(YC,2003-2006年)站点。该数据集原始数据为半小时尺度连续数据,通过再计算求得8天平均值用于与模型输出的8天平均模拟值比较。另外,通过文献数据收集获取到43个非ChinaFlux站点的ET、GPP年总值数据用于年尺度模拟效果验证(图1)。有关8个ChinaFlux站点概况、观测系统、数据处理流程等信息可参考Yu等[14]。有关43个非ChinaFlux站点数据来源信息可参考Yu等[15]。
 显示原图|下载原图ZIP|生成PPT
图1验证数据站点分布图
-->Fig. 1The location of validated data sites
-->
2.3 数据分析方法
为了验证模型的模拟效果,分别在8天尺度和年尺度对模拟的ET、GPP与涡渡相关观测值进行线性回归分析,通过回归方程的斜率与决定系数(R2)判断模型的模拟效果。模型关键参数和驱动数据的敏感性通过计算该参数或驱动因子增加和减少10%时模型模拟值的变化百分率得出:式中:VR+10%为关键参数或驱动数据增加10%时模拟值变化的百分率;VR-10%为其减少10%时模拟值变化的百分率;VR10%为最终敏感性系数;runbase为其不变时对应的模拟值;run+10%为其增加10%时对应的模拟值;run-10%为其减少10%时对应的模拟值[16]。
模型的不确定性主要来自参数的不确定性和驱动数据的不确定性,因此本文的模型不确定性分析针对关键参数和驱动数据展开。关键参数对ET模拟的不确定性估算方法如下:
式中:Up为参数对ET模拟造成的不确定性大小;VRp为ET模拟结果对参数的敏感性系数;σP为参数自身不确定性。σP由给定的每个生态系统类型(即森林、草地、农田)参数的变异性来量化。由公式(10)可知,模型对参数越敏感,该参数所产生的不确定性越大。同时,参数自身的不确定性越大,对模型模拟造成的不确定性也越大。为了消除各参数数值量级差异以便于比较不同参数对ET模拟的不确定性,各参数的σP均以其均值进行标准化。
驱动数据对ET模拟的不确定性的估算方法为:
式中:Uv为驱动数据对ET模拟的不确定性;VRv为驱动数据的敏感性系数;
3 结果
3.1 模型区域模拟效果验证
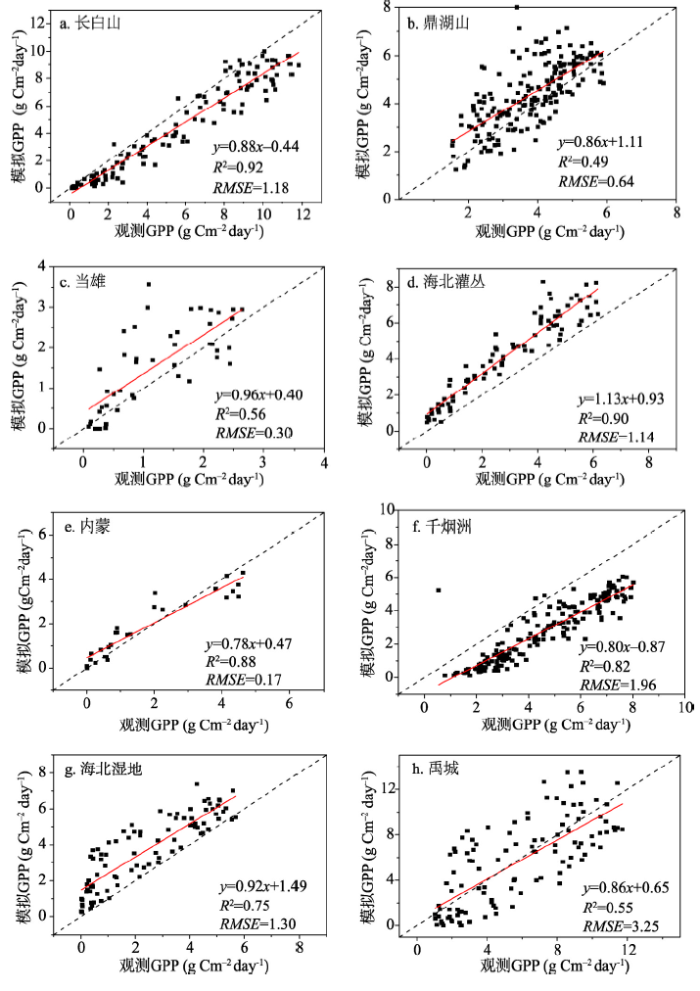
总体上来看,模型输出ET值、GPP值与其涡度相关测量值有较强的一致性,模型模拟的ET与实测ET线性回归方程的R2平均值为0.75,模拟的GPP与实测GPP的R2平均值为0.73(图2,图3)。在日尺度上,SWH模型能较好的模拟ET、GPP日均值。从各个站点结果来看,位于青藏高原的高寒草甸草原当雄、南方亚热带常绿林鼎湖山和温带旱作轮作农田禹城3个站点ET值和GPP值拟合效果较差。当雄站点ET均方根误差(RMSE)较其他站点偏高。另外,在温带针阔混交林长白山站和位于青藏高原的3个草地站(当雄、海北灌丛、海北湿地),模型模拟的ET低于观测值。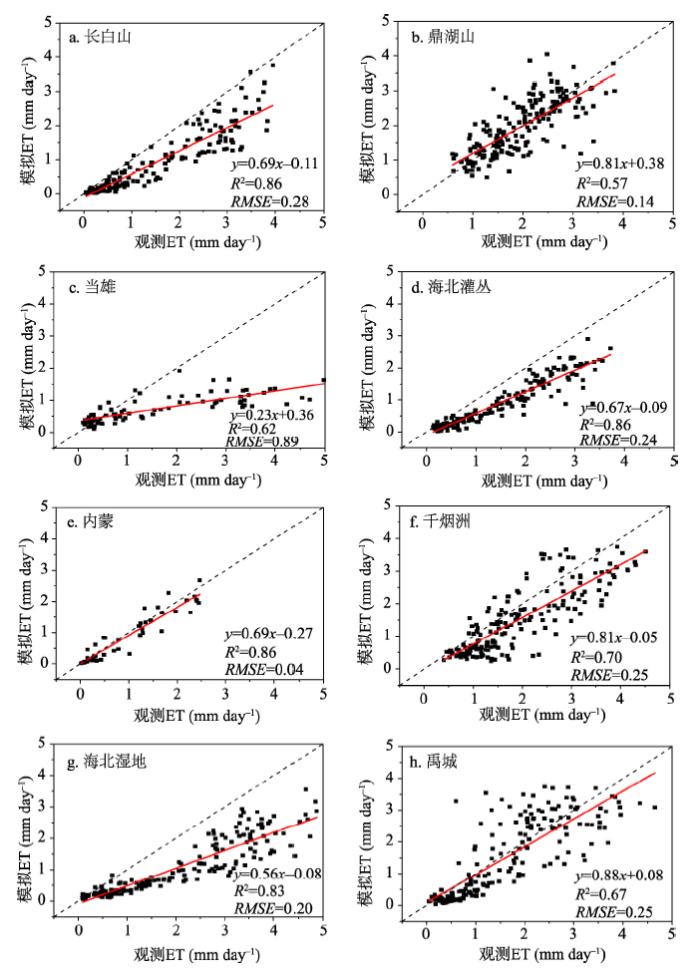 显示原图|下载原图ZIP|生成PPT
图28站点ET值日变化模拟验证(虚线为1:1线)
-->Fig. 2Comparisons of the values of modeled ET with observed ET at daily scale (The dotted line is 1:1 line)
-->
 显示原图|下载原图ZIP|生成PPT
图38站点植被总初级生产力GPP值日变化模拟验证
-->Fig. 3Comparisons of the values of modeled gross primary productivity (GPP) with observed GPP at daily scale
-->
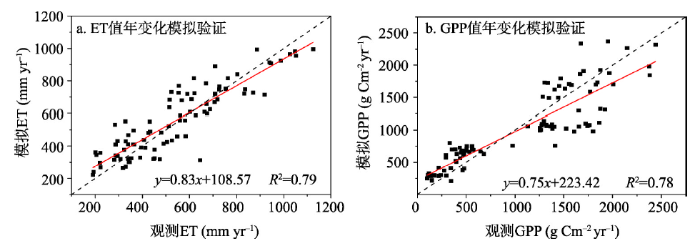
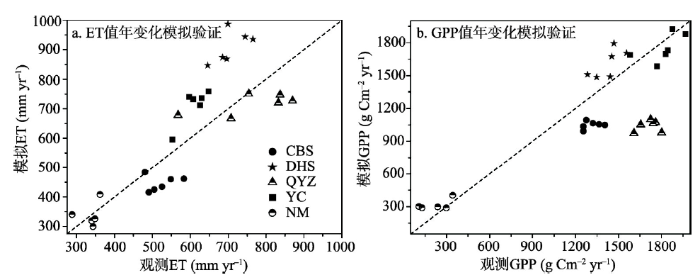
年尺度上,SWH模型模拟值与实测值之间也表现出较高的一致性(图4)。对于全国51个站点(8个ChinaFlux站点和43个非ChinaFlux站点),ET和GPP模拟年总量与实测年总量的R2分别为0.79(ET)和0.78(GPP)。从年变化上来看,比对了全国51个站点的ET、GPP的实测值与模拟值,模型的模拟效果也较好,但由于篇幅限制无法逐一站点进行分析,本文以长白山、千烟洲、鼎湖山、禹城、内蒙站点为例,ET、GPP多年实测值与模拟值变化趋势较为一致,具有较好的模拟效果。
 显示原图|下载原图ZIP|生成PPT
图4长白山、千烟洲、鼎湖山、禹城、内蒙站ET值、GPP值年变化模拟验证
-->Fig. 4Comparisons of the yearly values of modeled ET and GPP with observed ET in CBS, QYZ, DHS, YC and NM stations
-->
 显示原图|下载原图ZIP|生成PPT
图5长白山、千烟洲、鼎湖山、禹城、内蒙站ET值、GPP值年变化模拟验证
-->Fig. 5Comparisons of the yearly values of modeled ET and GPP with observed ET in CBS, QYZ, DHS, YC and NM stations
-->
3.2 模型不确定性分析
3.2.1 关键参数的不确定性分析 关键参数对ET的不确定性为关键参数敏感性系数与关键参数自身不确定性(变异系数)乘积。首先对SWH双源蒸散模型的关键参数(b2、b3、a1、g0、
Tab. 1
表1
表1各生态系统模拟蒸散对关键参数的敏感性(%)
Tab. 1Sensitivities of key variables and parameters for different ecosystems (%)
| b2 | b3 | a1 | g0 | d | εmax | 平均值 | |
|---|---|---|---|---|---|---|---|
| 农田 | 0.9 | 1.5 | 4 | 1.6 | 0.2 | 1.2 | 2.0 |
| 草地 | 2.6 | 0.8 | 3.4 | 1.9 | 0.3 | 1.6 | 2.1 |
| 森林 | 0.4 | 1.5 | 3.7 | 1.2 | 0.1 | 1 | 1.7 |
| 平均值 | 1.3 | 1.3 | 3.7 | 1.6 | 0.2 | 1.3 |
新窗口打开
通过对关键参数自身不确定性的量化,发现估算冠层气孔导度的两个参数a1、g0的不确定性(即变异系数)较大(表2),平均值分别为50.5%、97.6%,但该参数对模型的不确定性影响还需结合上文的敏感性结果来分析。整体上草地生态系统变异系数较大,平均值为56%,参数的波动幅度较大。
Tab. 2
表2
表2各生态系统参数自身的不确定性(%)
Tab. 2Uncertainties of key parameters fordifferent ecosystems (%)
| b2 | b3 | a1 | g0 | εmax | D | |
|---|---|---|---|---|---|---|
| 农田 | 18.4 | 36.4 | 50.7 | 89.3 | 13.6 | 31.4 |
| 草地 | 26.5 | 54.9 | 40.8 | 123.5 | 41.7 | 50.5 |
| 森林 | 22.9 | 29.7 | 60.0 | 80.0 | 27.3 | 45.1 |
| 平均值 | 22.6 | 40.3 | 50.5 | 97.6 | 27.5 | 42.3 |
新窗口打开
关键参数对ET模拟不确定性较大的为估算冠层气孔导度的两个参数a1、g0(表3),平均值分别为1.87%、1.57%,而受最大光能利用率εmax、土壤深度d影响最小。
Tab. 3
表3
表3各生态系统关键参数对ET模拟的不确定性(%)
Tab. 3Uncertainties of key parameters for modeling ofET for different ecosystems (%)
| b2 | b3 | a1 | g0 | εmax | D | |
|---|---|---|---|---|---|---|
| 农田 | 0.16 | 0.55 | 2.04 | 1.46 | 0.16 | 0.06 |
| 草地 | 0.69 | 0.42 | 1.39 | 2.32 | 0.67 | 0.13 |
| 森林 | 0.10 | 0.44 | 2.20 | 0.94 | 0.27 | 0.05 |
| 平均值 | 0.31 | 0.47 | 1.87 | 1.57 | 0.37 | 0.08 |
新窗口打开
受关键参数影响最大的为草地生态系统,平均值为0.94%,其次为农田生态系统,平均值为0.74%,最小的为森林生态系统,平均值为0.67%。另外,在草地生态系统中,用于估算GPP的重要参数最大光能利用率εmax不确定性远远大于其他两个类型的生态系统,这导致草地ET模拟效果主要依赖于GPP的模拟精度。
3.2.2 驱动数据的不确定性分析 驱动数据对ET的不确定性为驱动数据敏感性系数与自身不确定性的乘积。
首先对SWH双源蒸散模型的驱动数据(气温、降水、大气相对湿度、光合有效辐射、NDVI)进行了敏感性分析。敏感性较大的为NDVI、光和有效辐射、大气相对湿度,平均敏感性系数为5.9%、4.0%、4.0%,降水敏感性较小,其平均敏感性系数仅为0.7%(表4)。
Tab. 4
表4
表48站点模拟蒸散对驱动变量的敏感性(%)
Tab. 4Sensitivities of meteorological variables at 8 stations (%)
| 大气相对湿度 | 降水 | 光合有效辐射 | 气温 | NDVI | 平均值 | |
|---|---|---|---|---|---|---|
| 长白山 | 4.5 | 0.0 | 4.5 | 2.9 | 4.9 | 2.7 |
| 鼎湖山 | 4.5 | 0.0 | 4.5 | 3.1 | 5.8 | 3.1 |
| 当雄 | 2.9 | 0.9 | 2.9 | 1.4 | 7.2 | 2.7 |
| 海北灌丛 | 4.1 | 2.4 | 4.1 | 2.0 | 5.7 | 3.0 |
| 内蒙 | 5.6 | 0.4 | 5.6 | 4.4 | 7.6 | 3.9 |
| 千烟洲 | 4.1 | 1.4 | 4.1 | 0.8 | 6.1 | 2.6 |
| 海北湿地 | 4.3 | 0.3 | 4.3 | 3.5 | 5.8 | 2.8 |
| 禹城 | 2.2 | 0.1 | 2.2 | 2.9 | 4.3 | 2.1 |
| 平均值 | 4.0 | 0.7 | 4.0 | 2.6 | 5.9 |
新窗口打开
为了量化气候因子插值的不确定性,本文计算观测数据与插值数据的平均相对偏差来分析(数据皆为8天日均值),其中光合有效辐射、大气相对湿度、气温的不确定性较小(表5),平均值分别为16.8%、11.8%、33.4%,而降水的不确定性较大,平均值为62.8%。由于长白山、鼎湖山、千烟洲这3个森林生态系统站点风速实测值地点接近地面,而风速插补值地点位于冠层上方,导致实测值与插补值偏差较大,所以此处不考虑风速的不确定性。
Tab. 5
表5
表58站点气候驱动变量在各站点的不确定性(%)
Tab. 5Uncertainties of meteorological variables at 8 stations (%)
| 降水 | 光合有效辐射 | 大气相对湿度 | 气温 | |
|---|---|---|---|---|
| 长白山 | 110.8 | 10.9 | 11.0 | 26.9 |
| 鼎湖山 | 99.4 | 37.1 | 7.3 | 9.8 |
| 当雄 | 62.7 | 6.7 | 25.6 | 61.5 |
| 海北灌丛 | 45.8 | 6.2 | 10.1 | 72.3 |
| 内蒙 | 49.1 | 13.8 | 12.6 | 12.6 |
| 千烟洲 | 20.0 | 23.9 | 5.6 | 6.5 |
| 海北湿地 | 51.6 | 16.5 | 13.2 | 64.4 |
| 禹城 | 62.6 | 19.0 | 9.0 | 13.4 |
| 平均值 | 62.8 | 16.8 | 11.8 | 33.4 |
新窗口打开
驱动数据对ET的不确定性分析结果表明,气候驱动因子对ET模拟的不确定性总体较小(< 1%)。这说明插补的气象数据不确定性对SWH模型的模拟结果所造成的误差较小。模型对辐射和气温比较敏感(表4),然而由于其插补精度较高,因此对ET模拟所造成的不确定性较小。而另一方面,相比辐射和温度,降水的插补虽然存在较大的误差,但因模型对该驱动变量的敏感性较低,因此对ET模拟不确定性的贡献也较小。相比气候驱动数据,NDVI对模拟的不确定性贡献相对较大,其主要原因为NDVI是模型的核心驱动变量,模拟结果对其敏感性高(表2,表6)。
Tab. 6
表6
表68站点驱动数据对ET模拟的不确定性(%)
Tab. 6Uncertainties of meteorological variables for modeling of ET at 8 stations (%)
| 降水 | 光合有效辐射 | 大气相对湿度 | 气温 | NDVI | |
|---|---|---|---|---|---|
| 长白山 | 0.00 | 0.49 | 0.50 | 0.78 | 0.71 |
| 鼎湖山 | 0.00 | 1.67 | 0.33 | 0.30 | 0.84 |
| 当雄 | 0.56 | 0.19 | 0.74 | 0.86 | 1.04 |
| 海北灌丛 | 1.10 | 0.25 | 0.41 | 1.45 | 0.83 |
| 内蒙 | 0.20 | 0.77 | 0.71 | 0.55 | 1.10 |
| 千烟洲 | 0.28 | 0.98 | 0.23 | 0.05 | 0.88 |
| 海北湿地 | 0.15 | 0.71 | 0.57 | 2.25 | 0.84 |
| 禹城 | 0.06 | 0.42 | 0.20 | 0.39 | 0.62 |
| 平均值 | 0.29 | 0.69 | 0.46 | 0.83 | 0.86 |
新窗口打开
4 讨论
(1)本文主要在前期的研究基础上,评估了SWH双源蒸散模型在区域尺度上的模拟效果与不确定性。结果表明,模型整体模拟效果较为准确,日尺度上将实测ET与模拟ET比较,R2均值为0.75;年尺度上将实测ET与模拟ET比较,R2为0.79。与目前常见的ET模型比较,SWH的模拟效果相近或有所提升。例如,Cleugh[18]应用P-M模型对澳大利亚两个生态系统通量站点进行ET模拟验证表明,模拟值与实测值之间的R2为0.74。Mu等[19]对改进后MODIS ET产品验证表明,该模型算法在46个Fluxnet通量站模拟值与实测值间的相关系数R最高为0.86(R2 = 0.74)。Hu[10]曾应用SWH模型对长白山、海北灌丛两个站点进行了蒸散模拟,模拟值与实测值之间的R2平均值为0.93和0.89,但由于其关键参数为基于站点优化的模型参数,因此研究结果与其相比(长白山、海北灌丛站点ET模拟值与实测值R2均为0.86),已较为接近,模拟效果理想。(2)对SWH双源蒸散模型的不确定性分析表明,各参数中对ET模拟不确定性较大的为估算冠层导度涉及的a1、g0,而驱动数据中对蒸散模拟不确定性较大的为NDVI,3个要素均达到0.8%以上,是模型模拟不确定性重要的来源。各站点模拟结果显示,模型在南方亚热带常绿林(鼎湖山)和青藏高原高寒草原(当雄)模拟效果较差。其中,南方亚热带常绿林鼎湖山站R2为57%,其原因可能主要是由NDVI的不确定性所致的。在亚热带常绿林地区,多云天气占很大比重,这将直接导致NDVI数据的质量大幅度降低。同时本文的结果表明,由于GPP的模拟也很大程度依赖NDVI,其模拟精度也较差(R2 = 0.49),这又进一步传递到ET的模拟过程,导致ET模拟变差。位于青藏高原的3个高寒草原生态系统(当雄、海北湿地、海北灌丛)模拟值均不同程度低于观测值。其主要原因是由影响ET模拟的关键参数之一a1的不确定性所致。本文基于单站点的参数优化结果显示,青藏高原几个生态系统的a1约是其他地区生态系统的2倍,这可能与青藏高原特殊的地理环境有关。由于SWH模型需在区域尺度模拟,因此本文采用所有站点求平均得到a1来估算每个生态系统的ET,故而造成ET显著低估。因此,考虑到青藏高原生态系统的特殊性,未来有必要单独针对该地区生态系统建立一套模型参数。
(3)除了估算冠层导度的参数a1和g0,草地生态系统ET模拟效果还很大程度受到最大光能利用效率εmax的影响。εmax是估算GPP的重要参数,比较而言,该参数对草地ET模拟的不确定性的贡献是森林和农田的2~3倍(表4)。因此,改进GPP光能利用率模型,降低εmax的不确定性也将是提升SWH模型模拟效果的重要方向之一。
(4)在气候数据中,本文由于森林生态系统站风速仪位于林冠下层,而空间插补的风速为开阔地带地表上方的风速,两者不具有可比性,从而未量化所有站点的不确定性,但是,在几个草地站点(当雄、海北灌丛、内蒙、海北湿地),比较了实测风速与插补风速的平均偏差,并计算了其敏感性系数以及对模型不确定性的贡献大小,其风速敏感性系数均值为1.0%,自身不确定性(平均偏差)均值为16.7%,对SWH模型不确定性均值为16.4%。与其他气候因子以及NDVI相比,对模型的不确定性贡献较小。未来会完善对数据的获取,量化风速的不确定性,进一步完成有关研究。
5 结论
(1)本文验证了SWH模型在区域尺度对蒸散的模拟效果,模拟效果整体较好,日尺度上,模型模拟的ET与实测ET线性回归方程的R2平均值为0.75,模拟的GPP与实测GPP的R2平均值为0.73。年尺度上,ET和GPP模拟值与实测值的R2分别为0.79、0.78。(2)分析了模型的不确定性,其中估算气孔导度的参数a1、g0以及NDVI对于模型不确定性的影响贡献最大。除了估算冠层导度的两个参数,各生态系统相比较,最大光能利用率对草地ET模拟造成的不确定性最大。
(3)青藏高原草地生态系统ET模拟存在低估,估算气孔导度的两个参数a1、g0是造成低估的主要原因,尤其是参数a1较其他草地生态系统站点高,对于此类特殊地理环境站点,在未来研究中,可使用独立的最优参数进行单独的蒸散模拟,从而提高此区域蒸散模拟精度。
(4)气候因子插补误差对模型模拟造成的不确定性贡献较小,尽管部分数据(如降水)因插补存在较大的误差,但遥感驱动数据NDVI对模拟结果影响更大,尤其是在南方亚热带常绿林地区。
(5)SWH模型尚存在不足之处,对于冠层蒸发未进行估算,这也可能是造成模型不确定性的一个原因。在冠层密闭且降水充裕的生态系统,冠层蒸发可占蒸散总量的10%以上,因此在未来的研究中,可对模型进行进一步改进,考虑冠层蒸发因素,量化冠层蒸发的不确定性,与其他关键参数和驱动数据的不确定大小比较,提高模型精度。
The authors have declared that no competing interests exist.
参考文献 原文顺序
文献年度倒序
文中引用次数倒序
被引期刊影响因子
| [1] | . We developed a new method to estimate terrestrial evapotranspiration (ET) from satellite data without using meteorological inputs. By analyzing observations from 20 eddy covariance tower sites across continental North America, we found a strong relationship between monthly gross primary production (GPP) and ET (R-2=0.72-0.97), implying the potential of using the remotely sensed GPP to invert ET. We therefore adopted the Temperature-Greenness model which calculates 16 day GPP using MODIS EVI and LST products to estimate GPP and then to calculate ET by dividing GPP with ecosystem water use efficiency (the ratio of GPP to ET). The proposed method estimated 16 day ET very well by comparison with tower-based measurements (R-2=0.84, p<0.001, n=1290) and provided better ET estimates than the MODIS ET product. This suggests that routine estimation of ET from satellite remote sensing without using fine-resolution meteorological fields is possible and can be very useful for studying water and carbon cycles. |
| [2] | . Water is a naturally circulating resource that is constantly recharged. Therefore, even though the stocks of water in natural and artificial reservoirs are helpful to increase the available water resources for society, the flow of water should be the main focus in water resources assessments. The climate system puts an upper limit on the rate of available renewable freshwater resources (RFWR). Although current global withdrawals are well below the upper limit, more than two billion people live in highly water-stressed areas because of the uneven distribution of RFWR in time and space. Climate change is expected to accelerate water cycles and thereby increase the available RFWR. This would slow down the increase of people living under water stress; however, changes in seasonal patterns and increasing probability of extreme events may offset this effect. Reducing current vulnerability will be the first step to prepare for such anticipated changes. |
| [3] | . Eddy correlation measurements of sensible and latent heat flux are used with measurements of net radiation, soil heat flux, and other micrometeorological variables to develop the Penman-Monteith, Shuttleworth-Wallace, and modified Priestley-Taylor evapotranspiration models for use in a sparsely vegetated, semiarid rangeland. The Penman-Monteith model, a one-component model designed for use with dense crops, is not sufficiently accurate (r= 0.56 for hourly data and r= 0.60 for daily data). The Shuttleworth-Wallace model, a two-component logical extension of the Penman-Monteith model for use with sparse crops, performs significantly better (r= 0.78 for hourly data and r= 0.85 for daily data). The modified Priestley-Taylor model, a one-component simplified form of the Penman potential evapotranspiration model, surprisingly performs as well as the Shuttle worth-Wallace model. The rigorous Shuttleworth-Wallace model predicts that about one quarter of the vapor flux to the atmosphere is from bare-soil evaporation. Further, during daylight hours, the small leaves are sinks for sensible heat produced at the hot soil surface. |
| [4] | . The accurate determination of vineyard evapotranspiration (ET) in the arid desert region of northwest China is important for allocating irrigation water and improving water use efficiency. Taken a vineyard at the Shiyang river basin of the Hexi corridor of Gansu Province as an example, this study evaluated the applicability of the Bowen ratio-energy balance (BREB) method in the arid desert region of northwest China, simulated the variation of vineyard ET by Penman–Monteith (P–M), Shuttle–Wallace (S–W) and Clumping (C) models in this region and compared the estimated ET by the three models with the measured ET by the BREB. Results indicated that the BREB could provide the accurate measurement of vineyard ET from the arid desert region when the Bowen ratio instrument with higher accuracy was correctly installed. Generally, the variation of the estimated ET from P–M, S–W and C models were similar to that of the measured ET by the BREB method. However, the P–M model overestimated the ET significantly; the estimated ET from the S–W and C models, especially from the C model was approximately equal to the measured ET by the BREB. After a rainfall, the performances of the S–W and C models were also good. Therefore, among the three models, the C model was the optimal model in simulating the vineyard ET in the arid region of northwest China. However, after a frost, the C model significantly overestimated the evapotranspiration because the canopy resistance did not fully reflect the dramatic decrease of grapevine transpiration. |
| [5] | . The Shuttleworth and Wallace (SW) model with variable canopy resistance was evaluated to estimate evapotranspiration (ETv) from a drip-irrigated Merlot ( Vitis vinifera L.) vineyard trained on a vertical shoot-positioned (VSP) system. This vineyard is located in the Talca Valley, Region del Maule, Chile (35°25′ LS; 71°32′ LW; 12502m a.s.l). The performance of the SW model was evaluated using the eddy-covariance method on a 3002min time interval. Also, sub-models to estimate net radiation (Rn) and soil heat flux ( G ) were used in the SW model. A good agreement between observed and estimated values of Rn was found with a root mean square error (RMSE) of 3302W02m 612 and a mean absolute error (MAE) of 2402W02m 612 . Also, the SW model was able to estimate latent heat flux with RMSE and MAE of 34 and 2102W02m 612 , respectively. On a daily basis, results indicate that the SW model was able to predict the ETv with RMSE and MAE values of 0.51 and 0.4102mm02d 611 , respectively. These results suggest that it is possible to directly estimate ETv over unstressed grapevines using meteorological data and soil moisture measurements. |
| [6] | 对NOAH陆面模式模拟的近30年中国陆地蒸散量和土壤含水量,按照6大片区和5种生态系统类型进行了统计分析。讨论全国以及各大区不同生态系统类型蒸散和土壤含水量的变化,研究不同类型蒸散和土壤含水量的关系。中国陆地蒸散量总体呈增加的趋势,年内蒸散量最大的月份是7月,年末和年初蒸散量较小。而我国中南、西南、华东、东北和西北蒸散量变化趋势和全国的总趋势一致,呈增加的趋势。华北地区蒸散量近30年来总体趋势是下降的,华北蒸散量最大的年份是上世纪90年代。在所有生态系统类型中,林地蒸散最大的有东北、华东、西南和中南4区;而华北和西北草地在各类型中蒸散量所占比例最高。6大片区对比,林地蒸散水量最大的地区是西南和中南,最小的西北;草地蒸散水量最大的地区是西南,最小的是东北区;农田蒸散水量最高的是华东,最低的是西北;荒漠蒸散量最大的片区是西北;湿地蒸散最大的是东北。80年代以来,全国土壤含水量总体呈下降的趋势。从各片区的情况看,仅西北地区稍有增加,其余5区土壤含水量皆是下降的。植被覆盖度和土壤水分是影响蒸散量最重要的因子,在植被覆盖较差时,土壤水分和蒸散量相关性较好。 . 对NOAH陆面模式模拟的近30年中国陆地蒸散量和土壤含水量,按照6大片区和5种生态系统类型进行了统计分析。讨论全国以及各大区不同生态系统类型蒸散和土壤含水量的变化,研究不同类型蒸散和土壤含水量的关系。中国陆地蒸散量总体呈增加的趋势,年内蒸散量最大的月份是7月,年末和年初蒸散量较小。而我国中南、西南、华东、东北和西北蒸散量变化趋势和全国的总趋势一致,呈增加的趋势。华北地区蒸散量近30年来总体趋势是下降的,华北蒸散量最大的年份是上世纪90年代。在所有生态系统类型中,林地蒸散最大的有东北、华东、西南和中南4区;而华北和西北草地在各类型中蒸散量所占比例最高。6大片区对比,林地蒸散水量最大的地区是西南和中南,最小的西北;草地蒸散水量最大的地区是西南,最小的是东北区;农田蒸散水量最高的是华东,最低的是西北;荒漠蒸散量最大的片区是西北;湿地蒸散最大的是东北。80年代以来,全国土壤含水量总体呈下降的趋势。从各片区的情况看,仅西北地区稍有增加,其余5区土壤含水量皆是下降的。植被覆盖度和土壤水分是影响蒸散量最重要的因子,在植被覆盖较差时,土壤水分和蒸散量相关性较好。 |
| [7] | . Using the Shuttleworth and Wallace (S-W) model, evapotranspiration (ET); transpiration ratio (T/ET), which is the ratio of transpiration (T) to ET; and water-use efficiency (WUE) were estimated for a sparsely planted sorghum canopy that was well irrigated. That model is designed to estimate separately the evaporation from soil and transpiration from crops. The evapotranspiration estimates for both short- and long-term measurement periods coincided closely with the Bowen ratio energy balance (BREB) measurements. The transpiration ratios were affected by the canopy resistances and the soil surface resistances during the day. The regression curve between leaf area index (LAI) and transpiration ratio suggests that LAI, less than 1.6, determined the transpiration ratio in the absence of water stresses by soil water drought and extreme weather condition. The WUEs for transpiration (WUEt) and evapotranspiration (WUEet), which are the total dry matter (TDM) production for 1 kg T and ET, reached the peaks of 9.0 and 4.5 g kg |
| [8] | . In crop models maximum transpiration is an important component of the computation of water stress factors. It depends on reference climatic variables and leaf area index, and also on soil evaporation which modifies the actual air properties around the plants. This last effect is not accounted for in classical approaches used in crop models. Yet Shuttleworth and Wallace theory offers a framework to simulate canopy and soil evaporation fluxes in a coupled way. In this paper an adaptation and a parameterisation of the basic equations from Shuttleworth and Wallace is proposed, allowing use of the model to calculate maximum transpiration by using daily variables. The adaptation concerns soil evaporation. A potential soil evaporation is calculated assuming that, when the soil surface is wet, total evaporative flux consumes the whole available energy. It is used as an input to a two-staged model to calculate actual soil evaporation. The parameterisation relies on two field experiments performed on well-irrigated soybean. Measurements of net radiation balance show that radiation extinction within the canopy is less than generally admitted. Simulations of daily soil evaporation exhibit the same dynamics as microlysimeter measurements, which can be high even when the crop is fully developed. Bulk canopy resistances derived from Bowen ratio measurements agree closely with values obtained from classical formulae using a mean stomatal resistance of 250 ms. The modified and properly parameterised model shows that the contribution of plants to total evapotranspiration is highly variable as a result of the interactions between direct soil evaporation and plant transpiration. |
| [9] | . Light use efficiency (LUE) models that with different structures (i.e., methods to address environmental stresses on LUE) have been widely used to estimate terrestrial gross primary production (GPP) because of their theoretical soundness and practical conveniences. However, a systematic validation of those models with field observations across diverse ecosystems is still lacking and whether the model can be further improved by structural optimization remains unclear. Using GPP estimates at global 51 eddy covariance flux towers that cover a wide climate range and diverse vegetation types, we evaluated the performances of the four major LUE models (i.e., Carnegie-Ames-Stanford approach (CASA), Global Production Efficiency Model (GLO-PEM), Vegetation Photosynthesis Model (VPM), and Eddy Covariance-Light Use Efficiency (EC-LUE)) and examined the possible further improvement of the better-performed model(s) via model structural optimization. Our results showed that the GLO-PEM, VPM, and EC-LUE exhibited the similar capabilities in simulating GPP (explained around 68% of the total variations) and overall performed better than CASA (58%). Nevertheless, the EC-LUE and VPM were the optimal ones because they required less model inputs than the GLO-PEM. For the two optimal models, we found that the minimum method is better than the multiplication approach to integrate multiple environmental stresses on LUE. Moreover, we found that the VPM can be further improved by incorporating the constraint of water vapor deficit (VPDs). We suggested that a modified VPM by using minimum method and adding VPDs may be the best model in estimating large-scale GPP if high-quality remote sensing data available, otherwise, the modified models with the water stress reflected by VPDs only is optimal. |
| [10] | . Modeling and partitioning ecosystem evapotranspiration (ET) are important in predicting the responses of ecosystem water cycles to global climate change and land use. By incorporating the Ball-Berry stomatal conductance model and a light use efficiency-based gross primary productivity (GPP) model into the Shuttleworth-Wallace model, we developed a new model, SWH, for estimating ET with meteorological data and remote sensing products. Since the new model solved the problem of estimating canopy stomatal conductance, it can be used at sites equipped with meteorological observation systems around the world. Compared with eddy covariance measurements, the SWH model demonstrated satisfactory estimates of ET at a temperate forest and an alpine grassland. Eight meteorological variables and two remote sensing products (i.e., leaf area index, LAI, and enhanced vegetation index, EVI or normalized difference vegetation index, NDVI, or fraction of photosynthetically active radiation, FPAR) are required in our model. This will facilitate estimates of ET and its components, and further elucidate the mechanisms underlying their variations at regional scale. In addition, our model estimates ET and GPP simultaneously, making it convenient to address the coupling of these two key fluxes in terrestrial ecosystems. (C) 2013 Elsevier B.V. All rights reserved. |
| [11] | . Quantifying the partitioning of evapotranspiration (ET) and its controls are particularly important for accurate prediction of the climatic response of ecosystem carbon, water, and energy budgets. in this study, we employed the Shuttleworth-Wallace model to partition ET into soil water evaporation (E) and vegetation transpiration (7) at four grassland ecosystems in China. Two to three years (2003-2005) of continuous measurements of ET with the eddy covariance technique were used to test the long-term performance of the model. Monte Carlo simulations were performed to estimate the key parameters in the model and to evaluate the accuracy in model partitioning (i.e. E/ET). Results indicated that the simulated ET at the four ecosystems was in good agreement with the measurements at both the diurnal and seasonal timescales, but the model tended to underestimate ET by 3-11% on rainy days. probably due to the lack of model representation of rainfall interception. In general, E accounted for a large proportion of ET at these grasslands. The monthly E/ET ranged from 12% to 56% in the peak growing seasons and the annual E/ET ranged from 51% to 67% across the four ecosystems. Canopy stomatal conductance controlled E/ET at the diurnal timescale, and the variations and magnitude of leaf area index (LAI) explained most of the seasonal, annual, and site-to-site variations in E/ET. A simple linear relationship between growing season LAI and E/ET explained ca. 80% of the variation observed at the four sites for the 10 modeled site-years. Our work indicated that the daily E/ET decreased to a minimum value of ca. 10% for values of LAI greater than 3 m(2) m(-2) at the ecosystem with a dense canopy. The sensitivities of E/ET to changes in LAI increased with the decline in water and vegetation conditions at both the seasonal and the annual time scales, i.e., the variations in LAI could cause stronger effects on E/ET in the sparse-canopy ecosystems than in the dense-canopy ecosystems. It implies that the hydrological processes and vegetation productivity for ecosystems in and environments might be more vulnerable to projected climate change than those in humid environments. (C) 2009 Elsevier B.V. All rights reserved. |
| [12] | . The canopy light extinction coefficient (K) is a key factor in affecting ecosystem carbon, water, and energy processes. However, K is assumed as a constant in most biogeochemical models owing to lack of in-site measurements at diverse terrestrial ecosystems. In this study, by compiling data of K measured at 88 terrestrial ecosystems, we investigated the spatiotemporal variations of this index across main ecosystem types, including grassland, cropland, shrubland, broadleaf forest, and needleleaf forest. Our results indicated that the average K of all biome types during whole growing season was 0.56. However, this value in the peak growing season was 0.49, indicating a certain degree of seasonal variation. In addition, large variations in K exist within and among the plant functional types. Cropland had the highest value of K (0.62), followed by broadleaf forest (0.59), shrubland (0.56), grassland (0.50), and needleleaf forest (0.45). No significant spatial correlation was found between K and the major environmental factors, i.e., mean annual precipitation, mean annual temperature, and leaf area index (LAI). Intra-annually, significant negative correlations between K and seasonal changes in LAI were found in the natural ecosystems. In cropland, however, the temporal relationship was site-specific. The ecosystem type specific values of K and its temporal relationship with LAI observed in this study may contribute to improved modeling of global biogeochemical cycles. |
| [13] | . Abstract A one-dimensional model is adopted to describe the energy partition of sparse crops. Theoretical development of this model yields a combination equation which describes evaporation in terms of controlling resistances associated with the plants, and with the soil or water in which they are growing. the equation provides a simple but physically plausible description of the transition between bare substrate and a closed canopy. Although the aerodynamic transfer resistances for incomplete canopies have, as yet, no experimental justification, typical values, appropriate to a specimen agricultural crop and soil, are shown to have limited sensitivity in the model. Processes which require further study if the equation is to be used to calculate evaporation throughout a crop season are also discussed. |
| [14] | . The Chinese Terrestrial Ecosystem Flux Research Network (ChinaFLUX) is a long-term national network of micrometeorological flux measurement sites that measure the net exchange of carbon dioxide, water vapor, and energy between the biosphere and atmosphere. The ChinaFLUX network includes 8 observation sites (10 ecosystem types) and encompasses a large range of latitudes (21°57′N to 44°30′N), altitudes, climates and species. It relies on the existing Chinese Ecosystem Research Network (CERN), fills an important regional gap and increases the number of ecosystem types in FLUXNET. Data and site information are available online at the ChinaFLUX web sites ( http://www.chinaflux.org/ ). Expanding the scope of the FLUXNET database, ChinaFLUX offers new opportunities to quantify and compare the magnitudes and dynamics of annual ecosystem carbon and water balance and to explore the biotic and abiotic effects on ecosystem processes of carbon dioxide and water vapor exchange that are unique to ecosystems in China, such as the vegetation communities on the Qinghai–Tibet plateau. Besides, ChinaFLUX also provides more insights to help define the current status and enable future prediction of the global biogeochemical cycles of carbon, water and trace gases. Recent findings from the ChinaFLUX network are summarized in both micrometeorological and ecological aspects. This paper also summarizes these results and makes recommendations for the research priorities in ChinaFLUX. |
| [15] | . Understanding the dynamics and underlying mechanism of carbon exchange between terrestrial ecosystems and the atmosphere is one of the key issues in global change research. In this study, we quantified the carbon fluxes in different terrestrial ecosystems in China, and analyzed their spatial variation and environmental drivers based on the long-term observation data of ChinaFLUX sites and the published data from other flux sites in China. The results indicate that gross ecosystem productivity (GEP), ecosystem respiration (ER), and net ecosystem productivity (NEP) of terrestrial ecosystems in China showed a significantly latitudinal pattern, declining linearly with the increase of latitude. However, GEP, ER, and NEP did not present a clear longitudinal pattern. The carbon sink functional areas of terrestrial ecosystems in China were mainly located in the subtropical and temperate forests, coastal wetlands in eastern China, the temperate meadow steppe in the northeast China, and the alpine meadow in eastern edge of Qinghai-Tibetan Plateau. The forest ecosystems had stronger carbon sink than grassland ecosystems. The spatial patterns of GEP and ER in China were mainly determined by mean annual precipitation (MAP) and mean annual temperature (MAT), whereas the spatial variation in NEP was largely explained by MAT. The combined effects of MAT and MAP explained 79%, 62%, and 66% of the spatial variations in GEP, ER, and NEP, respectively. The GEP, ER, and NEP in different ecosystems in China exhibited positive coupling correlation in their spatial patterns. Both ER and NEP were significantly correlated with GEP, with 68% of the per-unit GEP contributed to ER and 29% to NEP. MAT and MAP affected the spatial patterns of ER and NEP mainly by their direct effects on the spatial pattern of GEP. |
| [16] | . Carbon cycle; Forest ecosystem; Process-based model; Sensitivity; analysis; Uncertainty analysis; terrestrial ecosystem; climate-change; parameter sensitivity; primary; productivity; net primary; china; error; cycle; co2; prediction |
| [17] | . A land-cover (LC) change detection experiment was performed in the biologically complex landscape of the Neuse River Basin (NRB), North Carolina using Landsat 5 and 7 imagery collected in May of 1993 and 2000. Methods included pixel-wise Normalized Difference Vegetation Index (NDVI) and Multiband Image Difference (MID) techniques. The NDVI method utilized non-normalized (raw) imagery data, while the MID method required normalized imagery. Image normalization techniques included both automatic scattergram-controlled regression (ASCR) and localized relative radiometric normalization (LRRN) techniques. Change/no-change thresholds for each method were optimized using calibration curves developed from reference data and a series of method-specific binary change masks. Cover class-specific thresholds were derived for each of the four methods using a previously developed NRB-LC classification (1998-1999) to support data stratification. An independent set of accuracy assessment points was selected using a disproportionate stratified sampling strategy to support the development of error matrices. Area-weighted conditional probability accuracy statistics were calculated based on the areal extent of change and no change for each cover class. All methods tested exhibited acceptable accuracies, ranging between 80% and 91%. However, change omission errors for woody cover types were unacceptably high, with values ranging between 60% and 79%. Overall commission errors in the change category were also high (42-51%) and strongly affected by the agriculture class. There were no significant differences in the Kappa coefficient between the NDVI, MID ASCR, and LRRN normalization methods. The MID non-normalized method was inferior to both the NDVI and MID ASCR methods. Stratification by major LC type had no effect on overall accuracies, regardless of method. |
| [18] | . The P–M approach was used to generate a monthly evaporation climatology for Australia from 2001 to 2004 to demonstrate the potential of this approach for monitoring land surface evaporation and constructing monthly water budgets from 1-km to continental spatial scales. |
| [19] | . The objective of this research is to develop a global remote sensing evapotranspiration (ET) algorithm based on Cleugh et al.'s [Cleugh, H.A., R. Leuning, Q. Mu, S.W. Running (2007) Regional evaporation estimates from flux tower and MODIS satellite data. Remote Sensing of Environment 106, page 285-304- 2007 (doi: 10.1016/j.rse.2006.07.007).] Penman-Monteith based ET (RS-PM). Our algorithm considers both the surface energy partitioning process and environmental constraints on ET. We use ground-based meteorological observations and remote sensing data from the MODerate Resolution Imaging Spectroradiometer (MODIS) to estimate global ET by (1) adding vapor pressure deficit and minimum air temperature constraints on stomatal conductance; (2) using leaf area index as a scalar for estimating canopy conductance; (3) replacing the Normalized Difference Vegetation Index with the Enhanced Vegetation Index thereby also changing the equation for calculation of the vegetation cover fraction (F |
