 , 李美娇, 刘浩龙
Reconstruction of cropland area at Lu scale and its spatial-temporal characteristics in the Northern Song Dynasty
HEFanneng, LIMeijiao, LIUHaolong通讯作者:
收稿日期:2016-04-20
修回日期:2016-07-30
网络出版日期:2016-11-25
版权声明:2016《地理学报》编辑部本文是开放获取期刊文献,在以下情况下可以自由使用:学术研究、学术交流、科研教学等,但不允许用于商业目的.
基金资助:
作者简介:
-->
展开
摘要
关键词:
Abstract
Keywords:
-->0
PDF (2746KB)元数据多维度评价相关文章收藏文章
本文引用格式导出EndNoteRisBibtex收藏本文-->
1 引言
因人类土地利用活动而导致的土地覆被变化,被认为是全球环境变化的重要驱动因素,其影响不仅体现在生物地球化学过程中,同时也反映在生物地球物理过程中[1-3]。历史时期土地利用与覆被变化作为国际LUCC(land use and land cover change)科学研究计划的重要组成部分,因其在长时间尺度气候变化与生态效应模拟研究中的重要意义,而受到国际学术界的密切关注[4-6]。近十几年来,在各国****的不懈努力下,历史LUCC重建研究取得了显著进展。其中,最具代表性的成果当数美国威斯康星大学全球环境和可持续发展中心Ramankutty等[7-8]建立的“全球土地利用数据集”(SAGE,重建时段为1700-1992年)和荷兰公众健康与环境研究所Goldewijk等[9-10]建立的“全球历史环境数据集”(HYDE,最新版3.1重建时段为10000BC-AD2000),Pongratz等[11]以SAGE数据集1700年土地覆被空间格局为基础,以全球人口数据为代用资料,建立的“全球农牧空间数据集”(PJ dataset,重建时段800-1700年),这些数据集均含盖了中国区域。然而,正如SAGE数据集发布者所声明的那样:全球数据集只适用于全球尺度,不能作为区域性研究的依据[7]。中国****对这些全球数据集中有关中国区域的评估结果也表明数据存在较大的不确定性,不能客观反映中国历史耕地变化的趋势及特征[12-14]。虽然近年来中国****基于历史文献记载,对全国及区域历史时期LUCC数量重建[15-17]和网格化重建[18-22]进行了大量研究,并取得长足进展。但从已发表的研究成果看,多数集中在过去300年,而对过去千年时段的研究还较为鲜见。
北宋是中国千年时段的肇始年代,合理估算该时期的耕地数量,对重建中国过去千年LUCC数据集有着重要意义。虽然何凡能等[23]依据《文献通考》中记载的一套北宋中期路域垦田资料,通过对垦田隐匿比例的考察,订正了该时点各路域垦田数,并进行网格化空间重建,但文中对订正结果存有明显异常的路域,未给予分析和修正。同时,针对北宋时期只有全国垦田总数而无路域数据的其他时点,如何进行重建,目前也尚无****涉猎。因此,本文希冀:在深入分析北宋南北方垦田隐匿特征、北宋户均垦田数的合理范围及异常路的户均基本垦田需求等问题的基础上,重新订正北宋中期路域耕地数量;并着力探讨基于全国性垦田资料重建北宋其他时点路域耕地数量的方法,建立北宋路域耕地面积变化序列,揭示北宋时期耕地面积的时空变化特征。
2 资料来源与处理
2.1 研究区简介
北宋疆域位于中国今天津海河、河北霸州、山西雁门关一线以南,陕西横山、甘肃东部、青海湟水流域、四川岷山、大渡河一线以东,多为中国传统农业区(图1)。由于该时段(960-1127年)境内路级政区多有变化,先后有15路、17路、18路和23路等建置,为了便于比较,本文以北宋中期册载垦田资料中所涉及的1府18路作为耕地重建的基础行政单元。 显示原图|下载原图ZIP|生成PPT
图1研究区图
-->Fig. 1The study area
-->
2.2 资料来源
中国农业发展历史悠久,文献资料丰富,尤其是官方档册和地方志中,均留存有大量以耕地为代表的土地利用信息。虽然这些史料还存在着诸多问题,但它仍是深入开展宋代耕地重建研究的重要基础。本文所引用的原始资料主要有两类:垦田数据和户额数据等。2.2.1 垦田数据 北宋中期的垦田资料引自《文献通考》([南宋]马端临《文献通考》卷4《田赋四》,中华书局,1986年。) ,该数据是现存唯一一套完整的北宋路域垦田资料。此外,《文献通考》中还记载了太祖开宝九年(976 年)、太宗至道三年(997 年)、真宗天禧五年(1021 年)、仁宗皇祐三年(1051 年)、英宗治平三年(1066 年) 和神宗元丰六年(1083 年) 等6 个时点全国性垦田总数(表1)。《新安志》中记载了南宋淳熙年间(1174-1189 年) 隶属于江南东路的徽州歙县、休宁县、祁门县、婺源县、绩溪县和黟县等州县“经界”前后的垦田数据([南宋] 罗愿:《新安志》卷2 《叙贡赋》,宋元方志从刊本,中华书局,1990 年。
Tab. 1
表1
表1北宋著籍户口及垦田数
Tab. 1"Cropland Taxes" and "the Number of Households" data in the Northern Song Dynasty recorded in historical documents
| 年代 | 户数(104户) | 垦田数(106亩) |
|---|---|---|
| 太祖开宝九年(976年) | 309.1 | 295.33 |
| 太宗至道三年(997年) | 413.3 | 312.53 |
| 真宗天禧五年(1021年) | 867.8 | 524.76 |
| 仁宗皇祐三年(1051年) | — | 228.00 |
| 英宗治平三年(1066年) | 1291.7 | 440.00 |
| 神宗元丰六年(1083年) | 1721.2 | 461.66 |
新窗口打开
2.2.2 户额数据 主要引自《文献通考》中记载的5个时点的全国性户额总数(表1),以及《中国人口史·辽宋金元时期》一书[24]。该研究成果是吴松弟等在客观把握基本史实的基础上,依据《太平寰宇记》、《元丰九域志》等宋代户籍史料订正而成(空间分辨率为路级行政区),具有较高的可信度。
2.3 数据处理
2.3.1 垦田数据选择 册载田亩数字是一种“税亩”,并非实际的耕地面积,这已是学界的共识。但是,研究也表明:其增减趋势具有相对合理性,可在一定程度上反映实际耕地面积变化的总体趋势[25]。从表1中可以看出,北宋时期册载垦田数总体呈持续增加态势,这与北宋时期人口不断增长、土地垦殖指数不断提高的史实基本吻合[26-27]。但是,表中也显示了天禧五年(1021年)与皇祐三年(1051年)册载垦田数明显不符合这一变化趋势的情况,有****就此明确指出:增减幅度超乎寻常,且与总体变化趋势相悖,其合理性值得怀疑[26]。基于此,本文在进行路域耕地面积重建时,选取开宝九年(976年)、至道三年(997年)、治平三年(1066年)和元丰六年(1083年)(关于该组“垦田资料”的年代,何凡能等根据路级政区建置沿革的考察,认为应为熙宁年间至元丰初年(1068-1078年)的数据,文中以元丰元年(1078年)为断。)4个时点,而对天禧五年(1021年) 与皇祐三年(1051年) 的垦田数暂不给予订正。2.3.2 户额数据插补 不同时点的路级户额数是本文所依据的另一类重要数据。然而,从已有研究成果看,空间分辨率可达路级政区的户额订正数据只有太平兴国年间(980-989年)、元丰元年(1078年)和崇宁元年(1102年)3个时点[24],未能与有册载垦田数的年份匹配。为了获得所需年份的路域户额数据,文中做如下插补处理:治平三年(1066年)与元丰元年(1078年)分别以《文献通考》记载和吴松弟等订正的全国户额数据为准;开宝九年(976年)与至道三年(997年)则基于《文献通考》所载户额数及吴松弟等订正的太平兴国年间的户额数据,采用线性插值与相互校正的方法得到。
3 重建方法
3.1 总体方案
基于可能获得的史料特点,本文拟重建北宋多时点路域耕地面积的总体方案是(图2):① 北宋中期:首先,基于北宋推行“方田均税法”时清丈所得的北方部分路域垦田数,与南宋推行“经界法”时所得的部分州县垦田数,确定南北方册载垦田数据的隐匿比例,对该时点册载垦田数据进行初步订正;其次,依据户均垦田数,对订正结果进行合理性评估;最后,对部分户均垦田数明显存疑的路,利用户数与户均基本垦田需求数进行再订正。② 其他时点:以北宋中期订正结果为基础,对其他时点全国垦田总数进行订正;通过分析耕地分布与海拔、坡度和人口等自然与人文因素的关系,建立路域耕地面积分配模型,将订正后的全国耕地面积分配到路级政区。最后,以重建结果为基础,结合北宋人口与土地垦殖政策,阐明北宋耕地面积的时空变化特征。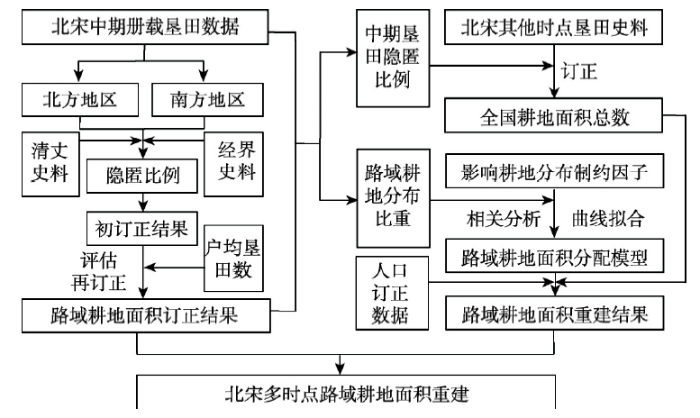 显示原图|下载原图ZIP|生成PPT
图2北宋路域耕地面积重建总体方案
-->Fig. 2Scheme for reconstruction of cropland area at Lu scale in the Northern Song Dynasty
-->
3.2 北宋中期路域垦田数订正与评估方法
3.2.1 册载垦田数据订正方法 北宋因推行“不立田制,不抑兼并”的土地制度,“隐田漏税”现象非常严重。因此,****主要是通过确定垦田隐匿比例,对册载垦田数据进行订正。其中,北方地区以熙宁五年(1072年)王安石推行“方田均税法”后清丈所得北方五路,包括开封府、京东路、河北路、河东路和陕西路的垦田数与册载垦田数据为基础,确定垦田隐匿比例,系数约为2.03[23]。南方地区则以南宋时期推行“经界法”后,部分州县经界前后的册载垦田数据为基础,确定垦田隐匿比例,系数约为1.93(表2)。从确定的比值看,南北方地区垦田隐匿比例虽有差异,但相差不是很大。Tab. 2
表2
表2南宋徽州各县经界前后的垦田数据
Tab. 2"Cropland Taxes" and boundary survey data in Huizhou in the Southern Song Dynasty recorded in historical documents
| 州县 | 经界前(亩) | 经界后(亩) | 经界后/经界前 |
|---|---|---|---|
| 歙县 | 252984 | 458156 | 1.81 |
| 休宁县 | 186950 | 303964 | 1.63 |
| 祁门县 | 199563 | 717636 | 3.60 |
| 婺源县 | 679707 | 795787 | 1.17 |
| 绩溪县 | 104538 | 309566 | 2.96 |
| 黟县 | 92135 | 334430 | 3.63 |
| 合计 | 1515877 | 2919539 | 1.93 |
新窗口打开
Tab. 3
表3
表3西南五路垦田数再估算结果
Tab. 3Re-estimation results of cropland area in Southwest hina in the mid-Northern Song Dynasty
 |
新窗口打开
3.2.2 结果合理性评估方法 为了检验所订正各路垦田数的合理性,本文采用户均垦田数作为评估指标。通过对历史文献中有关宋代部分地区“一夫”所耕之田的零星记载的梳理(北宋科学家沈括在《梦溪笔谈》“记生计”条下载:北方陆田,粗放的一夫可耕“百亩、五十亩”,集约的“三十亩”;北宋彭州知州吕陶在《净徳集》“岁计”条下载:熙宁年间(1068-1077年)北方陆田“一夫有田二十亩”;北宋水利学家郏亶在论及北宋中期苏州垦田时称“国朝之法:一夫之田为四十亩”;南宋词人陈亮在《龙川集》中载:南方水田“一夫耕三、四十亩”;南宋时任严州知府的方回据其在嘉兴时的见闻,称当地佃户“一夫之田”约为30亩。),按户均1~2夫计[24],大致确定了北宋户均垦田数的合理变动范围,应介于20~100亩之间。文中以此为依据,利用户数与垦田订正数计算了各路户均垦田数(图3),认为:梓州、利州、夔州、广南东和广南西等5路户均垦田数不尽合理,有过于偏低嫌疑,需另行校正。
 显示原图|下载原图ZIP|生成PPT
图3初步订正后的北宋中期各路户均垦田数
-->Fig. 3Preliminary revised results of cropland area per household in each Lu in the mid-Northern Song Dynasty
-->
3.2.3 再估算方法 采用以满足人口基本生活需求为基准,确定各路户均基本垦田需求数的方法,对异常路域垦田数予以再估算。从上述户均垦田数明显偏低各路的地理分布看,主要位于西南地区,因此,文中通过对有宋代西南地区粮食亩产量[28]( 据佚名《两朝纲目备要》卷13载:梓州路梓州在南宋嘉定年间的粮食亩产量约为2~2.5石;《宋会要辑稿·食货》63之111、2之20;李心传《建炎以来系年要录》卷111、李心传《建炎以来朝野杂记》甲集卷16等载:利州路的汉中、洋州一带在绍兴年间的粮食亩产量约为2~3石;梓州路、利州路山区及夔州路与荆湖南路西部、西南部山区同为“刀耕火种之地”;据陈傅良《止斋先生文集》卷44《桂阳军劝农文》载:“湖南路桂阳军一亩米一石”。可见,西南地区农业发展相对较好的地区粮食平均亩产量约为1.5石,较差的地区为1石。) 人均年粮食需求量[29] (据程民生在《宋代生活水平及币值考》中通过对宋代史料的综合分析称:人均日粮食消耗量的底线应为二升,小孩减半。)、种植制度[30] (据曾雄生等在《宋代岭南地区的生态环境与稻作农业》中研究称:宋代岭南地区的稻田最普遍的仍为一年一熟制。)和户均口数[24] (据吴松弟等在《中国人口史·辽宋金元时期》中研究称:南方地区户均人口数为5.2口。)的分析,认为梓州路、利州路和广南东路的户均基本垦田需求数约为20 亩,夔州路和广南西路为30 亩。以此为依据,对梓州路、利州路、夔州路、广南东路和广南西路的垦田数再行估算(表3)。
3.3 其他时点耕地面积重建方法
3.3.1 全国垦田总量订正方法 虽然北宋前期政府为了方田均税,也推行了一系列检田、方田活动,但均实施时间较短,涉及范围有限,未留下可资利用的检田、方田的结果[26]。因此,文中以订正后的北宋中期垦田数据作为估算基数,确定北宋中期册载垦田数据总的隐匿比例,以此比值对其他时点全国性的册载垦田数进行订正。3.3.2 路域耕地面积分配方法 为了更好地反映北宋路域耕地面积及垦殖强度的时空变化特征,本文试图通过遴选和量化影响耕地分布的因子,探索建立基于全国耕地总面积分配路域耕地面积的模型,其具体方法如下:
(1)因子遴选和量化 影响耕地分布的因素主要有地形、热量、水分、土壤、植被等自然因素和人口、政策、经济发展水平、战争等人文因素,但在不同地区或同一地区的不同空间尺度上,其主要影响因素不尽相同。北宋疆域多处于中国传统农垦区,耕地分布可能会受到地形条件的影响,水热、植被、土壤等自然因素并不成为耕地分布的制约条件[18]。从人文因素来看,在传统农业社会里,人口数量变化而引起的对粮食需求状况的改变,会直接影响区域耕地需求量的变化,因此人口是影响区域耕地分布的重要因素;而政策和战乱等因素则多是通过影响区域人口状况,间接影响区域耕地分布。那么,在路域尺度上,究竟是地形(包括海拔与坡度)因素还是人口因素起主导作用?
为了辨识影响耕地分布的主导因子,本文以全国1 km DEM数据(数据来源:全球1 km DEM,由国家科学数据共享工程—地球系统科学数据共享网提供(http://www.geodata.cn)。)为基础资料,在GIS软件中运用空间分析模块进行重采样,得到北宋路域的平均海拔D(i)和平均坡度S(i)数据;利用北宋中期路域耕地面积和人口数据,求得各路耕地比重C(i)和人口比重P(i)数据;将各路平均海拔D(i)、平均坡度S(i)和人口比重P(i)分别与耕地比重C(i)进行相关分析。结果显示,地形因子与耕地比重C(i)相关性并不显著(相关系数分别为-0.183和-0.287);而人口比重P(i)与耕地比重C(i)呈显著的正相关(相关系数为0.823)。可见在路域尺度上,人口是影响耕地分布的主导因素。
通过拟合耕地比重与人口比重间的关系,可以很好地量化揭示人口对耕地分布的影响。曲线拟合结果显示,北宋中期人口分布和耕地分布呈明显指数变化趋势(R2 = 0.682)(图4),其拟合函数为:
式中:C(i, tν)为i路在tν年的耕地比重;P(i, tν)为i路在tν年的人口比重。
 显示原图|下载原图ZIP|生成PPT
图4北宋中期各路耕地比重与人口比重的曲线拟合结果
-->Fig. 4The curve fitting results of cropland proportion and population proportion in each Lu in the mid-Northern Song Dynasty
-->
(2)修正系数确定 在各路人均耕地面积相近的情况下,直接通过路域人口比重指示耕地比重是可行的。但从北宋中期耕地订正结果看,各路人均耕地面积有较大差别,直接利用路域人口比重指示耕地比重具有一定的局限性。因此,为了消除人均耕地面积差异对分配结果的影响,本文利用北宋中期人均耕地面积指数α(i)为系数,对拟合函数进行修正。其计算公式:
式中:a(i)为i路人均耕地面积指数;CP(i)、MAX(CP(i))分别为北宋中期i路人均耕地面积、人均耕地面积最大值。
(3)倾向模型与分配模型的构建 为了能更加合理地将不同时点全国耕地面积总数分配到各个路域,本文构建了路域耕地分布倾向模型,其计算公式为:
式中:δ(i, tν)为tν年i路耕地分布倾向;α(i)为人均耕地面积指数;P(i, tν)为tν年i路的人口比重。模型表征了人口比重大,且人均耕地资源占有量大的路级政区,将拥有更大的耕地分布倾向。基于此,本文建立了利用全国耕地总数进行路域耕地面积重建的分配模型:
式中:δ(i, tν)为i路在tν年的耕地分布倾向;X(i, tν)为i路在tν年的耕地面积;A(tν)为tν年的耕地总面积。
应该指出的是,北宋中前期是境内农业垦殖恢复和发展的时期,北宋中期各路的耕地面积应是重建时段的最高值[26]。因此,在耕地分配过程中,若某路耕地分配数超过北宋中期的耕地数,则将超出的部分按照公式(3)~(4)继续分配到其他各路。
(4)不确定性分析 为了分析重建结果可能存在的不确定性,笔者利用本文建立的模型,对北宋中期耕地面积进行了路域分配,并将分配结果与路域耕地面积订正结果进行对比分析,结果显示:虽然各路域间相对误差绝对值存有一定差异,这主要与各路域人均耕地占有量不同有关。但从总体来看,19路(府)的相对误差绝对值均小于30%(图5)。其中,小于10%的路有13个,介于10%~20%的路有3个,20%~30%的路有3个。可见,相对误差绝对值介于0~20%之间的路占到总路数的84.2%,说明分配结果能够基本反映北宋时期路域耕地面积的分布情况。
 显示原图|下载原图ZIP|生成PPT
图5北宋中期路域耕地重建结果相对误差绝对值
-->Fig. 5The absolute relative error of cropland reconstruction results in the mid-Northern Song Dynasty
-->
4 结果与分析
4.1 北宋路域耕地面积重建结果
利用上述引用的数据和建立的路域耕地面积重建方法,本文订正或重建了开宝九年(976年)、至道三年(997年)、治平三年(1066年)和元丰元年(1078年)4个时点的全国及路域耕地面积数据,并结合各路的政区面积,得到各路的土地垦殖率(图6)。其中,宋境土地面积及各路的政区面积是根据谭其骧《中国历史地图集》[31]中的北宋政区图,进行数字化求得。 显示原图|下载原图ZIP|生成PPT
图6北宋路域垦殖率重建结果
-->Fig. 6Reconstruction results of reclamation rate at Lu scale in the Northern Song Dynasty
-->
结果显示(表4):开宝九年(976年)、至道三年(997年)、治平三年(1066年)和元丰元年(1078年)的耕地总量分别为468.27×10⁶今亩、495.53×10⁶今亩、697.65×10⁶今亩和731.94×10⁶今亩;垦殖率分别为10.8%、11.4%、16.1%和16.9%;人口总量分别为2982.7×104人,3988.5×104人、6791.9×104人和8730.4×104人;人均耕地面积分别为15.7今亩、12.4今亩、10.3今亩和8.4今亩。
Tab. 4
表4
表4北宋耕地面积与人口数量重建结果
Tab. 4Reconstruction results of cropland area and population for the Northern Song Dynasty
| 年份 | 垦田数(106今亩) | 垦殖率(%) | 人口总量(104人) | 人均耕地面积(今亩) | |
|---|---|---|---|---|---|
| 开宝九年(976年) | 468.27 | 10.8 | 2982.7 | 15.7 | |
| 至道三年(997年) | 495.53 | 11.4 | 3988.5 | 12.4 | |
| 治平三年(1066年) | 697.65 | 16.1 | 6791.9 | 10.3 | |
| 元丰元年(1078年) | 731.94 | 16.9 | 8730.4 | 8.4 | |
新窗口打开
4.2 耕地时空变化特征分析
4.2.1 总体趋势 从耕地总量重建结果来看,北宋统一之后,开宝九年(976年)至元丰元年(1078年),北宋境内的人口数量由2982.7×104人增加至8730.4×104人,年均增长率约为1.1%。在日益增长的人口需求的推动下,耕地面积呈现持续增加的变化趋势,耕地面积从468.27×10⁶今亩增至731.94×10⁶今亩,100年间增加了263.67×10⁶今亩;土地垦殖率由10.8%增至16.9%,增加约6个百分点;而人均耕地面积由15.7今亩降至8.4今亩。4.2.2 空间格局变化特征 根据路域耕地面积的分配结果,绘制得到开宝九年(976年)至元丰元年(1078年)的垦殖率变化图(图7)。为了便于分析,本文依据垦殖率变化特点,将研究区分为北方地区、东南地区和西南地区,从区域及路域的尺度上,对北宋土地垦殖率的空间变化特征进行分析。
 显示原图|下载原图ZIP|生成PPT
图7976-1078年北宋路域垦殖率变化图
-->Fig. 7Changes of reclamation rate in each Lu of the Northern Song Dynasty during AD 976-1078
-->
从图6、图7中可以看出,北方地区作为中国传统的农耕区,历来土地垦殖发展程度较高。入宋之后,随着人口的增长和政府促垦政策的推行,土地垦殖仍处于不断发展状态,开宝九年(976年)至元丰元年(1078年)间区域土地垦殖率从12.7%增至17.9%(表5)。到北宋中期,各路垦殖率均在10%以上,其中,黄淮海平原土地垦殖率最高,已达到20%以上。
Tab. 5
表5
表5976-1078年北宋各区域垦殖率变化(%)
Tab. 5Changes of reclamation rate in each region of the Northern Song Dynasty during AD 976-1078 (%)
| 年份 | 北方地区 | 东南地区 | 西南地区 |
|---|---|---|---|
| 开宝九年(976年) | 12.7 | 16.3 | 3.8 |
| 元丰元年(1078年) | 17.9 | 28.3 | 5.0 |
| 变化幅度 | 5.2 | 12.0 | 1.2 |
新窗口打开
东南地区是开宝九年(976年)至元丰元年(1078年)间北宋土地垦殖发展最快的地区(图7),随着唐末宋初北方人口的不断迁入,区域土地垦殖率从16.3%增至28.3%,增长约12个百分点。其中,江南东路、两浙路和荆湖南路垦殖率增加最明显,分别达到33.3%、16.1%和22.9%;福建路垦殖率增加量最小,约为2.8%,这应该与路内人多地少的境况有关。到北宋中期,长江中下游平原的局部地区垦殖率已经超过了40%。
西南地区是北宋土地垦殖发展最落后的地区,除位于成都平原的成都府路外,其余各路自然地理条件相对较差,北宋时期人口迁入量有限,且开发难度大,因此土地垦殖发展相对较缓慢(图7)。开宝九年(976年)至元丰元年(1078年)间区域垦殖率由3.8%增至5.0%。其中,广南东路和利州路的垦殖率增加量较高,分别为3.3%和2.8%;成都府路次之,约为1.5%;其余三路的增加量均不到1%。到北宋中期,成都府路垦殖率达到32.2%,其他各路垦殖率均低于6%,其中,夔州路和广南西路垦殖率最低,仅在2%左右。
4.3 重建结果对比
由于本文与HYDE3.1和PJ全球数据集中耕地重建时点不同,笔者选择时点较为接近的北宋中期(1078年)与两个全球数据集中1100年的耕地重建结果进行对比,结果显示:本文重建的北宋中期耕地总量为731.94×10⁶今亩,土地垦殖率为17%,而HYDE 3.1和PJ的耕地总量分别为565.50×10⁶今亩和492.60×10⁶今亩,垦殖率相应为13%和11%,存有较大差别。从路域尺度来看(图8),HYDE数据集对北宋东南各路及成都府路的耕地重建结果明显偏低,其中江南西路、江南东路和成都府路差异较大,分别低了76.2%、77.2%和79.1%;而对北方地区和西南各路的重建结果相对偏高,其中京东路、梓州路和广南西路分别高了75.7%、218.9%和410.5%。 显示原图|下载原图ZIP|生成PPT
图8北宋中期路域耕地重建结果对比图
-->Fig. 8Comparisons of reconstructed cropland area in the mid-Northern Song Dynasty at Lu scale
-->
5 结论
(1)基于史料及耕地分布影响因子的分析,本文建立了北宋中期册载垦田数据的订正方法和路域耕地分布倾向模型和分配模型。误差分析表明:相对误差绝对值介于0~20%之间的路占到总路数的84.2%,说明分配结果能够基本反映北宋时期路域耕地面积的分布情况。(2)重建了4个时点的耕地面积,结果表明:研究时段北宋耕地面积总量呈持续增加的趋势。开宝九年(976年)、至道三年(997年)、治平三年(1066年)和元丰元年(1078年)的耕地总量分别为468.27×10⁶今亩、495.53×10⁶今亩、697.65×10⁶今亩和731.94×10⁶今亩;垦殖率分别为10.8%、11.4%、16.1%和16.9%;人口总量分别为2982.7×104人,3988.5×104人、6791.9×104人和8730.4×104人。
(3)从耕地总体变化趋势来看,开宝九年(976年)至元丰元年(1078年),北宋境内的耕地面积从468.27×10⁶今亩增加至731.94×10⁶今亩,100年间耕地面积增加约2.64亿今亩;垦殖率从开宝九年(976年)的10.8%,增加至元丰元年(1078年)的16.9%,提高了约6个百分点;而人均耕地面积由15.7今亩降至8.4今亩。
(4)空间格局变化特征:开宝九年(976年)至元丰元年(1078年),东南地区是北宋土地垦殖发展最快的地区,区域土地垦殖率增加12.0%,北宋中期长江中下游平原局部地区垦殖率高达40%;北方地区土地垦殖率增加5.2%,北宋中期黄淮海平原土地垦殖率也超过了20%;西南地区是北宋土地垦殖发展最落后的地区,区域垦殖率仅增加1.2%,除位于成都平原的成都府路外,各路垦殖率均低于6%,其中,夔州路和广南西路仅在2%左右。
The authors have declared that no competing interests exist.
参考文献 原文顺序
文献年度倒序
文中引用次数倒序
被引期刊影响因子
| [1] | . Agriculture has significantly transformed the face of the planet. In particular, croplands have replaced natural vegetation over large areas of the global land surface, covering around 18million km 2 of the land surface today. To grow crops, humans have taken advantage of the resource provided by climate optimum temperature and precipitation. However, the clearing of land for establishing croplands might have resulted in an inadvertent change in the climate. This feedback might, in turn, have altered the suitability of land for growing crops. In this sensitivity study, we used a combination of land cover data sets, numerical models, and cropland suitability analysis, to estimate the degree to which the replacement of natural vegetation by croplands might have altered the land suitability for cultivation. We found that the global changes in cropland suitability are likely to have been fairly small, however large regional changes in cropland suitability might have occurred. Our theoretical study showed that major changes in suitability occurred in Canada, Eastern Europe, the Former Soviet Union, northern India, and China. Although the magnitude, sign, and spatial patterns of change indicated by this study may be an artifact of our particular model and experimental design, our study is illustrative of the potential inadvertent consequences of human activities on the land. Moreover, it offers a methodology for evaluating how climate changes due to human activities on the land may alter the multiple services offered by ecosystems to human beings. |
| [2] | . Terrestrial ecosystems in the southern United States (SUS) have experienced a complex set of changes in climate, atmospheric CO2 concentration, tropospheric ozone (O-3), nitrogen (N) deposition, and land-use and land-cover change (LULCC) during the past century. Although each of these factors has received attention for its alterations on ecosystem carbon (C) dynamics, their combined effects and relative contributions are still not well understood. By using the Dynamic Land Ecosystem Model (DLEM) in combination with spatially explicit, longterm historical data series on multiple environmental factors, we examined the century-scale responses of ecosystem C storage and flux to multiple environmental changes in the SUS. The results indicated that multiple environmental changes shifted SUS ecosystems from a C source of 1.20 +/- A 0.56 Pg (1 Pg = 10(15) g) during the period 1895 to 1950, to a C sink of 2.00 +/- A 0.94 Pg during the period 1951 to 2007. Over the entire period spanning 1895-2007, SUS ecosystems were a net C sink of 0.80 +/- A 0.38 Pg. The C sink was primarily due to an increase in the vegetation C pool, whereas the soil C pool decreased during the study period. The spatiotemporal changes of C storage were caused by changes in multiple environmental factors. Among the five factors examined (climate, LULCC, N deposition, atmospheric CO2, and tropospheric O-3), elevated atmospheric CO2 concentration was the largest contributor to C sequestration, followed by N deposition. LULCC, climate, and tropospheric O-3 concentration contributed to C losses during the study period. The SUS ecosystem C sink was largely the result of interactive effects among multiple environmental factors, particularly atmospheric N input and atmospheric CO2.. |
| [3] | . Tropical Asia has experienced dramatic cropland expansion and agricultural intensification to meet the increasing food demand and is likely to undergo further rapid development in the near future. Much concern has been raised about how cropland expansion and associated management practices (nitrogen fertilizer use, irrigation, etc.) have affected the terrestrial carbon cycle in this region. In this study, we used a process-based ecosystem model, the Dynamic Land Ecosystem Model (DLEM), to assess the magnitude, spatial and temporal patterns of terrestrial carbon fluxes and pools in Tropical Asia as resulted from cropland expansion and land management practices during 1901-2005. The results indicated that cropland expansion had resulted in a release of 19.12 +/- 3.06 Pg C (0.18 +/- 0.029 Pg C/yr) into the atmosphere in Tropical Asia over the study period. Of this amount, approximately 22% (4.18 +/- 0.66 Pg C) was released from South Asia and 78% (14.94 +/- 2.40 Pg C) from Southeast Asia. Larger land area was converted to cropland while less carbon was emitted from South Asia than from Southeast Asia, where forest biomass and soil carbon were significantly higher. Changes in vegetation, soil organic matter, and litter pools caused emissions of 15.58, 2.25, and 1.71 Pg C, respectively, from the entire region. Significant decreases in vegetation carbon occurred across most regions of Southeast Asia due to continuous cropland expansion and shrink of natural forests. When considering land management practices, however, less carbon was released into the atmosphere, especially in South Asia where land management practices contributed to an approximately 10% reduction in carbon emission. This implies that optimizing land management practices could greatly reduce the carbon emissions caused by cropland expansion and might be one of important climate mitigation options in Tropical Asia. (C) 2012 Elsevier B.V. All rights reserved. |
| [4] | . 利用国家气候中心改进的高分辨率区域气候模式(RegCM-NCC)模拟研究了中国近代历史时期土地利用/覆盖变化对中国区域气候的影响,模拟结果显示,1700年以来,以森林砍伐、草地退化及相应耕地面积扩大为主的土地利用变化可能对中国区域降水、温度产生了显著影响.1700-1900年期间,由于土地利用的变化使华北、西南等地区降水呈减少趋势,其他区域变化不明显,但近50年来却使长江中下游地区、西北、东北部分地区降水有所增加.1700-1800年间的土地利用变化使得除东北及长江流域地区外的大部分地区温度呈下降趋势,1900年以后有所升高,特别是近50年来中国大部分区域平均气温升高,与这一时期由于大气中温室气体排放浓度增加造成的温度升高相一致.另外,土地利用变化不仅使大气温度、湿度发生变化,还可引起基本流场的变化,使东亚冬、夏季风气流有所增强,这主要是由于植被变化改变了地面温度,使海、陆温差进一步增大的结果.因此,土地利用变化对区域尺度气候变化的影响是不容忽视的. . 利用国家气候中心改进的高分辨率区域气候模式(RegCM-NCC)模拟研究了中国近代历史时期土地利用/覆盖变化对中国区域气候的影响,模拟结果显示,1700年以来,以森林砍伐、草地退化及相应耕地面积扩大为主的土地利用变化可能对中国区域降水、温度产生了显著影响.1700-1900年期间,由于土地利用的变化使华北、西南等地区降水呈减少趋势,其他区域变化不明显,但近50年来却使长江中下游地区、西北、东北部分地区降水有所增加.1700-1800年间的土地利用变化使得除东北及长江流域地区外的大部分地区温度呈下降趋势,1900年以后有所升高,特别是近50年来中国大部分区域平均气温升高,与这一时期由于大气中温室气体排放浓度增加造成的温度升高相一致.另外,土地利用变化不仅使大气温度、湿度发生变化,还可引起基本流场的变化,使东亚冬、夏季风气流有所增强,这主要是由于植被变化改变了地面温度,使海、陆温差进一步增大的结果.因此,土地利用变化对区域尺度气候变化的影响是不容忽视的. |
| [5] | . In India, human population has increased six-fold from 200 million to 1200 million that coupled with economic growth has resulted in significant land use and land cover (LULC) changes during 1880-2010. However, large discrepancies in the existing LULC datasets have hindered our efforts to better understand interactions among human activities, climate systems, and ecosystem in India. In this study, we incorporated high-resolution remote sensing datasets from Resourcesat-1 and historical archives at district (N = 590) and state (N = 30) levels to generate LULC datasets at 5 arc minute resolution during 1880-2010 in India. Results have shown that a significant loss of forests (from 89 million ha to 63 million ha) has occurred during the study period. Interestingly, the deforestation rate was relatively greater under the British rule (1880-1950s) and early decades after independence, and then decreased after the 1980s due to government policies to protect the forests. In contrast to forests, cropland area has increased from 92 million ha to 140.1 million ha during 1880-2010. Greater cropland expansion has occurred during the 1950-1980s that coincided with the period of farm mechanization, electrification, and introduction of high yielding crop varieties as a result of government policies to achieve self-sufficiency in food production. The rate of urbanization was slower during 1880-1940 but significantly increased after the 1950s probably due to rapid increase in population and economic growth in India. Our study provides the most reliable estimations of historical LULC at regional scale in India. This is the first attempt to incorporate newly developed high-resolution remote sensing datasets and inventory archives to reconstruct the time series of LULC records for such a long period in India. The spatial and temporal information on LULC derived from this study could be used by ecosystem, hydrological, and climate modeling as well as by policy makers for assessing the impacts of LULC on regional climate, water resources, and biogeochemical cycles in terrestrial ecosystems. (C) 2014 The Authors. Published by Elsevier B.V. |
| [6] | . Long-term records of environmental history at decadal to millennial time-scales enable an assessment of ecosystem variability and responses to past anthropogenic disturbances and are fundamental for the development of environmental management strategies. This study examines the local variability of land-use history in the South Swedish Uplands over the last 20002years based on pollen records from three lake-sediment successions. Temporal changes in the proportional cover of 14 plant taxa were quantified as percentages using the landscape reconstruction algorithm (LRA). The LRA-based estimates of the extent of four land-use categories (cropland, meadows/grassland, wetland, outland/woodland) were compared to corresponding estimates based on historical maps and aerial photographs from ad 1769–1823, 1837–1895, 1946 and 2005. Although the LRA approach tends to overestimate grassland cover by 10–3002% for the two earliest time periods, the reconstructed vegetation composition is generally in good agreement with estimates based on the historical records. Subsequently, the LRA approach was used to reconstruct the 200-year history of local land-use dynamics at 20-year intervals around two small lakes. The qualitative assessment of difference approach, which requires fewer assumptions and parameters than LRA for objective evaluation of between-site differences in plant abundances, provides consistent results in general. Significant differences exist in the land-use history between the sites. Local catchment characteristics, such as soil conditions and wetland cover, appear important for the development of human impact on the landscape. Quantifications of past vegetation dynamics provide information on the amplitude, frequency and duration of the land-use changes and their effects on terrestrial and aquatic ecosystems, and should be taken into account when nature conservation strategies are developed. |
| [7] | . Baethge C, Marx C. |
| [8] | . |
| [9] | . Testing against historical data is an important step for validating integrated models of global environmental change. Owing to long time lags in the climate system, these models should aim the simulation of the land use dynamics for long periods, i.e., spanning decades up to a century. Developing such models requires understanding of past and current trends and is therefore strongly data dependent. For this purpose, a history database of the global environment has been developed: HYDE. This paper describes and analyzes parts of HYDE version 2.0, presenting historical population and land use patterns for the past 300 years. Results suggest, among other things, a global increase of cropland area from 265 million ha in 1700 to 1471 million ha in 1990, while the area of pasture has increased more than six fold from 524 to 3451 million ha. In general, the increase of man-made agricultural land took place at the expense of natural grasslands and to a lesser extent of forests. There are differences between the several regions in the temporal pace of these land use conversions. The temperate/developed regions of Canada, United States, USSR, and Oceania appear to have had their strongest increase during the 19th century, while most of the tropical/developing regions witnessed the largest land use conversions at the end of the last century. Results of this analysis can be used to test integrated models of global change and are available at http://www.rivm.nl/env/int/hyde/. |
| [10] | . ABSTRACT Aim68 This paper presents a tool for long-term global change studies; it is an update of the History Database of the Global Environment (HYDE) with estimates of some of the underlying demographic and agricultural driving factors. Methods68 Historical population, cropland and pasture statistics are combined with satellite information and specific allocation algorithms (which change over time) to create spatially explicit maps, which are fully consistent on a 5′ longitude/latitude grid resolution, and cover the period 10,000bctoad2000. Results68 Cropland occupied roughly less than 1% of the global ice-free land area for a long time untilad1000, similar to the area used for pasture. In the centuries that followed, the share of global cropland increased to 2% inad1700 (. 3 million km) and 11% inad2000 (15 million km), while the share of pasture area grew from 2% inad1700 to 24% inad2000 (34 million km) These profound land-use changes have had, and will continue to have, quite considerable consequences for global biogeochemical cycles, and subsequently global climate change. Main conclusions68 Some researchers suggest that humans have shifted from living in the Holocene (emergence of agriculture) into the Anthropocene (humans capable of changing the Earth's atmosphere) since the start of the Industrial Revolution. But in the light of the sheer size and magnitude of some historical land-use changes (e.g. as result of the depopulation of Europe due to the Black Death in the 14th century and the aftermath of the colonization of the Americas in the 16th century) we believe that this point might have occurred earlier in time. While there are still many uncertainties and gaps in our knowledge about the importance of land use (change) in the global biogeochemical cycle, we hope that this database can help global (climate) change modellers to close parts of this gap. |
| [11] | . Humans have substantially modified the Earth's land cover, especially by transforming natural ecosystems to agricultural areas. In preindustrial times, the expansion of agriculture was probably the dominant process by which humankind altered the Earth system, but little is known about its extent, timing, and spatial pattern. This study presents an approach to reconstruct spatially explicit changes in global agricultural areas (cropland and pasture) and the resulting changes in land cover over the last millennium. The reconstruction is based on published maps of agricultural areas for the last three centuries. For earlier times, a country-based method is developed that uses population data as a proxy for agricultural activity. With this approach, the extent of cropland and pasture is consistently estimated since AD 800. The resulting reconstruction of agricultural areas is combined with a map of potential vegetation to estimate the resulting historical changes in land cover. Uncertainties associated with this approach, in particular owing to technological progress in agriculture and uncertainties in population estimates, are quantified. About 5 million kmof natural vegetation are found to be transformed to agriculture between AD 800 and 1700, slightly more to cropland (mainly at the expense of forested area) than to pasture (mainly at the expense of natural grasslands). Historical events such as the Black Death in Europe led to considerable dynamics in land cover change on a regional scale. The reconstruction can be used with global climate and ecosystem models to assess the impact of human activities on the Earth system in preindustrial times. |
| [12] | . 历史土地利用数据集是解释过去人类活动及其影响、定量评估土地利用变化对气候变化和碳循环影响、检验模型模拟结果的基础.SAGE("全球土地利用数据集")和HYDE("全球历史环境数据集")是国际上已被广泛应用的代表性的全球土地利用数据集,但其数据的准确性并未得到充分地评估.CNEC数据(Cropland data of Northeast China)重建的是东北三省过去300年耕地覆盖变化数据,该数据所利用的数据源为历史文献和调查、统计资料,并经过订正和归一化处理,能够较好地反映耕地变化的实际情况.以CNEC数据为参照,分别从东北地区、分省和网格3个空间尺度对SAGE和HYDE数据集中东北地区的耕地数据精度进行了评估.结果表明,SAGE和HYDE数据集中东北地区的耕地重建结果无论总量还是空间分布都存在显著的误差,其反映的耕地面积增长与空间变化过程也与研究区历史开垦过程相左.其中,SAGE数据集对东北历史耕地数据的估计普遍偏高,并且没有反映出东北地区耕地面积阶段性增长的特点;HYDE数据集的耕地总量虽然具有一定可比性,但是年代际变化和各时间断面空间分布与历史真实情形不符.全球数据集在东北地区的重建误差可能来源于两方面:一是依据现代耕地分布格局回推历史耕地分布的方法不能反映现实开垦进程,二是遥感资料提取的现代耕地数据存在误差。 . 历史土地利用数据集是解释过去人类活动及其影响、定量评估土地利用变化对气候变化和碳循环影响、检验模型模拟结果的基础.SAGE("全球土地利用数据集")和HYDE("全球历史环境数据集")是国际上已被广泛应用的代表性的全球土地利用数据集,但其数据的准确性并未得到充分地评估.CNEC数据(Cropland data of Northeast China)重建的是东北三省过去300年耕地覆盖变化数据,该数据所利用的数据源为历史文献和调查、统计资料,并经过订正和归一化处理,能够较好地反映耕地变化的实际情况.以CNEC数据为参照,分别从东北地区、分省和网格3个空间尺度对SAGE和HYDE数据集中东北地区的耕地数据精度进行了评估.结果表明,SAGE和HYDE数据集中东北地区的耕地重建结果无论总量还是空间分布都存在显著的误差,其反映的耕地面积增长与空间变化过程也与研究区历史开垦过程相左.其中,SAGE数据集对东北历史耕地数据的估计普遍偏高,并且没有反映出东北地区耕地面积阶段性增长的特点;HYDE数据集的耕地总量虽然具有一定可比性,但是年代际变化和各时间断面空间分布与历史真实情形不符.全球数据集在东北地区的重建误差可能来源于两方面:一是依据现代耕地分布格局回推历史耕地分布的方法不能反映现实开垦进程,二是遥感资料提取的现代耕地数据存在误差。 |
| [13] | . <p>Land use/cover change is an important parameter in the climate and ecological simulations. Although they had been widely used in the community, SAGE dataset and HYDE dataset, the two representative global historical land use datasets, were little assessed about their accuracies in regional scale. Here, we carried out some assessments for the traditional cultivated region of China (TCRC) over last 300 years, by comparing SAGE2010 and HYDE (v3.1) with Chinese Historical Cropland Dataset (CHCD). The comparisons were performed at three spatial scales: entire study area, provincial area and 60 km by 60 km grid cell. The results show that (1) the cropland area from SAGE2010 was much more than that from CHCD; moreover, the growth at a rate of 0.51% from 1700 to 1950 and -0.34% after 1950 were also inconsistent with that from CHCD. (2) HYDE dataset (v3.1) was closer to CHCD dataset than SAGE dataset on entire study area. However, the large biases could be detected at provincial scale and 60 km by 60 km grid cell scale. The percent of grid cells having biases greater than 70% (<-70% or >70%) and 90% (<-90% or >90%) accounted for 56%-63% and 40%-45% of the total grid cells respectively while those having biases range from -10% to 10% and from -30% to 30% account for only 5%-6% and 17% of the total grid cells respectively. (3) Using local historical archives to reconstruct historical dataset with high accuracy would be a valuable way to improve the accuracy of climate and ecological simulation.</p> |
| [14] | . Abstract<br/><p class="a-plus-plus">Reconstructions of historical cropland area and spatial distribution are necessary for studying human effects on the environment due to agricultural development. To understand the current status of reconstructions of cropland area and its spatial distribution in the mid-eleventh century in the traditional agricultural area of China, we compared three available datasets: the historic cropland inventories-based HE dataset, the population-based History Database of the Global Environment (HYDE) dataset, and the PJ dataset. The results indicate that the HYDE and PJ datasets estimated the regional mean cropland area fraction (a ratio of cropland area to total land area, hereafter, CAF) for the study area to be 0.12 and 0.09, respectively, both of which were lower than the HE estimation of 0.18. Moreover, both the HYDE and PJ datasets have a poor ability to capture the spatial distribution of the historical CAF. The HYDE dataset overestimated the cropland area in North China and underestimated the cropland area in the Yangtze River reach. The HYDE dataset also overestimated the cropland area along the great rivers in North China. The PJ dataset underestimated the cropland area in the old agricultural area and overestimated the cropland area in the relatively new agricultural area. These incorrect spatial distributions from the HYDE and PJ datasets mainly resulted from the underestimation of the historical population and an incorrect approach for the spatial allocation of cropland within China. The incorrect approach was mainly derived from a poor understanding of the historic spatial distribution of cropland. Using the expert knowledge of local historians may be an effective method to reduce the uncertainties in the global historic cropland reconstruction.</p><br/> |
| [15] | . 通过对清代文献资料中田亩数据的分析,认为册载数据基本能够反映耕地面积的总体变化趋势和区域差别,但在总量上失之过低,为能更真实地反映耕地资源的变化实际,文中对其进行了相应处理。在此基础上,研究了300余年以来我国内地18省耕地资源的时空变化特点,总体而言,过去300年间研究区的耕地资源数量呈抛物线式变化,清前期的增长趋势明显,但至清晚期逐渐稳定下来,民国时期略有下降,新中国建立初期基本得到恢复。但是,此后又开始持续减少,过去300年间耕地资源的变化具有较为明显的区域性特点,东部地区的垦殖活动远较西部地区剧烈 . 通过对清代文献资料中田亩数据的分析,认为册载数据基本能够反映耕地面积的总体变化趋势和区域差别,但在总量上失之过低,为能更真实地反映耕地资源的变化实际,文中对其进行了相应处理。在此基础上,研究了300余年以来我国内地18省耕地资源的时空变化特点,总体而言,过去300年间研究区的耕地资源数量呈抛物线式变化,清前期的增长趋势明显,但至清晚期逐渐稳定下来,民国时期略有下降,新中国建立初期基本得到恢复。但是,此后又开始持续减少,过去300年间耕地资源的变化具有较为明显的区域性特点,东部地区的垦殖活动远较西部地区剧烈 |
| [16] | . 人类通过耕作活动对自然植被景观的改变是全球环境变化的重要表现形式之一.东北地区是过去300年中国人类活动对土地覆盖变化发生重大影响的典型地区,对于从人类-环境耦合系统的角度看土地覆盖变化及其驱动机制具有重要意义.采用历史数据订正与多源耕地数据关系模型校核相结合的方法,重建了东北地区过去300年耕地面积时间序列以及耕地覆盖的空间格局变化,结果表明:(1)从变化总趋势来看,过去300年东北耕地几乎呈指数增长,增长最为迅速的时期为近100年,垦殖率由约10%增至20%以上;(2)从空间格局变化来看,18世纪中后期之前,东北三省的开垦区域还主要局限于辽宁省,19世纪末至20世纪初开垦区域大规模向北扩张,至20世纪初期,东北的垦殖北界已达到黑龙江中部;20世纪东北整体垦殖强度仍不断增大,但区域差异性逐渐减小,其中,20世纪初至30年代和20世纪50年代至80年代高垦殖率区域扩张较明显,并逐渐形成了3个主要农耕区;在20世纪30~40年代的吉林省与黑龙江省,表现出新垦殖区域向森林地区的扩张.总之,过去300年东北耕地覆盖的时空变化,反映出人类通过土地开垦、森林砍伐等生产活动已较大幅度地改变了该区域的自然景观面貌. . 人类通过耕作活动对自然植被景观的改变是全球环境变化的重要表现形式之一.东北地区是过去300年中国人类活动对土地覆盖变化发生重大影响的典型地区,对于从人类-环境耦合系统的角度看土地覆盖变化及其驱动机制具有重要意义.采用历史数据订正与多源耕地数据关系模型校核相结合的方法,重建了东北地区过去300年耕地面积时间序列以及耕地覆盖的空间格局变化,结果表明:(1)从变化总趋势来看,过去300年东北耕地几乎呈指数增长,增长最为迅速的时期为近100年,垦殖率由约10%增至20%以上;(2)从空间格局变化来看,18世纪中后期之前,东北三省的开垦区域还主要局限于辽宁省,19世纪末至20世纪初开垦区域大规模向北扩张,至20世纪初期,东北的垦殖北界已达到黑龙江中部;20世纪东北整体垦殖强度仍不断增大,但区域差异性逐渐减小,其中,20世纪初至30年代和20世纪50年代至80年代高垦殖率区域扩张较明显,并逐渐形成了3个主要农耕区;在20世纪30~40年代的吉林省与黑龙江省,表现出新垦殖区域向森林地区的扩张.总之,过去300年东北耕地覆盖的时空变化,反映出人类通过土地开垦、森林砍伐等生产活动已较大幅度地改变了该区域的自然景观面貌. |
| [17] | . 针对中国历史时期不同政体耕地记录的特点,分别采用因素修正、引用替换、线性内插、衔接对比、人地关系检验、垦殖趋势检验、行政面积比例调整等方法对历史耕地数据进行修正,重建了基于现代省界的近300 年中国分省耕地数据集,从数量角度对中国耕地总量和分省耕地变动特点进行分析,得到以下主要结论:① 在耕地总量上,SAGE和周荣的数据明显高估,本文结果与HYDE、CHCD和章有义数据的平均差异率在15%以下;但在省域尺度上,与SAGE、HYDE数据库存在明显差异,相对差异率>30%的省份比重分别为94%和61%,与CHCD数据较为接近,相对差异率>30%的省份比重为22%,但部分省份差异明显,仍需进一步分析研究;② 伴随清中期后的人口爆炸,近300 年中国耕地增长近3.2 倍,由清朝初年的42.4×10<sup>6</sup> hm<sup>2</sup> 增加至1985 年的136.9×10<sup>6</sup> hm<sup>2</sup> ,根据增长速率变化可分为五个阶段,即清前中期快速增长阶段、清后期低速增长阶段、民国时期波动阶段、建国初期剧烈增长阶段和建国后耕地流失阶段,影响耕地变化主要是国家政策、战乱、经济发展等驱动因素。③ 从省域尺度看,近300 年中国各区域耕地变化差异显著。清初,中国耕地主要集中于长江中下游平原、黄淮海平原、关中盆地及银川平原等地,此后,内地的垦殖活动不断增强,外围农区呈由南向北的趋势不断开荒。建国后,耕地开垦逐步向西北和东北方向发展。 . 针对中国历史时期不同政体耕地记录的特点,分别采用因素修正、引用替换、线性内插、衔接对比、人地关系检验、垦殖趋势检验、行政面积比例调整等方法对历史耕地数据进行修正,重建了基于现代省界的近300 年中国分省耕地数据集,从数量角度对中国耕地总量和分省耕地变动特点进行分析,得到以下主要结论:① 在耕地总量上,SAGE和周荣的数据明显高估,本文结果与HYDE、CHCD和章有义数据的平均差异率在15%以下;但在省域尺度上,与SAGE、HYDE数据库存在明显差异,相对差异率>30%的省份比重分别为94%和61%,与CHCD数据较为接近,相对差异率>30%的省份比重为22%,但部分省份差异明显,仍需进一步分析研究;② 伴随清中期后的人口爆炸,近300 年中国耕地增长近3.2 倍,由清朝初年的42.4×10<sup>6</sup> hm<sup>2</sup> 增加至1985 年的136.9×10<sup>6</sup> hm<sup>2</sup> ,根据增长速率变化可分为五个阶段,即清前中期快速增长阶段、清后期低速增长阶段、民国时期波动阶段、建国初期剧烈增长阶段和建国后耕地流失阶段,影响耕地变化主要是国家政策、战乱、经济发展等驱动因素。③ 从省域尺度看,近300 年中国各区域耕地变化差异显著。清初,中国耕地主要集中于长江中下游平原、黄淮海平原、关中盆地及银川平原等地,此后,内地的垦殖活动不断增强,外围农区呈由南向北的趋势不断开荒。建国后,耕地开垦逐步向西北和东北方向发展。 |
| [18] | . 建立具有空间属性的历史时期土地覆被数据集有助于更好地模拟土地覆被变化的气候与生态效应。根据我国历史时期土地开发利用的特点,深入分析了影响我国历史时期土地开发利用的主导因子,量化了海拔高度、坡度、人口分布等自然及人文要素与耕地分布的关系,并以此为依据设计了一套将我国传统农区历史耕地数据网格化的方法与算法模型,计算各网格(分辨率为60km×60km)耕地面积占整个农区耕地总面积的比重、以及各网格的耕地面积与垦殖率:同时利用基于《嘉庆重修一统志》重建的中国传统农区历史耕地资料。采用上述方法与算法建立了研究区内1820年(清嘉庆二十五年)60km×60km空间尺度的耕地数据集,并绘制了分布图。重建结果与册载府级田亩数据的比较分析表明:该方法与算法可以有效地将以行政区域为统计单元的中国历史耕地数据量化为具有统一且更高空间分辨率的网格化数据集。 . 建立具有空间属性的历史时期土地覆被数据集有助于更好地模拟土地覆被变化的气候与生态效应。根据我国历史时期土地开发利用的特点,深入分析了影响我国历史时期土地开发利用的主导因子,量化了海拔高度、坡度、人口分布等自然及人文要素与耕地分布的关系,并以此为依据设计了一套将我国传统农区历史耕地数据网格化的方法与算法模型,计算各网格(分辨率为60km×60km)耕地面积占整个农区耕地总面积的比重、以及各网格的耕地面积与垦殖率:同时利用基于《嘉庆重修一统志》重建的中国传统农区历史耕地资料。采用上述方法与算法建立了研究区内1820年(清嘉庆二十五年)60km×60km空间尺度的耕地数据集,并绘制了分布图。重建结果与册载府级田亩数据的比较分析表明:该方法与算法可以有效地将以行政区域为统计单元的中国历史耕地数据量化为具有统一且更高空间分辨率的网格化数据集。 |
| [19] | . 建立具有准确空间属性的历史时期土地覆被数据集有助于更好地模拟土地覆被变化的过程及其效应。本文基于我国过去300年耕地面积总体呈持续增加的特点,提出了历史时期耕地分布范围未超出现代耕地范围的合理假设,并以地表高程和坡度为影响土地宜垦程度的主导因子,评估了MODIS土地覆被产品中现代耕地分布区域的宜垦程度,再按宜垦程度从高到低的顺序,将依据历史文献资料订正的以行政单元为统计单位的耕地面积分配至网格。利用这一方法,重建了清代云南省1671年和1827年两个时间断面空间分辨率为90m的耕地空间分布格局。结果表明:该方法可有效地将历史耕地统计数据转化为具有较高空间分辨率的网格数据,其结果基本能够反映历史耕地空间格局的变化情况。 . 建立具有准确空间属性的历史时期土地覆被数据集有助于更好地模拟土地覆被变化的过程及其效应。本文基于我国过去300年耕地面积总体呈持续增加的特点,提出了历史时期耕地分布范围未超出现代耕地范围的合理假设,并以地表高程和坡度为影响土地宜垦程度的主导因子,评估了MODIS土地覆被产品中现代耕地分布区域的宜垦程度,再按宜垦程度从高到低的顺序,将依据历史文献资料订正的以行政单元为统计单位的耕地面积分配至网格。利用这一方法,重建了清代云南省1671年和1827年两个时间断面空间分辨率为90m的耕地空间分布格局。结果表明:该方法可有效地将历史耕地统计数据转化为具有较高空间分辨率的网格数据,其结果基本能够反映历史耕地空间格局的变化情况。 |
| [20] | . <p>黑河流域悠久的农业开发史和历史文献为研究历史时期耕地空间分布格局变化提供了有利条件。根据黑河流域历史时期土地开发利用的特点,深入分析了海拔、坡度、土壤、人口等自然及人文主导因子与耕地分布的关系,遴选出对耕地分布具有明显作用且易量化的影响因子,并以此为依据设计了一套历史耕地数据网格化模型,模拟了黑河流域历史时期耕地分布趋势。采用人均耕地面积与粮食单产2种途径,估算了明代以前黑河中游耕地面积总量。基于该模型并结合古遗址、遥感影像判别的结果,重建了黑河流域中游地区明代以前耕地的空间分布。</p> . <p>黑河流域悠久的农业开发史和历史文献为研究历史时期耕地空间分布格局变化提供了有利条件。根据黑河流域历史时期土地开发利用的特点,深入分析了海拔、坡度、土壤、人口等自然及人文主导因子与耕地分布的关系,遴选出对耕地分布具有明显作用且易量化的影响因子,并以此为依据设计了一套历史耕地数据网格化模型,模拟了黑河流域历史时期耕地分布趋势。采用人均耕地面积与粮食单产2种途径,估算了明代以前黑河中游耕地面积总量。基于该模型并结合古遗址、遥感影像判别的结果,重建了黑河流域中游地区明代以前耕地的空间分布。</p> |
| [21] | . <p>历史时期耕地空间格局重建是土地利用/土地覆被变化研究(LUCC)的重要组成部分,受到了国内外学术界的广泛关注。已有研究多采用基于总量进行空间分配的方法。考虑到耕地连续性分布及相关空间约束特点,基于约束性元胞自动机提出重建历史时期空间格局的方法,给出了模型建立、参数识别和结果验证的方法,结合数据可获得性,以江苏省为例进行了模型应用。通过与空间分配方法进行对比,结果表明该方法能较为客观地反映历史时期耕地空间格局的演变过程,可为历史耕地研究提供新的方法借鉴。</p> . <p>历史时期耕地空间格局重建是土地利用/土地覆被变化研究(LUCC)的重要组成部分,受到了国内外学术界的广泛关注。已有研究多采用基于总量进行空间分配的方法。考虑到耕地连续性分布及相关空间约束特点,基于约束性元胞自动机提出重建历史时期空间格局的方法,给出了模型建立、参数识别和结果验证的方法,结合数据可获得性,以江苏省为例进行了模型应用。通过与空间分配方法进行对比,结果表明该方法能较为客观地反映历史时期耕地空间格局的演变过程,可为历史耕地研究提供新的方法借鉴。</p> |
| [22] | . Reconstruction of cropland cover is crucial for assessing human impact on the environment. In this study, based on existing studies concerning historical cropland, population data and government inventories, we obtained a provincial cropland area dataset of China for 1661–1996 via collection, revision and reconstruction. Then, the provincial cropland area was allocated into grid cells of 10×10km depending on the land suitability for cultivation. Our reconstruction indicates that cropland increased from ~55.5×10 4 km 2 in 1661 to ~130.0×10 4 km 2 in 1996. From 1661 to 1873, cropland expanded tremendously in the Sichuan Basin, and land reclamation was greatly enhanced in North China Plain. For 1873–1980, agricultural development occurred primarily in northeastern China. After 1980, most provinces in the traditionally cultivated region of China experienced decreases in cropland area. In comparison with satellite-based data for 2000, we found that our reconstruction generally captures the spatial distribution of cropland. Also, differences are mostly <20% (6120 to 20%). Compared with HYDE 3.1 dataset, which is designed for the global scale, our model is more suitable for reconstructing the historical crop cover of China at 10×10km grid scale. Our reconstruction can be used in climate models to study the impact of crop cover change on the climate and carbon cycle. |
| [23] | . 以北宋暖期为研究时段,依据历史文献中有关“田亩”与“户额”的记载资料,通过对赋役、户籍、土地等制度的考证,订正了北宋中期各路耕地面积和府级人口数量;并以地面坡度、海拔高程和人口密度作为影响土地宜垦程度的主导因子,网格化重建了北宋中期境内耕地空间分布格局(60 km×60 km)。结果表明:(1) 北宋中期境内耕地约7.2 亿亩,北方占40.1%,南方占59.9%;人口数量为8720 万人,北方占38.7%,南方占61.3%;境内土地垦殖率为16.6%,人均耕地面积为8.2 亩。(2) 垦殖率较大的地区主要分布在黄淮海平原、长江中下游平原、关中平原、两湖平原以及四川盆地等,其垦殖率基本在40%以上;而岭南、西南(除成都平原外)、东南沿海和山陕黄土高原等地区垦殖率较低,其垦殖率大多小于20%。(3) 耕地分布在不同海拔高度和坡度上存在明显差异,其中低海拔(< 250m)、中海拔(250~1000 m) 和高海拔(1000~3500 m) 地区的耕地分别为4.43、2.15 和0.64 亿亩,其相应平均垦殖率为27.5%、12.6%和7.2%;而平耕地(≤ 2°)、缓坡耕地(2°~6°)、坡耕地(6°~15°) 和陡坡耕地(>15°) 的面积分别为1.16、4.56、1.44 和0.02 亿亩,其平均垦殖率分别为34.6%、20.7%、8.5%和2.3%。 . 以北宋暖期为研究时段,依据历史文献中有关“田亩”与“户额”的记载资料,通过对赋役、户籍、土地等制度的考证,订正了北宋中期各路耕地面积和府级人口数量;并以地面坡度、海拔高程和人口密度作为影响土地宜垦程度的主导因子,网格化重建了北宋中期境内耕地空间分布格局(60 km×60 km)。结果表明:(1) 北宋中期境内耕地约7.2 亿亩,北方占40.1%,南方占59.9%;人口数量为8720 万人,北方占38.7%,南方占61.3%;境内土地垦殖率为16.6%,人均耕地面积为8.2 亩。(2) 垦殖率较大的地区主要分布在黄淮海平原、长江中下游平原、关中平原、两湖平原以及四川盆地等,其垦殖率基本在40%以上;而岭南、西南(除成都平原外)、东南沿海和山陕黄土高原等地区垦殖率较低,其垦殖率大多小于20%。(3) 耕地分布在不同海拔高度和坡度上存在明显差异,其中低海拔(< 250m)、中海拔(250~1000 m) 和高海拔(1000~3500 m) 地区的耕地分别为4.43、2.15 和0.64 亿亩,其相应平均垦殖率为27.5%、12.6%和7.2%;而平耕地(≤ 2°)、缓坡耕地(2°~6°)、坡耕地(6°~15°) 和陡坡耕地(>15°) 的面积分别为1.16、4.56、1.44 和0.02 亿亩,其平均垦殖率分别为34.6%、20.7%、8.5%和2.3%。 |
| [24] | |
| [25] | . 清前期耕地面积问题久为学术界所关注,但至今尚无满意的结果.本文在前人成果的基础上在以下方面向前迈进了一步:一是确立了一套科学可信的估算基数;二是承认清代册载耕地面积的相对合理性,并尽可能多地考虑到对耕地增长速度有影响的正反两方面的因素,对不同时期、不同直省的增长速度进行修正;三是注重量化研究,不仅估算全国耕地面积总数,而且推算出各直省的耕地数字.本文结论并非最后结论,将随时依据新的实证成果作出改进. . 清前期耕地面积问题久为学术界所关注,但至今尚无满意的结果.本文在前人成果的基础上在以下方面向前迈进了一步:一是确立了一套科学可信的估算基数;二是承认清代册载耕地面积的相对合理性,并尽可能多地考虑到对耕地增长速度有影响的正反两方面的因素,对不同时期、不同直省的增长速度进行修正;三是注重量化研究,不仅估算全国耕地面积总数,而且推算出各直省的耕地数字.本文结论并非最后结论,将随时依据新的实证成果作出改进. |
| [26] | 《宋代经济史(套装全2册)》是我国经济史和宋史研究中的里程碑式著作,曾获全国高等学校人文社会科学研究优秀成果奖一等奖。《宋代经济史(套装全2册)》从人口、垦田、水利、经济作物、经营方式、土地所有制形式、赋税制度等方面,全面论述两宋300年间社会经济关系发展演变的全过程,重点研究了宋代农业生产、土地关系、手工业发展、国家专利制度、商业和城市经济、对外贸易、货币及经济思想等问题,提出了一系列精辟的见解。《宋代经济史(套装全2册)》使用的是中华书局2009年版本。 《宋代经济史(套装全2册)》是我国经济史和宋史研究中的里程碑式著作,曾获全国高等学校人文社会科学研究优秀成果奖一等奖。《宋代经济史(套装全2册)》从人口、垦田、水利、经济作物、经营方式、土地所有制形式、赋税制度等方面,全面论述两宋300年间社会经济关系发展演变的全过程,重点研究了宋代农业生产、土地关系、手工业发展、国家专利制度、商业和城市经济、对外贸易、货币及经济思想等问题,提出了一系列精辟的见解。《宋代经济史(套装全2册)》使用的是中华书局2009年版本。 |
| [27] | 《宋代农业地理》是我国历史农业地理研究的第一部断代之作,填补了我国历史农业地理研究缺少专著的空白。该书在断代历史农业地理研究方面作出了许多有益的探索。作者选择宋代作为一个特定时代进行研究是很有意义的,宋代在我国农业发展的历史上是一个很重要的时期。宋代人口超过以前的汉唐盛世,土地的开垦也大大超过了以前各代,江南丘陵山地也被广泛地开垦,小麦等旱作粮食作物(在江南地区)得到广泛推广。 《宋代农业地理》是我国历史农业地理研究的第一部断代之作,填补了我国历史农业地理研究缺少专著的空白。该书在断代历史农业地理研究方面作出了许多有益的探索。作者选择宋代作为一个特定时代进行研究是很有意义的,宋代在我国农业发展的历史上是一个很重要的时期。宋代人口超过以前的汉唐盛世,土地的开垦也大大超过了以前各代,江南丘陵山地也被广泛地开垦,小麦等旱作粮食作物(在江南地区)得到广泛推广。 |
| [28] | . 正宋代社会生产有了极为显著的发展,其中农业生产的发展,推动了整个国民经济的发展。随着社会生产的全面发展,各地区之间的差距更加扩大了,不平衡性更加突出了。研究这个问题,对了解宋代社会经济结构、阶级结构,都有其重要的意义和作用。这个问题比较大,也比较复杂。我在《关于宋代人口的几个问题》、《宋代以川峡路为中心的庄园农奴制》等文中,曾就某个侧面叙述了一下。这篇文章打算从农业经营方式、单位面积产量方面加以考察,请同志们指正。 . 正宋代社会生产有了极为显著的发展,其中农业生产的发展,推动了整个国民经济的发展。随着社会生产的全面发展,各地区之间的差距更加扩大了,不平衡性更加突出了。研究这个问题,对了解宋代社会经济结构、阶级结构,都有其重要的意义和作用。这个问题比较大,也比较复杂。我在《关于宋代人口的几个问题》、《宋代以川峡路为中心的庄园农奴制》等文中,曾就某个侧面叙述了一下。这篇文章打算从农业经营方式、单位面积产量方面加以考察,请同志们指正。 |
| [29] | . 宋代下层人户一般每天收入数十文到100文不等,维持一个人一天最低生活的费用约需20文.普通居民全年所有花销,每人每天平均100文左右.中等人户的家产,北宋大约在1000贯以上,南宋大约在3000贯以上,不过各地有很大的差异.具体到宋钱的币值,从1文钱、10文钱、100文钱、1贯钱、10贯钱、100贯钱、1000贯钱到1万贯钱,其购买力因时因地而有所不同,各列举有大量事例,以便互相比较. . 宋代下层人户一般每天收入数十文到100文不等,维持一个人一天最低生活的费用约需20文.普通居民全年所有花销,每人每天平均100文左右.中等人户的家产,北宋大约在1000贯以上,南宋大约在3000贯以上,不过各地有很大的差异.具体到宋钱的币值,从1文钱、10文钱、100文钱、1贯钱、10贯钱、100贯钱、1000贯钱到1万贯钱,其购买力因时因地而有所不同,各列举有大量事例,以便互相比较. |
| [30] | . . |
| [31] | 本图组包括全图一幅、分幅图四幅。全图画出秦朝后期的疆域政区包括内史、四十八郡和“置吏”十余年的西南夷地区夜郎、滇等部族,以及当时我国边区各族的分布地。 本图组包括全图一幅、分幅图四幅。全图画出秦朝后期的疆域政区包括内史、四十八郡和“置吏”十余年的西南夷地区夜郎、滇等部族,以及当时我国边区各族的分布地。 |
| [32] |
