 , 王彦文, 程维明
A new method of landform element classificationbased on multi-scale morphology
KANGXin, WANGYanwen, CHENGWeiming通讯作者:
收稿日期:2016-03-5
修回日期:2016-06-27
网络出版日期:2016-09-10
版权声明:2016《地理研究》编辑部《地理研究》编辑部
基金资助:
作者简介:
-->
展开
摘要
关键词:
Abstract
Keywords:
-->0
PDF (28097KB)元数据多维度评价相关文章收藏文章
本文引用格式导出EndNoteRisBibtex收藏本文-->
1 引言
地貌形态元素(landform element)简称地形元素,是地形条件组合相似、空间邻近的一组空间位置所形成的地表形态类型基本单元[1],例如山脊、沟谷、鞍部、平区和洼地等[2] ,地形元素的不同空间组合可形成更高级别的地貌类型[3,4],对地形的客观分析、描述与表达历来是地理学家关注的重点[5],地形元素不但在地貌研究中有重要作用[6,7],也常用于数字土壤制图[8]、景观生态制图[9]等领域中的基本单元选取。目前,地形元素的定量提取方法主要是利用栅格DEM数据,对地表形态进行空间划分并指定所属的地形元素类别[1],现有方法的基本思路可归纳为两种:聚类和分类。采用聚类思路进行地形元素空间划分的方法是对栅格DEM所派生出的地形属性(如坡度、曲率等)集合进行聚类,之后将聚出的类识别为地形元素类型[10-12]。采用聚类思路的方法存在如下主要问题:① 所得的聚类数难以预先确定,且聚类过程主要是根据各空间位置上各地形属性值在属性空间中出现的频率分布,对一些只在较小空间范围中出现的地形元素难以聚类得出[13],因此导致聚类结果与实际应用的地形元素类型不易对应[14];② 由于是在地形属性集所构成的属性空间中聚类,对重要的空间位置信息缺乏考虑,因此对聚类结果可能不易给出合理的地学解释[15];③ 对地形属性集的选择是基于经验,若与研究区内地形元素分布关系密切的地形属性未被选入,将直接影响到聚类结果的有效性。
采用分类思路进行地形元素空间划分的方法预设地形元素分类系统[2,16,17],再根据每一种地形元素的某种具体定义采用相应的推理方法识别出该地形元素的空间分布。对地形元素的不同定义方式和相应选取的推理方法形成了各具特点的不同算法,大致分为以下三类:
第一类方法需要用户根据应用区特点,基于多种地形属性显式地给出每一类地形元素的定义。这类方法最初需要用户指定布尔逻辑规则,用于决策树判定各空间位置上的地形元素[18],这种方式完全忽略了地形元素普遍存在的空间渐变特征[13]。因此模糊隶属度曲线的形式被引入,取代布尔逻辑规则来显式定义地形元素所对应的地形属性特征[19],通过模糊推理来提取出各类地形元素的空间分布信息。对于用户来说,选取合适的地形属性集并显式地给出每一类地形元素的定义,难度较大。此外,基于地形属性集定义地形元素的方式使得这类方法仅在属性空间中进行推理,忽略了空间位置信息,即使采用某种能够部分反映相对位置信息的地形属性[19],也只是间接地部分缓解这个问题。
第二类方法是利用应用区中各地形元素的典型位置,将其作为“原型”来定义对应的地形元素[20],用户基于地形属性集来定义偏离原型对应的地形属性值时的相似度曲线,用这些信息进行模糊推理,可对应用区中各地形元素的空间渐变信息进行定量化。该方法的优势在于研究区中地形元素的典型位置易于识别,既包括了属性信息,也包括了空间位置信息,可避免第一类方法需要用户指定详细规则来定义研究区中地形元素的困难;同时,模糊推理中直接考虑了空间信息,也避免了第一类方法仅在属性空间进行推理的不合理之处[13,20]。但这一类采用典型位置作为原型的方法仍需主观地选择地形属性集进行相似度曲线定义和模糊推理,地形属性集的合理性直接影响结果的有效性。
第三类方法是直接基于指定大小邻域窗口内高程的相对差异信息来判别某一空间位置所对应的地形元素类型(Jasiewicz等提出),这种对地形元素的局域高程判别分类方法被命名为“Geomorphons”[21]。Geomorphons方法无须使用地形属性集,因此可避免前两类方法需要用户选择地形属性集的问题,也不受某一地形属性不同算法的影响。这类方法基于分析窗口内的高程进行判别,因此Geomorphons方法的分析过程直接考虑了空间位置信息,避免了那些仅在属性空间进行分类的方法的不合理之处,所得判别结果也与地形元素的概念图示[2]有直观的对应,便于进行地学解释。
尽管Geomorphons方法根据局域高程进行对地形元素判别分类的思路,较现有其他的地形元素分类方法有明显的优势,但该方法的分类方式仍局限于单一分析尺度,与地形元素所具有的多尺度特征[5,22]不相适应,这将会影响应用结果的合理性。本文针对此问题进行方法改进,借鉴Geomorphons方法中基于局域高程进行地形元素分类的思路,并引入多尺度分析方式,提出了对局域高程多尺度综合判别的地形元素分类方法。本文首先对Geomorphons方法及其存在的不足之处进行介绍,之后针对性地提出解决思路和具体算法,并通过实际应用案例对本文提出的方法的有效性进行初步验证。
2 Geomorphons地形元素分类方法
Geomorphons方法[21]根据待推测栅格和其8个方向邻域间可能存在的3种高程关系(高、低、相等),组合出了可能存在的38=6561种局域几何形态模式,根据地学含义去重、精简、归并整理后,进一步映射到与地理现象密切相关的10种地形元素,即山峰、山脊、平区、沟谷、坡肩、坡脚、直背坡、凸背坡、凹背坡和洼地,如图1所示。Geomorphons方法从DEM数据局域几何形态模式到地形元素的映射处理,是该方法较其他地形元素分类方法的主要不同之处,其优势在于DEM数据的局域几何形态模式是穷举的、确定的,对所有的应用场景都是通用的。在不同的应用场景下,研究区域的地形特点以及用户所要采用的地形元素分类系统可能不尽相同。通过这种处理,用户只需根据应用需求设定从局域几何形态模式到地形元素的映射表,即查找表,无需对算法本身进行改变,就可以满足应用需求。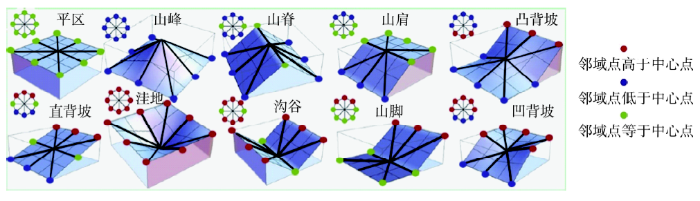 显示原图|下载原图ZIP|生成PPT
图1Geomorphons方法采用的10种地形元素示意图(改自Jasiewicz等[
-->Fig. 1The ten types of landform elements used in the Geomorphons method (adapted from Jasiewicz, et al[
-->
为了得到各待推测点的局域几何形态模式,Geomorphons方法在逐栅格进行形态模式识别时,借鉴了Yokoyama等提出的地形开放度(openness)的计算方法[23]。以待推测点栅格为起点,分别沿8邻域方向进行搜索,寻找各方向在预设最大搜索半径范围内的地形特征点,即在该搜索方向上的搜索半径内,以此点与待推测点的连线间无遮挡且水平倾角绝对值最大的栅格点。根据地形特征点的相对角度大小来决定对应方向上相对于中心栅格高程是高、低或相等(用户需设定一个角度阈值参数来判断两个高程是否可认为相等),用于判定局域几何形态模式。
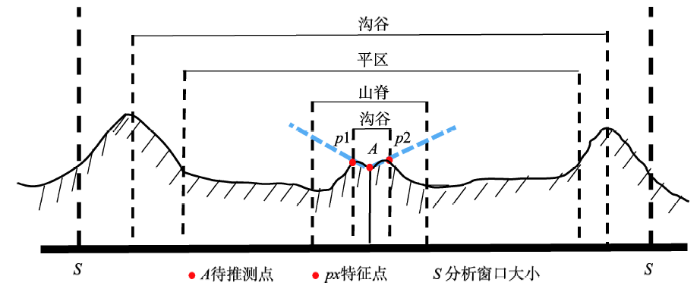
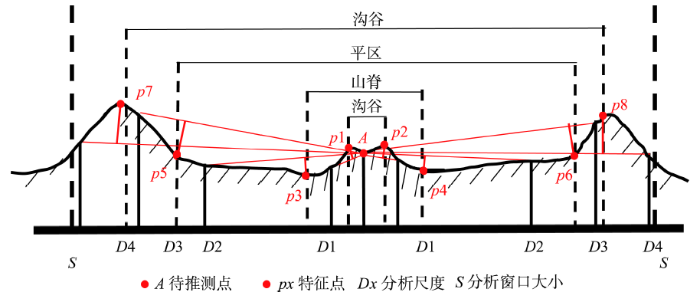
Geomorphons方法利用地形开放度选取地形特征点来决定与中心栅格高程相对关系的做法,虽然在不同的搜索半径内,具有一定的局域地形条件自适应能力,但本质上仍是单一分析尺度下的分类,与地形元素所具有的多尺度特征不相适应,这会影响应用结果的合理性。在实际应用中,当遇到较粗糙地形,高程大幅变化较密集地形或DEM数据噪声较大的情况时,该方法所找出的特征点栅格往往很靠近中心栅格,决定分类结果的也常常仅是固定单一的较小分析尺度上的特征点组合,当前搜索半径内更大尺度的地形特征并未予以考虑(图2),由此会造成地形元素的误分类。如图2所示,在分析窗口S内,待推测点A的地形类型具有多尺度特征,分别可以被分为沟谷、平区、山脊等地形元素类型,但是因为p1与p2和A点所成水平倾角大于分析窗口内其他所有高程点和A点所成的水平倾角,所以在所有尺度下,A点的地形元素类型都会被分为沟谷,造成不合理结果。因此,Geomorphons方法存在着选取单一、较小分析尺度上地形特征点进行地形元素分类的不足之处,有待继续改进。
 显示原图|下载原图ZIP|生成PPT
图2Geomorphons方法单一分析尺度分类的问题
-->Fig. 2Example of the problem in the Geomorphons method due to its single-scale characteristic
-->
3 多尺度综合判别的地形元素分类方法
对于一个空间位置所属地形元素的判别,在不同特征尺度下,其判别结果可能完全不同[24,25]。因此,在不同特征尺度下进行判别并进行多尺度综合[22],才能够避免在单一分析尺度下进行地形元素分类的不足之处。如果考虑一系列的分析窗口,在每一分析窗口上寻找特征尺度以进行地形元素分类,所有结果会构成一个沿特征尺度维的地形元素分类结果向量,对该向量进行多尺度综合后,所得到的判定结果考虑了整个特征尺度范围内的地形特征,可避免Geomorphons方法选取单一分析尺度下的地形特征点所造成的问题。同时,对多分析尺度下的结果进行综合的过程中,还可同时给出最终分类结果的不确定性信息。
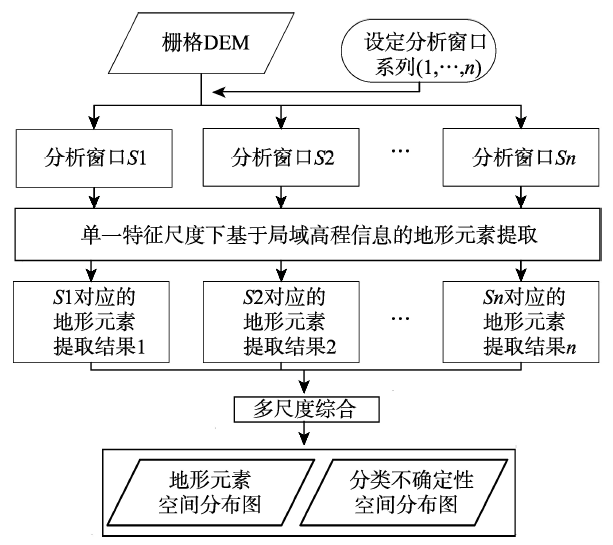
基于上述思想,结合Geomorphons方法中优于其他地形元素分类方法的部分,设计了基于局域高程的多特征尺度综合判别的地形元素分类方法(图3)。新方法首先考虑一系列的分析窗口,对每一个分析窗口,识别出8方向上的特征尺度,判断每个方向上特征尺度上的栅格点(特征点)相对于待推测点的相对高程关系,利用Geomorphons方法中局域几何形态到地形元素的映射模式,判别生成单一分析尺度下的地形元素类型分类结果,然后对各分析尺度下得到的结果进行多尺度综合,得出最终的地形元素分类结果。
 显示原图|下载原图ZIP|生成PPT
图3多分析尺度下综合判别的地形元素分类方法流程图
-->Fig. 3Flowchart of the proposed method of landform element classification based on the multi-scale pattern
-->
3.1 单一分析尺度下的地形元素分类
在单一分析窗口上进行地形类型判别时,Geomorphons方法中获取特征点所采用的地形开放度方法易造成不合理的结果,因此,本文借鉴Douglas-Peucker线简化算法的思想[26],对特征点获取方法进行改进。Douglas-Peucker算法的思想是保留待简化线的整体特征,将反映几何形态整体趋势的特征点予以保留。基于该思想,本文对于某一分析窗口,在选择一个搜索方向上的对应特征点时,以待推测点与该搜索方向上当前分析窗口的边界高程点进行连线,偏离该线最远的点即选为特征点(图4)。对于8个搜索方向上所获得的8个特征点,根据Geomorphons方法的类型判断规则识别出当前分析窗口对应的地形元素类别。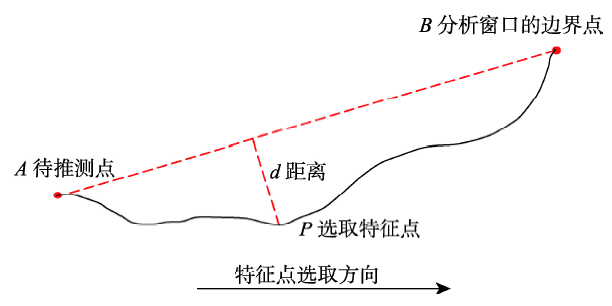 显示原图|下载原图ZIP|生成PPT
图4基于Douglas-Peucker算法思想,选取任一搜索方向上对应一个分析尺度内的特征点
-->Fig. 4Identification of the feature point based on the idea proposed by the Douglas-Peucker Method
-->
对图2中的地形剖面采用上述方法,可以分别正确识别出待推测点A在不同分析尺度上对应的地形元素类型(分别为沟谷、山脊、平区、沟谷)(图5),符合图中地形剖面的多尺度特征。
 显示原图|下载原图ZIP|生成PPT
图5基于Douglas-Peucker算法思想在不同分析尺度下选取特征点
-->Fig. 5Example of multiscale feature points identification based on the method proposed in this paper
-->
3.2 对单一分析尺度下地形元素分类结果的多尺度综合
在栅格式中:
通过熵值计算来度量最终分类结果的不确定性,可定量体现不同尺度下分类结果的差异性,该不确定性信息本身并不直接对应于最终分类结果的准确性与地形的多尺度效应,但不确定性高的区域,通常是分类误差较大的区域,也是地形多尺度效应较强的区域;不确定性低的区域,分类结果的误差一般也相应较低[17],并且地形的多尺度效应较弱。分类结果的不确定性信息对于后续各种应用模型中有效使用这些分类结果具有重要作用[8,27]。
对研究区每一栅格完成上述步骤后,即可获得研究区的地形元素类型栅格分布图,以及相应体现分类结果不确定性的熵值分布图。
4 应用案例
4.1 应用区简介
实验区位于渭河平原南部,西安市东南侧,海拔高度为416~1086 m,面积约235 km2(图6)。该区总体地势东北、西南两侧高,中部有灞河沿西北向东南穿过,东北侧主要山脉为骊山。实验数据为ASTER GDEM,水平分辨率为30 m,共有846×662个栅格。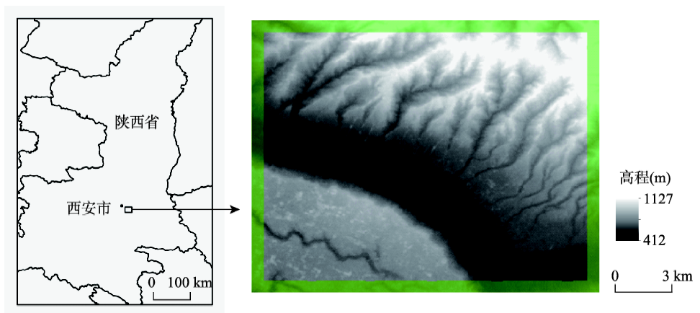 显示原图|下载原图ZIP|生成PPT
图6实验区位置及DEM
-->Fig. 6Study area and DEM
-->
4.2 方法应用评价实验
将本文提出的多尺度综合判别方法与Geomorphons方法在研究区进行实际应用,并对结果定性对比分析。同时还比较了直接将原有Geomorphons方法按照相同的多尺度设置及综合方法扩展为多尺度的方法(以下称为多尺度Geomorphons方法),以分析单一尺度上特征点选取方式改进的有效性。一般认为在1 km以内的地理范围上识别地形元素较为适宜[1],本文应用3种方法时,选取30个栅格作为最大分析尺度,分析尺度为3~30个栅格,共计28个。用于判定特征点与待推测点间相对高程关系的角度阈值设置为1°。考虑到边界区域的栅格在实际计算中无法获得完整的分析窗口数据,因为实验区DEM边界上宽度为最大分析尺度的区域(图6中DEM边界阴影部分)只参与计算,不参与后续的结果讨论。
4.3 结果与讨论
在研究区应用各方法后,得到原有Geomorphons方法地形元素分类结果图(图7a),多尺度Geomorphons方法地形元素分类结果图(图7b),本文提出的多尺度综合方法地形元素分类结果图(图7d),以及相应的多尺度分类结果不确定性分布图(图7c、图7e)。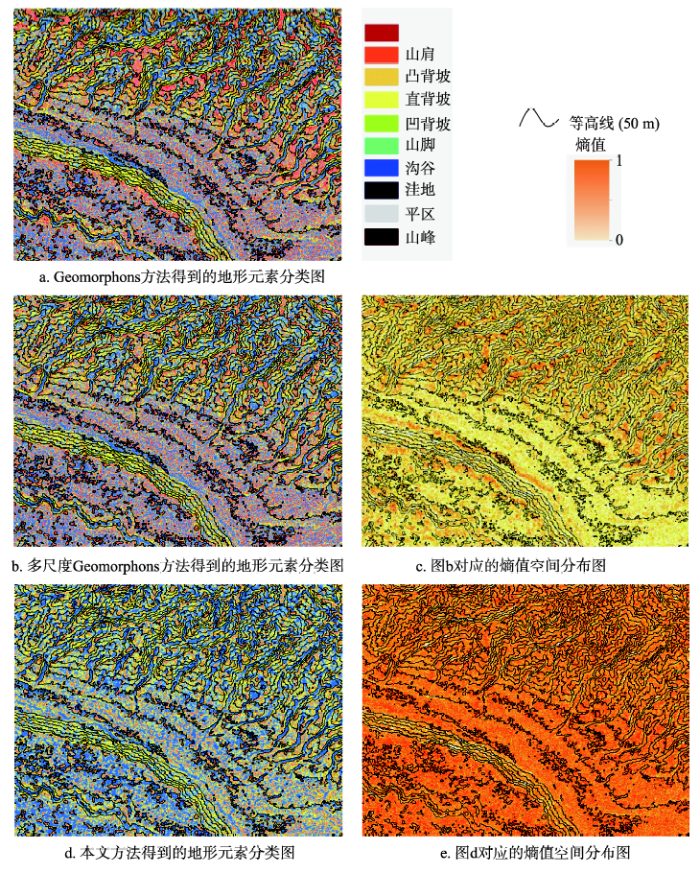 显示原图|下载原图ZIP|生成PPT
图73种方法应用结果对比
-->Fig. 7The results from the proposed method and the reference methods
-->
在空间中,地形元素是渐变的、模糊的,判别出的各类地形元素缺乏具有固定标准的真值,因此对地形元素的分类结果进行定量评价十分困难,目前仍以定性评价为主[9, 21, 28]。本文主要通过定性对比得到的各结果图对3种方法进行评价。
通过比较分析,发现Geomorphons方法得到的分类结果极为破碎(图7a)。本文方法识别出的地形元素空间分布连续性与完整性更好(图7d),整体分布趋势基本能反映出各类地形元素的分布规律,分类结果更加合理。
与Geomorphons方法相比(图7a),多尺度Geomorphons方法得到的结果(图7b)差别不大,这从侧面证实了Geomorphons方法在本质上是一种单尺度的地形元素分类方法。即使按照多尺度综合的思想加以改进,Geomorphons方法也难以反映地形元素的多尺度特征。
对比多尺度Geomorphons方法与本文提出的多尺度综合判别方法得到的分类不确定性(熵值)图(图7c、图7e)可以看出,多尺度Geomorphons方法得到的熵值在全区域上整体偏低,即使在山脚、河流两岸等地形元素变化复杂的地区,熵值也无明显增加,这说明多尺度Geomorphons方法得到的熵值图难以有效指示多尺度分类结果的不确定性。此外,多尺度Geomorphons方法得到的熵值最高(即不确定性最高)的区域主要为山区、河谷,河流阶地区的熵值明显小于山区、河谷。而实际中,相较于山区或者河谷,河流沿岸地区的地形更为复杂,地形的多尺度特征更加突出,地形元素分类结果更可能变得破碎,相应的分类结果不确定性应该更高。因此多尺度Geomorphons方法得到的熵值图难以有效指示多尺度分类结果的不确定性。这是由于该方法基于开放度来提取特征点所导致的问题。河流沿岸地区地形起伏度虽然不大,但是起伏距离很小,这就造成该区域内栅格在应用Geomorphons方法进行地形元素分类时,较可能在很短距离内就提取到对应最大角度的特征点,之后随着搜索半径的增加,待推测栅格的特征点也不再改变。这导致多尺度Geomorphons方法所得河流沿岸地区的分类不确定性远小于其他地区,无法反映该地区复杂地表形态的多尺度信息。
本文方法结果中,不确定性最高的区域位于河流沿岸,总体上其不确定性明显高于河谷、山区。山区中的沟谷不确定性最低,而该区域中本文提出的多尺度方法的地形元素分类结果是最连续、变化最小的。这体现了本文方法结果的合理性,表明本文方法采用Douglas-Peucker算法思想选取特征点来判别地形元素类型是有效的,计算出的分类不确定性结果能合理地反映地形的多尺度特征。
5 结论
Geomorphons方法本质上是在单一分析尺度上选择地形特征点用于判别地形元素分类,无法反映地形的多尺度特征,本文针对该问题,突出地形元素的多尺度特征,提出了一种局部高程信息多尺度综合判别地形元素类型的方法。该方法在一系列的单一分析尺度上分别基于局部高程信息进行地形元素分类,进而通过多尺度综合得到最终的分类结果,以避免Geomorphons方法中存在的问题。应用评价结果显示,与Geomorphons方法相比,本文提出的方法所识别各地形要素的结果更为合理。在本文所提出的方法中,多分析尺度下综合的方式、分析尺度范围等是影响最终分类结果的重要因素,下一步将对此做进一步的分析评价。此外,受限于本领域尚缺乏对地形元素分类结果简便、有效的定量评价方法,目前对本方法应用结果的有效性评价主要是通过定性方式判断分类结果空间分布的合理性,今后还将进一步开展定量评价方法的研究。
The authors have declared that no competing interests exist.
参考文献 原文顺序
文献年度倒序
文中引用次数倒序
被引期刊影响因子
| [1] | . |
| [2] | . |
| [3] | . <p>平原、台地、丘陵、山地等是地表最基本的地貌形态,这些名称不仅为专业领域广泛引用,也为普通人所知晓。近100年来多种地貌分类方案中都涉及这些地貌类型名称,有的称其为地貌"基本形态"。由于每种地貌形态都不仅包含形态特征,而且还有一定的成因意义,因此应称其为基本地貌类型。通过对已有的基本地貌分类及其划分指标进行系统分析和评估,认为中国陆地基本地貌类型按照起伏高度和海拔高度两个分级指标组合来划分的原则符合起伏复杂、多台阶中国地貌的基本特点。在传统的平原、台地、丘陵和山地分类的基础上,按起伏高度对山地进一步细分,即划分平原、台地、丘陵(<200m)、小起伏山地(200~500m)、中起伏山地(500~1000m)、大起伏山地(1000~2500m)和极大起伏山地(>2500m)等7个基本地貌"形态"。本文对前人以现代雪线、多年冻土下线和森林上线高度为依据确定地貌面海拔高度的分级指标进行了全面分析,由于它们的海拔高度在全国各地存在巨大差异,我们认为海拔高度等级指标并不符合中国实际。通过全国重点地区1∶500000地形图山地顶面海拔高度分布和1∶1000000国家数字高程模型(DTM)数据库编制的中国地面高程分布图进行较系统的分析,我们提出了应以1000m,2000m,4000m和6000m作为划分低海拔(<1000m)、中海拔(1000~2000m)、亚高海拔(2000~4000m)、高海拔(4000~6000m)和极高海拔(>6000m)地貌海拔高度分级指标。根据7个地貌起伏高度形态和5个海拔高度等级,将全国组合成从低海拔平原至极大起伏极高山28个基本地貌类型。</p> . <p>平原、台地、丘陵、山地等是地表最基本的地貌形态,这些名称不仅为专业领域广泛引用,也为普通人所知晓。近100年来多种地貌分类方案中都涉及这些地貌类型名称,有的称其为地貌"基本形态"。由于每种地貌形态都不仅包含形态特征,而且还有一定的成因意义,因此应称其为基本地貌类型。通过对已有的基本地貌分类及其划分指标进行系统分析和评估,认为中国陆地基本地貌类型按照起伏高度和海拔高度两个分级指标组合来划分的原则符合起伏复杂、多台阶中国地貌的基本特点。在传统的平原、台地、丘陵和山地分类的基础上,按起伏高度对山地进一步细分,即划分平原、台地、丘陵(<200m)、小起伏山地(200~500m)、中起伏山地(500~1000m)、大起伏山地(1000~2500m)和极大起伏山地(>2500m)等7个基本地貌"形态"。本文对前人以现代雪线、多年冻土下线和森林上线高度为依据确定地貌面海拔高度的分级指标进行了全面分析,由于它们的海拔高度在全国各地存在巨大差异,我们认为海拔高度等级指标并不符合中国实际。通过全国重点地区1∶500000地形图山地顶面海拔高度分布和1∶1000000国家数字高程模型(DTM)数据库编制的中国地面高程分布图进行较系统的分析,我们提出了应以1000m,2000m,4000m和6000m作为划分低海拔(<1000m)、中海拔(1000~2000m)、亚高海拔(2000~4000m)、高海拔(4000~6000m)和极高海拔(>6000m)地貌海拔高度分级指标。根据7个地貌起伏高度形态和5个海拔高度等级,将全国组合成从低海拔平原至极大起伏极高山28个基本地貌类型。</p> |
| [4] | . 本文从地貌学的性质出发,确定形态分类的指导原则应着眼于反映成因的形态。运用模糊数学方法建立形态基本类型的分类系统。给出进一步划分基本形态类型的两个分类方案,并分析它们的优缺点。 . 本文从地貌学的性质出发,确定形态分类的指导原则应着眼于反映成因的形态。运用模糊数学方法建立形态基本类型的分类系统。给出进一步划分基本形态类型的两个分类方案,并分析它们的优缺点。 |
| [5] | . 数字高程模型是最重要的国家基础地理信息数据,基于GIS的数字地形分析的理论、方法与应用,是当今地理学、地貌学界,特别是地理信息科学研究的热点问题.本文从DEM的数据模型、数字地形分析的不确定性、分析方法、尺度效应、高性能计算方法以及地学应用等方面,对我国****在该领域的研究情况,特别是研究成果进行较全面的梳理与分析.综述显示,我国具有一批从事数字高程模型与数字地形分析的高水平研究力量,研究方向紧跟国际前沿,并取得了丰硕的成果,部分研究内容具有显著创新,年轻一代科学家正加速成长.在黄土高原、青藏高原的区域数字地形分析方面更彰显我国科学家的优势与特色,在国际学术界产生了重要的影响. . 数字高程模型是最重要的国家基础地理信息数据,基于GIS的数字地形分析的理论、方法与应用,是当今地理学、地貌学界,特别是地理信息科学研究的热点问题.本文从DEM的数据模型、数字地形分析的不确定性、分析方法、尺度效应、高性能计算方法以及地学应用等方面,对我国****在该领域的研究情况,特别是研究成果进行较全面的梳理与分析.综述显示,我国具有一批从事数字高程模型与数字地形分析的高水平研究力量,研究方向紧跟国际前沿,并取得了丰硕的成果,部分研究内容具有显著创新,年轻一代科学家正加速成长.在黄土高原、青藏高原的区域数字地形分析方面更彰显我国科学家的优势与特色,在国际学术界产生了重要的影响. |
| [6] | . |
| [7] | . 沟头是黄土地貌中发育最活跃的地貌部位,沟头的个体与群体对黄土沟间地的蚕食,成为监测黄土高原地面侵蚀演化的重要标识。有效获取并分析沟头的空间分布特征,对于系统、深入地研究黄土地貌的空间形态结构具有重要的意义。以陕北黄土高原典型地貌类型区为实验样区,设计并实现了基于5 m分辨率DEM的沟头提取算法,获取了各实验样区的沟头空间信息;运用点格局分析方法,分析了沟头的空间分布特征。实验结果显示,所提出顾及沟沿线的沟头自动提取方法,具有较好的合理性与精确性;同时,从黄土塬区、黄土残塬区到黄土丘陵沟壑区,随着沟壑发育程度的增强,沟头逐步逼近分水线,其空间分布呈现“远分水线聚集—随机—近分水线聚集”的变化格局。 . 沟头是黄土地貌中发育最活跃的地貌部位,沟头的个体与群体对黄土沟间地的蚕食,成为监测黄土高原地面侵蚀演化的重要标识。有效获取并分析沟头的空间分布特征,对于系统、深入地研究黄土地貌的空间形态结构具有重要的意义。以陕北黄土高原典型地貌类型区为实验样区,设计并实现了基于5 m分辨率DEM的沟头提取算法,获取了各实验样区的沟头空间信息;运用点格局分析方法,分析了沟头的空间分布特征。实验结果显示,所提出顾及沟沿线的沟头自动提取方法,具有较好的合理性与精确性;同时,从黄土塬区、黄土残塬区到黄土丘陵沟壑区,随着沟壑发育程度的增强,沟头逐步逼近分水线,其空间分布呈现“远分水线聚集—随机—近分水线聚集”的变化格局。 |
| [8] | . <p>坡位的空间渐变特征影响着小流域及坡面尺度上的土壤、水文、地貌等现象和过程,因此对精细尺度下的地理建模(如土壤空间信息推理)有重要作用。虽然目前已有多种模糊坡位信息定量提取方法,但所得到的模糊坡位信息还缺乏实际应用。本文以精细尺度下的土壤属性空间分布推测为例,对此展开探索。应用模型假设:(1)在小流域内,地形因素主导着土壤属性空间分布的变化;(2)典型坡位上对应分布着典型的土壤属性值,土壤属性与坡位之间存在协同变化关系。据此建立以模糊坡位信息对各类典型坡位上土壤样点属性值的加权平均模型,推测土壤属性的空间分布。模型应用于黑龙江省嫩江流域一个地形平缓的小区(面积约60 km<sup>2</sup>),通过一个以坡位典型位置作为原型的模糊坡位定量方法提取5类坡位(山脊、坡肩、背坡、坡脚、沟谷)的空间渐变信息,对土壤表层有机质含量的空间分布进行推测。推测结果通过研究区70个土壤采样点进行评价,以推测结果与评价样点集之间的相关系数、平均绝对误差、均方根误差作为定量评价指标,与使用常用地形属性的多元线性回归模型推测结果进行对比。评价结果表明,仅使用极少建模点的加权平均模型的推测结果优于多元线性回归模型的推测结果。</p> . <p>坡位的空间渐变特征影响着小流域及坡面尺度上的土壤、水文、地貌等现象和过程,因此对精细尺度下的地理建模(如土壤空间信息推理)有重要作用。虽然目前已有多种模糊坡位信息定量提取方法,但所得到的模糊坡位信息还缺乏实际应用。本文以精细尺度下的土壤属性空间分布推测为例,对此展开探索。应用模型假设:(1)在小流域内,地形因素主导着土壤属性空间分布的变化;(2)典型坡位上对应分布着典型的土壤属性值,土壤属性与坡位之间存在协同变化关系。据此建立以模糊坡位信息对各类典型坡位上土壤样点属性值的加权平均模型,推测土壤属性的空间分布。模型应用于黑龙江省嫩江流域一个地形平缓的小区(面积约60 km<sup>2</sup>),通过一个以坡位典型位置作为原型的模糊坡位定量方法提取5类坡位(山脊、坡肩、背坡、坡脚、沟谷)的空间渐变信息,对土壤表层有机质含量的空间分布进行推测。推测结果通过研究区70个土壤采样点进行评价,以推测结果与评价样点集之间的相关系数、平均绝对误差、均方根误差作为定量评价指标,与使用常用地形属性的多元线性回归模型推测结果进行对比。评价结果表明,仅使用极少建模点的加权平均模型的推测结果优于多元线性回归模型的推测结果。</p> |
| [9] | . |
| [10] | . ABSTRACT Previous attempts to devise automated methods of landscape classification have been frustrated by computational issues related to the size of the data set and the fact that most automated classification methods create discrete classes while ‘natural’ interpreted landscape units often have overlapping property sets. Methods of fuzzy k-means have been used by other workers to overcome the problem of class overlap but their usefulness maybe reduced when data sets are large and when the data include artefacts introduced by the derivation of landform attributes from gridded digital elevation models.This paper presents ways to overcome these limitations using spatial sampling methods, statistical modelling of the derived stream topology, and fuzzy k-means using the Distance metric. Using data from Alberta, Canada, and the French pre-Alps it is shown how these methods may easily create meaningful, spatially coherent land form classes from high resolution gridded DEMs. |
| [11] | . This paper presents an automated classification system of landform elements based on object-oriented image analysis. First, several data layers are produced from Digital Terrain Models (DTM): elevation, profile curvature, plan curvature and slope gradient. Second, relatively homogenous objects are delineated at several levels through image segmentation. These object primatives are classified as landform elements using a relative classification model, built both on the surface shape and on the altitudinal position of objects. So far, slope aspect was not used in classification. The classification has nine classes: peaks and toe slopes (defined by the altitudinal position or the degree of dominance), steep slopes and flat/gentle slopes (defined by slope gradients), shoulders and negative contacts (defined by profile curvatures), head slopes, side slopes and nose slopes (defined by plan curvatures). Classes are defined using flexible fuzzy membership functions. Results are visually analyzed by draping them over DTMs. Specific fuzzy classification options were used to obtain an assessment of output accuracy. Two implementations of the methodology are compared using (1) Romanian datasets and (2) Berchtesgaden National Park, Germany. The methodology has proven to be reproducible; readily adaptable for diverse landscapes and datasets; and useful in respect to providing additional information for geomorphological and landscape studies. A major advantage of this new methodology is its transferability, given that it uses only relative values and relative positions to neighboring objects. The methodology introduced in this paper can be used for almost any application where relationships between topographic features and other components of landscapes are to be assessed. |
| [12] | . In: In this paper, we introduce an algorithm to delineate elementary forms on Digital Elevation Models (DEMs). Elementary forms are defined by constant values of fundamental morphometric properties and limited by discontinuities of these properties. A multiresolution segmentation technique was customized to partition the layers of altitude derivatives into homogeneous divisions through a self-scalable procedure, which reveals the pattern encoded within the data. Layers were segmented successively, following the order of elevation derivatives, i.e. gradient, aspect, profile curvature, and plan curvature. Each segmentation was followed by extraction of elementary forms, thus leaving only heterogeneous surfaces for further segmentation steps. The sequential selection of elementary forms based on dynamic thresholds of: 1) the inner variance of the respective land-surface variable (LSV); 2) the difference between the mean LSV value of the target segment and the mean LSV values of its neighbor segments; and 3) the shape indices of segments. The results were compared with an existing manually-drawn geomorphological map to evaluate the potential of the algorithm of producing morphologically meaningful land-surface divisions. The evaluation showed that the most segments are either directly comparable with manual delineations, or have a clear morphological meaning. We conclude that algorithmic delineation of elementary forms from real DEMs is feasible; more work is needed, however, to design a fully operational process. |
| [13] | . <p>坡位的空间变化通常是渐变的,定量的坡位空间渐变信息对于精细尺度上的坡面土壤侵蚀、预测性土壤制图等应用具有重要意义。现有基于栅格DEM的坡位模糊识别方法,或是仅在属性域内模糊聚类,忽略了空间信息;或是需要繁琐的规则进行模糊分类,实用性受限。本文建立了一种基于相似度的模糊推理方法,根据各类坡位在空间上的典型位置,计算其他位置与典型位置间的相似度,从而对坡位空间渐变信息进行系统、定量的描述。应用表明本方法能够合理地描述山脊、坡肩、背坡、坡脚、沟谷等重要坡位类型的渐变信息,所获得的坡位渐变信息也能够合理地解释土壤样点的A层土壤含砂量随坡位渐变的变化趋势。</p> . <p>坡位的空间变化通常是渐变的,定量的坡位空间渐变信息对于精细尺度上的坡面土壤侵蚀、预测性土壤制图等应用具有重要意义。现有基于栅格DEM的坡位模糊识别方法,或是仅在属性域内模糊聚类,忽略了空间信息;或是需要繁琐的规则进行模糊分类,实用性受限。本文建立了一种基于相似度的模糊推理方法,根据各类坡位在空间上的典型位置,计算其他位置与典型位置间的相似度,从而对坡位空间渐变信息进行系统、定量的描述。应用表明本方法能够合理地描述山脊、坡肩、背坡、坡脚、沟谷等重要坡位类型的渐变信息,所获得的坡位渐变信息也能够合理地解释土壤样点的A层土壤含砂量随坡位渐变的变化趋势。</p> |
| [14] | . The main purpose of the study is to compare the results of automatic classification of landforms performed as unsupervised classification and manual (expert) morphographic landform classification derived from field mapping and recognition of long-term trends in landform evolution. Two test areas in the Sudetes Mountains (SW Poland) were selected, each representing a different type of relief. The Jelenia Gora Basin is an example of denudational hilly granite topography, with inselbergs, other residual hills, and basins, whereas the northern part of the Bystrzyckie Mountains is a faulted plateau underlain by sedimentary and metamorphic rocks. The setup of the classification involved a DEM derived from digitalization of 1:25,000 maps, a filter mask of 20 x 20 pixels (500 x 500 m), k-median cluster analysis, and consideration of four dimensions (relative height, slope, combined curvature, and aspect). We used a statistical criterion to decide the level of classification, i.e. the number of homogeneous groups returned. Output maps show the results of classification into five (Jelenia Gora Basin) or six groups (Bystrzyckie Mountains), later confronted with nine-group classification. In both areas automatic classification for k = 5 divided by 6 performed well and the principal features of relief are well captured, despite very different landform patterns and long-term geomorphic histories. Slope and curvature are the main variables to differentiate individual terrain units (landforms), with an additional role of aspect in the faulted and tilted plateau. For k > 6 aspect becomes the main variable in the hilly relief and the pattern of terrain units becomes more fragmented, adversely impacting on the clarity of interpretation, while surfaces in the faulted plateau setting are further subdivided according to slope and curvature. The match between 'expert' maps and the results of automatic classification varies, depending on the landforms considered. While certain landforms are clearly associated with one particular group yielded by automatic classification, others fall into a number of groups and do not have distinctive signatures, despite different origins. (C) 2013 Elsevier B.V. All rights reserved. |
| [15] | . The wealth of types of elementary forms and their boundaries is potentially unbounded and thus is sufficient to cover the real variety of landforms. Elementary forms in the basic set proposed here have clear potential for genetic and dynamic interpretation. A brief worked example documents the possibility of analytical computation of various models of ideal elementary forms for particular segments of landform. Ideal elementary forms can be considered as attractors, to which the affinity of surface segments can be measured by multivariate statistical methods. The use of the concept of elementary forms in landscape segmentation is promising and it could be adapted for elementary segmentation of various other spatial fields. |
| [16] | . Numerous investigators have examined ways in which digital elevation data can be used to define landform-based units that act as basic spatial and structural entities for soil, terrain or ecological maps. No proposed system of automated terrain or ecological mapping has, to our knowledge, advanced beyond research investigation to achieve routine operational use. This paper describes a conceptual design for creating landform-based spatial entities from digital elevation data to support multi-level, hierarchical integrated natural resource inventory. The spatial entities defined by our procedures embrace both geomorphic and hydrological considerations. They are intended to provide a framework for mapping more specific ecological entities of interest. |
| [17] | . . |
| [18] | . |
| [19] | . A robust new approach for describing and segmenting landforms which is directly applicable to precision farming has been developed in Alberta. The model uses derivatives computed from DEMs and a fuzzy rule base to identify up to 15 morphologically defined landform facets. The procedure adds several measures of relative landform position to the previous classification of Pennock et al. (Geoderma 40 (1987) 297–315; 64 (1994) 1–19). The original 15 facets can be grouped to reflect differences in complexity of the area or scale of application. Research testing suggests that a consolidation from 15 to 3 or 4 units provides practical, relevant separations at a farm field scale. These units are related to movement and accumulation of water in the landscape and are significantly different in terms of soil characteristics and crop yields. The units provide a base for benchmark soil testing, for applying biological models and for developing agronomic prescriptions and management options. |
| [20] | . |
| [21] | . We introduce a novel method for classification and mapping of landform elements from a DEM based on the principle of pattern recognition rather than differential geometry. At the core of the method is the concept of geomorphon (geomorphologic phonotypes) - a simple ternary pattern that serves as an archetype of a particular terrain morphology. A finite number of 498 geomorphons constitute a comprehensive and exhaustive set of all possible morphological terrain types including standard elements of landscape, as well as unfamiliar forms rarely found in natural terrestrial surfaces. A single scan of a DEM assigns an appropriate geomorphon to every cell in the raster using a procedure that self-adapts to identify the most suitable spatial scale at each location. As a result the method classifies landform elements at a range of different spatial scales with unprecedented computational efficiency. A general purpose geomorphometric map - an interpreted map of topography - is obtained by generalizing allgeomorphons to a small number of the most common landform elements. Due to the robustness and high computational efficiency of the method high resolution geomorphometric maps having continental and even global extents can be generated from giga-cell DEMs. Such maps are a valuable new resource for both manual and automated geomorphometric analyses. In order to demonstrate a practical application of this new method, a 30 m cell(-1) geomorphometric map of the entire country of Poland is generated and the features and potential usage of this map are briefly discussed. The computer implementation of the method is outlined. The code is available in the public domain. (C) 2012 Elsevier B.V. All rights reserved. |
| [22] | . 栅格数字高程模型(DEM)固有的尺度特征给以栅格DEM为基本输入的数字地形分析带来各种尺度问题。对栅格数字地形分析中涉及的尺度进行梳理,以分辨率和分析窗口为重点,对栅格数字地形分析中的多尺度表达、尺度效应、适宜尺度选择、尺度转换等尺度问题及其相互关系进行阐述;分别介绍各类尺度问题的现有定量研究方法,尤其对尺度效应定量刻画和适宜尺度选择方法,根据不同方法计算定量指标所利用的信息类别进行分类归纳;最后讨论了其中有待进一步开展研究的几方面工作。 . 栅格数字高程模型(DEM)固有的尺度特征给以栅格DEM为基本输入的数字地形分析带来各种尺度问题。对栅格数字地形分析中涉及的尺度进行梳理,以分辨率和分析窗口为重点,对栅格数字地形分析中的多尺度表达、尺度效应、适宜尺度选择、尺度转换等尺度问题及其相互关系进行阐述;分别介绍各类尺度问题的现有定量研究方法,尤其对尺度效应定量刻画和适宜尺度选择方法,根据不同方法计算定量指标所利用的信息类别进行分类归纳;最后讨论了其中有待进一步开展研究的几方面工作。 |
| [23] | . |
| [24] | . |
| [25] | . Mountain peaks are mapped as multi‐scale entities with modifiable boundaries and variable contents. Four semantic meanings are imported and quantified to first characterize peaks at a range of spatial scales and then evaluate the multi‐criteria ‘peakness’ at each scale. Peakness is defined as the prototypicality of identified summits and as the similarity of each point (cell) to summits. The procedure then summarizes the individual‐scale peakness across considered spatial scales into a univariate membership surface. This allows mapping of vague peak entities as non‐homogeneous peak regions whose boundaries depend on user‐specified peakness thresholds. This procedure was applied in a case study to tackle several challenges in landform delineation, including boundary, spatial continuity, spatial scale, topographic context, and multi‐criteria definition. |
| [26] | . |
| [27] | . Spatial transitions between slope positions (landform positions) are often gradual. Various methods have been developed to quantify the transitions using fuzzy slope positions. However, few studies have used the quantitative information on fuzzy slope positions in digital soil mapping or other terrain-related geographic modeling. This paper examines the use of such information for mapping soil organic matter content (SOM) within a purposive (or directed) sampling framework for predictive soil mapping. First, a five slope position system (i.e., ridge, shoulder slope, back slope, foot slope, channel) was adopted and the fuzzy slope positions were derived through an approach based on typical slope position locations. The typical slope position locations were extracted using a set of rules based on terrain attributes and domain knowledge. Secondly, the fuzzy slope positions were used to direct purposive sampling, which determined the typical SOM value for each slope position type. Typical SOM values were then combined with fuzzy slope position data to map the spatial variation of SOM using a weighted-average model - the fuzzy slope position weighted (FSPW) model - to predict the spatial distribution of SOM for two soil layers at depths of 10-15 cm and 35-40 cm in a low-relief watershed in north-eastern China. The study area comprised two portions: an area of about 4 km(2) used for model development, and an area of about 60 km2 for model extrapolation and validation. Evaluation results show that our FSPW model produces a better prediction of the SOM than that provided by a multiple linear regression (MLR) model. Quantitative measures in the model-development area, including correlation coefficient, mean absolute error, and root mean square of error, show that the performance of the FSPW model with five modeling points from purposive sampling compares favorably with MLR results for 48 modeling points. Evidence from the quantitative assessment based on a validation set of 102 sample points in the model-extrapolation area shows that the FSPW model performs better than the MLR model, which suggests that information on fuzzy slope position was useful in aiding digital soil mapping over the area. (C) 2011 Elsevier B.V. All rights reserved. |
| [28] | . <p>我国传统地貌基本形态类型分类强调地貌单元的完整性,界线划分沿地貌实体边界而非规则统计单元,目前尚缺乏地貌实体单元的有效自动提取方法。针对这一难点,本文提出一种基于DEM的地貌实体单元数字提取方法。利用坡度分级,并搜索相邻栅格单元、计算坡度级别内相互连通栅格的面积,建立坡度、面积阈值综合判别规则进行山地平原的自动划分;利用地形倒置、水文淹没分析,将山体划分的二维判别规则扩展到实际三维地形中,并结合地形结构线提取算法进行山体界线自动提取、确定山地地貌实体单元。结果表明,该方法符合我国传统地貌分类体系,能够较好实现山地/平原的自动划分和山体界线的数字提取。</p> . <p>我国传统地貌基本形态类型分类强调地貌单元的完整性,界线划分沿地貌实体边界而非规则统计单元,目前尚缺乏地貌实体单元的有效自动提取方法。针对这一难点,本文提出一种基于DEM的地貌实体单元数字提取方法。利用坡度分级,并搜索相邻栅格单元、计算坡度级别内相互连通栅格的面积,建立坡度、面积阈值综合判别规则进行山地平原的自动划分;利用地形倒置、水文淹没分析,将山体划分的二维判别规则扩展到实际三维地形中,并结合地形结构线提取算法进行山体界线自动提取、确定山地地貌实体单元。结果表明,该方法符合我国传统地貌分类体系,能够较好实现山地/平原的自动划分和山体界线的数字提取。</p> |
