 , �Ű�ƽ
Comparative analysis on the leisure values of urban ecological recreation spaces: A case study of Changshu city
SUNKun, ZHANGAipingͨѶ����:
�ո�����:2015-07-8
������:2015-11-16
�����������:2016-02-20
��Ȩ����:2016�������о����༭���������о����༭��
��������:
�����:
-->
չ��
ժҪ
�ؼ��ʣ�
Abstract
Keywords��
-->0
PDF (5110KB)Ԫ������ά��������������ղ�����
�������ø�ʽ����EndNoteRisBibtex�ղر���-->
1 ����
���ҵ����ͳ���ս��Ҫ������Ϊ������2013��ĩ,�й�����ס�˿ڴ�7.31��,���о���ӵ�е���Ȼ��̬�ռ����[1],��������Ȼ��ǿ����������[2],���������̬�����ռ���������������������������о�������Ҫ����[3,4]��������̬�����ռ��dz��пռ�ṹ����Ҫ��ɲ���[5],Ϊ����������̬��������,�ڹ滮���������̬�����ռ�ʱӦ���������ֺ�����������������ֵ;��������̬�����ռ����й滮����Ƽ�����ˮƽ���д�����[6]���Գ�����̬�����ռ����м�ֵ�������о���Ϊ�����м�ֵ�����ṩ����,�ɶ���ع滮����Ƽ����������ṩ��Ҫ��Ϣ[7]��ҵ��****����̬�ռ����м�ֵ�����˹㷺���о�[8-10],Ϊ������̬�����ռ����м�ֵ�����ṩ�˻���˼·�ͷ���������о��Դ�ȫ����̬ϵͳ,С�������ֵء��ݵء�ˮ��ȵ����м�ֵ����������ط���[11-17],������ע����̬�ռ����м�ֵ�Ķ�̬�о�[18-20],��ר����Գ�����̬�����ռ����м�ֵ���о��ɹ��Խ��١���̬�ռ����м�ֵ���۵ij��÷��������з��÷���������ֵ�������������������뷨������ģ�ͷ���ѡ��ʵ�鷨��[21-29],���ַ���������ȱ��[15]������о���ʾ,������̬�����ռ�����м�ֵ���������ĿɽӴ��Լ������˿��ܶȵ����������,������������ѧ��ֵ����һ��[30,31],��˵�����ӳ�����̬�����ռ������������м�ֵ�������۲����ܷ�ӳʵ�����,�������������г��Ƕȶ������м�ֵ�����������Ϊ���������,���Ĵ��г����������������Ҫ����,����������������Ϊ[32]������ƫ��[33]�ȶԳ�����̬�����ռ�����м�ֵ���з����жϡ���������о�,��̬�����ռ���Ҫ��ũ��ֵء��ݵء�ɽ����ˮ��ѩ�ء�ɳĮ��[34],���ڳ���,�ֵء��ݵء�ˮ�����������̬�����ռ����͡��Գ��и�����̬�����ռ�����м�ֵ���ж�̬���Ƚ��о�,�ɶԳ�����̬���������и�����̬�ռ����Ч�����ṩһ������,��߳�����̬����������Ч�档����ѡ�����е��ض�����,�Գ����ֵء��ݵء�ˮ���⼸����Ҫ��̬�����ռ�����м�ֵ���ж�̬�Ա��о�,����Ϊ������̬�����ռ�滮�����輰�����ṩ���۽����
2 �о����ſ����о�����
2.1 �о����ſ�
�о���λ�ڳ�����,����λ�ڽ���ʡ���ϲ�,���й��������г����ۺϱ��Ե���,�ش���γ�����ȴ�����������,�ļ�����,�������15.4 �档�ֵء��ݵء�ˮ��Ϊ�����������Ҫ��̬�����ռ䡣�ڳ�����ȫ��������������������������ѡ��������������ܵ��ֵء��ݵء�ˮ����Ϊ�о�����,��λ�ü��ֲ���ͼ1��ʾ���о���ȫ������ӵ�������Ϊ3~4��,�ļ���������������,���������ʱ�β�ͬ�������ռ�ֵƽ�����������0 ������,���缰��ǰ��Ϊ�������ʱ��;�ļ���ƽ���������Ϊ34 ������,Լһ��ʱ����ƽ��������30 ������,��������ǰ��Ϊ�������ʱ��;���^�ڴ�ʱ�������Լ����10 ��~25 ��֮��,���缰������м�ʱ�ν������������о������Ϊ���п�������̬�����ռ�,��ȫ����о�������������,�������������������ܷ�ӳ����ͬ�������ֵء��ݵء�ˮ��ȫ�꼰ÿ�첻ͬʱ������м�ֵ�仯���,�Լ�ȫ�������̬�����ռ����м�ֵ�IJ��졣 ��ʾԭͼ|����ԭͼZIP|����PPT
ͼ1�о��ص�λ�ü��ſ�
-->Fig. 1The location and overview of the study area
-->
2.2 �����
2.2.1 �۲��ȵ���ѡ�� ���о������ֵء��ݵء�ˮ����������̬�����ռ��и�ѡ��һ���ε���Ϊ�Ա��Թ۲������̬�����ռ����м�ֵ���ȵ���Ϊ��ʹ�۲�����ݿɱ�,������������ѡ��3���۲��ȵ����� 3���ȵ��Ŀ��ȼ����ȷֱ���ͬ,��2 m,��80 m;�� 3�������ȵ����߾�����������;�� 3���ȵ���רΪ�οͷֱ����ֵء��ݵء�ˮ������������������,����ͨ�����ε�;�� 3���ȵ��Ŀɽ�����������;�� �ֵء��ݵء�ˮ��ֱ�Ϊ3���ȵ���Ψһ������������;�� 3���ȵ����ڵ��ֵء��ݵء�ˮ������ӽ���2.2.2 ����ָ��ѡȡ������ ���Ч��������Ϊ�����ѡ���ܹ��ṩ���Ч�õ��ж��� ��[35],��������Ը�����̬�����ռ�����ij��������Ϊѡ��ʱ,Ҳ��Ӷ���Ӧ��̬�����ռ�����м�ֵ������Ȩ��[36]�����ڴ��γɵ�ѡ��ʵ�鷨�ѳ�Ϊ������г���ֵ��������Ҫ����֮һ[37];����,����о���Ϊʵ���Ǽ�ֵ�ͼ�ֵ��ϵ��ʵ��ȷ����[38]����˻���������������Ϊѡ��ʵ������̬�����ռ�����м�ֵ����������һ�ֽ�Ϊ���еķ�����ͨ��ʵ�ʹ۲����,��Գ����ض���̬�����ռ�,DZ�����������ߵ�ѡ����Ϊ��Ҫ���������·��棺�� �Ƿ�ѡ������ض���̬�ռ������������?�� ���ض���̬�ռ���ѡ�����������ʱ��?�� �Ƿ������Ⱥ��������ѡ���ڸ���̬�ռ��н�����������?����ͬ��Դ�г�������,��Բ�ͬ��̬�����ռ�,ͨ����ȡ��������Ķ����شȽ�,�ɶԸ���̬�����ռ�����м�ֵ���жԱȡ����ڴ�,���IJ��á���������ȡ���������ճ�ԡ�������Դ��Ӧ�ȡ�������ָ�����������������ض���̬�ռ��������Ϊѡ�����������ͼ2���������������ÿ���ε��ϵ�λʱ����ѡ����������������ƽ������Ϊ���ݽ�������,����ճ���Ը����ε������������ߵ�ƽ������ʱ��Ϊ���ݽ�������,��Դ��Ӧ����DZ�ڿ�Դ�г��и���ԴȺ��������ѡ�����ض���̬�ռ��н������������ij̶�Ϊ���ݽ�������������ָ�����������ֱ��á����������ָ������������ճ��ָ����������Դ��Ӧ��ָ������ʾ��
 ��ʾԭͼ|����ԭͼZIP|����PPT
ͼ2������̬�����ռ����м�ֵ����ָ��ѡ��
-->Fig. 2Selection of indexes for evaluating the leisure value of urban ecological recreation space
-->
��1�����������ָ������ӳ�ο����ڽ�����̬�����ռ�������������ij̶�,����㹫ʽΪ��

ʽ�У�WhΪ�ض��۲��յ�h���۲�ʱ�������������߶��ض���̬�����ռ����ȵ������������ָ��;QtΪ�ù۲�ʱ���ڵ�t�Σ�ÿ�ι۲���������ʱ����ͬ�����ض���̬�ռ����ȵ������۲����������������;AkΪ�ֵء��ݵء�ˮ��������̬�ռ��е�k����̬�ռ����ȵ���ȫ��������۲������������������ƽ��ֵ��
��2������ճ��ָ������ӳ��̬�����ռ������ο�פ�����е�����,����㹫ʽΪ��

ʽ�У�RhΪ�ض��۲��յ�h���۲�ʱ�����ض���̬�����ռ����ȵ�������ճ��ָ��;CiΪ�ù۲�ʱ���ڴ�����������״̬�ĵ�iλ�ο����ض���̬�ռ����ȵ��ϵ�����ʱ��;PjΪ��j����������ķ���������״̬����ͨ���ض���̬�ռ����ȵ����õ�ʱ�䡣
��3����Դ��Ӧ��ָ������ӳ��̬�����ռ���ض���Դ�ظ���ϸ����Ⱥ��������ѡ��ƫ�õ��ۺ�ƥ��̶ȡ�����ͨ�������ض���̬�ռ�Կ�Դ�����ꡢ���ꡢ���ꡢ�ٶ�������Ⱥ��������ѡ��ƫ�õ��ۺ�ƥ��̶����ж���Ӧ��̬�ռ�Ŀ�Դ��Ӧ��ָ��,����㹫ʽΪ��

ʽ�У�ShΪ�ض��۲��յ�h���۲�ʱ���ض���̬�ռ����ȵ�����ڿ�Դ�ظ�����Ⱥ�Ŀ�Դ��Ӧ��ָ��;BfΪ�ù۲�ʱ���ض���̬�ռ����ȵ���������ꡢ���ꡢ���ꡢ�ٶ��������ο��е�f���ο͵Ŀ�Դ��Ӧ��ָ��;NfΪ�ù۲�ʱ�εĵ�λʱ�����ض���̬�ռ��ȵ��ϵ�f���ο͵�ƽ������;DΪ�ù۲�ʱ�ε�ƽ����λʱ�����ض���̬�ռ��ȵ��ϵ��ο�������;MfΪ��Դ�ص�f��������˿�����;EΪ��Դ���˿�������
2.2.3 ����ָ��ֵ�����ȡ ��1������ָ��ֵ�Ķ�̬�۲⡣��̬�����ռ�����м�ֵ�������¡����յ������ı仯���仯��Ϊȫ�����۸�����̬�����ռ�����м�ֵ,���Ķ����м�ֵ�ĸ�������ָ�������ȫ��ȶ�̬�۲⡣��2013��1-12��,ÿ�ֱܷ�ѡ����������˳��ε�ʱ��,����ѡ�����ֵء��ݵء�ˮ��Ĺ۲��ȵ��϶Ը���ָ��ֵ���й۲⡣ÿ���۲��շ�7:00-9:00��10:00-12:00��13:00-15:00��16:00-18:00��19:00-21:00 5���۲�ʱ�Ρ�ȫ�깲�ƹ۲�104��,�۲��������±仯����Ϊ-3 ��~39 ��,���ٱ仯����Ϊ0~6��;��������仯���Ϊ������37�졢����22�졢������45��;�۲�������33��Ϊ��ĩ����ȫ��Ĺ۲������,����ռ49.34%,Ů��ռ50.66%;�ϡ��С��ࡢ���˿�ռ�ȷֱ�Ϊ28.66%��35.99%��19.12%��16.23%,�볣�����˿�����ṹ��һ�������ԡ�
��2�����������ָ�����㡣��һ,��ÿ���۲��յ�ÿ���۲�ʱ��,��6�ν��м���Թ۲�ͳ��,ÿ����10 minΪһ��ʱ�䵥λ,�ֱ�ͳ�Ƶ�λʱ�����ֵء��ݵء�ˮ�����۲��ȵ��ϵ������������������ڶ�,����ʽ��1������ÿ���۲��ո��۲�ʱ�����ض���̬�����ռ�����������ָ����Ȼ��ͬʱ��߶���ƽ��,�ֱ�õ��ض���̬�ռ���ÿ�¡�ȫ���h��ʱ�ε����������ָ��,�Լ�����ա����¡�ȫ������������ָ����
��3������ճ��ָ�����㡣��һ,���о���������֯24��ʵ���ߣ����ꡢ���ꡢ���ꡢ�ٶ���6�����ֱ������������ٶ�ͨ���ֵء��ݵء�ˮ�����Ĺ۲��ȵ�,����24��ʵ���߷ֱ�ͨ���ֵء��ݵء�ˮ�����Ĺ۲��ȵ���ƽ��ʱ�䡣�ڶ�,����ѡ�����ֵء��ݵء�ˮ�����Ĺ۲��ȵ���,�ڹ۲��շ�ʱ�γ����۲ⵥ����������������Ӧ�۲��ȵ��ϵ�����ʱ�䡣�ܿ������仯Ӱ�켰������������,�����۲��ȵ���ȫ����۲�ʱ���ڹ۲�����������Ϊ13��,���Ϊ90��,ƽ��Ϊ36�ˡ�����,����ʽ��2������ÿ���۲��ո��۲�ʱ�����ض���̬�����ռ������ճ��ָ����Ȼ��ͬʱ��߶���ƽ��,�ֱ�õ��ض���̬�ռ���ÿ�¡�ȫ���h��ʱ�ε�����ճ��ָ��,�Լ�����ա����¡�ȫ�������ճ��ָ����
��4����Դ��Ӧ��ָ�����㡣��һ,���ݹ���ͳ�ƾ��˿�ͳ�ƿھ�,��������������Ϊ���꣨60�꼰���ϣ�,���꣨35~59�꣩,���꣨15~34�꣩���ٶ���14�꼰���£����ڵ�����,����������������Ե��ο�,ͨ���۲취��ȡ���������Ϣ;������������������Եĵ������,�����乴ѡ��������е������ѡ��ڶ�,��ÿ���۲��յ�ÿ���۲�ʱ��,�ֱ�����ֵء��ݵء�ˮ�����Ĺ۲��ȵ�,��6�ν��м���Թ۲�ͳ��,ÿ����10 minΪһ��ʱ�䵥λ,�����ض��ȵ��ϵ�λʱ���ڸ��������������������������������������;�����Ӧ��6�ι۲�����ƽ��,�õ��ض�ʱ�����ض���̬�ռ�۲��ȵ��ϵ�λʱ���ڸ�������ο�������ƽ��ֵ���ο���������ƽ��ֵ������,���ݡ�������2012���˿ںͼƻ�������ҵ��չ���桷���������[39]����,2013���,���������˿�Ϊ106.78��,�������ꡢ���ꡢ���꼰�ٶ�ռ���˿ڱ����ֱ�Ϊ25.18%��44.90%��20.07%��9.85%������,����ʽ��3�����������̬�����ռ����ε����ض��۲�ʱ���ڶԸ��������Ⱥ����ȫ����Ⱥ�Ŀ�Դ��Ӧ��ָ��,Ȼ�������Ҫ��ƽ��,�õ��ض���̬�ռ�ÿ�¡�ȫ���h��ʱ��,�Լ����ա����¡�ȫ����ض��������Ⱥ����ȫ����ԴȺ�����Ӧ��ָ����
2.2.4 �������̬�����ռ��ض�ָ��ֵ�IJ��������� ����SPSS�������ֵء��ݵء�ˮ��֮���ض�ָ����ƽ��ֵ�IJ��������Խ��м��顣����1��ʾ,����̬�����ռ�֮����۲����ض�ָ��ֵ�IJ���������ֵ��Ϊ0.000��<0.05��,��ӳ���ֵء��ݵء�ˮ������������֮�䡢����ճ��֮�䡢��Դ��Ӧ��֮�����ʮ�������IJ���,�����ɸ���̬�����ռ����м�ֵ�����Բ��
Tab. 1
��1
��1����̬�����ռ�֮���ض�ָ��ֵ�IJ���������ֵ(Sig.)
Tab. 1The significance level of value difference between different recreational eco-spaces' indexes (Sig.)
| ָ�� | ���������ָ�� | ����ճ��ָ�� | ��Դ��Ӧ��ָ�� | |||
|---|---|---|---|---|---|---|
| �ռ����� | �ݵ� | ˮ�� | �ݵ� | ˮ�� | �ݵ� | ˮ�� |
| �ֵ� | 0.000 | 0.000 | 0.000 | 0.000 | 0.000 | 0.000 |
| �ݵ� | 0.000 | 0.000 | 0.000 | |||
�´��ڴ�
2.2.5 ��̬�����ռ����м�ֵ���� ������̬�����ռ����������ȡ�����ճ�ԡ���Դ��Ӧ��֮���н�ǿ������,����ָ������м�ֵ��Ӱ��Ȩ�غ���ȷ��,ͬʱΪ�˱��ڶԱȷ���,��Ҫ�ϳɲ��������Ե����м�ֵָ��ֵ,��˱��IJ��ó˷��ϳɷ�[40],�ֱ����ʽ��4��~ʽ��6�����������̬�����ռ���ÿ���۲��ա�ÿ�¡�ȫ���h��ʱ�ε����м�ֵָ����


ʽ�У�Vhx��Whx��Rhx��Shx�ֱ�Ϊ�ض���̬�ռ��ڵ�x���۲��յ�h���۲�ʱ�ε����м�ֵ����������ȡ�����ճ�ԡ���Դ��Ӧ�ȵ�ָ��;Vhy��Why��Rhy��Shy�ֱ�Ϊ�ض���̬�ռ��ڵ�y���µ�h���۲�ʱ�ε����м�ֵ����������ȡ�����ճ�ԡ���Դ��Ӧ�ȵ�ָ��;vh��wh��rh��sh�ֱ�Ϊ�ض���̬�ռ�ȫ���h���۲�ʱ�ε����м�ֵ����������ȡ�����ճ�ԡ���Դ��Ӧ�ȵ�ָ����
�ֱ����ʽ��7��~ʽ��9�����������̬�ռ�ÿ�ա�ÿ�¡�ȫ������м�ֵָ����


ʽ�У�Vx��Wx��Rx��Sx�ֱ�Ϊ�ض���̬�ռ��ڵ�x���۲��յ����м�ֵ����������ȡ�����ճ�ԡ���Դ��Ӧ�ȵ�ָ��;Vy��Wy��Ry��Sy�ֱ�Ϊ�ض���̬�ռ��ڵ�y���µ����м�ֵ����������ȡ�����ճ�ԡ���Դ��Ӧ�ȵ�ָ��;v��w��r��s�ֱ�Ϊ�ض���̬�ռ���ȫ������м�ֵ����������ȡ�����ճ�ԡ���Դ��Ӧ�ȵ�ָ����
3 �������
3.1 ����̬�����ռ����м�ֵʱ��ֲ��Ƚ�
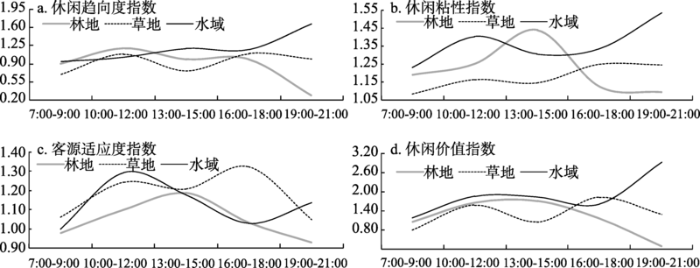
3.1.1 ����̬�����ռ����м�ֵʱ��ֲ� ��1����2��ͼ3~ͼ6��ʾ��ȫ�����̬�����ռ����м�ֵ�������ָ��ֵ�ϸߵ�ʱ��ηֲ����ڲ���,�ҳ��ּ��зֲ�����;����̬�ռ����Ӧָ��ֵ�ڸ��¡���ʱ�εķֲ�������ͬ����ʹȫ�������̬�����ռ�����м�ֵ��ʱ��ֲ��������һ���̶ȵĻ����ԡ� ��ʾԭͼ|����ԭͼZIP|����PPT
ͼ3����̬�����ռ����������ָ����ʱ�ε���������
-->Fig. 3Results of analysis on the leisure tendency index to each ecological recreation space in different periods
-->
 ��ʾԭͼ|����ԭͼZIP|����PPT
ͼ4����̬�����ռ�����ճ��ָ����ʱ�ε���������
-->Fig. 4Results of analysis on the leisure viscidity index of each ecological recreation space in different periods
-->
 ��ʾԭͼ|����ԭͼZIP|����PPT
ͼ5����̬�����ռ��Դ��Ӧ��ָ����ʱ�ε���������
-->Fig. 5Results of analysis on the adaptation index of each eco-space to recreationist in different periods
-->
 ��ʾԭͼ|����ԭͼZIP|����PPT
ͼ6����̬�����ռ����м�ֵָ����ʱ�ε���������
-->Fig. 6Results of analysis on the leisure value index of each ecological recreation space in different periods
-->
Tab. 2
��2
��2����̬�����ռ����м�ֵ�ϸ�ʱ���ڲ�ͬ�·ݵķֲ����
Tab. 2The periods' distribution in different months when the leisure value of certain ecological recreation space is higher
| ��̬�ռ����� | 7:00-9:00 | 10:00-12:00 | 13:00-15:00 | 16:00-18:00 | 19:00-21:00 |
|---|---|---|---|---|---|
| �ֵ� | �� | 1-12�� | 1-9�¡�11-12�� | 5-9�� | �� |
| �ݵ� | �� | 1-5�¡�10-12�� | 1-3�¡�11-12�� | 3-10�� | 6-9�� |
| ˮ�� | 3�¡�11�� | 1-5�¡�10-12�� | 1-5�¡�10-12�� | 4-9�� | 4-10�� |
�´��ڴ�
��2����3��ʾ����������̬�ռ���,ȫ���ֵظ���ָ��ֵ��ͻ����ʱ��ƽ�����,��ӳ���ֵ����м�ֵ��ʱ������Խ�����;ˮ�����м�ֵ��ʱ���������С,�ݵ������м�ˮƽ������ȫ�������̬�����ռ����м�ֵ��ͬ����Ҫԭ��֮һ��ȫ��ݵ������������������̬�ռ�����ͻ����ʱ����٣�ͼ3��,�Ҳݵ�����ճ�ԡ��ֵؿ�Դ��Ӧ�ȵ�ʱ������Էdz����ԣ�ͼ4��ͼ5��,�Ƕ������м�ֵ����Ҫ�������ء�
Tab. 3
��3
��3ȫ�������̬�����ռ����ָ��ֵ���ڽϸ����ˮƽʱ��ı�����%��
Tab. 3The percentage of the time when certain index's value of certain ecological recreation space is at a higher or highest level throughout the year (%)
| ָ������ | �ֵ� | �ݵ� | ˮ�� | |||||
|---|---|---|---|---|---|---|---|---|
| �ϸ� | ��� | �ϸ� | ��� | �ϸ� | ��� | |||
| ���������ָ�� | 38.33 | 26.67 | 43.33 | 13.33 | 55.00 | 60.00 | ||
| ����ճ��ָ�� | 38.33 | 30.00 | 21.67 | 3.33 | 65.00 | 66.67 | ||
| ��Դ��Ӧ��ָ�� | 26.67 | 0 | 66.67 | 48.33 | 50.00 | 51.67 | ||
| ���м�ֵָ�� | 46.67 | 23.33 | 41.67 | 11.67 | 51.67 | 65.00 | ||
| ƽ�� | 37.50 | 20.00 | 43.34 | 19.17 | 55.42 | 60.84 | ||
�´��ڴ�
��3��ƽ��ÿ�����̬�ռ�ĸ���ָ��ֵ�����ⲿ����Ӱ������ڱ仯֮��,ÿ�������̬�ռ����м�ֵ��ʱ�ηֲ�����ͬ������������,������ֵ���ֵ�ʱ�������ͬ��ͼ7��,ʹ������̬�ռ����м�ֵ��ÿ�����ʱ��ͬ������һ���̶ȵĻ����ԡ�
 ��ʾԭͼ|����ԭͼZIP|����PPT
ͼ7����̬�����ռ����ָ���ڸ��۲����ڱ仯��ȫ��ƽ��״��
-->Fig. 7Annual average change of each index value of each ecological recreation space within each observational day
-->
3.1.2 ��ͬʱ�����̬�����ռ����м�ֵӰ�����رȽ� ȫ�겻ͬʱ������¡����ա����۵Ȼ���������ͬ,���о�����̬�����ռ��������������������ͬӰ�졣�� ȫ�꼰�����ⲿ�����仯�Ľ���ʹ����̬�����ռ����м�ֵ�ϸߵ�ʱ�γ���һ���ļ����ԣ���2����������ȫ�겻ͬʱ������±仯,�о�����̬�����ռ�����������ʱ�䳤�ȡ����������Ȼᷢ���仯;���۲������£���ֵƽ�����£��뻧������������֮�����������Խ�Ϊ���ԣ�ͼ8��,��ȫ���ֵء�ˮ�����м�ֵ�仯���������±仯������һ��������,��ӳ������������,�о����ֵء�ˮ����������������ʱ�����,�������á������;�������±仯�Բݵ����м�ֵ��Ӱ���С���� �ֵص�����������ý�����,���¶Ƚϸߡ����ս�ǿ��ʱ��,�ֵص����������ڵ�����ʹ���γ���һ�����������Ƚ����Ƶ�С����,��ǿ����ճ�ԣ�ͼ4��;��ȫ��ֹ۲��յ�10:00-15:00,�ֵص����¡����ա�ʪ�ȵ�����ͬ�ⲿ����ϴ�,��ʱ���ֵ����ָ�����ƽ��ֵҲ������仯�켣�����ˮƽ����4��;��7:00-9:00��16:00-18:00,�ֵص����бȽ����Ʊ�С;��19:00-21:00,����ҹɫ���ֵ�����Ұ����ռ�����,�ֵ��Ѳ��������бȽ����ƣ�ͼ7������ �ݵ�ȱ��������,�����������������ⲿ�߶�һ��;�Ա�ͼ3~ͼ6,���ֲݵظ����ָ�������ֵҲ��Ҫ�����ڴֹ۲����о����������¡����յ��������������е�ʱ�䣺16:00-18:00,�����10:00-12:00;��19:00-21:00��13:00-15:00��7:00-9:00,�������¡����յ���������ƽ���������������ν���,�ݵص����м�ֵҲ��֮��С����4������ ˮ����һ��������С����Ӫ������,�������ֵء�ȫ����������º���������������ˮ���ڸ�ʱ�ε����������ԣ�ͼ6b��ͼ6c������ȫ������۲��յ�19:00-21:00,ˮ������¡�ʪ�ȡ����ٵ�����ʹ���ʱ�ε���������ȡ�����ճ�Դ����������ͼ3e��ͼ4e��,ʹ��ʱ��ˮ�����м�ֵ����ƽ��ֵ�dz�������ͼ6e��;�����½ϵͼ������еĹ۲����е�10:00-15:00,ˮ������¡����ա����ۡ���Ұ������ʹ���Ծ���һ�����������Ƚ����ƣ�ͼ6b��ͼ6c��,�����½ϵ͵Ĺ۲����е�7:00-9:00��16:00-18:00,ˮ�������������������ѱ�ú�С��ͼ5a��ͼ5d��,������ȫ��ˮ������Ӧʱ�ε����м�ֵ����4����
 ��ʾԭͼ|����ԭͼZIP|����PPT
ͼ8ȫ���о���������м�ֵָ���������������仯
-->Fig. 8Changes of the leisure value indexes and the recreationists�� number of research objects throughout the year
-->
Tab. 4
��4
��4����ȫ��ƽ��ÿ�첻ͬʱ�θ���̬�����ռ��ָ��ֵ�ɸߵ��Ͷ�ʱ�ν�������
Tab. 4Periods sequencing according to each index's annual average value (from high to low) of each ecological recreation space in different periods
| ���� | �ֵ� | �ݵ� | ˮ�� | |||||||||||
|---|---|---|---|---|---|---|---|---|---|---|---|---|---|---|
| W | R | S | V | W | R | S | V | W | R | S | V | |||
| 1 | 10-12 | 13-15 | 13-15 | 13-15 | 16-18 | 16-18 | 16-18 | 16-18 | 19-21 | 19-21 | 10-12 | 19-21 | ||
| 2 | 13-15 | 10-12 | 10-12 | 10-12 | 10-12 | 19-21 | 10-12 | 10-12 | 13-15 | 10-12 | 13-15 | 10-12 | ||
| 3 | 16-18 | 7-9 | 16-18 | 16-18 | 19-21 | 10-12 | 13-15 | 19-21 | 16-18 | 16-18 | 19-21 | 13-15 | ||
| 4 | 7-9 | 16-18 | 7-9 | 7-9 | 13-15 | 13-15 | 7-9 | 13-15 | 10-12 | 13-15 | 16-18 | 16-18 | ||
| 5 | 19-21 | 19-21 | 19-21 | 19-21 | 7-9 | 7-9 | 19-21 | 7-9 | 7-9 | 7-9 | 7-9 | 7-9 | ||
�´��ڴ�
3.2 ����̬�����ռ�Ը������Ⱥ������м�ֵ�Ƚ�
3.2.1 ����̬�ռ�Բ�ͬ��Ⱥ������������Ӧ�� ��1����5��ʾ���������Ⱥ��,�ֵص�����������Ӧ�ȸ���,�����ˮ��,�ٴ��Dzݵ�;�������Ⱥ��,ˮ�������������Ӧ�ȸ���,�ֵغͲݵض������˵�����������Ӧ�ȴ�����ͬ;������꼰�ٶ�Ⱥ��,�ݵص�����������Ӧ�Ⱦ����,�����ˮ��,�ٴ����ֵء�Tab. 5
��5
��5���¸���̬�����ռ�Ը�����ο�Դ����Ӧ��ָ��
Tab. 5The adaptation indexes of each ecological recreation space to different aged recreationists in each month
| �ռ����� | ����� | 1�� | 2�� | 3�� | 4�� | 5�� | 6�� | 7�� | 8�� | 9�� | 10�� | 11�� | 12�� | ȫ��ƽ�� |
|---|---|---|---|---|---|---|---|---|---|---|---|---|---|---|
| �ֵ� | A | 1.64 | 1.61 | 1.59 | 1.57 | 1.54 | 1.54 | 1.49 | 1.46 | 1.55 | 1.61 | 1.65 | 1.65 | 1.57 |
| M | 0.89 | 0.87 | 0.84 | 0.82 | 0.80 | 0.79 | 0.79 | 0.80 | 0.83 | 0.86 | 0.89 | 0.90 | 0.84 | |
| Y | 0.44 | 0.54 | 0.59 | 0.67 | 0.72 | 0.76 | 0.80 | 0.80 | 0.65 | 0.49 | 0.40 | 0.39 | 0.61 | |
| C | 1.18 | 1.10 | 1.14 | 1.09 | 1.15 | 1.12 | 1.13 | 1.13 | 1.14 | 1.26 | 1.24 | 1.26 | 1.16 | |
| �ݵ� | A | 0.93 | 0.91 | 0.85 | 0.79 | 0.75 | 0.70 | 0.64 | 0.62 | 0.77 | 0.88 | 0.92 | 0.93 | 0.80 |
| M | 0.78 | 0.81 | 0.82 | 0.84 | 0.85 | 0.87 | 0.89 | 0.90 | 0.88 | 0.83 | 0.78 | 0.77 | 0.84 | |
| Y | 1.04 | 1.06 | 1.11 | 1.13 | 1.13 | 1.13 | 1.13 | 1.12 | 1.05 | 1.04 | 1.04 | 1.05 | 1.09 | |
| C | 1.98 | 1.90 | 1.87 | 1.89 | 1.94 | 2.00 | 2.06 | 2.11 | 1.97 | 1.95 | 2.02 | 2.01 | 1.98 | |
| ˮ�� | A | 1.16 | 1.13 | 1.08 | 1.04 | 1.00 | 0.94 | 0.89 | 0.87 | 0.96 | 1.04 | 1.15 | 1.18 | 1.04 |
| M | 0.94 | 0.95 | 0.95 | 0.95 | 0.94 | 0.95 | 0.96 | 0.98 | 0.97 | 0.97 | 0.95 | 0.94 | 0.95 | |
| Y | 0.64 | 0.65 | 0.68 | 0.71 | 0.75 | 0.78 | 0.79 | 0.80 | 0.74 | 0.68 | 0.66 | 0.64 | 0.71 | |
| C | 1.70 | 1.73 | 1.78 | 1.83 | 1.85 | 1.89 | 1.96 | 1.90 | 1.87 | 1.82 | 1.66 | 1.67 | 1.80 |
�´��ڴ�
��2����6��ʾ,������̬�����ռ���ȫ�겻ͬʱ�ζԲ�ͬ����Ⱥ�������������Ӧ�Ȳ�ͬ������̬�����ռ������Ⱥ���ƽ������������Ӧ����ߵ�ʱ��Ϊ7:00-9:00,�����ꡢ���ꡢ�ٶ���ƽ������������Ӧ����ߵ�ʱ�ηֱ�Ϊ19:00-21:00��13:00-15:00��10:00-12:00��
Tab. 6
��6
��6ȫ�겻ͬʱ��θ���̬�����ռ�Ը�����ο�Դ����Ӧ��ָ��
Tab. 6The adaptation indexes of each ecological recreation space to different aged recreationists in different periods calculated by annual average
| ʱ�� | �ֵ� | �ݵ� | ˮ�� | ƽ�� | |||||||||||||||
|---|---|---|---|---|---|---|---|---|---|---|---|---|---|---|---|---|---|---|---|
| A | M | Y | C | A | M | Y | C | A | M | Y | C | A | M | Y | C | ||||
| 7:00-9:00 | 2.75 | 0.44 | 0.39 | 0.33 | 1.68 | 0.82 | 0.49 | 1.25 | 2.43 | 0.64 | 0.24 | 0.68 | 2.29 | 0.63 | 0.37 | 0.75 | |||
| 10:00-12:00 | 1.36 | 0.96 | 0.42 | 1.65 | 0.57 | 0.82 | 1.20 | 2.39 | 0.49 | 1.07 | 0.59 | 3.03 | 0.81 | 0.95 | 0.74 | 2.36 | |||
| 13:00-15:00 | 1.17 | 0.73 | 0.90 | 1.96 | 0.44 | 0.97 | 1.10 | 2.32 | 0.54 | 0.98 | 1.05 | 2.14 | 0.72 | 0.89 | 1.02 | 2.14 | |||
| 16:00-18:00 | 1.20 | 1.07 | 0.52 | 1.33 | 0.31 | 0.67 | 1.58 | 2.74 | 0.94 | 1.03 | 0.92 | 1.22 | 0.82 | 0.92 | 1.01 | 1.76 | |||
| 19:00-21:00 | 1.39 | 0.99 | 0.79 | 0.54 | 1.03 | 0.90 | 1.06 | 1.18 | 0.78 | 1.05 | 0.75 | 1.96 | 1.07 | 0.98 | 0.87 | 1.23 | |||
| ƽ�� | 1.57 | 0.84 | 0.61 | 1.16 | 0.80 | 0.84 | 1.09 | 1.98 | 1.04 | 0.95 | 0.71 | 1.80 | 1.14 | 0.88 | 0.80 | 1.65 | |||
�´��ڴ�
3.2.2 ����̬�ռ�Բ�ͬ��Ⱥ����������Ӧ�ȵ�Ӱ�����رȽ� ��ͬ�����Ⱥ���������������,�Լ�������̬�ռ���������������ڲ��졣�� �����������������ж����ʶȵ�Ҫ����ߡ����彡�������ǿ�ҡ��Ի��������ı仯��Ϊ����,������ƫ�ÿ��������Ϻá�����������ý�ǿ����������С�������������Ե��ֵ���������,���Ϊˮ�� �����˵���Ͼʱ����Ҫ�ֲ���ÿ���°�֮��,��ȫ��ˮ���ڴ�ʱ�ε�����������������Ϊͻ��,���ˮ�������Ⱥ�������������Ӧ�ȸ���,������ֵغͲݵء��� ����Ⱥ�������������еĻ�Ը�ǿ,����ͬ���˽��������֮�以���϶�;ͬʱ,����Ⱥ������µ����ر仯����������Խ�������������������������и�ƫ������������ռ�����������ⲿ��ۻ�������һ���Խ�ǿ�IJݵ�,�����ˮ����ֵء��� �ٶ�Ⱥ���һЩ����������������в�������֮��,��������̬�����ռ��ƫ�����������ơ�����,�ٶ�Ⱥ�����������������г�������������Ⱥ���,����������ƫ�û���ͬ���ߵ�Ӱ�졣�� �ܲ�ͬ������Ͼʱ��ֲ�����������Ŀ�IJ����Ӱ��,�������Ⱥ��������������Ҫʱ�β�ͬ,�Բ�ͬʱ�θ���̬�����ռ�Բ�ͬ��Ⱥ������������Ӧ�����ֱ��Ӱ�졣
3.3 ȫ�����̬�����ռ����м�ֵ�Ƚ�
3.3.1 ȫ�����̬�����ռ�����м�ֵ ��7��ӳ��ȫ�����̬�����ռ�����м�ֵ��ȫ��ˮ�����Խϸߵ����м�ֵ��ӳ�����������߽����Ե���ˮ����;ȫ��������������߶Բݵص�����ƫ�ø����ֵ�,�������Խ�С��3.3.2 ȫ��������ض���̬�����ռ����м�ֵӰ��ıȽ� ��̬�����ռ�����м�ֵ���价�����ʶȡ��������ԡ�����ʱ�䳤�ȡ�������ռ�����ص�Ӱ�졣����������֣��� �ֵؽϺõĻ������ʶȼ�������ʹ������Խϸߵ�����ճ��ָ������7��,���ֵ�����ʱ�䳤�ȡ�������ռ�ľ�������������������������Դ��Ӧ�ȣ�ͼ3��ͼ5��;�� ��ͬ��Ⱥ����Ͼʱ��μ������ǿ�Ȳ�ͬ,ȫ��ݵ�������ʱ�䳤�ȼ�������ռ䷽�������ʹ����ӭ�ϸ���������Ⱥ��������������ͼ5��,���ݵصĻ������ʶȼ�����������Բ�ͻ��,������������ճ�ԣ�ͼ4��;�� ȫ��ˮ���ڻ������ʶȼ�����ʱ�䳤�ȷ����������,Ҳ��һ����������,����������ȼ�����ճ����ͻ����ͼ3��ͼ4��,��ˮ����������ռ䷽��ľ�������һ���̶������������Դ��Ӧ�ȣ�ͼ5��;�� �ڸ�������Ӱ����,ȫ��ѡ�����ˮ���������������������,��������ˮ����������ʱ�������7��,������ѡ��ˮ��������������������Ⱥ�������̶��䲻���ݵ�,�������ֵ�,��Щ����ʹȫ��ˮ���������м�ֵ���Խϸ�;�� ���ֵ����,ȫ��ƽ��ÿλ��������Ȼ�ڲݵ����Ķ���ʱ��϶�,��ѡ�����ݵ��������������϶�,ȫ��������ѡ��ݵؽ���������������Ⱥ�������̶�Ҳ�ϸ�,Ӱ�����ֵء��ݵ����м�ֵ�ĶԱȹ�ϵ��
Tab. 7
��7
��7����̬�����ռ����ָ������ƽ��ֵ
Tab. 7The annual mean value of each index of each ecological recreation space
| ��̬�ռ����� | ���������ָ�� | ����ճ��ָ�� | ��Դ��Ӧ��ָ�� | ���м�ֵָ�� |
|---|---|---|---|---|
| �ֵ� | 0.87 | 1.22 | 1.05 | 1.11 |
| �ݵ� | 0.92 | 1.18 | 1.18 | 1.28 |
| ˮ�� | 1.20 | 1.36 | 1.13 | 1.84 |
�´��ڴ�
4 ����������
���Ļ�������������������Ϊ,����˳�����̬�����ռ����м�ֵ���۷���,�Գ�����Ҫ������̬�����ռ����м�ֵ���ж�̬�ȽϷ���,��Ҫ�������£���1���ڸ���̬�����ռ����м�ֵʱ��ֲ����棺�� ȫ�������̬�����ռ����м�ֵʱ��ֲ��IJ�������������;�� ˮ���Դ��Ӧ��,�ݵ�����ճ�Լ����������,�ֵ�����ճ�ԡ���������ȼ���Դ��Ӧ�ȵ�ʱ�ξ����Ծ���ͻ��,�ڴ�Ӱ����,����̬�����ռ����м�ֵ��ʱ�������������ǿ����Ϊˮ�ݵغ��ֵ�;�� ������̬�����ռ�ĸ���ָ��ֵ�����ⲿ�����仯���仯,���仯�����ȵIJ�ͬʹ����̬�����ռ�����й�����ʱ��ά�����γ�һ����λ�ͻ���;�� ȫ�������ƫ��ƫ��ʱ��֮��Ĵ�ʱ��,ˮ�����ָ��ֵ��������̬�����ռ��о�Ϊ���;����ȫ���ʱ��,�ֵ���ݵصĸ�ָ��ֵ���ϵ�,�����ֵؿ�Դ��Ӧ�ȡ��ݵ�����ճ��ƫ�͵�ʱ��ռ�ȹ���;�� ��������̬�ռ���,�ֵ����м�ֵ�������ˮƽ��ʱ�䲻��ȫ���1/4,��Ҫ�ֲ����ⲿ���½ϸߡ����ս�ǿ��ʱ��;�ݵ����м�ֵ�������ˮƽ��ʱ�䲻��ȫ���1/8,��Ҫ�ֲ����ⲿ���¡����յ��������������е�ʱ�Ρ�
��2���ڸ���̬�����ռ�Ը��������Ⱥ������������Ӧ�Է��棺�� �ֵض������˵�����������Ӧ����ߡ������˸�ƫ��ˮ���������������꼰�ٶ���ƫ�òݵ���������;�� ��ͬʱ����̬�����ռ�Ը��������Ⱥ������������Ӧ�Ȳ�ͬ,���ꡢ���ꡢ���ꡢ�ٶ���ƫ�õ���������ʱ�ηֱ�Ϊ7:00-9:00��19:00-21:00��13:00-15:00��10:00-12:00��
��3���ڸ���̬�����ռ����м�ֵӰ�����ط��棺�� �ڻ������¡����ա����ٵ������ϲ���������������ʱ��,�ֵؾ����γɲ��컯����С����������,ˮ���֮,���ݵص���������ͬ�ⲿ�߶�һ�¡����ڲ���ʱ��,�ֵ��й۾���Ұ���ޡ��οͻ������߲��㼰��ռ������������ֵص����м�ֵ;����ƫ��ƫ�͡�����ƫǿ�����ٽϴ�����������˲ݵغ�ˮ�����м�ֵ;������������ռ�ȶ�ˮ�����м�ֵ���һ������Ӱ�졣�� �ڸ���̬�����ռ�ĸ���ָ����,�ֵ�������������Դ��Ӧ�ȡ��ݵ���������ȡ�ˮ���Դ��Ӧ�ȵ�����ˮƽ����ͺ�,����Ӧ��̬�����ռ�����м�ֵ���һ����Լ���� �ڸ�������Ӱ����,ȫ��ˮ������м�ֵ��ͻ��,Ȼ������Ϊ�ݵغ��ֵء�
���ݱ��ĵ��о��ɹ�,�ɵó�������ʾ��
��1��������̬�����ռ����÷��档�Ը�����̬�ռ���м��,ʹ������̬�����ռ����й�����ʱ��ֲ����桢�Բ�ͬ��Ⱥ����Ӧ�Է����γɻ���,����������̬�����������з�������������֯��̬������·ʱ,�ɸ��ݲ�ͬʱ�θ���̬�����ռ����м�ֵ��С���������ڵ㡣�ɸ��ݸ��������Ⱥ�Ը�����̬�����ռ��ƫ�ü���ռ�ֲ�,ȷ�����в�ͬ�ص������̬�����ռ����÷������������˽϶�ľ�ס�����ø����ֵ�,�������˽϶��ѧУ�����ֳ����������Ӳݵر���,�������˽϶��д��¥�������ʵ�������ˮ��ȡ�
��2��������̬�����ռ�������ʩ���跽�档�ɸ��ݸ�����̬�����ռ����м�ֵ��ֵ,ȷ������̬�����ռ���������ʩ�����ñ���,���г�������������Ƶ������ֵء��ݵء�ˮ�������ò�ͬ������ȵ�,���費ͬ��������������;���ݸ���̬�����ռ�����ճ�Դ�С,�����ε��������̶ȵȡ�
��3��������̬�����ռ侭Ӫ�������档���ݸ���̬�����ռ����м�ֵʱ��ֲ���������Ⱥ��ƫ�õ���������ʱ�εȶԸ���̬�����ռ��е���ҵ��Ӫ���ݼ�ģʽ���ж�̬����,���������о���Ч�档���ݸ���̬�����ռ����м�ֵ�Ķ�̬�仯,�Ը���̬�����ռ���ж�̬��������ά��,����7-8�µ�19:00-21:00,ˮ������з�����Զ��������ʱ��,����ˮ���������������������估���������ƶ�����������,���ɰ���������Ա�ȡ�
��4��������̬�����ռ��������跽�档����ֵ�,�ɶ������ֽ��к�������,����������ƹ�,�ȱ����ֵ���������컯����С�������������,�������ֵصĹ۾���Ұ���Լ����ڲ���ʱ�ε����º���,�����οͻ�ռ�,�Խ�һ���������ʱ��ά�ȼ���ԴȺ�巽�������������Ӧ��;��Բݵ�,�ڱ�������Ұ�������ɽӴ��Ըߵ����ƵĻ�����,�ʵ��������Ե���������ԵȾ�����,���ֲ�����Ӫ������С�������ṩ�ɹ����Ծ��۷���IJ���,��������������ȼ�����ճ��,�˷������й��ܵ�ʱ�ξ����ԡ����ˮ��,��ͨ���ʶ�������ɫֲ�����ˮ���Ծ�����ͤ������ˮ��ɽӴ��Ե�;����һ��������Դ��Ӧ�ȡ�
����������������������һ����̽�֣��� ������Ҫ�����˾�������о�����ͬ��̬�����ռ������������Ϊѡ�������������о�������������ο�Ϊ��Ҫ��������̬�����ռ�,�ο͵�����������Ϊ��������ֱ仯,�պ����ڴ˷����һ���о����� ����ѡ����о���Ϊ��γ�����ȴ�����������,������������������Ϊ�о�����,��ͬ�����������ؽ�ʹ������̬�����ռ����м�ֵ���ֲ�ͬ�Ķ�̬�仯����,����б�Ҫ��չ��ͬ�����������ĶԱ����о���
The authors have declared that no competing interests exist.
�ο����� ԭ��˳��
������ȵ���
������������
�����ڿ�Ӱ������
| [1] | Although community attachment and urban green space provide many benefits to local residents, the relationship between them seems to be unknown. The aim of the study was to analyse this relationship. The objective was to investigate the influence of public green space and recreation behaviour on community attachment and explore differences in community attachment between urban and suburban resi... |
| [2] | . ���ų��з�չ���̵ļӿ죬������̬������������������η�չ�������ϰ�����ˣ�Ѱ��һ�ֻ�����̬��г�����η�ʽ�Ե���Ϊ��Ҫ��ͨ������֣�ݳ�����̬���η�չ�����塢�������������οռ�ṹ�������硢����Լ�����������3�����湹��֣�ݳ�����̬���εĻ�����ϵ���������չ֣�ݳ�����̬���α���ע�ؼӴ������̬�����������ȡ�ʵʩ�������γ�������������ǿ������̬������ʶ������������������Դ���ϡ�������̬���ξ�Ʒ�Ⱦ�����ԡ� ���ų��з�չ���̵ļӿ죬������̬������������������η�չ�������ϰ�����ˣ�Ѱ��һ�ֻ�����̬��г�����η�ʽ�Ե���Ϊ��Ҫ��ͨ������֣�ݳ�����̬���η�չ�����塢�������������οռ�ṹ�������硢����Լ�����������3�����湹��֣�ݳ�����̬���εĻ�����ϵ���������չ֣�ݳ�����̬���α���ע�ؼӴ������̬�����������ȡ�ʵʩ�������γ�������������ǿ������̬������ʶ������������������Դ���ϡ�������̬���ξ�Ʒ�Ⱦ�����ԡ� |
| [3] | <h2 class="secHeading" id="section_abstract">Abstract</h2><p id="abspara0010">This article describes a qualitative analysis of place-based meanings held by members of a conservation advocacy, or "Friends of…," group living within watershed boundaries surrounding a public, urban arboretum in South Central Wisconsin. Responses to semi-structured interview questions were analyzed using an iterative analytic method. Indicators of place-based meanings associated with this urban natural area were assessed from interview transcripts. An integrative model of Arboretum Meanings emerged from the analysis highlighting place meanings associated with various attributes of the area. Use of this urban natural area was often associated with a deep appreciation of its biodiversity, as a location for sanctuary or escape, a place for recreation and exercise, and as a meeting place for friends and family. Results are discussed in terms of how place-based meanings can inform land managers and conservation advocacy group leaders to better understand their stakeholders, maintain the most desirable elements of urban natural areas, and reduce potential conflict resulting from divergent place meanings among user groups.</p><h4 id="secGabs_Nace203d0N7cd50cd0">Highlights</h4><p>? Place meanings included four main themes: nature, sanctuary, activity, and society. ? Concerns included property misuse, development, deer, and invasive species. ? Understanding stakeholder language can help managers craft engagement strategies.</p> |
| [4] | Ecosystem services are vital for humans in urban regions. However, urban development poses a great risk for the ability of ecosystems to provide these services. In this paper we first address the most important ecosystem services in functional urban regions in Finland. Well accessible and good quality recreational ecosystem services, for example, provided by urban nature, are an important part of a high-quality living environment and important for public health. Vegetation of urban regions can have a role in carbon dioxide sequestration and thus in climate change mitigation. For instance, estimates of carbon sinks can be compared to total CO<sub>2</sub> emissions of an urban region, and the municipality can aim at both increasing carbon sinks and decreasing CO<sub>2</sub> emissions with proper land-use planning. Large and contiguous core nature areas, smaller green areas and ecological connections between them are the essence of regional ecological networks and are essential for maintaining interconnected habitats for species and thus biological diversity. Thus, both local and regional level ecological networks are vital for maintaining ecosystem services in urban regions. The impacts of climate change coupled with land-use and land cover change will bring serious challenges for maintaining ecosystem services in urban areas. Although not yet widely used in planning practices, the ecosystem services approach can provide an opportunity for land-use planning to develop ecologically sustainable urban regions. Currently, information on ecosystem services of urban regions is lacking and there is a need to improve the knowledge base for land-use planning. |
| [5] | . ���û������Ŀռ��������,�� �Ծ���ʹ���������������Ϊ�������кͷ����Ļ�����,ͨ������뾶���串���ʷ�ӳ��̬�����ռ�ķ������˶ȵ��������,�Ӷ���ʾ�Ϻ�������̬�����ռ�ĸ� �ַ�������,���ַ����ʵͺͷֲ������Ŀռ���Ӱ�����������������˶�,�Ӷ������Ϻ�������̬�����ռ�ķ����ܵĽϵ�ˮƽ���ݴ�����Ż��Բ�:���� ��Ӧע�ؿռ����ϵ����廯�����,����������Ȧ������Ż��ص��ǿռ䲼�ֵľ�����������,ͬʱ���Ӻͼ�ǿ��ܵ���̬�����ȵ�ϵͳ�Ĺ�������̬������ �佨��Ľ���Ȼ�������ʻ��� ���û������Ŀռ��������,�� �Ծ���ʹ���������������Ϊ�������кͷ����Ļ�����,ͨ������뾶���串���ʷ�ӳ��̬�����ռ�ķ������˶ȵ��������,�Ӷ���ʾ�Ϻ�������̬�����ռ�ĸ� �ַ�������,���ַ����ʵͺͷֲ������Ŀռ���Ӱ�����������������˶�,�Ӷ������Ϻ�������̬�����ռ�ķ����ܵĽϵ�ˮƽ���ݴ�����Ż��Բ�:���� ��Ӧע�ؿռ����ϵ����廯�����,����������Ȧ������Ż��ص��ǿռ䲼�ֵľ�����������,ͬʱ���Ӻͼ�ǿ��ܵ���̬�����ȵ�ϵͳ�Ĺ�������̬������ �佨��Ľ���Ȼ�������ʻ��� |
| [6] | This paper provides insights into foresters' perceptions of forest recreation and its management. It is based on qualitative interviews with foresters in Berlin and the region of Stuttgart, Germany (N = 16). The results highlight the lack of strategic planning concerned with recreation management at both locations. Moreover, recreation management seems to depend mostly on the local forester in charge. Foresters' perceptions of recreation, in turn, appear to be closely linked with how they perceive their work. Three narratives of the foresters' self-perception are constructed that address three key items: perception of foresters' skills and tasks, perception of the societal and political context of the foresters' work and of their own scope of action in this context, and visions for future recreation management. The first narrative emphasises classical forestry and silvicultural aspects; the second understands foresters as multifunctional service providers for communal clients; and the last criticises the classical orientation of forestry and highlights new challenges for foresters in urban areas. These three views of recreation management in urban forests relate to classical forestry culture in different ways: either embodying this culture; differentiating from it; or adopting a new view which challenges this culture. Further research needs are discussed. The paper lastly argues for increased awareness of the importance of the social dimensions of forest management as one of the crucial future challenges for the forestry profession. |
| [7] | <h2 class="secHeading" id="section_abstract">Abstract</h2><p id="abspara0010">Interest in ecosystem services has grown tremendously among a wide range of sectors, including government agencies, NGO’s and the business community. Ecosystem services entailing freshwater (e.g. flood control, the provision of hydropower, and water supply), as well as carbon storage and sequestration, have received the greatest attention in both scientific and on-the-ground applications. Given the newness of the field and the variety of tools for predicting water-based services, it is difficult to know which tools to use for different questions. There are two types of freshwater-related tools – traditional hydrologic tools and newer ecosystem services tools. Here we review two of the most prominent tools of each type and their possible applications. In particular, we compare the data requirements, ease of use, questions addressed, and interpretability of results among the models. We discuss the strengths, challenges and most appropriate applications of the different models. Traditional hydrological tools provide more detail whereas ecosystem services tools tend to be more accessible to non-experts and can provide a good general picture of these ecosystem services. We also suggest gaps in the modeling toolbox that would provide the greatest advances by improving existing tools.</p><h4 id="secGabs_N74965650N4236daf8">Highlights</h4><p>? We compared examples of two classes of models for freshwater ecosystem services. ? Traditional hydrological models include SWAT and VIC. ? Ecosystem Services specific models include InVEST and ARIES. ? We compared key inputs, outputs, services modeled, usability, and interpretability. ? Hydrological tools give more detail but ecosystem services tools are more accessible.</p> |
| [8] | ������,���Ŷ�ɭ����̬ϵͳ��������ʶ����������,ɭ����̬ϵͳ�����ܵļ�ֵ����������Ҫ������Ӧ����̬��ֵ����̼˰����Ӱ�ӹ��̷�����Ը�������������о�����,���ع�ɭ�ֺ���ˮԴ����̼���������������������������������ּ��������������6����̬�����ܼ�ֵ�����˺��㡣�������,�ع�ɭ����̬ϵͳ6������ܵ��ܼ�ֵΪ769��Ԫ,�൱�ڸ���GPD������94.14%;��6���ָ���к���ˮԴ���ܼ�ֵ���,Ϊ3.25��1010Ԫ,ռ�ܼ�ֵ42.26%;��λ���ɭ����̬ϵͳ�����ܼ�ֵԼΪȫ����λ��ֵ��4.8���� . ������,���Ŷ�ɭ����̬ϵͳ��������ʶ����������,ɭ����̬ϵͳ�����ܵļ�ֵ����������Ҫ������Ӧ����̬��ֵ����̼˰����Ӱ�ӹ��̷�����Ը�������������о�����,���ع�ɭ�ֺ���ˮԴ����̼���������������������������������ּ��������������6����̬�����ܼ�ֵ�����˺��㡣�������,�ع�ɭ����̬ϵͳ6������ܵ��ܼ�ֵΪ769��Ԫ,�൱�ڸ���GPD������94.14%;��6���ָ���к���ˮԴ���ܼ�ֵ���,Ϊ3.25��1010Ԫ,ռ�ܼ�ֵ42.26%;��λ���ɭ����̬ϵͳ�����ܼ�ֵԼΪȫ����λ��ֵ��4.8���� |
| [9] | . <a name="Abs1"></a>Environmental planning at different levels has been called for by environmental departments in China during last years to integrate environment consideration to economic development. Based on the accomplished environmental planning practice in Xiamen China, the paper suggests a general environmental planning process with ecological function zoning as its key steps, at the same time an effective method for ecological function zoning was formulated. The case studies of Dongfu suburban town environmental planning and Xiamen eco-city conceptual planning indicate that scientifically sound results of ecological function zoning can contribute to improving not only the adaptability and acceptability of environmental planning, also the environmental management and the decision-making. The experience shows that the ecological function zoning methods should be applied according to the principles of adaptive management, resource-based and community-based, so that it can integrate science into decision-making process, avoiding both narrow-minded viewpoints of planners and natural resource use conflicts among variety of stakeholders. Problems to be resolved in the future are also pointed out in the ending part. |
| [10] | The services of ecological systems and the natural capital stocks that produce them are critical to the functioning of the Earth's life-support system. They contribute to human welfare, both directly and indirectly, and therefore represent part of the total economic value of the planet. We have estimated the current economic value of 17 ecosystem services for 16 biomes, based on published studies and a few original calculations. For the entire biosphere, the value (most of which is outside the market) is estimated to be in the range of US$16-54 trillion (10) per year, with an average of US$33 trillion per year. Because of the nature of the uncertainties, this must be considered a minimum estimate. Global gross national product total is around US$18 trillion per year. |
| [11] | We estimated global marketed and non-marketed economic value from two classified satellite images with global coverage at 1 km2 resolution. GDP (a measure of marketed economic output) is correlated with the amount of light energy (LE) emitted by that nation as measured by nighttime satellite images. LE emitted is more spatially explicit than whole country GDP, may (for some nations or regions) be a more accurate indicator of economic activity than GDP itself, can be directly observed, and can be easily updated on an annual basis. As far as we know, this is the first global map of estimated economic activity produced at this high spatial resolution (1 km2). Ecosystem services product (ESP) is an important type of non-marketed value. ESP at 1 km2 resolution was estimated using the IGBP land-cover dataset and unit ecosystem service values estimated by Costanza et al. [Valuing Ecosystem Services with Efficiency, Fairness and Sustainability as Goals. Nature's Services, Island Press, Washington DC, pp. 49�70]. The sum of these two (GDP+ESP)=SEP is a measure of the subtotal ecological–economic product (marketed plus a significant portion of the non-marketed). The ratio: (ESP/SEP)×100=%ESP is a measure of proportion of the SEP from ecosystem services. Both SEP and %ESP were calculated and mapped for each 1 km2 pixel on the earth's surface, and aggregated by country. Results show the detailed spatial patterns of GDP, ESP, and SEP (also available at: http://www.du.edu/psutton/esiindexisee/EcolEconESI.htm). Globally, while GDP is concentrated in the northern industrialized countries, ESP is concentrated in tropical regions and in wetlands and other coastal systems. %ESP ranges from 1% for Belgium and Luxembourg to 3% for the Netherlands, 18% for India, 22% for the United States, 49% for Costa Rica, 57% for Chile, 73% for Brazil, and 92% for Russia. While GDP per capita has the usual northern industrialized countries at the top of the list, SEP per capita shows a quite different picture, with a mixture of countries with either high GDP/capita, high ESP/capita, or a combination near the top of the list. Finally, we compare our results with two other indices: (1) The 2001 Environmental Sustainability Index (ESI) derived as an initiative of the Global Leaders of Tomorrow Environment Task Force, World Economic Forum, and (2) Ecological Footprints of Nations: How much Nature do they use? How much Nature do they have? developed by Mathis Wackernagel and others. While both of these indices purport to measure sustainability, the ESI is actually mainly a measure of economic activity (and is correlated with GDP), while the Eco-Footprint index is a measure of environmental impact. The related eco-deficit (national ecological capacity minus national footprint) correlates well with %ESP. |
| [12] | Economists have always argued that only when people bear true economic costs of using natural resources, such as mangroves, that they will have appropriate incentives to use them efficiently and minimize their degradation and losses. More recently, non-economists, too, have started to call for the use of economic valuation information to argue for conservation of mangroves. This paper briefly examines the role economic valuation information can play, at least theoretically, in encouraging conservation of mangroves and increasing efficiency in resource use. In practice, the paper argues that a number of difficulties are likely to be encountered when determining true economic value of mangroves, particularly when small areas of mangroves are involved. A total reliance on economic valuation-based decision-making is questioned, particularly in the light of minimal ecological information often available in small island nations in the Pacific. An alternative decision-making process is proposed in which the relevance of economic valuation-based decision-making is recognized but at a second tier level. |
| [13] | This research addresses the need to improve our knowledge on the demand for national forests for recreation and offers an in-depth data analysis supported by the complementary use of count data and ordered models. From a policy-making perspective, while count data models enable the estimation of monetary welfare measures, ordered models allow for the wider use of the database and provide a more flexible analysis of data. The main purpose of this article is to analyse the individual forest recreation demand and to derive a measure of its current use value. To allow a more complete analysis of the forest recreation demand structure the econometric approach supplements the use of count data models with ordered category models using data obtained by means of an on-site survey in the Bussaco National Forest (Portugal). Overall, both models reveal that travel cost and substitute prices are important explanatory variables, visits are a normal good and demographic variables seem to have no influence on demand. In particular, estimated price and income elasticities of demand are quite low. Accordingly, it is possible to argue that travel cost (price) in isolation may be expected to have a low impact on visitation levels. |
| [14] | Abstract<br/>While the demand for forest recreation has been a topic covered in many studies, little attention has been paid so far to seasonal demand. In a forest context, the seasonal analysis is particularly interesting because of inter-temporal change in forest attributes throughout the year which can influence trip-taking behavior. In this paper, the model of seasonal forest visitation is developed to provide a richer understanding of the role played by seasonal fluctuation on a distribution of forest social benefits. The analysis is based on an on-site survey conducted in four forests in Poland. Results show that the most valuable forest trips are those taken in fall and that seasonal trips are separable.<br/> |
| [15] | . ���о����ݵ���̬ϵͳ��̬�����ֵ������Ϊ4���������,�ֱ�Ϊ:�ں�ȷ�ϡ����ܷ��ࡢָ���趨����ֵ����,������˳�ݵ���̬ϵͳ�����ֵ�������о���չ���˲���,�������еIJݵ���̬ϵͳ�����ֵ�����о�,���ں�ȷ�ϡ�ָ���������������������������涼���ںܴ���硣��Ҫԭ������:1)û�г����ʶ���ݵ���̬ϵͳ�ڲ����ڵ�����������;2)�������������ʶ����ƫ��,û���ҵ���������������,�Ӷ��������������г����ظ���������;3)�Լ�ֵ���۵��������ص�,�Լ���ֵ�����������֮��Ĺ�ϵȱ����ʶ��������Ϸ���,���ڲݵ��ۺ�˳����෨(CSCS)����˲ݵ���̬ϵͳ�����ֵ������ʵ������,����ȷ���о��ռ�߶ȼ����ڲ��ݵ�����,ȷ���о���Χ�ڵ����������,ѡ������ָ��ͺ��ʵ����������IJ���,��ǿ��ʵ���о��ڲݵ���̬ϵͳ�����ֵ�����е���Ҫ���á� ���о����ݵ���̬ϵͳ��̬�����ֵ������Ϊ4���������,�ֱ�Ϊ:�ں�ȷ�ϡ����ܷ��ࡢָ���趨����ֵ����,������˳�ݵ���̬ϵͳ�����ֵ�������о���չ���˲���,�������еIJݵ���̬ϵͳ�����ֵ�����о�,���ں�ȷ�ϡ�ָ���������������������������涼���ںܴ���硣��Ҫԭ������:1)û�г����ʶ���ݵ���̬ϵͳ�ڲ����ڵ�����������;2)�������������ʶ����ƫ��,û���ҵ���������������,�Ӷ��������������г����ظ���������;3)�Լ�ֵ���۵��������ص�,�Լ���ֵ�����������֮��Ĺ�ϵȱ����ʶ��������Ϸ���,���ڲݵ��ۺ�˳����෨(CSCS)����˲ݵ���̬ϵͳ�����ֵ������ʵ������,����ȷ���о��ռ�߶ȼ����ڲ��ݵ�����,ȷ���о���Χ�ڵ����������,ѡ������ָ��ͺ��ʵ����������IJ���,��ǿ��ʵ���о��ڲݵ���̬ϵͳ�����ֵ�����е���Ҫ���á� |
| [16] | Abstract<br/>River managers are tasked with meeting both ecological and human needs. In the Puget Sound lowland, riparian management often includes placing or allowing the presence of large wood to stabilize riverbanks and enhance salmon habitat. Although this practice benefits humans by protecting infrastructure and natural resources, it is unclear how such practices interact with an additional human interest, recreation. Furthermore, we were unable to find studies that describe how an agency can go about researching the interaction between recreation and large wood management practices. This study tested methods for describing and estimating the number of river floaters, where they float in relationship to river projects, the risks they take while floating, and their perceptions of large wood in the river. Selecting a high-use suburban river in Washington State, we used riverside observations, interviews, and an infrared counter to gather data in the summer of 2010. Statistical analyses provided general characteristics of users, trends in engaging in risky behaviors, and estimates of use for the entire season and on the busiest day. Data mapping with GIS presented the density of use along the river and frequency of use of specific float routes. Finally, qualitative analysis of interviews clarified floaters�� perspectives of large wood. To address the multiple mandates of river managers, it is important to understand recreation users, the factors that could be putting them at risk, and how the actual users perceive large wood in the river. This study demonstrates methods for scientifically gathering such information and applying it when making riparian management decisions.<br/> |
| [17] | . ��̬ϵͳ�����ֵ�����ǵ�ǰ�� ̬����ѧ�ͻ�������ѧ���о��ȵ�ͽ��㡣��ϵͳ�ع˹�������̬ϵͳ�����ֵ�����о���չ�Ļ�����,���о�����ֵ���ɡ��о�������ʱ�չ��̵�4������� ��̬ϵͳ�����ֵ�����ĵ�ǰ���������˷���,̽���˼�ֵ�������������������۷����Լ�����Ӧ�õ����⡣ָ�����ڱ����ǿ��̬ϵͳ�������ۺͷ����о�,չ�� ��δ����̬ϵͳ�����ֵ�����о��������ص����� ��̬ϵͳ�����ֵ�����ǵ�ǰ�� ̬����ѧ�ͻ�������ѧ���о��ȵ�ͽ��㡣��ϵͳ�ع˹�������̬ϵͳ�����ֵ�����о���չ�Ļ�����,���о�����ֵ���ɡ��о�������ʱ�չ��̵�4������� ��̬ϵͳ�����ֵ�����ĵ�ǰ���������˷���,̽���˼�ֵ�������������������۷����Լ�����Ӧ�õ����⡣ָ�����ڱ����ǿ��̬ϵͳ�������ۺͷ����о�,չ�� ��δ����̬ϵͳ�����ֵ�����о��������ص����� |
| [18] | . <p>����������Ϊ�������ñ仯����Ҫ��������,�����ı��������ú;��۸��,��������̬ϵͳ���ܼ�������ֵ����Ӱ��.�����Լ���ʡ���е�����������ĿΪ��,������̬�����ֵģ�ͼ����˴������������߶�����������������̬�����ֵ���������仯.�������: �����Ӹ���ΪĿ�������������Ŀ����ɲݵغ�ʪ�صȾ��нϸ���̬�����ֵ�ĵ������,���²�ͬ�߶���������������̬�����ֵ�������ֲ�ͬ�̶ȵ��½�.����߶���,�������о����ܵ���̬�����ֵΪ796.14��Ԫ,������ǰ����10.5%;����߶���,�������ܵ���̬�����ֵΪ84301.26��Ԫ,������ǰ����14.2%;����߶���,�������ܵ���̬�����ֵΪ120585.76��Ԫ,������ǰ����33.1%.����������������̬�����ֵ����,�������̬��������,�����������������ľ�����̬��Ʋ���,����Ϊ���������ij�����չ�ṩ��������.</p> <p>����������Ϊ�������ñ仯����Ҫ��������,�����ı��������ú;��۸��,��������̬ϵͳ���ܼ�������ֵ����Ӱ��.�����Լ���ʡ���е�����������ĿΪ��,������̬�����ֵģ�ͼ����˴������������߶�����������������̬�����ֵ���������仯.�������: �����Ӹ���ΪĿ�������������Ŀ����ɲݵغ�ʪ�صȾ��нϸ���̬�����ֵ�ĵ������,���²�ͬ�߶���������������̬�����ֵ�������ֲ�ͬ�̶ȵ��½�.����߶���,�������о����ܵ���̬�����ֵΪ796.14��Ԫ,������ǰ����10.5%;����߶���,�������ܵ���̬�����ֵΪ84301.26��Ԫ,������ǰ����14.2%;����߶���,�������ܵ���̬�����ֵΪ120585.76��Ԫ,������ǰ����33.1%.����������������̬�����ֵ����,�������̬��������,�����������������ľ�����̬��Ʋ���,����Ϊ���������ij�����չ�ṩ��������.</p> |
| [19] | . ��11�������̬ѧ�����8��18����23����Ӣ���ؾ���,����������ص�2000��λ�����μ��˻��顣�˴λ����ģ������ݷḻ�����ջ�Ծ��������ʽ����,��������̬ѧ��ͬר����������½�չ�������й�����̬ϵͳ�����̽����Ҫ����̬ϵͳ���������ร���Ĺ�ϵ����̬ϵͳ�����ֵ����,���пɳ�����չ����̬ϵͳ����������չ��,ǿ���˲�ͬ���ҡ���ͬ����֮��Ľ�����Э��,��չ������̬ϵͳ�����о��е����³ɹ��Լ����ٵ���ս�����ҹ���̬ϵͳ�����о�����ʾ��Ҫ�����¼�������:(1)��ǿ��̬ϵͳ�����о��Ĺ��ʽ��������,ע�ؿ�ѧ���ۺ����˲ŵ�������(2)��ǿ����̬ϵͳ����ij߶�ЧӦ���߶�ת�����о���(3)��ǿ��̬ϵͳ����������о���(4)��ǿ�¼�������̬ϵͳ�����о���Ӧ��,�ٽ���̬ϵͳ������ͼ��ģ�͡���̬���ķ�չ�� ��11�������̬ѧ�����8��18����23����Ӣ���ؾ���,����������ص�2000��λ�����μ��˻��顣�˴λ����ģ������ݷḻ�����ջ�Ծ��������ʽ����,��������̬ѧ��ͬר����������½�չ�������й�����̬ϵͳ�����̽����Ҫ����̬ϵͳ���������ร���Ĺ�ϵ����̬ϵͳ�����ֵ����,���пɳ�����չ����̬ϵͳ����������չ��,ǿ���˲�ͬ���ҡ���ͬ����֮��Ľ�����Э��,��չ������̬ϵͳ�����о��е����³ɹ��Լ����ٵ���ս�����ҹ���̬ϵͳ�����о�����ʾ��Ҫ�����¼�������:(1)��ǿ��̬ϵͳ�����о��Ĺ��ʽ��������,ע�ؿ�ѧ���ۺ����˲ŵ�������(2)��ǿ����̬ϵͳ����ij߶�ЧӦ���߶�ת�����о���(3)��ǿ��̬ϵͳ����������о���(4)��ǿ�¼�������̬ϵͳ�����о���Ӧ��,�ٽ���̬ϵͳ������ͼ��ģ�͡���̬���ķ�չ�� |
| [20] | The main purpose of this study is to examine the potential impacts of the past and future land use/cover (LUC) changes on the ecosystem services of Baguio city, the Philippines, and discuss their implications for policy development and implementation. Remote sensing-derived LUC maps for 1988, 1998 and 2009, along with GEOMOD, a Geographic Information Systems-based LUC change model, and ecosystem service value (ESV) coefficients were used to facilitate the analysis. The results revealed a decrease in the ESV of Baguio for the past 21 years (1988�2009), of which a substantial amount was due to loss of forest cover. Consequently, the human-to-ESV (H-ESV) ratio has decreased over the years. The scenario-based LUC change analysis revealed that if the urban LUC change pattern continues, the total ESV and the H-ESV ratio will also continue to decrease in 2020, especially if the forest cover is not fully protected and conserved. Geospatial tools and techniques facilitate exploratory analysis critical to the understanding of the potential impacts of future LUC changes under different scenarios. Our results highlighted that under the great pressure of urbanization, there is a need to strengthen the proper implementation of policies in order to maintain and improve ecosystem services. Although there are limitations to the estimated ESVs of Baguio to be taken into account in future studies, the magnitude of the estimated changes in the LUC is substantial. Thus, it may still be possible to draw general inferences about the effect of the perceived LUC changes on the estimated ESVs. |
| [21] | . ��̬ϵͳ�����ܼ�ֵ�������������Դ�м���ʶ����Ҫ����,�� ������ɫGDPָ����ʵ�ıر�����.�����г���ֵ�����������̼˰��������֧��������̬ϵͳ�����������������½����Ⱥ�ʪ����Ȼ����������̬�����ܼ� ��ó�:��ϵͳ��̬�����ܼ�ֵ�ﵽ68.65��108Ԫ/a,�Ǹõ���2007�����������ֵ��89.06%.���,���ư��Ⱥ�ʪ��ϵͳ�˻������ǵ��� ���ٵĻ�������,�����ǹ������ɳ�����չ�ľ�������. ��̬ϵͳ�����ܼ�ֵ�������������Դ�м���ʶ����Ҫ����,�� ������ɫGDPָ����ʵ�ıر�����.�����г���ֵ�����������̼˰��������֧��������̬ϵͳ�����������������½����Ⱥ�ʪ����Ȼ����������̬�����ܼ� ��ó�:��ϵͳ��̬�����ܼ�ֵ�ﵽ68.65��108Ԫ/a,�Ǹõ���2007�����������ֵ��89.06%.���,���ư��Ⱥ�ʪ��ϵͳ�˻������ǵ��� ���ٵĻ�������,�����ǹ������ɳ�����չ�ľ�������. |
| [22] | . ��ʵ�ص��������Ļ�����,������Դ����ѧ����̬����ѧ�����ۺͷ���,�Լ������г���ʪ����Դ���ص�,���������г���ʪ����Դ�ļ�ֵ,���Թ����г���ʪ����Դ��ֱ�����ü�ֵ�ͼ�����ü�ֵ�����˻��һ�����.�ɴ˵ó�ʪ����Դ���ܼ�ֵ��Ϊ66.805 3��Ԫ�����,����ʪ����̬ϵͳֱ�����ü�ֵΪ66.3318��Ԫ�����,ռ99.3%.�����������,�����г���ʪ����Դ�ʲ���ֵ��Ҫ������ʪ����̬ϵͳ��ֱ�����ü�ֵ.���,�����ù����г���ʪ����̬����,�������������г���ʪ����Դ,����ʵ����ɳ�������,��֤���õĿɳ�����չ. ��ʵ�ص��������Ļ�����,������Դ����ѧ����̬����ѧ�����ۺͷ���,�Լ������г���ʪ����Դ���ص�,���������г���ʪ����Դ�ļ�ֵ,���Թ����г���ʪ����Դ��ֱ�����ü�ֵ�ͼ�����ü�ֵ�����˻��һ�����.�ɴ˵ó�ʪ����Դ���ܼ�ֵ��Ϊ66.805 3��Ԫ�����,����ʪ����̬ϵͳֱ�����ü�ֵΪ66.3318��Ԫ�����,ռ99.3%.�����������,�����г���ʪ����Դ�ʲ���ֵ��Ҫ������ʪ����̬ϵͳ��ֱ�����ü�ֵ.���,�����ù����г���ʪ����̬����,�������������г���ʪ����Դ,����ʵ����ɳ�������,��֤���õĿɳ�����չ. |
| [23] | . ������ֵ��(CVM) ��һ�ֻ��������г��Ĺ�����Ʒ��ֵ�����������������ʹ�����Ƕ� ���ŶȺ�Ч��ȱ�����Σ���������ľ��ȳ�Ϊѧ����㷺����Ľ��㡣����CVM��ֵ������ �����Ծ�կ��������Ȼ�Ų��ص�������ֵ����������������Ϲ�������������ף���CVM���� ����Դ��ֵ�����д��ڵ�ƫ������˷�������������CVM����������������ٲ��Ŷȡ����� Ч�Ⱥ�����Ч�ȼ��顣�о����֣��� ��կ��������Դ2008��2009 ���������ֵ�ֱ�Ϊ3.33 �� Ԫ��3.46 ��Ԫ��������������ȣ�CVM�������������ƫ�͡��� CVM��������Դ��ֵ�����д� �ڵ�ƫ������о�����������ƫ����о�ʵʩ�����в�����ƫ�ǰ�߰�������ƫ���Ϣƫ �������ƫ���Լ�������ƫ��ȣ����߰���CVM����������������Ľ綨��������ģ��ȷ���� ������ʽ��ѡ���鷽ʽ�ͻ����ʡ����ݵ�ͳ�ƺͷ����Ȼ��ڳ��ֵ�ƫ��� �ٲ��Ŷȼ��� �������о����ŶȽϸߣ�������������нϸߵ��ȶ��ԺͿ��ظ��ԣ�������Ч�Ⱥ�����Ч�ȼ� ����������о��Ծ�կ�����е�CVM���鲻�������õ�Ч�ȣ�CVM�е�������Դ��ֵ���� �� CVM�����о��ص�Ӧ�Ӹ����о����ŶȺ�Ч�ȼ���ת��Ϊ����Ҫ���콨�������� �Ϸ�չ�й��ҵ�CVMʵʩ�淶�����CVM����������ŶȺ�Ч�ȡ� ������ֵ��(CVM) ��һ�ֻ��������г��Ĺ�����Ʒ��ֵ�����������������ʹ�����Ƕ� ���ŶȺ�Ч��ȱ�����Σ���������ľ��ȳ�Ϊѧ����㷺����Ľ��㡣����CVM��ֵ������ �����Ծ�կ��������Ȼ�Ų��ص�������ֵ����������������Ϲ�������������ף���CVM���� ����Դ��ֵ�����д��ڵ�ƫ������˷�������������CVM����������������ٲ��Ŷȡ����� Ч�Ⱥ�����Ч�ȼ��顣�о����֣��� ��կ��������Դ2008��2009 ���������ֵ�ֱ�Ϊ3.33 �� Ԫ��3.46 ��Ԫ��������������ȣ�CVM�������������ƫ�͡��� CVM��������Դ��ֵ�����д� �ڵ�ƫ������о�����������ƫ����о�ʵʩ�����в�����ƫ�ǰ�߰�������ƫ���Ϣƫ �������ƫ���Լ�������ƫ��ȣ����߰���CVM����������������Ľ綨��������ģ��ȷ���� ������ʽ��ѡ���鷽ʽ�ͻ����ʡ����ݵ�ͳ�ƺͷ����Ȼ��ڳ��ֵ�ƫ��� �ٲ��Ŷȼ��� �������о����ŶȽϸߣ�������������нϸߵ��ȶ��ԺͿ��ظ��ԣ�������Ч�Ⱥ�����Ч�ȼ� ����������о��Ծ�կ�����е�CVM���鲻�������õ�Ч�ȣ�CVM�е�������Դ��ֵ���� �� CVM�����о��ص�Ӧ�Ӹ����о����ŶȺ�Ч�ȼ���ת��Ϊ����Ҫ���콨�������� �Ϸ�չ�й��ҵ�CVMʵʩ�淶�����CVM����������ŶȺ�Ч�ȡ� |
| [24] | We attempted to estimate the economic value of environmental services provided by restored instream flows in the water-scarce Yaqui River Delta in Mexico. The Yaqui River begins near the U.S.-Mexico border and continues for 400Â km before reaching the Oviachic dam, but has not reached the nearby Gulf of California for decades due to diversions for irrigation. These diversions have degraded the riparian ecosystem, coastal wetlands, and estuaries. Environmental services provided by restored flows in the Yaqui River would include healthy riverside vegetation, wetlands and estuaries, fish and wildlife habitats, non-use values, and recreation. A contingent valuation survey in 40 neighborhoods in the most populated Delta city, Ciudad Obregon, was administered to estimate non-market values of instream uses. Respondents were given a current and hypothetical Delta scenario (the latter assumed restored water flows in the River) and asked a willingness-to-pay (WTP) question regarding purchasing water for environmental flows through higher water bills. Results from 148 in-person interviews indicated that households would pay an average of 73 pesos monthly. WTP was found related to key variables suggested by economic theory and contingent valuation studies elsewhere: income, educational level, number of children in the household, and initial bid amount. These results will allow decision makers to compare the benefits generated by different water uses, including environmental services, and to manage scarce water resources under a long-term sustainable approach. |
| [25] | Findings suggest hypothetical bias is present in the survey. Including a real payment vehicle may reduce hypothetical bias in eliciting willingness-to-pay (WTP). Best estimates are the mean WTP is US $ 16.74 per capita. Aggregate preservation value lies between US $264 and $602million. These findings indicate that conservation of the DMZ and CCZ is not only important for moral and ecological reasons, but the DMZ and CCZ are of considerable economic value to South Koreans. Any development unfriendly to the environment will degrade the quality of the ecosystem of the DMZ, as well as, decrease its economic value. |
| [26] | . ����Constaza������ķ���,�ڶ���ظ�ԭ��Ȼ�ݵ���̬ϵͳ�����ֵ�����������������Ļ�����,��������˸��ֲݵ����͵ĸ�����̬�����ֵ,�ó���ظ�ԭ��Ȼ�ݵ���̬ϵͳÿ���ṩ����̬�����ֵΪ257178×108Ԫ,ռȫ���ݵ���̬ϵͳÿ������ֵ��1768%���ܸ���ݵ�����Ⱥ��ֲ���Ⱥ͵�λ�����̬������ǿ�����ۺ�Ӱ��,����ݵص���̬�����ֵ�������кܴ����,����,�ߺ��ݵ顢ɽ�زݵ顢�ߺ���ԭ�Բݵ���̬ϵͳ�ܷ����ֵ�Ĺ����ʷֱ�Ϊ6252%��1414%��1292%�����ݸߺ��ݵصĵ�������������������е��� ����Constaza������ķ���,�ڶ���ظ�ԭ��Ȼ�ݵ���̬ϵͳ�����ֵ�����������������Ļ�����,��������˸��ֲݵ����͵ĸ�����̬�����ֵ,�ó���ظ�ԭ��Ȼ�ݵ���̬ϵͳÿ���ṩ����̬�����ֵΪ257178×108Ԫ,ռȫ���ݵ���̬ϵͳÿ������ֵ��1768%���ܸ���ݵ�����Ⱥ��ֲ���Ⱥ͵�λ�����̬������ǿ�����ۺ�Ӱ��,����ݵص���̬�����ֵ�������кܴ����,����,�ߺ��ݵ顢ɽ�زݵ顢�ߺ���ԭ�Բݵ���̬ϵͳ�ܷ����ֵ�Ĺ����ʷֱ�Ϊ6252%��1414%��1292%�����ݸߺ��ݵصĵ�������������������е��� |
| [27] | . ��������ʪ����̬ϵͳ�������ṩ��������Ҫ�IJ�Ʒ�ͷ���,������ᾭ�÷�չ�Ĺ�����,��Щ����û����ȫ����ʶ��,������������ᾭ�õĿɳ�����չ�����һ����Ӱ�졣��Ϻ�������ʪ����̬ϵͳ���������ṹ������,����������ʪ����̬ϵͳ�����ܻ���Ϊ�ṩ��Ʒ���ܡ����ڹ��ܡ�֧�ֹ��ܼ��Ļ�������4����,��2005��Ϊ����,�����˺�������ʪ����̬ϵͳ���ṩ��12����̬ϵͳ����,����12������ܻ���Ϊ����ֱ��ʹ�ü�ֵ�IJ�Ʒ�;��м��ʹ�ü�ֵ�ķ��������,��������ʪ����̬ϵͳ�ṩ��12����̬ϵͳ������ܼ�ֵΪ4123.66��10<sup>8</sup>Ԫ,����ֱ��ʹ�ü�ֵ�ͼ��ʹ�ü�ֵ�ֱ�Ϊ257.46��10<sup>8</sup>Ԫ��3866.20��10<sup>8</sup>Ԫ,���ʹ�ü�ֵ��ֱ��ʹ�ü�ֵ��15.02������������λ�����ʪ����̬ϵͳ�ṩ����̬ϵͳ�����ܼ�ֵΪ47.05��10<sup>4</sup>Ԫ/hm<sup>2</sup>,���ڵ�λ�����GDP��ֵ8.10��10<sup>4</sup>Ԫ/hm<sup>2</sup>���о���Ϊ��������ʪ����̬ϵͳ��֧�ֺͱ���������������Ҫ������,Ϊ�����ߺ;�������Ч�ı�������ʪ���ṩ����Ҫ����Ϣ�� ��������ʪ����̬ϵͳ�������ṩ��������Ҫ�IJ�Ʒ�ͷ���,������ᾭ�÷�չ�Ĺ�����,��Щ����û����ȫ����ʶ��,������������ᾭ�õĿɳ�����չ�����һ����Ӱ�졣��Ϻ�������ʪ����̬ϵͳ���������ṹ������,����������ʪ����̬ϵͳ�����ܻ���Ϊ�ṩ��Ʒ���ܡ����ڹ��ܡ�֧�ֹ��ܼ��Ļ�������4����,��2005��Ϊ����,�����˺�������ʪ����̬ϵͳ���ṩ��12����̬ϵͳ����,����12������ܻ���Ϊ����ֱ��ʹ�ü�ֵ�IJ�Ʒ�;��м��ʹ�ü�ֵ�ķ��������,��������ʪ����̬ϵͳ�ṩ��12����̬ϵͳ������ܼ�ֵΪ4123.66��10<sup>8</sup>Ԫ,����ֱ��ʹ�ü�ֵ�ͼ��ʹ�ü�ֵ�ֱ�Ϊ257.46��10<sup>8</sup>Ԫ��3866.20��10<sup>8</sup>Ԫ,���ʹ�ü�ֵ��ֱ��ʹ�ü�ֵ��15.02������������λ�����ʪ����̬ϵͳ�ṩ����̬ϵͳ�����ܼ�ֵΪ47.05��10<sup>4</sup>Ԫ/hm<sup>2</sup>,���ڵ�λ�����GDP��ֵ8.10��10<sup>4</sup>Ԫ/hm<sup>2</sup>���о���Ϊ��������ʪ����̬ϵͳ��֧�ֺͱ���������������Ҫ������,Ϊ�����ߺ;�������Ч�ı�������ʪ���ṩ����Ҫ����Ϣ�� |
| [28] | People around the world are looking to marine ecosystems to provide additional benefits to society. As they consider expanding current uses and investing in new ones, new management approaches are needed that will sustain the delivery of the diverse benefits that people want and need. An ecosystem services framework provides metrics for assessing the quantity, quality, and value of benefits obtained from different portfolios of uses. Such a framework has been developed for assessments on land, and is now being developed for application to marine ecosystems. Here, we present marine Integrated Valuation of Ecosystem Services and Tradeoffs (InVEST), a new tool to assess (i.e., map, model, and value) multiple services provided by marine ecosystems. It allows one to estimate changes in a suite of services under different management scenarios and to investigate trade-offs among the scenarios, including implications of drivers like climate. We describe key inputs and outputs of each of the component ecosystem service models and present results from an application to the West Coast of Vancouver Island, British Columbia, Canada. The results demonstrate how marine InVEST can be used to help shape the dialogue and inform decision making in a marine spatial planning context. |
| [29] | |
| [30] | A meta-analysis of studies valuing urban greenspace in the UK is undertaken to yield spatially sensitive marginal value functions. A geographical information system (GIS) is used to apply these functions to spatial data detailing the location of such greenspace resources in five British cities. Changes in monetary values are computed for the six future scenarios used in the UK National Ecosystem Assessment for the period 2010�2060. Different degrees of substitutability between urban greenspaces are considered. These findings are then extrapolated to all major British cities to obtain per household and aggregate valuation estimates for each scenario both with and without distributional weights. While subject to a number of shortcomings in both data availability and methodology, this represents the first systematic and comprehensive attempt to value marginal changes in urban greenspace while accounting for spatial heterogeneity. |
| [31] | This paper presents a method to quantify cultural ecosystem services (ES) and their spatial distribution in the landscape based on ecological structure and social evaluation approaches. The method aims to provide quantified assessments of ES to support land use planning decisions. A GIS-based approach was used to estimate and map the provision of recreation and aesthetic services supplied by ecosystems in a peri-urban area located in the Basque Country, northern Spain. Data of two different public participation processes (frequency of visits to 25 different sites within the study area and aesthetic value of different landscape units) were used to validate the maps. Three maps were obtained as results: a map showing the provision of recreation services, an aesthetic value map and a map of the correspondences and differences between both services. The data obtained in the participation processes were found useful for the validation of the maps. A weak spatial correlation was found between aesthetic quality and recreation provision services, with an overlap of the highest values for both services only in 7.2% of the area. A consultation with decision-makers indicated that the results were considered useful to identify areas that can be targeted for improvement of landscape and recreation management. |
| [32] | . <p>���ȴӳ��������ռ�����͡��ṹ���ݻ������ۡ��滮�����������Ϊ�����ȷ���������ҹ�Ŀǰ���о���״��������������ָ�������д��ڵĸ������⡣�ڴ˻���������ҹ����������ռ��о����ٵĻ�������ս������˽��Ӧ�ص��о������ɷ��������</p> <p>���ȴӳ��������ռ�����͡��ṹ���ݻ������ۡ��滮�����������Ϊ�����ȷ���������ҹ�Ŀǰ���о���״��������������ָ�������д��ڵĸ������⡣�ڴ˻���������ҹ����������ռ��о����ٵĻ�������ս������˽��Ӧ�ص��о������ɷ��������</p> |
| [33] | <a name="Abs1"></a>Urban cores are primarily associated with economic activity: they are places where people live, work and engage in a range of leisure activities. Natural elements within the environment are recognised as having an important role in promoting quality of life. An investigation into the urban character of Manchester City Centre (UK) combining an analysis of the surface cover with the mapping of urban morphology types (UMTs) shows the extent to which green space permeates the built matrix. Around 20% of the urban core was covered by evapotranspiring surfaces. UMTs were differentiated along axes which were characterised by the intensity of grassland management and the density of building. The results presented here contribute to the on going debate around the development of cities and the relationship between the natural and built environments and provide guidance for those challenged with designing these environments. |
| [34] | . �о�Ŀ��:��ͼ����һ�������� ��̬�����õط�����ϵ,�Թ淶��̬�����õط�չ,�ٽ����ؽ�Լ��Լ����,Ϊ������̬�����õ�ר��滮���»������о�����:ͨ�������о����ͶԱȷ�����,�� �������������÷������й���̬���ε�����,�ڴ˻��������ϵͳ����̬�����õط�����ϵ���о����:������һ�װ���3�����ࡢ10�������ࡢ26��������� ��̬�����õط�����ϵ,�����롶����������״���ࡷ���ұ������ع滮��;������ϵ���˽Ϻ��νӡ��о�����:�������������ù滮����ع滮�νӵ�,����Ӧ ��̬���η�չ����̬�����õط�����ϵʮ�ֱ�Ҫ,���ҿ��С� �о�Ŀ��:��ͼ����һ�������� ��̬�����õط�����ϵ,�Թ淶��̬�����õط�չ,�ٽ����ؽ�Լ��Լ����,Ϊ������̬�����õ�ר��滮���»������о�����:ͨ�������о����ͶԱȷ�����,�� �������������÷������й���̬���ε�����,�ڴ˻��������ϵͳ����̬�����õط�����ϵ���о����:������һ�װ���3�����ࡢ10�������ࡢ26��������� ��̬�����õط�����ϵ,�����롶����������״���ࡷ���ұ������ع滮��;������ϵ���˽Ϻ��νӡ��о�����:�������������ù滮����ع滮�νӵ�,����Ӧ ��̬���η�չ����̬�����õط�����ϵʮ�ֱ�Ҫ,���ҿ��С� |
| [35] | <a name="Abs1"></a>Water consumption and disposal are often taken for granted as essential services with required levels of service quality, yet little is known about how much consumers are willing to pay for specific service levels. As customers in many countries face changing levels of water availability (especially shortages linked possibly to climate change and limited catchment capacity), the need to assess the value (and hence benefit) to society of varying service levels and prices in an effort to secure the provision of and disposal of water has risen on public agendas. In an attempt to establish how much customers are willing to pay for specific levels of service, we use a series of stated choice experiments and mixed logit models to establish the willingness to pay to avoid interruptions in water service and overflows of wastewater, differentiated by the frequency, timing and duration of these events. The empirical evidence is an important input into the regulatory process for establishing service levels and tariffs, as well as useful planning information for agencies charged with finding cost effective ways of delivering services at prices that customers deem to be value for money. |
| [36] | . ������̬��������Ҫ����������������̬�������ߵĽ��̶ܳȺͿ� �ܷ�Ӧ,��δ���й���Ƹ��ر�������ʱ���뿼�ǵĺ�������.����ѡ�ú����人�����ij�����Զ����361�������383��ũ����ʵ���ʾ���������,��ѡ��ʵ �鷨�ӽ�,�������������ڸ����������������������������ܱ߾�������̬�������ر���֧���ɱ�4������Լ�����Ϸ������ߵĿ��ܷ�Ӧ�ͽ�����Ը.�� ������:�ٳ������Գ�����������ĸ��ر������Ե�ƫ���������Ը���ڲ���,����Ը����ܱ߾�������̬�����Ĺ�ע�̶����,����Ǹ������������,��ע�� �ٵ��Ǹ�������������и��ر���������ɵ�7��������,���ŷ�����֧����Ը���,��ζ�ž����ڴ��������������������������ܱߵľ�������̬���������Ը� �ƣ��۳������֮��ƫ������Ը�����Ų���,������ᾭ�ñ���,�����������Ļ��̶��н�ǿ�����.���,������ܱ߾�������̬�������Եĸ��ر�������, ��δ�����ر������������Ҫѡ��. ������̬��������Ҫ����������������̬�������ߵĽ��̶ܳȺͿ� �ܷ�Ӧ,��δ���й���Ƹ��ر�������ʱ���뿼�ǵĺ�������.����ѡ�ú����人�����ij�����Զ����361�������383��ũ����ʵ���ʾ���������,��ѡ��ʵ �鷨�ӽ�,�������������ڸ����������������������������ܱ߾�������̬�������ر���֧���ɱ�4������Լ�����Ϸ������ߵĿ��ܷ�Ӧ�ͽ�����Ը.�� ������:�ٳ������Գ�����������ĸ��ر������Ե�ƫ���������Ը���ڲ���,����Ը����ܱ߾�������̬�����Ĺ�ע�̶����,����Ǹ������������,��ע�� �ٵ��Ǹ�������������и��ر���������ɵ�7��������,���ŷ�����֧����Ը���,��ζ�ž����ڴ��������������������������ܱߵľ�������̬���������Ը� �ƣ��۳������֮��ƫ������Ը�����Ų���,������ᾭ�ñ���,�����������Ļ��̶��н�ǿ�����.���,������ܱ߾�������̬�������Եĸ��ر�������, ��δ�����ر������������Ҫѡ��. |
| [37] | . ѡ��ʵ����Ϊ��Դ����������г���ֵ��������Ҫ����֮һ��������30���Ӧ���뷢չ,ѡ��ʵ���Ѿ���ΪĿǰ��Ҫ��������о����г���ֵ��������������������Ҫ�ķ���֮һ������,�÷������ҹ��������о���Խ���,������о���Ӧ��ȱ��ϵͳ�ԡ��������Ƚ�����ѡ��ʵ���ԭ��,��ѡ��ʵ�鵮����������Դ��������̬�����������Ӧ�ý���������,�ھ���˵��������ѡ��ʵ��ʵ��Ӧ�õĻ�����,�����ѡ��ʵ�����ҹ����ܵ�Ӧ�÷�Χ,������̬�����������������ϡ���ֱ�������Ȼ���۵Ŀ����ȷ���,ͬʱ���ܽ���ѡ��ʵ����ʵ��Ӧ����Ӧע��Ĺؼ�����,ּ��Ϊ�ҹ���������о���ʵ���ṩ������ ѡ��ʵ����Ϊ��Դ����������г���ֵ��������Ҫ����֮һ��������30���Ӧ���뷢չ,ѡ��ʵ���Ѿ���ΪĿǰ��Ҫ��������о����г���ֵ��������������������Ҫ�ķ���֮һ������,�÷������ҹ��������о���Խ���,������о���Ӧ��ȱ��ϵͳ�ԡ��������Ƚ�����ѡ��ʵ���ԭ��,��ѡ��ʵ�鵮����������Դ��������̬�����������Ӧ�ý���������,�ھ���˵��������ѡ��ʵ��ʵ��Ӧ�õĻ�����,�����ѡ��ʵ�����ҹ����ܵ�Ӧ�÷�Χ,������̬�����������������ϡ���ֱ�������Ȼ���۵Ŀ����ȷ���,ͬʱ���ܽ���ѡ��ʵ����ʵ��Ӧ����Ӧע��Ĺؼ�����,ּ��Ϊ�ҹ���������о���ʵ���ṩ������ |
| [38] | . ��ֵ�����Ǽ�ֵ��ѧ����Ҫ���ݡ���ֵ������Ϊһ���������ʶ������������彫��������������Լ���ͷ�Բ����������Ŀ�ġ���Ҫ�ͱ����������Է�������Ļ������һ�����֪��ڶ������Ŀ���϶������ű��ʵIJ��졣��ֵ��������������Ĵ����ԡ�֪ʶ����к���־�IJ��룬����������Ե�������������ͬʱ����Ҳ���ż�ֵ��ʵ��������Ҫ�����ʵ���ȿ������ص���Լ���ڼ�ֵ���۹����У����۵ı��Ǻ�Ŀ���ԺͺϹ����Ե��л���ϣ�������ͳһ�Ļ�����ʵ����ʵ���Ǽ�ֵ���۵���߱��� ��ֵ�����Ǽ�ֵ��ѧ����Ҫ���ݡ���ֵ������Ϊһ���������ʶ������������彫��������������Լ���ͷ�Բ����������Ŀ�ġ���Ҫ�ͱ����������Է�������Ļ������һ�����֪��ڶ������Ŀ���϶������ű��ʵIJ��졣��ֵ��������������Ĵ����ԡ�֪ʶ����к���־�IJ��룬����������Ե�������������ͬʱ����Ҳ���ż�ֵ��ʵ��������Ҫ�����ʵ���ȿ������ص���Լ���ڼ�ֵ���۹����У����۵ı��Ǻ�Ŀ���ԺͺϹ����Ե��л���ϣ�������ͳһ�Ļ�����ʵ����ʵ���Ǽ�ֵ���۵���߱��� |
| [39] | . �������˿�������������������������˿ڹ��ɵĻ����� ,�����˸����˿����仯�Ļ����ص㡢���ڻ����Լ����Ӱ�� �������˿�������������������������˿ڹ��ɵĻ����� ,�����˸����˿����仯�Ļ����ص㡢���ڻ����Լ����Ӱ�� |
| [40] | . ��������������ۺϾ��������۵�һ����ģ��.��ģ�Ͳ����������������ء���������,���ҿ����˱����۵����ķ�չ����,ʹ��ģ�ͶԵ����ۺϾ����������������к�ʵ�ʵ�����. ��������������ۺϾ��������۵�һ����ģ��.��ģ�Ͳ����������������ء���������,���ҿ����˱����۵����ķ�չ����,ʹ��ģ�ͶԵ����ۺϾ����������������к�ʵ�ʵ�����. |
