Spatio-temporal characteristics of vegetation water use efficiency and their relationships with climatic factors in alpine and subalpine area of southwestern China
Xiong ZHOU1, Peng-Sen SUN,,1,*, Ming-Fang ZHANG2, Shi-Rong LIU11Institute of Forest Ecology, Environment and Protection, Chinese Academy of Forestry, Beijing 100091, China 2School of Resources and Environment, University of Electronic Science and Technology of China, Chengdu 611731, China
Abstract Aims Water use efficiency (WUE) is an important indicator for understanding the coupling and trade-off relationships between ecosystem water and carbon cycles. In order to reveal the response and adaptation characteristics of different vegetation types to climate change regionally, we examined the trends, altitudinal distributions, and spatial variations of WUE in nine vegetation types in the alpine and subalpine area of southwestern China during the period of 2000-2014. Methods We estimated the vegetation WUE using Moderate Resolution Imaging Spectroradiometer (MODIS) gross primary production (GPP) and evapotranspiration (ET) products, and the gridded climate data interpolated from Aunsplin. Trend analysis and correlation analysis were conducted to examine the relationships between vegetation WUE and other factors, including air temperature, precipitation, and elevation. Important findings The results showed that: (1) The average annual WUE in the study region was 0.95 g·m-2·mm-1 with a significantly increasing trend at 0.011 g·m-2·mm-1·a-1 from 2000 to 2014. The average WUE showed a pattern of higher in the southeast region but lower in the northwest region, and the WUE was found increased in 85.84% of study area. (2) The average WUEs were increasing in all vegetation types, and the WUEs showed a gradient of evergreen needleleaf forest > savannas > evergreen broadleaf forest > woody savannas > cropland > deciduous broadleaf forest > mixed forest > closed shrublands > grassland. (3) The WUE was positively correlated with air temperature in 89.56% of the study area, but it was negatively correlated with precipitation in 92.54% of the study area. The highest correlation between WUE and air temperature was found in grassland, while the highest correlation between WUE and precipitation was identified in woody savannas. (4) As the regional climax vegetation type in southwestern China, the evergreen needleleaf forest’s WUE has high adaptation abilities to both altitudinal change and climate change. Keywords:water use efficiency;vegetation type;altitude;air temperature;precipitation;alpine and subalpine area of southwestern China
PDF (3897KB)元数据多维度评价相关文章导出EndNote|Ris|Bibtex收藏本文 引用本文 周雄, 孙鹏森, 张明芳, 刘世荣. 西南高山亚高山区植被水分利用效率时空特征及其与气候因子的关系. 植物生态学报, 2020, 44(6): 628-641. DOI: 10.17521/cjpe.2019.0281 ZHOU Xiong, SUN Peng-Sen, ZHANG Ming-Fang, LIU Shi-Rong. Spatio-temporal characteristics of vegetation water use efficiency and their relationships with climatic factors in alpine and subalpine area of southwestern China. Chinese Journal of Plant Ecology, 2020, 44(6): 628-641. DOI: 10.17521/cjpe.2019.0281
Fig. 2Vegetation map for the alpine and subalpine area of southwestern China.
Table 1 表1 表1西南高山亚高山区不同植被类型的面积比例、平均海拔、年平均气温和年降水量 Table 1The area ratio, mean altitude, mean annual air temperature and precipitation of different vegetation types in the alpine and subalpine area of southwestern China
ET数据来自NTSG发布的MODIS数据(http://files.ntsg.umt.edu/data/NTSG_Products/MOD16), 空间分辨率为1 km, 时间分辨率为1 a, 时间序列为2000-2014年。ET算法由Mu等(2011)改进, 算法基于Penman-Monteith方程(Monteith, 1965), 计算时考虑了土壤表面蒸发、冠层截流水分蒸发和植物蒸腾:
*, p < 0.05; **, p < 0.01. Fig. 3Temporal trends of gross primary production (GPP)(A), evapotranspiration (ET)(B), and water use efficiency (WUE)(C) in the alpine and subalpine area of southwestern China from 2000 to 2014.
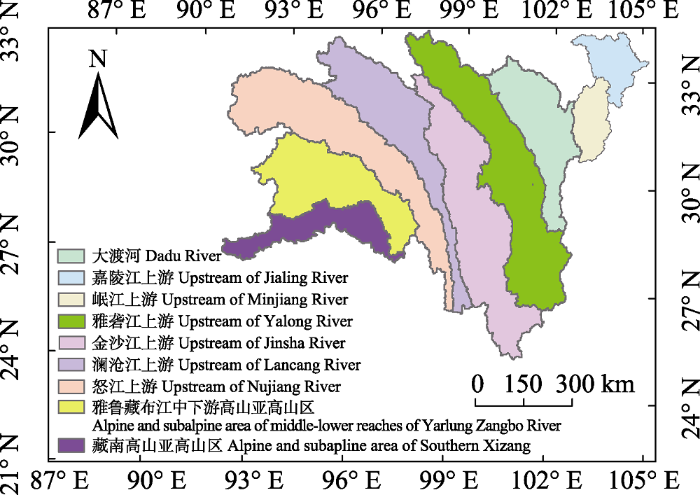
Table 2 表2 表22000-2014年西南高山亚高山区各流域总初级生产力(GPP)、蒸散(ET)、水分利用效率(WUE)平均值、WUE变化趋势 Table 2Mean gross primary production (GPP), evapotranspiration (ET), water use efficiency (WUE), and the change rates of WUE in different watersheds of the alpine and subalpine area of southwestern China from 2000 to 2014
研究区域 Study region
总初级生产力平均值 Mean GPP (g C·m-2)
蒸散平均值 Mean ET (mm)
水分利用效率平均值 Mean WUE (g·m-2·mm-1)
水分利用效率变化趋势 Change rates of WUE (g·m-2·mm-1·a-1)
嘉陵江上游 Upstream of Jialing River
877
640
1.37
-0.001
岷江上游 Upstream of Minjiang River
833
722
1.15
0.004
大渡河 Dadu River
634
614
1.03
0.007
雅砻江上游 Upstream of Yalong River
697
544
1.28
0.013
金沙江上游 Upstream of Jinsha River
731
535
1.37
0.021*
澜沧江上游 Upstream of Lancang River
295
515
0.57
0.011
怒江上游 Upstream of Nujiang River
235
512
0.46
0.009*
雅鲁藏布江中游高山亚高山区 Alpine and subalpine area of middle-lower reaches of Yarlung Zangbo River
322
721
0.45
0.006
藏南高山亚高山区 Alpine and subalpine area of Southern Xizang
Fig. 4Spatial distributions and change trends of gross primary production (GPP), evapotranspiration (ET) and water use efficiency (WUE) in the alpine and subalpine area of southwestern China from 2000 to 2014.
CRO, 农田; CSH, 郁闭灌丛; DBF, 落叶阔叶林; EBF, 常绿阔叶林; ENF, 常绿针叶林; GRA, 草地; MF, 混交林; SA, 稀树草原; WSA, 有林草原。 Fig. 5Mean water use efficiency (WUE ± SD) of different vegetation types in the alpine and subalpine area of southwestern China from 2000 to 2014.
*, p < 0.05; **, p < 0.01。 Fig. 6Temporal trends of water use efficiency (WUE) of different vegetation types in the alpine and subalpine area of southwestern China from 2000 to 2014.
Fig. 7Relationships between water use efficiency (WUE) of different vegetation types and altitude in the alpine and subalpine area of southwestern China.
Fig. 8Spatial distribution of correlation coefficients between annual water use efficiency (WUE) and annual precipitation (A), correlation coefficients between annual WUE and annual air temperature (B) in the alpine and subalpine area of southwestern China from 2000 to 2014.
Table 3 表3 表3西南高山亚高山区不同植被类型水分利用效率(WUE)与年降水量和年平均气温的相关系数分析表 Table 3Correlation coefficients between annual water use efficiency (WUE) and annual precipitation, and correlation coefficients between WUE and annual air temperature of different vegetation types in the alpine and subalpine area of southwestern China
植被类型 Vegetation type
常绿针叶林 Evergreen needleleaf forest
常绿阔叶林 Evergreen broadleaf forest
落叶阔叶林 Deciduous broadleaf forest
混交林 Mixed forest
郁闭灌丛 Closed shrublands
有林草原 Woody savannas
稀树草原 Savannas
草地 Grassland
农田 Cropland
WUE与降水量相关系数 Correlation coefficients between WUE and precipitation
-0.633*
-0.189
-0.406
-0.197
-0.591*
-0.732**
-0.705**
-0.712**
-0.704**
WUE与气温相关系数 Correlation coefficients between WUE and air temperature
Fig. 10Relationships between air temperature, gross primary production (GPP), and evapotranspiration (ET)(A), and between precipitation, GPP, and ET (B) in alpine and subalpine area of southwestern China from 2000 to 2014.
ChenXJ, MoXG, HuS, LiuSX (2017). Contributions of climate change and human activities to ET and GPP trends over North China Plain from 2000 to 2014 Journal of Geographical Sciences, 27, 661-680. DOI:10.1007/s11442-017-1399-zURL [本文引用: 1]
CreedIF, SpargoAT, JonesJA, ButtleJM, AdamsMB, BeallFD, BoothEG, CampbellJL, ClowD, ElderK, GreenMB, GrimmNB, MiniatC, RamlalP, SahaA, SebestyenS, SpittlehouseD, SterlingS, WilliamsMW, WinklerR, YaoHX (2014). Changing forest water yields in response to climate warming: results from long-term experimental watershed sites across North America Global Change Biology, 20, 3191-3208. DOI:10.1111/gcb.12615URL [本文引用: 1] Climate warming is projected to affect forest water yields but the effects are expected to vary. We investigated how forest type and age affect water yield resilience to climate warming. To answer this question, we examined the variability in historical water yields at long-term experimental catchments across Canada and the United States over 5-year cool and warm periods. Using the theoretical framework of the Budyko curve, we calculated the effects of climate warming on the annual partitioning of precipitation (P) into evapotranspiration (ET) and water yield. Deviation (d) was defined as a catchment's change in actual ET divided by P [AET/P; evaporative index (EI)] coincident with a shift from a cool to a warm period - a positive d indicates an upward shift in EI and smaller than expected water yields, and a negative d indicates a downward shift in EI and larger than expected water yields. Elasticity was defined as the ratio of interannual variation in potential ET divided by P (PET/P; dryness index) to interannual variation in the EI - high elasticity indicates low d despite large range in drying index (i.e., resilient water yields), low elasticity indicates high d despite small range in drying index (i.e., nonresilient water yields). Although the data needed to fully evaluate ecosystems based on these metrics are limited, we were able to identify some characteristics of response among forest types. Alpine sites showed the greatest sensitivity to climate warming with any warming leading to increased water yields. Conifer forests included catchments with lowest elasticity and stable to larger water yields. Deciduous forests included catchments with intermediate elasticity and stable to smaller water yields. Mixed coniferous/deciduous forests included catchments with highest elasticity and stable water yields. Forest type appeared to influence the resilience of catchment water yields to climate warming, with conifer and deciduous catchments more susceptible to climate warming than the more diverse mixed forest catchments.
CreggBM, ZhangJW (2001). Physiology and morphology of Pinus sylvestris seedlings from diverse sources under cyclic drought stress Forest Ecology and Management, 154, 131-139. DOI:10.1016/S0378-1127(00)00626-5URL [本文引用: 1]
CuiJ, AnSQ, WangZS, FangCM, LiuYH, YangHB, XuZ, LiuSR (2009). Using deuterium excess to determine the sources of high-altitude precipitation: implications in hydrological relations between sub-alpine forests and alpine meadows Journal of Hydrology, 373, 24-33. DOI:10.1016/j.jhydrol.2009.04.005URL [本文引用: 1]
DuXZ, ZhaoX, WangHY, HeB (2018). Responses of terrestrial ecosystem water use efficiency to climate change: areview Acta Ecologica Sinica, 38, 8296-8305. [本文引用: 3]
GangC, WangZ, ZhouW, ChenY, LiJ, ChenJ, QiJ, OdehI, GroismanPY (2016). Assessing the spatiotemporal dynamic of global grassland water use efficiency in response to climate change from 2000 to 2013 Journal of Agronomy and Crop Science, 202, 343-354. DOI:10.1111/jac.12137URL [本文引用: 1]
GuFX, PangR, ZhangYD, HuangM, LiJ, HaoWP, MeiXR (2014). Temporal-spatial variations of soil organic carbon and their responses to climate change in alpine area of southwest China during 1954-2010 Journal of Natural Resources, 29, 1930-1943. [本文引用: 1]
GundersonCA, EdwardsNT, WalkerAV, O’HaraKH, CampionCM, HansonPJ (2012). Forest phenology and a warmer climate-growing season extension in relation to climatic provenance Global Change Biology, 18, 2008-2025. DOI:10.1111/gcb.2012.18.issue-6URL [本文引用: 1]
GuoLM, SunFB, LiuWB, ZhangYG, WangH, CuiHJ, WangHQ, ZhangJ, DuBX (2019). Response of ecosystem water use efficiency to drought over China during 1982-2015: spatiotemporal variability and resilience Forests, 10, 598. DOI: 10.3390/f1007059. DOI:10.3390/f10070598URL [本文引用: 2]
HeinschFA, ReevrsM, VotavaP, KangSY, MilesiC, ZhaoMS, GlassyJ, JollyWM, LoehmanR, BowkerCF, KimballJS, NemaniRR, RunningSW (2003). GPP and NPP (MOD17A2/A3) Products, NASA MODIS Land Algorithm MOD17 User’s Guide, 1-57. [本文引用: 1]
HuZM, YuGR, FanJW, ZhongHP, WangSQ, LiSG (2010). Precipitation-use efficiency along a 4500-km grassland transect Global Ecology and Biogeography, 19, 842-851. DOI:10.1111/geb.2010.19.issue-6URL [本文引用: 2]
HuZM, YuGR, FuYL, SunXM, LiYN, ShiPL, WangYF, ZhengZM (2008). Effects of vegetation control on ecosystem water use efficiency within and among four grassland ecosystems in China Global Change Biology, 14, 1609-1619. DOI:10.1111/gcb.2008.14.issue-7URL [本文引用: 1]
HuZM, YuGR, WangQF, ZhaoFH (2009). Ecosystem level water use efficiency: a review Acta Ecologica Sinica, 29, 1498-1507. [本文引用: 1]
ItoA, InatomiM (2012). Water-use efficiency of the terrestrial biosphere: a model analysis focusing on interactions between the global carbon and water cycles Journal of Hydrometeorology, 13, 681-694. DOI:10.1175/JHM-D-10-05034.1URL [本文引用: 1] 1.5 g C kg(-1) H2O in boreal and alpine ecosystems. The historical simulation implied that biospheric WUE increased from 1901 to 2005 (WUEC, +7%; WUES, +12%) mainly as a result of the augmentation of productivity in parallel with the atmospheric carbon dioxide increase. Country-based analyses indicated that total NPP is largely determined by water availability, and human appropriation of NPP is also related to water resources to a considerable extent. These results have implications for 1) responses of the carbon cycle to the anticipated global hydrological changes, 2) responses of the water budget to changes in the terrestrial carbon cycle, and 3) ecosystem management based on optimized resource use.]]>
JacksonRB, JobbágyEG, AvissarR, RoySB, BarrettDJ, CookCW, FarleyKA, Le MaitreDC, McCarlBA, MurrayBC (2005). Trading water for carbon with biological carbon equestration Science, 310, 1944-1947. DOI:10.1126/science.1119282URLPMID:16373572 [本文引用: 1] Carbon sequestration strategies highlight tree plantations without considering their full environmental consequences. We combined field research, synthesis of more than 600 observations, and climate and economic modeling to document substantial losses in stream flow, and increased soil salinization and acidification, with afforestation. Plantations decreased stream flow by 227 millimeters per year globally (52%), with 13% of streams drying completely for at least 1 year. Regional modeling of U.S. plantation scenarios suggests that climate feedbacks are unlikely to offset such water losses and could exacerbate them. Plantations can help control groundwater recharge and upwelling but reduce stream flow and salinize and acidify some soils.
JiaZZ, LiuSM, XuZW, ChenYJ, ZhuMJ (2012). Validation of remotely sensed evapotranspiration over the Hai River Basin, China Journal of Geophysical Research, 117, D13113. DOI: 10.1029/2011JD017037. [本文引用: 1]
LiXJ, ZhangFP, WangHW, LeiSJ, GaoZ (2017). Analysis of the spatio-temporal characteristics of water-use efficiency of vegetation and its relationship with climate in the Heihe River Basin Journal of Desert Research, 37, 733-741. [本文引用: 1]
LiuQ, WuN, PanKW, LiuZG, ChenQH (1999). Subalpine forest in the upper reaches of the Yangtze River and its environmental effects and reconstruction countermeasures// Xu HZ, Zhao QG. Flood Disasters in the Yangtze River Basin and Scientific and Technological Countermeasures. Science Press, Beijing. 79-83. [本文引用: 1]
LiuXF, HuBY, RenZY (2018). Spatiotemporal variation of water use efficiency and its driving forces on the Loess Plateau during 2000-2014 Scientia Agricultura Sinica, 51, 302-314. DOI:10.3864/j.issn.0578-1752.2018.02.010URL [本文引用: 1] -1 H2O·a-1, P<0.001). Intra-annual analysis shows that the WUE of different vegetation ecosystems mainly showed a bimodal pattern, which the two peaks appeared in April to May and September to October, respectively. Spatially, the WUE of the LP generally reveals an increasing trend, and the area of increasing trend and significantly increasing trend (P<0.05) accounting for 95.04% and 66.96% of the total study area, respectively, but the patterns of trend in different seasons vary significantly. The mean and trend of WUE among different vegetation ecosystems also vary significantly, among which the mean of WUE of the open shrublands and grasslands are lower than that of other vegetation ecosystems, while the trend of WUE of needleleaf forest decrease significantly. The results of slope statistic show that the WUE of vegetation ecosystem reveals a continuous increase trend in the range of 25°-50°. When annual evapotranspiration (ET) is below 3 700 mm, Gross Primary Productivity (GPP) is positive correlated with ET increase, while when annual ET above 3 700 mm, GPP decrease with the increase of ET. In addition, the WUE of the central and eastern part of the study area is mainly controlled by GPP (57.25%), while ET (42.75%) mainly affects the WUE of the western part of the study area. Moreover, WUE is significantly positive correlated with Leaf Area Index (LAI), indicating the increase of LAI will promote increase in WUE. Stepwise regression analysis shows that precipitation, sunshine duration, and relative humidity are the main climatic factors that lead to the change of WUE and its components in recently 15 years. 【Conclusion】Under the dual disturbance of climate change and anthropogenic activities, the WUE of the LP shows a significantly increasing trend in the past 15 years, and most of the vegetation types show a bimodal pattern within the year. Meanwhile, the ecological restoration project not only improve the vegetation coverage of the LP, but also significantly improve the WUE of vegetation ecosystem of the LP, becoming the main driving forces for explaining changes in WUE on the LP during recent 15 years.]]> [ 刘宪锋, 胡宝怡, 任志远 (2018). 黄土高原植被生态系统水分利用效率时空变化及驱动因素 中国农业科学, 51, 302-314.] [本文引用: 1]
LiuYB, XiaoJF, JuWM, ZhouYL, WangSQ, WuXC (2015). Water use efficiency of China’s terrestrial ecosystems and responses to drought Scientific Reports, 5, 13799-13811. DOI:10.1038/srep13799URLPMID:26347998 [本文引用: 3] Water use efficiency (WUE) measures the trade-off between carbon gain and water loss of terrestrial ecosystems, and better understanding its dynamics and controlling factors is essential for predicting ecosystem responses to climate change. We assessed the magnitude, spatial patterns, and trends of WUE of China's terrestrial ecosystems and its responses to drought using a process-based ecosystem model. During the period from 2000 to 2011, the national average annual WUE (net primary productivity (NPP)/evapotranspiration (ET)) of China was 0.79 g C kg(-1) H2O. Annual WUE decreased in the southern regions because of the decrease in NPP and the increase in ET and increased in most northern regions mainly because of the increase in NPP. Droughts usually increased annual WUE in Northeast China and central Inner Mongolia but decreased annual WUE in central China.
LiuYJ, TaoFL (2013). Response of crop water use efficiency to elevated temperature and CO2 concentration—A review Progress in Geography, 32, 416-424. DOI:10.11820/dlkxjz.2013.03.011URL [本文引用: 1] 2 concentration and temperature rise as the two major indicators, has great impact on crop water use efficiency. Study of the characteristic and mechanism of the response of crop water use efficiency to elevated CO2 concentration and temperature rise is of great significance to revealing the mechanism of how climate change impacts crop production. This paper presents the research progress on the responses of crop water use efficiency to elevated CO2 concentration and temperature rise, the synergistic effect of elevated CO2 concentration and temperature rise, and methods of the research. In addition, this paper points out the key issues that need to be resolved in the future, including: (1) synergistic effect of multi-factors, (2) differences in the responses of different species, (3) response processes at different levels of scale, and (4) adaptability of crop water use efficiency to climate change.]]> [ 刘玉洁, 陶福禄 (2013). 作物水分利用效率对温度和CO2浓度升高的响应研究进展 地理科学进展, 32, 416-424.] [本文引用: 1]
LuXL, ZhuangQL (2010). Evaluating evapotranspiration and water-use efficiency of terrestrial ecosystems in the conterminous United States using MODIS and AmeriFlux data Remote Sensing of Environment, 114, 1924-1939. DOI:10.1016/j.rse.2010.04.001URL [本文引用: 2]
MonteithJL (1965). Evaporation and environment Symposia of the Society for Experimental Biology, 19, 205-234. URLPMID:5321565 [本文引用: 1]
MuQZ, ZhaoMS, RunningSW (2011). Improvements to a MODIS global terrestrial evapotranspiration algorithm Remote Sensing of Environment, 115, 1781-1800. DOI:10.1016/j.rse.2011.02.019URL [本文引用: 3] MODIS global evapotranspiration (ET) products by Mu et al. [Mu, Q. Heinsch, F. A., Zhao, M., Running, S. W. (2007). Development of a global evapotranspiration algorithm based on MODIS and global meteorology data. Remote Sensing of Environment, 111, 519-536. doi: 10.1016/j.rse.2007.04.015] are the first regular 1-km(2) land surface ET dataset for the 109.03 Million km(2) global vegetated land areas at an 8-day interval. In this study, we have further improved the ET algorithm in Mu et al. (2007a, hereafter called old algorithm) by 1) simplifying the calculation of vegetation cover fraction; 2) calculating ET as the sum of daytime and nighttime components; 3) adding soil heat flux calculation; 4) improving estimates of stomatal conductance, aerodynamic resistance and boundary layer resistance; 5) separating dry canopy surface from the wet; and 6) dividing soil surface into saturated wet surface and moist surface. We compared the improved algorithm with the old one both globally and locally at 46 eddy flux towers. The global annual total ET over the vegetated land surface is 62.8 x 10(3) km(3), agrees very well with other reported estimates of 65.5 x 10(3) km(3) over the terrestrial land surface, which is much higher than 45.8 x 10(3) km(3) estimated with the old algorithm. For ET evaluation at eddy flux towers, the improved algorithm reduces mean absolute bias (MAE) of daily ET from 0.39 mm day(-1) to 033 mm day(-1) driven by tower meteorological data, and from 0.40 mm day(-1) to 0.31 mm day(-1) driven by GMAO data, a global meteorological reanalysis dataset. MAE values by the improved ET algorithm are 24.6% and 24.1% of the ET measured from towers, within the range (10-30%) of the reported uncertainties in ET measurements, implying an enhanced accuracy of the improved algorithm. Compared to the old algorithm, the improved algorithm increases the skill score with tower-driven ET estimates from 0.50 to 0.55, and from 0.46 to 0.53 with GMAO-driven ET. Based on these results, the improved ET algorithm has a better performance in generating global ET data products, providing critical information on global terrestrial water and energy cycles and environmental changes.
NiuZE, HeHL, ZhuGF, RenXL, ZhangL, ZhangK, YuGR, GeR, LiP, ZengN, ZhuXB (2019). An increasing trend in the ratio of transpiration to total terrestrial evapotranspiration in China from 1982 to 2015 caused by greening and warming Agricultural and Forest Meteorology, 279, 107701. DOI: 10.1016/j.agrformet.2019.107701. [本文引用: 1]
PangJ, QinJ (2013). Advances in characteristics and causes of drought research in southwest China Journal of Nanjing University of Information Science & Technology (Natural Science Edition), 5(2), 127-134. [本文引用: 1]
PeiTT, LiXY, WuHW, WuXC, ChenY, XieBP (2019). Sensitivity of vegetation water use efficiency to climate and vegetation index in Loess Plateau, China Transactions of the Chinese Agricultural Engineering, 35, 119-125, 319. [本文引用: 2]
Ponce-CamposGE, MoranMS, HueteA, ZhangYG, BresloffC, HuxmanTE, EamusD, BoschDD, BudaAR, GunterSA, ScalleyTH, KitchenSG, McClaranMP, McNabWH, MontoyaDS, MorganJA, PetersDPC, SadlerEJ, SeyfriedMS, StarksPJ (2013). Ecosystem resilience despite large-scale altered hydroclimatic conditions Nature, 494, 349-352. DOI:10.1038/nature11836URL [本文引用: 1] Climate change is predicted to increase both drought frequency and duration, and when coupled with substantial warming, will establish a new hydroclimatological model for many regions(1). Large-scale, warm droughts have recently occurred in North America, Africa, Europe, Amazonia and Australia, resulting in major effects on terrestrial ecosystems, carbon balance and food security(2,3). Here we compare the functional response of above-ground net primary production to contrasting hydroclimatic periods in the late twentieth century (1975-1998), and drier, warmer conditions in the early twenty-first century (2000-2009) in the Northern and Southern Hemispheres. We find a common ecosystem water-use efficiency (WUEe: above-ground net primary production/evapotranspiration) across biomes ranging from grassland to forest that indicates an intrinsic system sensitivity to water availability across rainfall regimes, regardless of hydroclimatic conditions. We found higher WUEe in drier years that increased significantly with drought to a maximum WUEe across all biomes; and a minimum native state in wetter years that was common across hydroclimatic periods. This indicates biome-scale resilience to the interannual variability associated with the early twenty-first century drought-that is, the capacity to tolerate low, annual precipitation and to respond to subsequent periods of favourable water balance. These findings provide a conceptual model of ecosystem properties at the decadal scale applicable to the widespread altered hydroclimatic conditions that are predicted for later this century. Understanding the hydroclimatic threshold that will break down ecosystem resilience and alter maximum WUEe may allow us to predict land-surface consequences as large regions become more arid, starting with water-limited, low-productivity grasslands.
QiuKB, ChengJF (2015). Vegetation water use efficiency and its relationship with climate in Shaanxi Province Research of Soil and Water Conservation, 22(6), 256-260. [本文引用: 3]
SunPS, LiuN, LiuSR, SunG (2016). Trade-offs between water yield and carbon sequestration for sub-alpine catchments in western Sichuan, China Chinese Journal of Plant Ecology, 40, 1037-1048. DOI:10.17521/cjpe.2016.0020URL [本文引用: 2] Aims There is increasing concern on the trade-off between carbon sequestration and water yield of forest ecosystems. Our objective was to explore the effects of vegetation composition on water and carbon trade-off in the sub-alpine watersheds of western Sichuan during 1982–2006.Methods The WaSSI-C, which is an eco-hydrological model with coupled water and carbon cycles, was employed to calculate the key components in water balance and carbon sequestration for the 22 sub-catchments in the upper reaches of Zagunao River. Spearman’s Rho trend analysis was used to examine the trends in runoff and net ecosystem productivity.Important findings Compared with either subalpine meadow or mixed forest dominated catchments, the conifer-dominated catchments had much higher water loss due to high evapotranspiration, and the loss was not offset by its higher soil water infiltration during the growing season. The change in soil water storage for subalpine meadow, mixed forest and coniferous forest are –44 mm, –18 mm and –5 mm, respectively, which indicated significant decline in soil water storage and thus water yield particularly in alpine meadow catchments. Significant negative relationship was found between runoff and net ecosystem productivity, the alpine meadow as the dominant vegetation type showed high water yield and low carbon sequestration, and the conifer-dominant and mixedforest vegetation showed low water yield and high carbon sequestration, moreover, the higher the forest coverage, the lower the water yield. Upward trends in net ecosystem productivity were observed in the three vegetation types during the study period and the alpine meadow type was significant.]]> [ 孙鹏森, 刘宁, 刘世荣, 孙阁 (2016). 川西亚高山流域水碳平衡研究 植物生态学报, 40, 1037-1048.] [本文引用: 2]
SunY, PiaoSL, HuangMT, CiaisP, ZengZZ, ChengL, LiXR, ZhangXP, MaoJF, PengSS, PoulterB, ShiXY, WangXH, WangYP, ZengH (2016). Global patterns and climate drivers of water-use efficiency in terrestrial ecosystems deduced from satellite-based datasets and carbon cycle models Global Ecology and Biogeography, 25, 311-323. DOI:10.1111/geb.12411URL [本文引用: 1]
TangXG, LiHP, DesaiAR, NagyZ, LuoJH, KolbTE, OliosoA, XuXB, YaoL, KutschW, PilegaardK, K?stnerB, AmmannC (2014). How is water-use efficiency of terrestrial ecosystems distributed and changing on Earth? Scientific Reports, 4, 7483. DOI: 10.1038/srep07483. DOI:10.1038/srep07483URLPMID:25500908 [本文引用: 1] A better understanding of ecosystem water-use efficiency (WUE) will help us improve ecosystem management for mitigation as well as adaption to global hydrological change. Here, long-term flux tower observations of productivity and evapotranspiration allow us to detect a consistent latitudinal trend in WUE, rising from the subtropics to the northern high-latitudes. The trend peaks at approximately 51 degrees N, and then declines toward higher latitudes. These ground-based observations are consistent with global-scale estimates of WUE. Global analysis of WUE reveals existence of strong regional variations that correspond to global climate patterns. The latitudinal trends of global WUE for Earth's major plant functional types reveal two peaks in the Northern Hemisphere not detected by ground-based measurements. One peak is located at 20 degrees ~ 30 degrees N and the other extends a little farther north than 51 degrees N. Finally, long-term spatiotemporal trend analysis using satellite-based remote sensing data reveals that land-cover and land-use change in recent years has led to a decline in global WUE. Our study provides a new framework for global research on the interactions between carbon and water cycles as well as responses to natural and human impacts.
TianHQ, ChenGS, LiuML, ZhangC, SunG, LuCQ, XuXF, RenW, PanSF, ChappelkaA (2010). Model estimates of net primary productivity, evapotranspiration, and water use efficiency in the terrestrial ecosystems of the southern United States during 1895-2007 Forest Ecology and Management, 259, 1311-1327. DOI:10.1016/j.foreco.2009.10.009URL [本文引用: 1]
WangF, JiangH, ZhangXM (2015). Spatial-temporal dynamics of gross primary productivity, evapotranspiration, and water-use efficiency in the terrestrial ecosystems of the Yangtze River Delta region and their relations to climatic variables International Journal of Remote Sensing, 36, 2654-2673. DOI:10.1080/01431161.2015.1041618URL [本文引用: 1]
WeiHJ, ZhangYF, DongXB, LuNC, WangXC (2016). Estimating the spatio-temporal characteristic of vegetation water use efficiency over Weihe River Basin Journal of Natural Resources, 31, 1275-1288. [本文引用: 2]
WuGJ, LiuXH, ChenT, XuGB, WangWZ, ZengXM, ZhangXW (2015). Elevation-dependent variations of tree growth and intrinsic water-use efficiency in Schrenk spruce ( Picea schrenkiana) in the western Tianshan Mountains, China Frontiers in Plant Science, 6, 309. DOI: 103389/fps.2015.00309. [本文引用: 1]
XueBL, GuoQH, OttoA, XiaoJF, TaoSL, LiL (2015). Global patterns, trends, and drivers of water use efficiency from 2000 to 2013 Ecosphere, 6, 174. DOI: 10.1890/ES14-00416.1. [本文引用: 3]
YeH, WangJB, HuangM, QiSH (2012). Spatial pattern of vegetation precipitation use efficiency and its response to precipitation and temperature on the Qinghai-Xizang Plateau of China Chinese Journal of Plant Ecology, 36, 1237-1247. DOI:10.3724/SP.J.1258.2012.01237URL [本文引用: 1] Aims Precipitation use efficiency (PUE) is a key to understanding the coupling between ecosystem carbon and water cycles. Our objective was to probe the spatial PUE pattern and its response to climate on the Qinghai-Xizang Plateau to better understand mechanisms of vegetation productivity and improve ecosystem process models.Methods GLOPEN-CEVSA model was applied to estimate net primary production (NPP) by using the Fraction of Photosynthetically Active Radiation Absorbed by Vegetation (MOD15A2), and spatially interpolated meteorological data in 2000–2008. The modeled NPP was significantly correlated with the observed above-ground net primary productivity (R2 = 0.49, p < 0.001, n = 97). The PUE was calculated as the ratio of NPP to the annual sum of precipitation.Important findings The spatial pattern of PUE showed large differences among vegetation types. Crops had the highest PUE, and alpine meadow had higher PUE than alpine steppe. These differences were related to the precipitation and temperature distribution on the plateau. The PUE was relatively stable and the lowest value of (0.026 ± 0.190) g C·m–2·mm–1 (mean ± standard deviation) with the highest coefficient of variance (CV) of 721%was where precipitation was < 90 mm. Where precipitation was 90–300 mm, PUE was relatively stable and also low ((0.029 ± 0.074) g C·m–2·mm–1) with relatively high CV (252%). Together precipitation and air temperature in this precipitation range explained 43.4% of the spatial variance of PUE, and the effect of precipitation was 1.7 times that of temperature (p < 0.001). The area with precipitation from 300–650 mm, mainly covered by alpine steppe (45%), had relatively high PUE ((0.123 ± 0.191) g C·m–2·mm–1) with a CV of 155%. The significant correlation of PUE with climate factors explained 97.8% spatial variance of PUE. Temperature had the dominant role, having 1.5 times the effect of precipitation. With increasing precipitation, PUE reached a peak of 0.26 g C·m–2·mm–1 at 650 mm of precipitation and then showed a decreasing trend. The precipitation of the mountainous Nyingchi region, Xizang, is >845 mm, and the region is mainly covered with evergreen needleleaf forest. It has relatively high PUE ((0.210 ± 0.246) g C·m–2·mm–1) with a minimum CV of 117%. Temperature and precipitation together explained 93.1% of the spatial variation of PUE for Nyingchi. Precipitation was negatively correlated with PUE and its effect was 3.5 times that of temperature.]]> [ 叶辉, 王军邦, 黄玫, 齐述华 (2012). 青藏高原植被降水利用效率的空间格局及其对降水和气温的响应 植物生态学报, 36, 1237-1247.] [本文引用: 1]
ZhangLX, HuZM, FanJW, ShaoQQ, TangFP (2014). Advances in the spatiotemporal dynamics in ecosystem water use efficiency at regional scale Advances in Earth Science, 29, 691-699. DOI:10.11867/j.issn.1001-8166.2014.06.0691URL [本文引用: 4] Water Use Efficiency (WUE) is a crucial indicator for a better understanding in the coupling relationship between ecosystem water and carbon cycles. Studies of the spatiotemporal dynamics in ecosystem WUE together with the underlying mechanisms at a regional scale can enhance our ability to evaluate and predict how global change affects the carbon and water cycles. This study reviewd the current research progress on regional ecosystem WUE. The results indicated that: ① Most of the recent researches on ecosystem WUE are at local scale and the regional study is rare; ② There are definite conclusions about the values as well as the temporal dynamics of the WUE across different ecosystems, whereas the spatial distributions of ecosystem WUE obtained by the ecological model needs further verification; ③ Studies proved that climate change and Land Use/Cover Change (LUCC) could significantly alter the ecosystem productivity or evapotranspiration, yet there are quite a few studies on their effects on ecosystem WUE. Hence, the control factors for the spatiotemporal variability of regional ecosystem WUE and its response to climate change and LUCC may be one of the hot issues in the future global change research. [ 张良侠, 胡中民, 樊江文, 邵全琴, 唐风沛 (2014). 区域尺度生态系统水分利用效率的时空变异特征研究进展 地球科学进展, 29, 691-699.] [本文引用: 4]
ZhangYD, PangR, GuFX, LiuSR (2016). Temporal-spatial variations ofWUE and its response to climate change in alpine area of southwestern China Acta Ecologica Sinica, 36, 1515-1525. [本文引用: 1]
ZhangZ, JiangH, LiuJX, ZhouGM, LiuSR, ZhangXY (2012). Assessment on water use efficiency under climate change and heterogeneous carbon dioxide in China terrestrial ecosystems Procedia Environmental Sciences, 13, 2031-2044. DOI:10.1016/j.proenv.2012.01.194URL [本文引用: 1]
ZhaoAZ, ZhangAB, FengLL, WangDL, ChengDY (2019). Spatio-temporal characteristics of water-use efficiency and its relationship with climatic factors in the Haihe River Basin Acta Ecologica Sinica, 39, 1452-1462. [本文引用: 1]
ZhaoMS, HeinschFA, NemaniRR, RunningSW (2005). Improvements of the MODIS terrestrial gross and net primary production global data set Remote Sensing of Environment, 95, 164-176. DOI:10.1016/j.rse.2004.12.011URL [本文引用: 1]
ZhengD (2012). Dictionary of Geographic Regionalization and Planning. China Water & Power Press, Beijing. [本文引用: 1]
ZhengH, LinH, ZhouWJ, BaoH, ZhuXJ, JinZ, SongY, WangYQ, LiuWZ, TangYK (2019). Revegetation has increased ecosystem water-use efficiency during 2000-2014 in the Chinese Loess Plateau: evidence from satellite data Ecological Indicators, 102, 507-518. [本文引用: 1]
ZouJ, DingJL (2019). Changes of water use efficiency of main vegetation types in Central Asia from 2000 to 2014 Scientia Silvae Sinicae, 55(3), 175-182. [本文引用: 3]
ZouJ, DingJL, QinY, WangF (2018). Response of water use efficiency of Central Asia ecosystem to drought based on remote sensing data Transactions of the Chinese Agricultural Engineering, 34, 145-152, 313-314. [本文引用: 1]
Contributions of climate change and human activities to ET and GPP trends over North China Plain from 2000 to 2014 1 2017
... 在Modis Reprojection Tool (MRT)软件中对为期15年的MODIS数据进行批量拼接以及重投影.MODIS GPP和ET产品数据在世界多个区域通过通量塔站点数据进行了验证, 其准确性在多项研究中得到了证实(Zhao et al., 2005; Mu et al., 2011; Jia et al., 2012; Chen et al., 2017). ...
Changing forest water yields in response to climate warming: results from long-term experimental watershed sites across North America 1 2014
Using deuterium excess to determine the sources of high-altitude precipitation: implications in hydrological relations between sub-alpine forests and alpine meadows 1 2009
Validation of remotely sensed evapotranspiration over the Hai River Basin, China 1 2012
... 在Modis Reprojection Tool (MRT)软件中对为期15年的MODIS数据进行批量拼接以及重投影.MODIS GPP和ET产品数据在世界多个区域通过通量塔站点数据进行了验证, 其准确性在多项研究中得到了证实(Zhao et al., 2005; Mu et al., 2011; Jia et al., 2012; Chen et al., 2017). ...
Evaluating evapotranspiration and water-use efficiency of terrestrial ecosystems in the conterminous United States using MODIS and AmeriFlux data 2 2010
... 在Modis Reprojection Tool (MRT)软件中对为期15年的MODIS数据进行批量拼接以及重投影.MODIS GPP和ET产品数据在世界多个区域通过通量塔站点数据进行了验证, 其准确性在多项研究中得到了证实(Zhao et al., 2005; Mu et al., 2011; Jia et al., 2012; Chen et al., 2017). ...
An increasing trend in the ratio of transpiration to total terrestrial evapotranspiration in China from 1982 to 2015 caused by greening and warming 1 2019
Global patterns and climate drivers of water-use efficiency in terrestrial ecosystems deduced from satellite-based datasets and carbon cycle models 1 2016
How is water-use efficiency of terrestrial ecosystems distributed and changing on Earth? 1 2014
... 由于****对生态系统WUE的内涵理解不同及数据获取手段的差异, 计算WUE的方法有所不同(杜晓铮等, 2018).在生态系统或区域尺度上, WUE主要采用总初级生产力(GPP)、净初级生产力(NPP)或净生态系统碳交换(NEE)和蒸散(ET)的比值来计算(张良侠等, 2014).其中GPP和ET之比已被广泛应用于年月等不同时间尺度生态系统碳水耦合特征及其对气候变化响应的研究(Tang et al., 2014; Wang et al., 2015; Xue et al., 2015; 邹杰等, 2018).因此, 本文采用GPP和ET的比值来计算WUE.近年来, 基于过程的生态系统模型和遥感方法已被广泛应用于生态系统WUE的研究中, 不同区域的WUE时空分布格局具有显著异质性(Ito & Inatomi, 2012; Guo et al., 2019), 且不同植被类型的WUE以及不同区域WUE的主导因素存在地域差异性(刘宪锋等, 2018; 赵安周等, 2019; 邹杰和丁建丽, 2019).另有大量研究表明, 区域生态系统WUE受到气温、降水量的显著影响(Hu et al., 2010; 仇宽彪和成军峰, 2015; 李肖娟等, 2017), 且WUE对于气温和降水都存在阈值效应, 在阈值范围内WUE随气温的升高而增加, 超过阈值WUE随气温的升高反而减小(Zhang et al., 2012; Xue et al., 2015; Sun et al., 2016; 位贺杰等, 2016); 同样, 降水量适当增加会提高植被WUE, 降水量过高则会降低植被WUE (Tian et al., 2010; Liu et al., 2015).由于区域气候条件、植被生长状况等因素的差异, 植被WUE的时空变化及其对气温和降水的响应都会存在差异, 所以有必要加强对不同区域植被WUE时空格局及其对气温和降水量响应的研究.此外, 在全球气候变化的背景下, 海拔变化可作为导致植物生境空间异质性的重要因素, 且不同海拔的气温梯度可为植被类型对气温变化响应与适应提供一种现实的模拟环境(Wu et al., 2015), 因此, 研究植被WUE随海拔梯度的变化能更好地揭示植被对气候变化的响应. ...
Model estimates of net primary productivity, evapotranspiration, and water use efficiency in the terrestrial ecosystems of the southern United States during 1895-2007 1 2010
... 由于****对生态系统WUE的内涵理解不同及数据获取手段的差异, 计算WUE的方法有所不同(杜晓铮等, 2018).在生态系统或区域尺度上, WUE主要采用总初级生产力(GPP)、净初级生产力(NPP)或净生态系统碳交换(NEE)和蒸散(ET)的比值来计算(张良侠等, 2014).其中GPP和ET之比已被广泛应用于年月等不同时间尺度生态系统碳水耦合特征及其对气候变化响应的研究(Tang et al., 2014; Wang et al., 2015; Xue et al., 2015; 邹杰等, 2018).因此, 本文采用GPP和ET的比值来计算WUE.近年来, 基于过程的生态系统模型和遥感方法已被广泛应用于生态系统WUE的研究中, 不同区域的WUE时空分布格局具有显著异质性(Ito & Inatomi, 2012; Guo et al., 2019), 且不同植被类型的WUE以及不同区域WUE的主导因素存在地域差异性(刘宪锋等, 2018; 赵安周等, 2019; 邹杰和丁建丽, 2019).另有大量研究表明, 区域生态系统WUE受到气温、降水量的显著影响(Hu et al., 2010; 仇宽彪和成军峰, 2015; 李肖娟等, 2017), 且WUE对于气温和降水都存在阈值效应, 在阈值范围内WUE随气温的升高而增加, 超过阈值WUE随气温的升高反而减小(Zhang et al., 2012; Xue et al., 2015; Sun et al., 2016; 位贺杰等, 2016); 同样, 降水量适当增加会提高植被WUE, 降水量过高则会降低植被WUE (Tian et al., 2010; Liu et al., 2015).由于区域气候条件、植被生长状况等因素的差异, 植被WUE的时空变化及其对气温和降水的响应都会存在差异, 所以有必要加强对不同区域植被WUE时空格局及其对气温和降水量响应的研究.此外, 在全球气候变化的背景下, 海拔变化可作为导致植物生境空间异质性的重要因素, 且不同海拔的气温梯度可为植被类型对气温变化响应与适应提供一种现实的模拟环境(Wu et al., 2015), 因此, 研究植被WUE随海拔梯度的变化能更好地揭示植被对气候变化的响应. ...
Spatial-temporal dynamics of gross primary productivity, evapotranspiration, and water-use efficiency in the terrestrial ecosystems of the Yangtze River Delta region and their relations to climatic variables 1 2015
... 由于****对生态系统WUE的内涵理解不同及数据获取手段的差异, 计算WUE的方法有所不同(杜晓铮等, 2018).在生态系统或区域尺度上, WUE主要采用总初级生产力(GPP)、净初级生产力(NPP)或净生态系统碳交换(NEE)和蒸散(ET)的比值来计算(张良侠等, 2014).其中GPP和ET之比已被广泛应用于年月等不同时间尺度生态系统碳水耦合特征及其对气候变化响应的研究(Tang et al., 2014; Wang et al., 2015; Xue et al., 2015; 邹杰等, 2018).因此, 本文采用GPP和ET的比值来计算WUE.近年来, 基于过程的生态系统模型和遥感方法已被广泛应用于生态系统WUE的研究中, 不同区域的WUE时空分布格局具有显著异质性(Ito & Inatomi, 2012; Guo et al., 2019), 且不同植被类型的WUE以及不同区域WUE的主导因素存在地域差异性(刘宪锋等, 2018; 赵安周等, 2019; 邹杰和丁建丽, 2019).另有大量研究表明, 区域生态系统WUE受到气温、降水量的显著影响(Hu et al., 2010; 仇宽彪和成军峰, 2015; 李肖娟等, 2017), 且WUE对于气温和降水都存在阈值效应, 在阈值范围内WUE随气温的升高而增加, 超过阈值WUE随气温的升高反而减小(Zhang et al., 2012; Xue et al., 2015; Sun et al., 2016; 位贺杰等, 2016); 同样, 降水量适当增加会提高植被WUE, 降水量过高则会降低植被WUE (Tian et al., 2010; Liu et al., 2015).由于区域气候条件、植被生长状况等因素的差异, 植被WUE的时空变化及其对气温和降水的响应都会存在差异, 所以有必要加强对不同区域植被WUE时空格局及其对气温和降水量响应的研究.此外, 在全球气候变化的背景下, 海拔变化可作为导致植物生境空间异质性的重要因素, 且不同海拔的气温梯度可为植被类型对气温变化响应与适应提供一种现实的模拟环境(Wu et al., 2015), 因此, 研究植被WUE随海拔梯度的变化能更好地揭示植被对气候变化的响应. ...
渭河流域植被WUE遥感估算及其时空特征 2 2016
... 由于****对生态系统WUE的内涵理解不同及数据获取手段的差异, 计算WUE的方法有所不同(杜晓铮等, 2018).在生态系统或区域尺度上, WUE主要采用总初级生产力(GPP)、净初级生产力(NPP)或净生态系统碳交换(NEE)和蒸散(ET)的比值来计算(张良侠等, 2014).其中GPP和ET之比已被广泛应用于年月等不同时间尺度生态系统碳水耦合特征及其对气候变化响应的研究(Tang et al., 2014; Wang et al., 2015; Xue et al., 2015; 邹杰等, 2018).因此, 本文采用GPP和ET的比值来计算WUE.近年来, 基于过程的生态系统模型和遥感方法已被广泛应用于生态系统WUE的研究中, 不同区域的WUE时空分布格局具有显著异质性(Ito & Inatomi, 2012; Guo et al., 2019), 且不同植被类型的WUE以及不同区域WUE的主导因素存在地域差异性(刘宪锋等, 2018; 赵安周等, 2019; 邹杰和丁建丽, 2019).另有大量研究表明, 区域生态系统WUE受到气温、降水量的显著影响(Hu et al., 2010; 仇宽彪和成军峰, 2015; 李肖娟等, 2017), 且WUE对于气温和降水都存在阈值效应, 在阈值范围内WUE随气温的升高而增加, 超过阈值WUE随气温的升高反而减小(Zhang et al., 2012; Xue et al., 2015; Sun et al., 2016; 位贺杰等, 2016); 同样, 降水量适当增加会提高植被WUE, 降水量过高则会降低植被WUE (Tian et al., 2010; Liu et al., 2015).由于区域气候条件、植被生长状况等因素的差异, 植被WUE的时空变化及其对气温和降水的响应都会存在差异, 所以有必要加强对不同区域植被WUE时空格局及其对气温和降水量响应的研究.此外, 在全球气候变化的背景下, 海拔变化可作为导致植物生境空间异质性的重要因素, 且不同海拔的气温梯度可为植被类型对气温变化响应与适应提供一种现实的模拟环境(Wu et al., 2015), 因此, 研究植被WUE随海拔梯度的变化能更好地揭示植被对气候变化的响应. ...
Elevation-dependent variations of tree growth and intrinsic water-use efficiency in Schrenk spruce ( Picea schrenkiana) in the western Tianshan Mountains, China 1 2015
... 由于****对生态系统WUE的内涵理解不同及数据获取手段的差异, 计算WUE的方法有所不同(杜晓铮等, 2018).在生态系统或区域尺度上, WUE主要采用总初级生产力(GPP)、净初级生产力(NPP)或净生态系统碳交换(NEE)和蒸散(ET)的比值来计算(张良侠等, 2014).其中GPP和ET之比已被广泛应用于年月等不同时间尺度生态系统碳水耦合特征及其对气候变化响应的研究(Tang et al., 2014; Wang et al., 2015; Xue et al., 2015; 邹杰等, 2018).因此, 本文采用GPP和ET的比值来计算WUE.近年来, 基于过程的生态系统模型和遥感方法已被广泛应用于生态系统WUE的研究中, 不同区域的WUE时空分布格局具有显著异质性(Ito & Inatomi, 2012; Guo et al., 2019), 且不同植被类型的WUE以及不同区域WUE的主导因素存在地域差异性(刘宪锋等, 2018; 赵安周等, 2019; 邹杰和丁建丽, 2019).另有大量研究表明, 区域生态系统WUE受到气温、降水量的显著影响(Hu et al., 2010; 仇宽彪和成军峰, 2015; 李肖娟等, 2017), 且WUE对于气温和降水都存在阈值效应, 在阈值范围内WUE随气温的升高而增加, 超过阈值WUE随气温的升高反而减小(Zhang et al., 2012; Xue et al., 2015; Sun et al., 2016; 位贺杰等, 2016); 同样, 降水量适当增加会提高植被WUE, 降水量过高则会降低植被WUE (Tian et al., 2010; Liu et al., 2015).由于区域气候条件、植被生长状况等因素的差异, 植被WUE的时空变化及其对气温和降水的响应都会存在差异, 所以有必要加强对不同区域植被WUE时空格局及其对气温和降水量响应的研究.此外, 在全球气候变化的背景下, 海拔变化可作为导致植物生境空间异质性的重要因素, 且不同海拔的气温梯度可为植被类型对气温变化响应与适应提供一种现实的模拟环境(Wu et al., 2015), 因此, 研究植被WUE随海拔梯度的变化能更好地揭示植被对气候变化的响应. ...
Global patterns, trends, and drivers of water use efficiency from 2000 to 2013 3 2015
... 由于****对生态系统WUE的内涵理解不同及数据获取手段的差异, 计算WUE的方法有所不同(杜晓铮等, 2018).在生态系统或区域尺度上, WUE主要采用总初级生产力(GPP)、净初级生产力(NPP)或净生态系统碳交换(NEE)和蒸散(ET)的比值来计算(张良侠等, 2014).其中GPP和ET之比已被广泛应用于年月等不同时间尺度生态系统碳水耦合特征及其对气候变化响应的研究(Tang et al., 2014; Wang et al., 2015; Xue et al., 2015; 邹杰等, 2018).因此, 本文采用GPP和ET的比值来计算WUE.近年来, 基于过程的生态系统模型和遥感方法已被广泛应用于生态系统WUE的研究中, 不同区域的WUE时空分布格局具有显著异质性(Ito & Inatomi, 2012; Guo et al., 2019), 且不同植被类型的WUE以及不同区域WUE的主导因素存在地域差异性(刘宪锋等, 2018; 赵安周等, 2019; 邹杰和丁建丽, 2019).另有大量研究表明, 区域生态系统WUE受到气温、降水量的显著影响(Hu et al., 2010; 仇宽彪和成军峰, 2015; 李肖娟等, 2017), 且WUE对于气温和降水都存在阈值效应, 在阈值范围内WUE随气温的升高而增加, 超过阈值WUE随气温的升高反而减小(Zhang et al., 2012; Xue et al., 2015; Sun et al., 2016; 位贺杰等, 2016); 同样, 降水量适当增加会提高植被WUE, 降水量过高则会降低植被WUE (Tian et al., 2010; Liu et al., 2015).由于区域气候条件、植被生长状况等因素的差异, 植被WUE的时空变化及其对气温和降水的响应都会存在差异, 所以有必要加强对不同区域植被WUE时空格局及其对气温和降水量响应的研究.此外, 在全球气候变化的背景下, 海拔变化可作为导致植物生境空间异质性的重要因素, 且不同海拔的气温梯度可为植被类型对气温变化响应与适应提供一种现实的模拟环境(Wu et al., 2015), 因此, 研究植被WUE随海拔梯度的变化能更好地揭示植被对气候变化的响应. ...
... ; Xue et al., 2015; Sun et al., 2016; 位贺杰等, 2016); 同样, 降水量适当增加会提高植被WUE, 降水量过高则会降低植被WUE (Tian et al., 2010; Liu et al., 2015).由于区域气候条件、植被生长状况等因素的差异, 植被WUE的时空变化及其对气温和降水的响应都会存在差异, 所以有必要加强对不同区域植被WUE时空格局及其对气温和降水量响应的研究.此外, 在全球气候变化的背景下, 海拔变化可作为导致植物生境空间异质性的重要因素, 且不同海拔的气温梯度可为植被类型对气温变化响应与适应提供一种现实的模拟环境(Wu et al., 2015), 因此, 研究植被WUE随海拔梯度的变化能更好地揭示植被对气候变化的响应. ...
Assessment on water use efficiency under climate change and heterogeneous carbon dioxide in China terrestrial ecosystems 1 2012
... 由于****对生态系统WUE的内涵理解不同及数据获取手段的差异, 计算WUE的方法有所不同(杜晓铮等, 2018).在生态系统或区域尺度上, WUE主要采用总初级生产力(GPP)、净初级生产力(NPP)或净生态系统碳交换(NEE)和蒸散(ET)的比值来计算(张良侠等, 2014).其中GPP和ET之比已被广泛应用于年月等不同时间尺度生态系统碳水耦合特征及其对气候变化响应的研究(Tang et al., 2014; Wang et al., 2015; Xue et al., 2015; 邹杰等, 2018).因此, 本文采用GPP和ET的比值来计算WUE.近年来, 基于过程的生态系统模型和遥感方法已被广泛应用于生态系统WUE的研究中, 不同区域的WUE时空分布格局具有显著异质性(Ito & Inatomi, 2012; Guo et al., 2019), 且不同植被类型的WUE以及不同区域WUE的主导因素存在地域差异性(刘宪锋等, 2018; 赵安周等, 2019; 邹杰和丁建丽, 2019).另有大量研究表明, 区域生态系统WUE受到气温、降水量的显著影响(Hu et al., 2010; 仇宽彪和成军峰, 2015; 李肖娟等, 2017), 且WUE对于气温和降水都存在阈值效应, 在阈值范围内WUE随气温的升高而增加, 超过阈值WUE随气温的升高反而减小(Zhang et al., 2012; Xue et al., 2015; Sun et al., 2016; 位贺杰等, 2016); 同样, 降水量适当增加会提高植被WUE, 降水量过高则会降低植被WUE (Tian et al., 2010; Liu et al., 2015).由于区域气候条件、植被生长状况等因素的差异, 植被WUE的时空变化及其对气温和降水的响应都会存在差异, 所以有必要加强对不同区域植被WUE时空格局及其对气温和降水量响应的研究.此外, 在全球气候变化的背景下, 海拔变化可作为导致植物生境空间异质性的重要因素, 且不同海拔的气温梯度可为植被类型对气温变化响应与适应提供一种现实的模拟环境(Wu et al., 2015), 因此, 研究植被WUE随海拔梯度的变化能更好地揭示植被对气候变化的响应. ...
海河流域生态水分利用效率时空变化及其与气候因子的相关性分析 1 2019
... 由于****对生态系统WUE的内涵理解不同及数据获取手段的差异, 计算WUE的方法有所不同(杜晓铮等, 2018).在生态系统或区域尺度上, WUE主要采用总初级生产力(GPP)、净初级生产力(NPP)或净生态系统碳交换(NEE)和蒸散(ET)的比值来计算(张良侠等, 2014).其中GPP和ET之比已被广泛应用于年月等不同时间尺度生态系统碳水耦合特征及其对气候变化响应的研究(Tang et al., 2014; Wang et al., 2015; Xue et al., 2015; 邹杰等, 2018).因此, 本文采用GPP和ET的比值来计算WUE.近年来, 基于过程的生态系统模型和遥感方法已被广泛应用于生态系统WUE的研究中, 不同区域的WUE时空分布格局具有显著异质性(Ito & Inatomi, 2012; Guo et al., 2019), 且不同植被类型的WUE以及不同区域WUE的主导因素存在地域差异性(刘宪锋等, 2018; 赵安周等, 2019; 邹杰和丁建丽, 2019).另有大量研究表明, 区域生态系统WUE受到气温、降水量的显著影响(Hu et al., 2010; 仇宽彪和成军峰, 2015; 李肖娟等, 2017), 且WUE对于气温和降水都存在阈值效应, 在阈值范围内WUE随气温的升高而增加, 超过阈值WUE随气温的升高反而减小(Zhang et al., 2012; Xue et al., 2015; Sun et al., 2016; 位贺杰等, 2016); 同样, 降水量适当增加会提高植被WUE, 降水量过高则会降低植被WUE (Tian et al., 2010; Liu et al., 2015).由于区域气候条件、植被生长状况等因素的差异, 植被WUE的时空变化及其对气温和降水的响应都会存在差异, 所以有必要加强对不同区域植被WUE时空格局及其对气温和降水量响应的研究.此外, 在全球气候变化的背景下, 海拔变化可作为导致植物生境空间异质性的重要因素, 且不同海拔的气温梯度可为植被类型对气温变化响应与适应提供一种现实的模拟环境(Wu et al., 2015), 因此, 研究植被WUE随海拔梯度的变化能更好地揭示植被对气候变化的响应. ...
Improvements of the MODIS terrestrial gross and net primary production global data set 1 2005
... 在Modis Reprojection Tool (MRT)软件中对为期15年的MODIS数据进行批量拼接以及重投影.MODIS GPP和ET产品数据在世界多个区域通过通量塔站点数据进行了验证, 其准确性在多项研究中得到了证实(Zhao et al., 2005; Mu et al., 2011; Jia et al., 2012; Chen et al., 2017). ...
 ,
, ,1,*, 张明芳2, 刘世荣1
 新窗口打开|下载原图ZIP|生成PPT
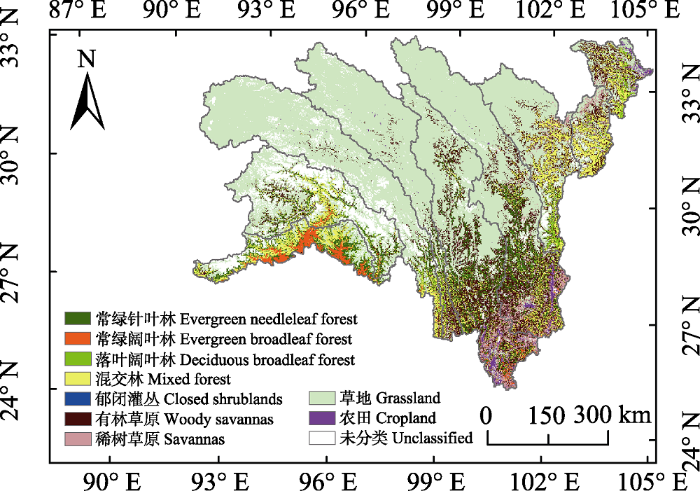 新窗口打开|下载原图ZIP|生成PPT
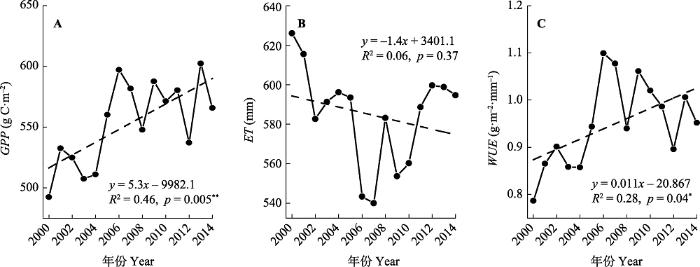 新窗口打开|下载原图ZIP|生成PPT
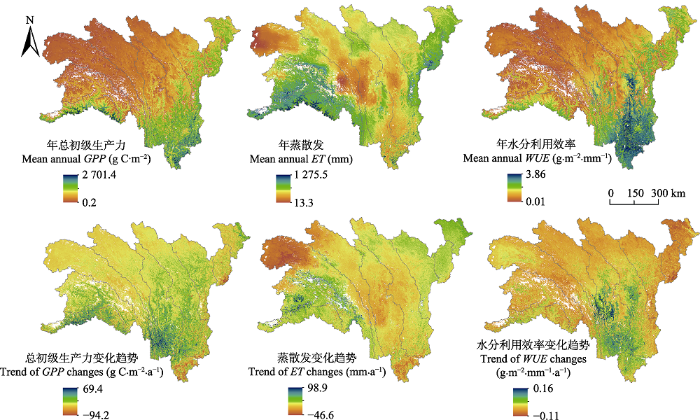 新窗口打开|下载原图ZIP|生成PPT
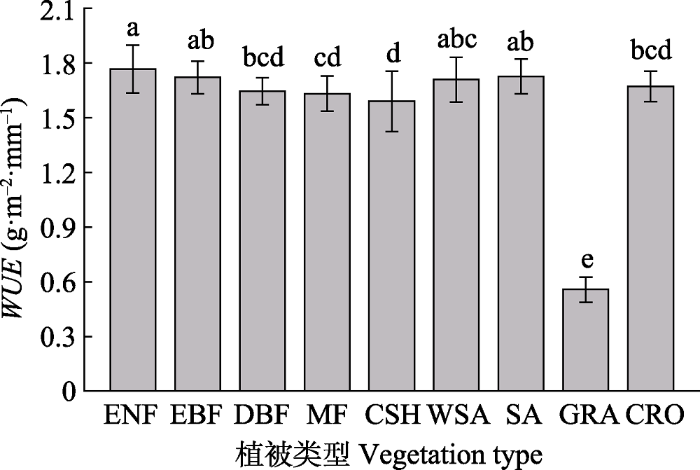 新窗口打开|下载原图ZIP|生成PPT
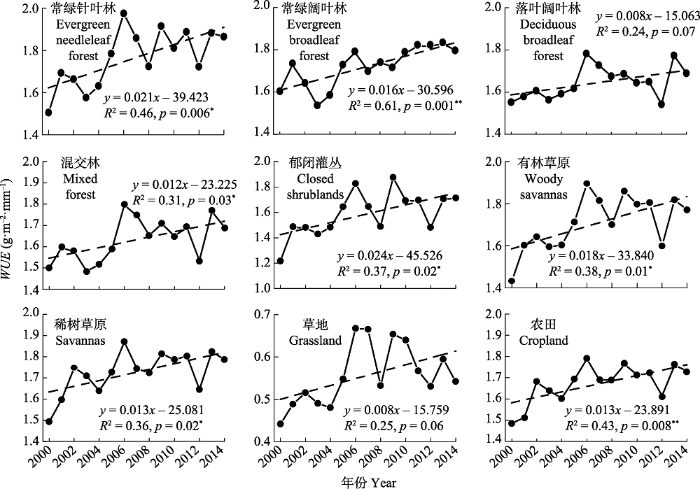 新窗口打开|下载原图ZIP|生成PPT
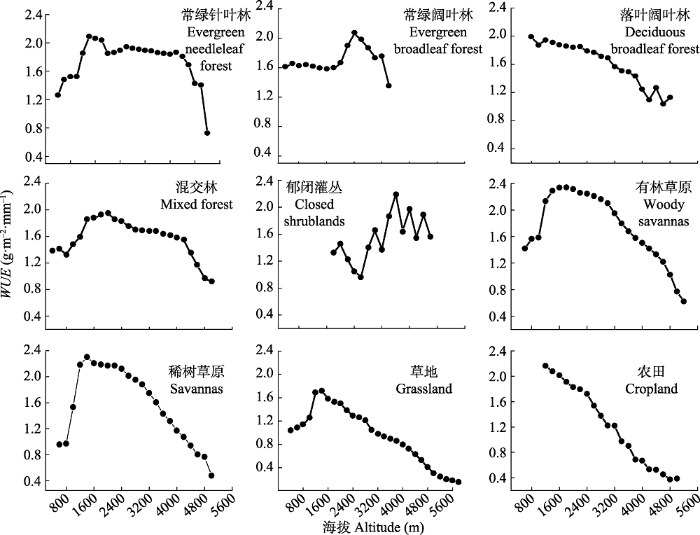 新窗口打开|下载原图ZIP|生成PPT
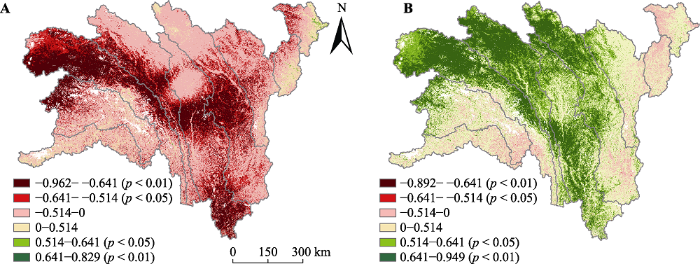 新窗口打开|下载原图ZIP|生成PPT
 新窗口打开|下载原图ZIP|生成PPT
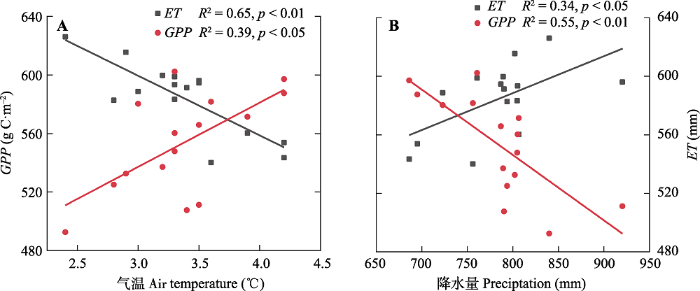 新窗口打开|下载原图ZIP|生成PPT

