Temporal and spatial variation characteristics of China shrubland net primary production and its response to climate change from 2001 to 2013
WANGYa-Lin1,2,*,, GONGRong2, WUFeng-Min1, FANWen-Wu1 1Chongqing Geomatics Center, Chongqing 401121, China2Academy of Disaster Reduction and Emergency Management, Beijing Normal University, State Key Laboratory of Earth Surface Processes and Resource Ecology, Beijing Normal University, Beijing 100875, China 通讯作者:* E-mail: wangyalin@mail.bnu.edu.cn 收稿日期:2016-05-24 修回日期:2017-08-26 网络出版日期:2017-09-30 版权声明:2017植物生态学报编辑部本文是遵循CCAL协议的开放存取期刊,引用请务必标明出处。 基金资助:国家自然科学基金(41171445)
关键词:CASA模型;净初级生产力;灌木;碳平衡;气候变化 Abstract Aims Net primary production (NPP) is the input to terrestrial ecosystem carbon pool. Climate and land use change affect NPP significantly. Shrublands occupy more than 20% of the terrestrial area of China, and their NPP is comparable to those of the forests. Our objective was to estimate China shrubland NPP from 2001 to 2013, and to analyze its variation and response to climate change.Methods We used a Carnegie-Ames-Stanford Approach (CASA) model to estimate the NPP of six shrubland types in China from 2001 to 2013. Furthermore, we used Theil-Sen slope combined with Mann-kendall test to analyze its spatial variation and a linear regression of one-variable model to analyze its inter- and intra-annual variation. Finally, a multi-factor linear regression model was used to analyze its response to climate change.Important findings We found the annual mean NPP of China shrubland was 281.82 g•m-2•a-1. The subtropical evergreen shrubland has the maximum NPP of 420.47 g•m-2•a-1, while the high cold desert shrubland has the minimum NPP of 52.65 g•m-2•a-1. The countrywide shrublands NPP increased at the rate of 1.23 g•m-2•a-1, the relative change rate was 5.99%. The temperate deciduous shrubland NPP increased the fastest with a speed of 3.05 g•m-2•a-1 and subalpine evergreen shrubland had a decreasing trend with a speed of -0.73 g•m-2•a-1. Moreover, the other four shrublands NPP had a growing trend, only subalpine deciduous shrubland NPP did not change significantly. The response of NPP to climate change of different seasons varies to different shrubland types. In general, the NPP variation was mainly affected by precipitation, and the spring warming also contributed to it. The increase of countrywide shrubland NPP may promote its contribution to the regional ecosystem function.
通过一元线性回归分析, 获得了不同灌木类型NPP在2001-2013年间的变化速率k (表4)。温带落叶灌木和亚热带常绿灌木均呈显著的增长趋势, 其增长率分别为3.05 g•m-2•a-1 (p < 0.01)和1.76 g•m-2•a-1 (p < 0.05), 两种荒漠灌木(高寒荒漠灌木半灌木和温带荒漠灌木半灌木)分别以0.56 g•m-2•a-1 (p < 0.01)和0.97 g•m-2•a-1 (p < 0.05)的速率显著增长。而对于两种亚高山灌木来说, 亚高山常绿灌木以-0.73 g•m-2•a-1 (p < 0.1)的速率显著下降, 而亚高山落叶灌木的NPP并没有显著的变化趋势。从全国的尺度来看,中国灌木生态系统的NPP在2001-2013年间以 1.23 g•m-2•a-1 (p < 0.05)的速率显著增加。 Table 2 表2 表2中国灌木生态系统2001-2013年间平均净初级生产力和平均净初级生产力总量(平均值±标准偏差) Table 2China shrubland mean net primary production and mean total net primary production from 2001 to 2013 (mean ± SD)
灌木类型 Shrubland type
平均净初级生产力 Mean net primary production (g•m-2•a-1)
平均净初级生产力总量 Mean total net primary production (Tg)
DCDSMT
252.28 ± 8.64
20.44 ± 0.70
DCDSTP
247.24 ± 14.12
37.91 ± 2.17
DSRTHC
52.65 ± 3.05
0.65 ± 0.04
DSRTTP
72.33 ± 5.67
14.69 ± 1.15
EVGNMT
288.07 ± 11.84
51.40 ± 2.11
EVGNST
420.47 ± 16.96
188.98 ± 7.62
CONTRY
281.82 ± 10.13
302.94 ± 10.89
DCDSMT, DCDSTP, DSRTHC, DSRTTP, EVGNMT, EVGNST and CONTRY represent subalpine deciduous, temperate deciduous, high cold desert, temperate desert, subalpine evergreen, subtropical evergreen, and countrywide shrubland, respectively.DCDSMT、DCDSTP、DSRTHC、DSRTTP、EVGNMT、EVGNST和CONTRY分别代表亚高山落叶灌木、温带落叶灌木、高寒荒漠灌木半灌木、温带荒漠灌木半灌木、亚高山常绿灌木、亚热带常绿灌木和全国灌木。 新窗口打开 Table 3 表3 表3中国灌木生态系统2001-2013年间净初级生产力空间变化趋势统计结果 Table 3Statistical results of China shrubland net primary production spatial variation from 2001 to 2013
TS
Z
净初级生产力的变化趋势 Trend of net primary production
占总面积比例 Percentage of total area (%)
>0
>1.96
显著增加 Significantly increased
13.14
>0
-1.96-1.96
不显著增加 Insignificantly increased
58.09
0
-1.96-1.96
基本不变 Essentially unchanged
0.01
<0
-1.96-1.96
不显著减小 Insignificantly decreased
26.81
<0
<-1.96
显著减小 Significantly decreased
1.95
TS, Theil-Sen slope statistic; Z, Mann-Kendall statistic.TS, Theil-Sen slope趋势分析的统计量; Z, Mann-Kendall统计量。 新窗口打开 显示原图|下载原图ZIP|生成PPT 图1中国灌木生态系统2001-2013年间净初级生产力(NPP)变化速率空间分布。图中的圈代表不同灌木类型的分布区域。DCDSMT、DCDSTP、DSRTHC、DSRTTP、EVGNMT和EVGNST分别代表亚高山落叶灌木、温带落叶灌木、高寒荒漠灌木半灌木、温带荒漠灌木半灌木、亚高山常绿灌木和亚热带常绿灌木。亚高山落叶灌木和亚高山常绿灌木用一个圈表示, 是因为两者之间没有明显的分界线, 亚高山落叶灌木主要分布在圆圈的上半部分, 而亚高山常绿灌木则主要分布在下半部分。 -->Fig. 1Spatial distribution of China shrubland net primary production (NPP) change rate from 2001 to 2013. The circles indicate the distribution of different shrubland types. DCDSMT, DCDSTP, DSRTHC, DSRTTP, EVGNMT and EVGNST represent subalpine deciduous, temperate deciduous, high cold desert, temperate desert, subalpine evergreen, and subtropical evergreen shrubland, respectively. DCDSMT and EVGNMT are in one circle because there is no clear boundary between them, DCDSMT mainly distributed in the upper half of the circle and EVNGMT distributed in the bottom half. -->
显示原图|下载原图ZIP|生成PPT 图2中国灌木生态系统2001-2013年间净初级生产力(NPP)变化趋势的空间分布。 -->Fig. 2Spatial characteristics of China shrubland net primary production (NPP) trend from 2001 to 2013. -->
我们利用13k / NPP2001计算NPP的相对变化率ΔR (表4), NPP2001指2001年的NPP。温带荒漠灌木半灌木具有最大的相对变化率19.95%, 而亚高山常绿灌木的相对变化速率最小, 为-3.26%, 其他类型灌木NPP的相对变化速率介于2.02%和17.68%之间。从全国的尺度来看, 其相对变化率为5.99%。 Table 4 表4 表4中国灌木生态系统2001-2013年间净初级生产力(NPP)的年际和季节变化趋势 Table 4Annual and seasonal trend of shrubland net primary production (NPP) in China from 2001 to 2013
灌木类型 Shrubland type
年际变化 Interannual change
春 Spring
夏 Summer
秋 Autumn
冬 Winter
k (g•m-2•a-1)
ΔR (%)
k (g•m-2•a-1)
DCDSMT
0.37
2.02
0.16
0.39
-0.21
NA
DCDSTP
3.05***
17.68
0.61***
1.90**
0.36**
NA
DSRTHC
0.56***
15.58
0.10***
0.45***
0.02
NA
DSRTTP
0.97**
19.95
0.09*
0.69**
0.09**
NA
EVGNMT
-0.73*
-3.26
-0.07
0.12
-0.64***
-0.01
EVGNST
1.76**
5.71
0.83*
0.31
0.66**
-0.00
CONTRY
1.23**
5.99
0.43**
0.61*
0.22*
-0.00
DCDSMT, DCDSTP, DSRTHC, DSRTTP, EVGNMT, EVGNST and CONTRY represent subalpine deciduous, temperate deciduous, high cold desert, temperate desert, subalpine evergreen, subtropical evergreen, and countrywide shrubland, respectively. k is annual change rate; ΔR is relative change rate, calculated by k*13/NPP of 2001; NA means the NPP in winter is meaningless; *, p < 0.10; **, p < 0.05; ***, p < 0.01.DCDSMT、DCDSTP、DSRTHC、DSRTTP、EVGNMT、EVGNST和CONTRY分别代表亚高山落叶灌木、温带落叶灌木、高寒荒漠灌木半灌木、温带荒漠灌木半灌木、亚高山常绿灌木、亚热带常绿灌木和全国灌木。k为年际变化速率; ΔR表示相对变化率, 其值等于k乘以13年再除以2001年的NPP; NA表示冬季的NPP无意义; *, p < 0.10; **, p < 0.05; ***, p < 0.01。 新窗口打开 我们还分析了不同类型灌木NPP在不同季节的变化情况(表4)。两种荒漠类型的灌木在春季和夏季都呈显著增长趋势, 且温带荒漠灌木半灌木NPP在秋季也显著增加。温带落叶灌木在春、夏、秋三个季节均呈增长趋势。亚高山常绿灌木NPP仅在秋季有显著变化趋势, 以-0.64 g•m-2•a-1 (p < 0.01)的速率下降, 而另一种亚高山灌木, 亚高山落叶灌木的NPP在不同季节中均无显著变化。亚热带常绿灌木的NPP在春、秋两季均呈增长趋势, 而在夏、冬两季无显著变化趋势。从全国尺度来看, 除了冬季的NPP无显著变化外, 其余3个季度的NPP都呈显著增长趋势。
3 讨论
3.1 本文研究结果与其他模拟结果的比较
将本文的研究结果与其他人基于CASA模型的研究结果进行了比较(表5)。本文研究显示中国灌木生态系统的年平均NPP为281.82 g•m-2•a-1, 此结果大于Piao等(2005)的结果, 而比朱文泉等(2007)和李贵才(2004)的结果要小。考虑到不同的研究所设定的最大光能利用率ε*不同, 而最大光能利用率又是决定NPP的一个重要参数, 如果使用本文的最大光能利用率将其他研究结果进行换算, 那么我们的研究结果与Piao等(2005)的结果273.08 g•m-2•a-1相近, 而低于朱文泉等(2007)以及李贵才(2004)的结果。 Table 5 表5 表5本文结果与其他研究结果的比较 Table 5Comparisons with other study results
大量的研究表明北半球包括中国在内的植被活动经历了20世纪八九十年代的快速增加阶段后, 在90年代中末期增长停滞甚至反转(Zhou et al., 2001; Piao, 2003; Peng et al., 2011; Piao et al., 2011; Wang et al., 2011), 中国植被的NPP在这段时期也经历了同样的增长过程(Liang et al., 2015; Piao et al., 2005)。Liang等(2015)利用CASA模型模拟了1982- 2010年间中国植被的净初级生产力, 总体上中国植被的NPP以0.011 Pg•a-1 (相对变化速率0.42%)的速率增加, 但是分阶段来看, 中国植被的NPP在经历了20世纪90年代的快速增长后, 到1999-2010年陷入停滞阶段。而我们的研究结果表明, 在全国植被NPP的增长出现了停滞以后, 灌木的NPP仍在持续增长, 其增长速率达到0.001 3 Pg•a-1 (1.23 g•m-2•a-1, 相对变化速率0.46%), 由于全国灌木NPP的总量远小于全国植被NPP的总量, 其变化速率的绝对值小于1982- 2010年间中国植被NPP的增长速率(0.011 Pg•a-1), 但其相对变化速率0.46%大于中国植被NPP在1982- 2010年间0.42%的增长速率, 且略小于1982-2010年间灌木生态系统NPP的增长速率1.95 g•m-2•a-1 (Liang et al., 2015), 说明中国灌木生态系统的NPP在全国植被NPP增长停滞以后仍保持着较快的增长速率。
3.4 中国灌木生态系统NPP的空间分布差异
中国灌木生态系统2001-2013年间平均NPP的空间分布有显著的差异(图3), 总体上从西北向东南呈递减趋势, 这与全国植被增强型植被指数(EVI) 的空间分布趋势相吻合, 这主要是由于年降水量的空间分布不均所引起的(Liang et al., 2015; Wang et al., 2016)。在中国南方大部分地区, 年平均NPP都大于400 g•m-2•a-1, 而西北部地区的NPP大多数区域都小于100 g•m-2•a-1, 这种差异主要是由降水量的显著差异所造成的。而青藏高原、华北和东北地区的年平均NPP在200-400 g•m-2•a-1之间。此外, 还有一小部分地区的NPP非常大, 大于600 g•m-2•a-1, 主要分布于云南省的西南部以及海南省的小部分地区, 这些地区属于热带地区, 气温高且降水十分丰富, 非常适合植被生长。 显示原图|下载原图ZIP|生成PPT 图3中国灌木生态系统2001-2013年间平均净初级生产力的空间分布。 -->Fig. 3Spatial distribution of shrubland annual mean net primary production in China from 2001 to 2013. -->
陆地植被的生产力对气候的变化十分敏感, 大量研究已表明气温、降水是抑制植被光合作用的主要因子(Piao et al., 2005; Peng et al., 2011; Liang et al., 2015)。气候变化对NPP的影响有多种方式, 如温度升高可使土壤湿度降低或者增加植物自身呼吸, 从而使NPP降低, 尤其在干旱地区, 较少的降水会使土壤湿度降低, 从而使得NPP降低, 但不同的气候因子在不同的生态系统中对NPP影响的重要性也不同(Melillo et al., 1993)。Liang等(2015)研究发现1982-2010年中国大部分地区植被NPP的变化主要受到气温变化的影响, 而干旱半干旱区域植被NPP主要受到降水的影响。在我们的研究结果中, 不同地区、不同灌木类型对气候变化的响应也存在着差异(表7)。 我们用基于广义最小二乘法拟合的线性回归模型对每年的NPP与季节平均气温和季节降水量进行多元回归, 获取其回归参数来分析气候因子与每年的NPP之间的关系。由回归模型预测的值与CASA模型模拟值进行比较, 其数值点几乎分布于1:1的对角线上, 说明该回归模型能够很好地对NPP进行预测(图4)。 春季气温升高可以使生长季提前, 从而使植物有更多时间来固定更多的物质(Zhou et al., 2001; Piao, 2003)。高寒荒漠灌木半灌木、温带落叶灌木以及亚热带常绿灌木春季气温与其NPP存在着正相关关系(表7)。温带落叶灌木春季NPP的增加趋势与其春季气温的变化趋势不一致, 其春季NPP的增加可能是由于其冬季降水量显著地大幅增加所致, 因为在该地区冬季气温寒冷增加的降水都会以冰雪的形式保存到来年的春季, 相当于增加了春季的降水(表6, 表7)。而春季降水量的增加可使荒漠和温带草 原等类型植被的生长季开始时间提前, 推迟高山草甸和冻原的生长季开始时间, 而对森林无显著影响, 这主要是与其生长环境相关, 荒漠和温带草原等植被通常分布在干旱半干旱地区, 春季降水量的增加可以为其在春旱期提供更多的水分, 而其他生长在降水量较充足地区的植被在春季主要受到气温的影响(Jeong et al., 2011)。这在我们的结果中也得到了证实, 两种荒漠类型灌木的NPP与春季降水呈显著正相关关系, 而两种亚高山及亚热带常绿灌木的NPP与春季降水量呈显著负相关关系(表7)。 Table 6 表6 表6中国灌木生态系统2001-2013年间降水量和平均气温的变化趋势 Table 6Temporal trend of China shrubland precipitation and mean temperature from 2001 to 2013
灌木类型 Shrubland type
平均气温变化速率 Mean temperature change rate (℃∙a-1)
降水量变化速率 Precipitation change rate (mm∙a-1)
年 Annual
春 Spring
夏 Summer
秋 Autumn
冬 Winter
年 Annual
春 Spring
夏 Summer
秋 Autumn
冬 Winter
DCDSMT
0.026 2
0.068 7**
0.079 9**
0.011 1
-0.005 6
2.94*
0.53
1.97
0.54
0.26
DCDSTP
-0.048 6*
-0.045 1
0.016 7
-0.009 1
-0.013 0***
7.57**
0.90
5.24**
0.77
1.04**
DSRTHC
0.020 7
0.060 7*
0.043 5***
0.040 6*
-0.019 0
1.34**
0.24
0.64
0.07
0.17**
DSRTTP
-0.009 9
0.082 3
-0.013 0
0.032 0
-0.069 8**
0.38
-0.28
1.11
-0.11
0.32
EVGNMT
0.030 3
0.053 3*
0.079 8**
0.006 3
0.001 2
-4.10*
-0.29
-3.24
-0.32
-0.36
EVGNST
-0.016 7
-0.004 5
0.038 0**
-0.001 7
-0.075 9*
-4.22
-0.81
-7.67*
5.21**
-2.46**
CONTRY
-0.006 6
0.039 9
0.018 3
-0.002 0
-0.081 1**
-0.02
-0.24
-0.80
1.25**
-0.49**
DCDSMT, DCDSTP, DSRTHC, DSRTTP, EVGNMT, EVGNST and CONTRY represent subalpine deciduous, temperate deciduous, high cold desert, temperate desert, subalpine evergreen, subtropical evergreen, and countrywide shrubland respectively. *, ** and *** represent p-value less than 0.1, 0.05 and 0.01, respectively.DCDSMT、DCDSTP、DSRTHC、DSRTTP、EVGNMT、EVGNST和CONTRY分别代表亚高山落叶灌木、温带落叶灌木、高寒荒漠灌木半灌木、温带荒漠灌木半灌木、亚高山常绿灌木、亚热带常绿灌木和全国灌木。**和***分别表示p值小于0.10、0.05和0.01。 新窗口打开 Table 7 表7 表7不同灌木生态系统年净初级生产力对季节降水和季节平均气温进行回归的系数 Table 7Regression coefficients of annual net primary production on seasonal mean temperature and precipitation
灌木类型 Shrubland type
截距 Intercept
气温系数Air temperature coefficients (g∙m-2∙a-1∙℃-1)
降水量系数Precipitation coefficients (g∙m-2∙a-1∙mm-1)
春 Spring
夏 Summer
秋 Autumn
冬 Winter
春 Spring
夏 Summer
秋 Autumn
冬 Winter
DCDSMT
199.60***
7.68***
-19.31***
-1.19***
0.08**
-0.51***
DCDSTP
91.12***
3.76***
7.83***
0.51***
-0.40***
DSRTHC
7.45
1.62**
0.17*
0.26***
DSRTTP
46.70***
0.20**
0.26***
-0.14*
EVGNMT
554.26 ***
-8.15**
-9.97***
-0.24**
-0.29***
-0.21**
-1.45***
EVGNST
-86.92
43.47***
-10.19***
2.57*
-0.21***
-0.10***
0.23***
-0.35***
DCDSMT, DCDSTP, DSRTHC, DSRTTP, EVGNMT, EVGNST and CONTRY represent subalpine deciduous, temperate deciduous, high cold desert, temperate desert, subalpine evergreen, subtropical evergreen, and countrywide shrubland, respectively. *, ** and *** represent p-value less than 0.1, 0.05 and 0.01, respectively.DCDSMT、DCDSTP、DSRTHC、DSRTTP、EVGNMT、EVGNST和CONTRY分别代表亚高山落叶灌木、温带落叶灌木、高寒荒漠灌木半灌木、温带荒漠灌木半灌木、亚高山常绿灌木、亚热带常绿灌木和全国灌木。**和***分别表示p值小于0.10、0.05和0.01。 新窗口打开 显示原图|下载原图ZIP|生成PPT 图4净初级生产力与气候因子回归模型预测值与CASA模型估算值的对比图。DCDSMT、DCDSTP、DSRTHC、DSRTTP、EVGNMT和EVGNST分别代表亚高山落叶灌木、温带落叶灌木、高寒荒漠灌木半灌木、温带荒漠灌木半灌木、亚高山常绿灌木和亚热带常绿灌木。 -->Fig. 4Regression of annual net primary production of the six shrubland types on pertinent climate variables: Regression predicted vs. simulated values. DCDSMT, DCDSTP, DSRTHC, DSRTTP, EVGNMT and EVGNST represent subalpine deciduous, temperate deciduous, high cold desert, temperate desert, subalpine evergreen and subtropical evergreen shrubland, respectively. -->
在夏季, 中国灌木生态系统的NPP主要受到降水的影响(表7), 这与已有的研究(Piao et al., 2005; Liang et al., 2015)结果相似。干旱炎热的夏季会使植被的生长减弱(Angert et al., 2005; Lotsch et al., 2005; Park & Sohn, 2010), 夏季较高的气温会导致较高的大气需水量, 即较大的潜在蒸散, 从而造成更多的水分通过土壤蒸发的途径散失掉, 因此需要更多的降水供植被生长, 并最终导致夏季植被的NPP受降水量的影响(Liang et al., 2015)。 秋季气温的升高会使生长季延长(Piao, 2003; Jeong et al., 2011), 而秋季降水量增加对植被生长季结束时间的影响与春季降水有相似的作用(Piao et al., 2006b)。秋季植被的生长进入其生长季的衰退时期, 其需水量减小, 同时降水量的增加会伴随着云的增加, 从而导致太阳辐射的减小以及气温的降低(Piao et al., 2006b), 最终导致生长季提前结束。在我们的结果中也发现温带荒漠灌木半灌木和两种亚高山类型灌木与秋季降水量负相关。但亚热带常绿灌木的NPP与秋季气温成反比, 与秋季降水成正比, 是由于亚热带常绿灌木分布于亚热带地区, 气温通常较高, 植被的生长期更长, 气温的升高会导致更严重的干旱, 因而降水的增加可以促进其NPP的增加。 冬季气温升高与春季气温升高的作用相同, 可以提早生长季开始的时间(Robeson, 2004), 从而使植被有更多时间进行光合作用, 并最终使春季NPP增加。温带落叶灌木和亚热带常绿灌木的每年的NPP都与冬季的气温成正比, 而温带落叶、亚高山常绿以及亚热带常绿灌木冬季降水量与每年的NPP呈负相关关系, 可能与亚热带地区降水增多常伴随着云量增加, 从而导致太阳辐射减小以及温度降低有关(Piao et al., 2006b), 此外, 冬季降水在中国北方较寒冷地区都将以雪的形式保留在地表, 冬季降水的增加将导致地表积雪的增加, 来年将消耗更多的能量和时间融化积雪, 最终使生长季开始的时间推迟。 此外, 亚高山常绿灌木的气候因子的变化不能很好地解释其NPP的变化, 说明还存在着其他因素对NPP的变化产生影响, 这与中国灌木生态系统EVI的变化趋势相一致(Wang et al., 2016)。 气温和降水是影响植被NPP变化的主要因素, 但同时也不可忽略其他因素对植被NPP变化的影响, 如太阳辐射的增加会显著地增加植被的NPP (Piao et al., 2006a)。研究表明中国在1990年以后的太阳辐射呈增加趋势(齐月等, 2014)。此外, 地形也可以通过改变局部的水热条件来改变区域的气候, 最终影响植被的生长(Peng et al., 2012)。青藏高原地区的生态环境十分脆弱, 对土壤侵蚀、气候变化等因子的影响十分敏感, 本研究中的两种亚高山类型灌木均分布在青藏高原上, 其NPP的变化对环境因子的响应就显得更加复杂。 灌木在中国有着相当广泛的分布, 其在中国陆地生态系统碳循环中起着举足轻重的作用(Piao et al., 2009), 在20世纪90年代以来包括中国在内的全球植被生长停滞甚至反转的大背景下, 中国灌木生态系统NPP在2001-2013年间仍保持了较快的增长趋势, 这将使之在未来区域生态系统碳循环中发挥越来越重要的作用。
AllenCD, MacaladyAK, ChenchouniH, BacheletD, McDowellN, VennetierM, KitzbergerT, RiglingA, BreshearsDD, HoggEH, GonzalezP, FenshamR, ZhangZ, CastroJ, DemidovaN, LimJH, AllardG, RunningSW, SemerciA, CobbN (2010). A global overview of drought and heat-induced tree mortality reveals emerging climate change risks for forests. Forest Ecology and Management, 259, 660-684. [本文引用: 1]
[2]
AngertA, BiraudS, BonfilsC, HenningCC, BuermannW, PinzonJ, TuckerCJ, FungI (2005). Drier summers cancel out the CO2 uptake enhancement induced by warmer springs. Proceedings of the National Academy of Sciences of the United States of America, 102, 10823-10827. [本文引用: 1]
[3]
BreshearsDD, CobbNS, RichPM, PriceKP, AllenCD, BaliceRG, RommeWH, KastensJH, FloydML, BelnapJ, AndersonJJ, MyersOB, MeyerCW (2005). Regional vegetation die-off in response to global-change-type drought. Proceedings of the National Academy of Sciences of the United States of America, 102, 15144-15148. [本文引用: 1]
[4]
CanadellJ, JacksonR, EhleringerJ, MooneyHA, SalaOE, SchulzeE-D (1996). Maximum rooting depth of vegetation types at the global scale. Oecologia, 108, 583-595. [本文引用: 1]
[5]
ChapinFS, MatsonPA, MooneyHA (2002). Principles of Terrestrial Ecosystem Ecology. Springer , New York. [本文引用: 2]
[6]
DaiA (2011). Drought under global warming: A review. Wiley Interdisciplinary Reviews: Climate Change, 2, 45-65. [本文引用: 1]
[7]
DingY, RenG, ZhaoZ, XuY, LuoY, LiQ, ZhangJ (2007). Detection, causes and projection of climate change over China: An overview of recent progress. Advances in Atmospheric Sciences, 24, 954-971. [本文引用: 1]
[8]
DubovykO, LandmannT, ErasmusBFN, TewesA, SchellbergJ (2015). Monitoring vegetation dynamics with medium resolution MODIS-EVI time series at sub-regional scale in southern Africa. International Journal of Applied Earth Observation and Geoinformation, 38, 175-183. [本文引用: 1]
[9]
FangJY, PiaoSL, FieldCB, PanYD, GuoQH, ZhouLM, PengCH, TaoS (2003). Increasing net primary production in China from 1982 to 1999. Frontiers in Ecology and the Environment, 1, 293-297. [本文引用: 1]
[10]
FensholtR, ProudSR (2012). Evaluation of earth observation based global long term vegetation trends—Comparing GIMMS and MODIS global NDVI time series. Remote Sensing of Environment, 119, 131-147. [本文引用: 1]
[11]
FieldCB (1998). Primary production of the biosphere: Integrating terrestrial and oceanic components. Science, 281, 237-240. [本文引用: 1]
[12]
FieldCB, RandersonJT, MalmstromCM (1995). Global Net Primary Production: Combining Ecology and Remote Sensing. Remote Sensing of Environment, 51, 74-88. [本文引用: 1]
[13]
GaoQ, YuM, ZhangX, XuH, HuangY (2005). Modelling seasonal and diurnal dynamics of stomatal conductance of plants in a semiarid environment. Functional Plant Biology, 32, 583-598. [本文引用: 1]
[14]
GaoQ, YuM, ZhouC (2013). Detecting the differences in responses of stomatal conductance to moisture stresses between deciduous shrubs and Artemisia subshrubs. PLOS ONE, 8, e84200. doi:10.1371/journal.pone.0084200.
[15]
GaoQ, ZhaoP, ZengX, CaiX, ShenW (2002). A model of stomatal conductance to quantify the relationship between leaf transpiration, microclimate and soil water stress. Plant, Cell & Environment, 25, 1373-1381. [本文引用: 1]
[16]
GaoQZ, WanYF, Li YE LinED, YangK, JinagcunWZ, WangBS, LiWF (2007). Grassland net primary productivity and its spatiotemporal distribution in Northern Tibet: A study with CASA model. Chinese Journal of Applied Ecology, 18, 2526-2532. (in Chinese with English abstract)[高清竹, 万运帆, 李玉娥, 林而达, 杨凯, 江村旺扎, 王宝山, 李文福 (2007). 基于CASA模型的藏北地区草地植被净第一性生产力及其时空格局 . 应用生态学报, 18, 2526-2532.] [本文引用: 1]
[17]
HansenJ, RuedyR, SatoM, LoK (2010). Global surface temperature change. Reviews of Geophysics, 48, RG4004. doi:10.1029/2010RG000345. [本文引用: 1]
[18]
HickeJA, AsnerGP, RandersonJT, LosS, BirdseyR, JenkinsJC, TuckerC, FieldC (2002). Trends in North American net primary productivity derived from satellite observations, 1982-1998. Global Biogeochemical Cycles, 16, 2-1-2-14. doi:10.1029/2001GB001550. [本文引用: 1]
[19]
HipelKW, McLeodAI (1994). Time Series Modelling of Water Resources and Environmental Systems. Elsevier Science, New York. [本文引用: 1]
[20]
HuntER (1994). Relationship between woody biomass and PAR conversion efficiency for estimating net primary production from NDVI. International Journal of Remote Sensing, 15, 1725-1729.
[21]
JacksonRB, CanadellJ, EhleringerJR, MooneyHA, SalaOE, SchulzeED (1996). A global analysis of root distributions for terrestrial biomes. Oecologia, 108, 389-411. [本文引用: 1]
[22]
JeongSJ, HoCH, GimHJ, BrownME (2011). Phenology shifts at start vs. end of growing season in temperate vegetation over the Northern Hemisphere for the period 1982-2008. Global Change Biology, 17, 2385-2399. [本文引用: 2]
[23]
JiangW, YuanL, WangW, CaoR, ZhangY, ShenW (2015). Spatio-temporal analysis of vegetation variation in the Yellow River Basin. Ecological Indicators, 51, 117-126. [本文引用: 1]
[24]
KurzWA, DymondCC, StinsonG, RampleyGJ, NeilsonET, CarrollAL, EbataT, SafranyikL (2008). Mountain pine beetle and forest carbon feedback to climate change. Nature, 452, 987-990. [本文引用: 1]
[25]
LiGC (2004). Estimation of Chinese Terrestrial Net Primary Production Using LUE Model and MODIS Data. PhD dissertation, Institute of Remote Sensing Applications, The Chinese Academy of Sciences, Beijing. 60-72. (in Chinese with English abstract)[李贵才 (2004). 基于MODIS数据和光能利用率模型的中国陆地净初级生产力估算研究 . 博士学位论文, 中国科学院遥感应用研究所, 北京. 60-72.]
[26]
LiangW, YangY, FanD, GuanHD, ZhangT, LongD, ZhouY, BaiD (2015). Analysis of spatial and temporal patterns of net primary production and their climate controls in China from 1982 to 2010. Agricultural and Forest Meteorology, 204, 22-36. [本文引用: 7]
[27]
LotschA, FriedlMA, AndersonBT, TuckerCJ (2005). Response of terrestrial ecosystems to recent Northern Hemispheric drought. Geophysical Research Letters, 32, 1-5. [本文引用: 1]
[28]
MelilloJM, McGuireAD, KicklighterDW, Moore IiiB, VorosmartyCJ, SchlossAL (1993). Global climate change and terrestrial net primary production. Nature, 363, 234-240. [本文引用: 1]
[29]
MonserudRA, MarshallJD (1999). Allometric crown relations in three northern Idaho conifer species. Canadian Journal of Forest Research, 29, 521-535. [本文引用: 1]
[30]
ParkH-S, SohnBJ (2010). Recent trends in changes of vegetation over East Asia coupled with temperature and rainfall variations. Journal of Geophysical Research, 115, D14101. doi: 10.1029/2009JD012752. [本文引用: 1]
[31]
PengJ, LiuZ, LiuY, WuJ, HanY (2012). Trend analysis of vegetation dynamics in Qinghai-Tibet Plateau using Hurst Exponent. Ecological Indicators, 14, 28-39. [本文引用: 1]
[32]
PengSL, GuoZH, WangBS (2000). Use of GIS and RS to estimate the light utilization efficiency of the vegetation in Guangdong, China. Acta Ecologica Sinica, 20, 903-909. (in Chinese with English abstract)[彭少麟, 郭志华, 王伯荪 (2000). 利用GIS和RS估算广东植被光利用率 . 生态学报, 20, 903-909.
[33]
PengSS, ChenAP, XuL, CaoCX, FangJY, MyneniRB, PinzonJE, TuckerCJ, PiaoSL (2011). Recent change of vegetation growth trend in China. Environmental Research Letters, 6, 044027. [本文引用: 3]
[34]
PiaoS (2003). Interannual variations of monthly and seasonal normalized difference vegetation index ( NDVI) in China from 1982 to 1999. Journal of Geophysical Research, 108, 4401. [本文引用: 3]
[35]
PiaoS, FangJ, CiaisP, PeylinP, HuangY, SitchS, WangT (2009). The carbon balance of terrestrial ecosystems in China. Nature, 458, 1009-1013. [本文引用: 2]
[36]
PiaoS, FangJ, JinshengHE (2006a). Variations in vegetation net primary production in the Qinghai-Xizang Plateau, China, from 1982 to 1999. Climatic Change, 74, 253-267. [本文引用: 1]
[37]
PiaoS, FangJ, ZhouL, CiaisP, ZhuB (2006b). Variations in satellite-derived phenology in China’s temperate vegetation. Global Change Biology, 12, 672-685. [本文引用: 3]
[38]
PiaoS, FangJ, ZhouL, ZhuB, TanK, TaoS (2005). Changes in vegetation net primary productivity from 1982 to 1999 in China. Global Biogeochemical Cycles, 19, GB2027. doi:10.1029/2004GB002274. [本文引用: 7]
[39]
PiaoS, WangX, CiaisP, ZhuB, WangT, LiuJ (2011). Changes in satellite-derived vegetation growth trend in temperate and boreal Eurasia from 1982 to 2006. Global Change Biology, 17, 3228-3239. [本文引用: 2]
[40]
PotterC, KloosterS, GenoveseV (2012). Net primary production of terrestrial ecosystems from 2000 to 2009. Climatic Change, 115, 365-378.
[41]
PotterC, KloosterS, MyneniR, GenoveseV, TanPN, KumarV (2003). Continental-scale comparisons of terrestrial carbon sinks estimated from satellite data and ecosystem modeling 1982-1998. Global and Planetary Change, 39, 201-213.
[42]
PotterCS, RandersonJT, FieldCB, MatsonPA, VitousekPM, MooneyHA, KloosterSA (1993). Terrestrial ecosystem production—A Process Model-based on global satellite and surface data. Global Biogeochemical Cycles, 7, 811-841. [本文引用: 4]
[43]
QiY, FangSB, ZhouWZ (2014). Variation and spatial distribution of surface solar radiation in China over recent 50 years. Acta Ecologica Sinica, 34, 7444-7453. (in Chinese with English abstract)[齐月, 房世波, 周文佐 (2014). 近50年来中国地面太阳辐射变化及其空间分布 . 生态学报, 34, 7444-7453. [本文引用: 1]
[44]
RobesonSM (2004). Trends in time-varying percentiles of daily minimum and maximum temperature over North America. Bulletin of the American Meteorological Society, 31, 4379-4384. [本文引用: 1]
[45]
ShiXZ, YuDS (2004). Soil database of 1:1,000,000 digital soil survey and reference system of the Chinese Genetic Soil Classification System. Soil Survey Horizons, 45, 111-148. [本文引用: 1]
[46]
The Editorial Committee of Vegetation Map of China,Chinese Academy of Sciences(2007).Vegetation Map of the People’s Republic of China 1:1 000 000. Geological Publishing House, Beijing. (in Chinese)[中国科学院中国植被图编辑委员会 (2007).中华人民共和国植被图1:1 000 000. 地质出版社, 北京.]
[47]
WangX, PiaoS, CiaisP, LiJ, FriedlingsteinP, KovenC, ChenA (2011). Spring temperature change and its implication in the change of vegetation growth in North America from 1982 to 2006. Proceedings of the National Academy of Sciences of the United State of America, 108, 1240-1245. [本文引用: 1]
[48]
WangYL, GaoQ, LiuT, TianYQ, YuM (2016). The greenness of major shrublands in China increased from 2001 to 2013. Remote Sensing, 8, 121. [本文引用: 3]
[49]
WilsonBF (1995). Shrub stems: Form and function. In: Gartner BL ed. Plant Stems. Academic Press, San Diego, USA. 91-102. [本文引用: 1]
[50]
XiaoJF, ZhuangQL (2007). Drought effects on large fire activity in Canadian and Alaskan forests. Environmental Research Letters, 2, 44003. doi: 10.1088/1748-9326/2/4/044003. [本文引用: 1]
[51]
XuX, PiaoS, WangX, ChenA, CiaisP, MyneniRB (2012). Spatio-temporal patterns of the area experiencing negative vegetation growth anomalies in China over the last three decades. Environmental Research Letters, 7, 035701. doi: 10.1088/1748-9326/7/3/035701. [本文引用: 1]
[52]
ZhangF, ZhouGS, WangYH (2008). Dynamics simulation of net primary productivity by a satellite data-driven CASA model in inner Mongolian typical steppe, China. Journal of Plant Ecology (Chinese Version), 32, 786-797. (in Chinese with English abstract)[张峰, 周广胜, 王玉辉 (2008). 基于CASA模型的内蒙古典型草原植被净初级生产力动态模拟 . 植物生态学报, 32, 786-797.] [本文引用: 1]
[53]
ZhangY, GaoQ, XuL, YuM, TianY (2014). Shrubs proliferated within a six-year exclosure in a temperate grassland -- Spatiotemporal relationships between vegetation and soil variables. Sciences in Cold and Arid Regions, 6, 139-149. [本文引用: 1]
[54]
ZhaoM, HeinschFA, NemaniRR, RunningSW (2005). Improvements of the MODIS terrestrial gross and net primary production global data set. Remote Sensing of Environment, 95, 164-176. [本文引用: 1]
[55]
ZhaoM, RunningSW (2010). Drought-induced reduction in global terrestrial net primary production from 2000 through 2009. Science, 329, 940-943. [本文引用: 2]
[56]
ZhouL, TuckerCJ, KaufmannRK, SlaybackD, Shabanov NV, MyneniRB (2001). Variations in northern vegetation activity inferred from satellite data of vegetation index during 1981 to 1999. Journal of Geophysical Research, 106, 20069-20083. [本文引用: 2]
[57]
ZhuW, PanY, HeH, YuD, HuH (2006). Simulation of maximum light use efficiency for some typical vegetation types in China. Chinese Science Bulletin, 51, 457-463.
[58]
ZhuWQ, PanYZ, ZhangJS (2007). Estimation of net primary productivity of Chinese terrestrial vegetation based on remote sensing. Journal of Plant Ecology (Chinese Version), 31, 413-424. (in Chinese with English abstract)[朱文泉, 潘耀忠, 张锦水 (2007). 中国陆地植被净级生产力遥感估算 . 植物生态学报, 31, 413-424.] [本文引用: 2]
A global overview of drought and heat-induced tree mortality reveals emerging climate change risks for forests. 1 2010
... 中国植被的NPP在经历了20世纪八九十年代的快速增长期后陷入停滞(Piao et al., 2005; Liang et al., 2015).进入21世纪以来, 全球植被NPP因干旱在2000-2009年间呈减小趋势(Zhao & Running, 2010).研究预测21世纪全球气温仍将持续升高, 干旱化会越来越严重(Ding et al., 2007; Hansen et al., 2010; Dai, 2011; Xu et al., 2012).干旱可以导致树木死亡(Allen et al., 2010)、虫害爆发(Breshears et al., 2005; Kurz et al., 2008)、引发火灾(Xiao & Zhuang, 2007)、降低植被NPP (Zhao & Running, 2010)等等, 这些都将对生态系统的结构和功能产生重大的影响. ...
Drier summers cancel out the CO2 uptake enhancement induced by warmer springs. 1 2005
... 在夏季, 中国灌木生态系统的NPP主要受到降水的影响(表7), 这与已有的研究(Piao et al., 2005; Liang et al., 2015)结果相似.干旱炎热的夏季会使植被的生长减弱(Angert et al., 2005; Lotsch et al., 2005; Park & Sohn, 2010), 夏季较高的气温会导致较高的大气需水量, 即较大的潜在蒸散, 从而造成更多的水分通过土壤蒸发的途径散失掉, 因此需要更多的降水供植被生长, 并最终导致夏季植被的NPP受降水量的影响(Liang et al., 2015). ...
Regional vegetation die-off in response to global-change-type drought. 1 2005
... 中国植被的NPP在经历了20世纪八九十年代的快速增长期后陷入停滞(Piao et al., 2005; Liang et al., 2015).进入21世纪以来, 全球植被NPP因干旱在2000-2009年间呈减小趋势(Zhao & Running, 2010).研究预测21世纪全球气温仍将持续升高, 干旱化会越来越严重(Ding et al., 2007; Hansen et al., 2010; Dai, 2011; Xu et al., 2012).干旱可以导致树木死亡(Allen et al., 2010)、虫害爆发(Breshears et al., 2005; Kurz et al., 2008)、引发火灾(Xiao & Zhuang, 2007)、降低植被NPP (Zhao & Running, 2010)等等, 这些都将对生态系统的结构和功能产生重大的影响. ...
Maximum rooting depth of vegetation types at the global scale. 1 1996
... 灌木与其他类型植被相比, 具有较深的根系, 且倾向于把更多的根生物量分布于较深层的土壤中, 以吸收更深层土壤中的养分和水分(Canadell et al., 1996; Jackson et al., 1996), 具有更小的叶面积与边材截面积之比(Monserud & Marshall, 1999; Chapin et al., 2002), 具有直径更小、长度更短的导管, 以便更好地抵抗空穴化现象(Wilson, 1995), 其叶片的气孔导度对土壤和空气中的水分胁迫也具有更强的抵抗力(Gao et al., 2002, 2005, 2013), 因而灌木对干旱有更好的抵抗力.中国的灌木林分布面积十分广泛, 约占国土面积的20% (Piao et al., 2009).在全球持续变暖、干旱不断加剧的大背景下, 人们期望具有很强抗旱能力的灌木在区域乃至全球生态系统中发挥越来越重要的作用. ...
Principles of Terrestrial Ecosystem Ecology. Springer 2 2002
... 植被净初级生产力(NPP)是指植被每年净生产的新物质的量(总初级生产力减去植物呼吸), 包括新生物量、烃类挥发、根分泌和向菌根转运的部分(Chapin et al., 2002).它是陆地生态系统碳汇的一个主要决定因子, 同时也是生态过程的关键调节因子(Field, 1998). ...
... 灌木与其他类型植被相比, 具有较深的根系, 且倾向于把更多的根生物量分布于较深层的土壤中, 以吸收更深层土壤中的养分和水分(Canadell et al., 1996; Jackson et al., 1996), 具有更小的叶面积与边材截面积之比(Monserud & Marshall, 1999; Chapin et al., 2002), 具有直径更小、长度更短的导管, 以便更好地抵抗空穴化现象(Wilson, 1995), 其叶片的气孔导度对土壤和空气中的水分胁迫也具有更强的抵抗力(Gao et al., 2002, 2005, 2013), 因而灌木对干旱有更好的抵抗力.中国的灌木林分布面积十分广泛, 约占国土面积的20% (Piao et al., 2009).在全球持续变暖、干旱不断加剧的大背景下, 人们期望具有很强抗旱能力的灌木在区域乃至全球生态系统中发挥越来越重要的作用. ...
Drought under global warming: A review. 1 2011
... 中国植被的NPP在经历了20世纪八九十年代的快速增长期后陷入停滞(Piao et al., 2005; Liang et al., 2015).进入21世纪以来, 全球植被NPP因干旱在2000-2009年间呈减小趋势(Zhao & Running, 2010).研究预测21世纪全球气温仍将持续升高, 干旱化会越来越严重(Ding et al., 2007; Hansen et al., 2010; Dai, 2011; Xu et al., 2012).干旱可以导致树木死亡(Allen et al., 2010)、虫害爆发(Breshears et al., 2005; Kurz et al., 2008)、引发火灾(Xiao & Zhuang, 2007)、降低植被NPP (Zhao & Running, 2010)等等, 这些都将对生态系统的结构和功能产生重大的影响. ...
Detection, causes and projection of climate change over China: An overview of recent progress. 1 2007
... 中国植被的NPP在经历了20世纪八九十年代的快速增长期后陷入停滞(Piao et al., 2005; Liang et al., 2015).进入21世纪以来, 全球植被NPP因干旱在2000-2009年间呈减小趋势(Zhao & Running, 2010).研究预测21世纪全球气温仍将持续升高, 干旱化会越来越严重(Ding et al., 2007; Hansen et al., 2010; Dai, 2011; Xu et al., 2012).干旱可以导致树木死亡(Allen et al., 2010)、虫害爆发(Breshears et al., 2005; Kurz et al., 2008)、引发火灾(Xiao & Zhuang, 2007)、降低植被NPP (Zhao & Running, 2010)等等, 这些都将对生态系统的结构和功能产生重大的影响. ...
Monitoring vegetation dynamics with medium resolution MODIS-EVI time series at sub-regional scale in southern Africa. 1 2015
Increasing net primary production in China from 1982 to 1999. 1 2003
... 由于人们无法在区域尺度上直接测量植被的NPP, 早期对于植被NPP的测量都是基于站点典型植被的测量然后再推算到区域尺度, 其在大尺度范围的应用存在着一定的局限性, 随着科学技术的发展, 利用基于遥感数据驱动的计算机模型估算NPP的方法得到了广泛的应用.CASA模型(Potter et al., 1993; Field et al., 1995)是目前在国内外广泛应用并得到认可的一个NPP模型(Potter et al., 1993; Hicke et al., 2002; Fang et al., 2003; Piao et al., 2005; 高清竹等, 2007; 张峰等, 2008). ...
Evaluation of earth observation based global long term vegetation trends—Comparing GIMMS and MODIS global NDVI time series. 1 2012
Primary production of the biosphere: Integrating terrestrial and oceanic components. 1 1998
... 植被净初级生产力(NPP)是指植被每年净生产的新物质的量(总初级生产力减去植物呼吸), 包括新生物量、烃类挥发、根分泌和向菌根转运的部分(Chapin et al., 2002).它是陆地生态系统碳汇的一个主要决定因子, 同时也是生态过程的关键调节因子(Field, 1998). ...
Global Net Primary Production: Combining Ecology and Remote Sensing. 1 1995
... 由于人们无法在区域尺度上直接测量植被的NPP, 早期对于植被NPP的测量都是基于站点典型植被的测量然后再推算到区域尺度, 其在大尺度范围的应用存在着一定的局限性, 随着科学技术的发展, 利用基于遥感数据驱动的计算机模型估算NPP的方法得到了广泛的应用.CASA模型(Potter et al., 1993; Field et al., 1995)是目前在国内外广泛应用并得到认可的一个NPP模型(Potter et al., 1993; Hicke et al., 2002; Fang et al., 2003; Piao et al., 2005; 高清竹等, 2007; 张峰等, 2008). ...
Modelling seasonal and diurnal dynamics of stomatal conductance of plants in a semiarid environment. 1 2005
... 灌木与其他类型植被相比, 具有较深的根系, 且倾向于把更多的根生物量分布于较深层的土壤中, 以吸收更深层土壤中的养分和水分(Canadell et al., 1996; Jackson et al., 1996), 具有更小的叶面积与边材截面积之比(Monserud & Marshall, 1999; Chapin et al., 2002), 具有直径更小、长度更短的导管, 以便更好地抵抗空穴化现象(Wilson, 1995), 其叶片的气孔导度对土壤和空气中的水分胁迫也具有更强的抵抗力(Gao et al., 2002, 2005, 2013), 因而灌木对干旱有更好的抵抗力.中国的灌木林分布面积十分广泛, 约占国土面积的20% (Piao et al., 2009).在全球持续变暖、干旱不断加剧的大背景下, 人们期望具有很强抗旱能力的灌木在区域乃至全球生态系统中发挥越来越重要的作用. ...
Detecting the differences in responses of stomatal conductance to moisture stresses between deciduous shrubs and 2013
A model of stomatal conductance to quantify the relationship between leaf transpiration, microclimate and soil water stress. 1 2002
... 灌木与其他类型植被相比, 具有较深的根系, 且倾向于把更多的根生物量分布于较深层的土壤中, 以吸收更深层土壤中的养分和水分(Canadell et al., 1996; Jackson et al., 1996), 具有更小的叶面积与边材截面积之比(Monserud & Marshall, 1999; Chapin et al., 2002), 具有直径更小、长度更短的导管, 以便更好地抵抗空穴化现象(Wilson, 1995), 其叶片的气孔导度对土壤和空气中的水分胁迫也具有更强的抵抗力(Gao et al., 2002, 2005, 2013), 因而灌木对干旱有更好的抵抗力.中国的灌木林分布面积十分广泛, 约占国土面积的20% (Piao et al., 2009).在全球持续变暖、干旱不断加剧的大背景下, 人们期望具有很强抗旱能力的灌木在区域乃至全球生态系统中发挥越来越重要的作用. ...
基于CASA模型的藏北地区草地植被净第一性生产力及其时空格局 1 2007
... 由于人们无法在区域尺度上直接测量植被的NPP, 早期对于植被NPP的测量都是基于站点典型植被的测量然后再推算到区域尺度, 其在大尺度范围的应用存在着一定的局限性, 随着科学技术的发展, 利用基于遥感数据驱动的计算机模型估算NPP的方法得到了广泛的应用.CASA模型(Potter et al., 1993; Field et al., 1995)是目前在国内外广泛应用并得到认可的一个NPP模型(Potter et al., 1993; Hicke et al., 2002; Fang et al., 2003; Piao et al., 2005; 高清竹等, 2007; 张峰等, 2008). ...
Global surface temperature change. 1 2010
... 中国植被的NPP在经历了20世纪八九十年代的快速增长期后陷入停滞(Piao et al., 2005; Liang et al., 2015).进入21世纪以来, 全球植被NPP因干旱在2000-2009年间呈减小趋势(Zhao & Running, 2010).研究预测21世纪全球气温仍将持续升高, 干旱化会越来越严重(Ding et al., 2007; Hansen et al., 2010; Dai, 2011; Xu et al., 2012).干旱可以导致树木死亡(Allen et al., 2010)、虫害爆发(Breshears et al., 2005; Kurz et al., 2008)、引发火灾(Xiao & Zhuang, 2007)、降低植被NPP (Zhao & Running, 2010)等等, 这些都将对生态系统的结构和功能产生重大的影响. ...
Trends in North American net primary productivity derived from satellite observations, 1982-1998. 1 2002
... 由于人们无法在区域尺度上直接测量植被的NPP, 早期对于植被NPP的测量都是基于站点典型植被的测量然后再推算到区域尺度, 其在大尺度范围的应用存在着一定的局限性, 随着科学技术的发展, 利用基于遥感数据驱动的计算机模型估算NPP的方法得到了广泛的应用.CASA模型(Potter et al., 1993; Field et al., 1995)是目前在国内外广泛应用并得到认可的一个NPP模型(Potter et al., 1993; Hicke et al., 2002; Fang et al., 2003; Piao et al., 2005; 高清竹等, 2007; 张峰等, 2008). ...
Time Series Modelling of Water Resources and Environmental Systems. Elsevier Science, 1 1994
Changes in vegetation net primary productivity from 1982 to 1999 in China. 7 2005
... 由于人们无法在区域尺度上直接测量植被的NPP, 早期对于植被NPP的测量都是基于站点典型植被的测量然后再推算到区域尺度, 其在大尺度范围的应用存在着一定的局限性, 随着科学技术的发展, 利用基于遥感数据驱动的计算机模型估算NPP的方法得到了广泛的应用.CASA模型(Potter et al., 1993; Field et al., 1995)是目前在国内外广泛应用并得到认可的一个NPP模型(Potter et al., 1993; Hicke et al., 2002; Fang et al., 2003; Piao et al., 2005; 高清竹等, 2007; 张峰等, 2008). ...
... 中国植被的NPP在经历了20世纪八九十年代的快速增长期后陷入停滞(Piao et al., 2005; Liang et al., 2015).进入21世纪以来, 全球植被NPP因干旱在2000-2009年间呈减小趋势(Zhao & Running, 2010).研究预测21世纪全球气温仍将持续升高, 干旱化会越来越严重(Ding et al., 2007; Hansen et al., 2010; Dai, 2011; Xu et al., 2012).干旱可以导致树木死亡(Allen et al., 2010)、虫害爆发(Breshears et al., 2005; Kurz et al., 2008)、引发火灾(Xiao & Zhuang, 2007)、降低植被NPP (Zhao & Running, 2010)等等, 这些都将对生态系统的结构和功能产生重大的影响. ...
... 大量的研究表明北半球包括中国在内的植被活动经历了20世纪八九十年代的快速增加阶段后, 在90年代中末期增长停滞甚至反转(Zhou et al., 2001; Piao, 2003; Peng et al., 2011; Piao et al., 2011; Wang et al., 2011), 中国植被的NPP在这段时期也经历了同样的增长过程(Liang et al., 2015; Piao et al., 2005).Liang等(2015)利用CASA模型模拟了1982- 2010年间中国植被的净初级生产力, 总体上中国植被的NPP以0.011 Pg•a-1 (相对变化速率0.42%)的速率增加, 但是分阶段来看, 中国植被的NPP在经历了20世纪90年代的快速增长后, 到1999-2010年陷入停滞阶段.而我们的研究结果表明, 在全国植被NPP的增长出现了停滞以后, 灌木的NPP仍在持续增长, 其增长速率达到0.001 3 Pg•a-1 (1.23 g•m-2•a-1, 相对变化速率0.46%), 由于全国灌木NPP的总量远小于全国植被NPP的总量, 其变化速率的绝对值小于1982- 2010年间中国植被NPP的增长速率(0.011 Pg•a-1), 但其相对变化速率0.46%大于中国植被NPP在1982- 2010年间0.42%的增长速率, 且略小于1982-2010年间灌木生态系统NPP的增长速率1.95 g•m-2•a-1 (Liang et al., 2015), 说明中国灌木生态系统的NPP在全国植被NPP增长停滞以后仍保持着较快的增长速率. ...
Net primary production of terrestrial ecosystems from 2000 to 2009. 2012
Continental-scale comparisons of terrestrial carbon sinks estimated from satellite data and ecosystem modeling 1982-1998. 2003
Terrestrial ecosystem production—A Process Model-based on global satellite and surface data. 4 1993
... 由于人们无法在区域尺度上直接测量植被的NPP, 早期对于植被NPP的测量都是基于站点典型植被的测量然后再推算到区域尺度, 其在大尺度范围的应用存在着一定的局限性, 随着科学技术的发展, 利用基于遥感数据驱动的计算机模型估算NPP的方法得到了广泛的应用.CASA模型(Potter et al., 1993; Field et al., 1995)是目前在国内外广泛应用并得到认可的一个NPP模型(Potter et al., 1993; Hicke et al., 2002; Fang et al., 2003; Piao et al., 2005; 高清竹等, 2007; 张峰等, 2008). ...
... 模型(Potter et al., 1993; Hicke et al., 2002; Fang et al., 2003; Piao et al., 2005; 高清竹等, 2007; 张峰等, 2008). ...
... CASA (Carnegie-Ames-Standford Approach)模型(Potter et al., 1993)是一个基于光能利用率的模型, 植被的NPP主要由植被吸收的光合有效辐射(APAR)和光能转化率(ε)两个变量来确定: ...
Spring temperature change and its implication in the change of vegetation growth in North America from 1982 to 2006. 1 2011
... 大量的研究表明北半球包括中国在内的植被活动经历了20世纪八九十年代的快速增加阶段后, 在90年代中末期增长停滞甚至反转(Zhou et al., 2001; Piao, 2003; Peng et al., 2011; Piao et al., 2011; Wang et al., 2011), 中国植被的NPP在这段时期也经历了同样的增长过程(Liang et al., 2015; Piao et al., 2005).Liang等(2015)利用CASA模型模拟了1982- 2010年间中国植被的净初级生产力, 总体上中国植被的NPP以0.011 Pg•a-1 (相对变化速率0.42%)的速率增加, 但是分阶段来看, 中国植被的NPP在经历了20世纪90年代的快速增长后, 到1999-2010年陷入停滞阶段.而我们的研究结果表明, 在全国植被NPP的增长出现了停滞以后, 灌木的NPP仍在持续增长, 其增长速率达到0.001 3 Pg•a-1 (1.23 g•m-2•a-1, 相对变化速率0.46%), 由于全国灌木NPP的总量远小于全国植被NPP的总量, 其变化速率的绝对值小于1982- 2010年间中国植被NPP的增长速率(0.011 Pg•a-1), 但其相对变化速率0.46%大于中国植被NPP在1982- 2010年间0.42%的增长速率, 且略小于1982-2010年间灌木生态系统NPP的增长速率1.95 g•m-2•a-1 (Liang et al., 2015), 说明中国灌木生态系统的NPP在全国植被NPP增长停滞以后仍保持着较快的增长速率. ...
The greenness of major shrublands in China increased from 2001 to 2013. 3 2016
... 其中, y为NPP或气候因子; a为截距; x表示年; k为斜率, 表示变化的趋势; ε为残差.由于时间序列可能会存在自相关问题, 我们采用广义最小二乘法来对回归方程进行拟合, 因为广义最小二乘法可以处理时间序列中的自相关性(Zhang et al., 2014; Wang et al., 2016). ...
... 中国灌木生态系统2001-2013年间平均NPP的空间分布有显著的差异(图3), 总体上从西北向东南呈递减趋势, 这与全国植被增强型植被指数(EVI) 的空间分布趋势相吻合, 这主要是由于年降水量的空间分布不均所引起的(Liang et al., 2015; Wang et al., 2016).在中国南方大部分地区, 年平均NPP都大于400 g•m-2•a-1, 而西北部地区的NPP大多数区域都小于100 g•m-2•a-1, 这种差异主要是由降水量的显著差异所造成的.而青藏高原、华北和东北地区的年平均NPP在200-400 g•m-2•a-1之间.此外, 还有一小部分地区的NPP非常大, 大于600 g•m-2•a-1, 主要分布于云南省的西南部以及海南省的小部分地区, 这些地区属于热带地区, 气温高且降水十分丰富, 非常适合植被生长. ...
... 此外, 亚高山常绿灌木的气候因子的变化不能很好地解释其NPP的变化, 说明还存在着其他因素对NPP的变化产生影响, 这与中国灌木生态系统EVI的变化趋势相一致(Wang et al., 2016). ...
1
... 灌木与其他类型植被相比, 具有较深的根系, 且倾向于把更多的根生物量分布于较深层的土壤中, 以吸收更深层土壤中的养分和水分(Canadell et al., 1996; Jackson et al., 1996), 具有更小的叶面积与边材截面积之比(Monserud & Marshall, 1999; Chapin et al., 2002), 具有直径更小、长度更短的导管, 以便更好地抵抗空穴化现象(Wilson, 1995), 其叶片的气孔导度对土壤和空气中的水分胁迫也具有更强的抵抗力(Gao et al., 2002, 2005, 2013), 因而灌木对干旱有更好的抵抗力.中国的灌木林分布面积十分广泛, 约占国土面积的20% (Piao et al., 2009).在全球持续变暖、干旱不断加剧的大背景下, 人们期望具有很强抗旱能力的灌木在区域乃至全球生态系统中发挥越来越重要的作用. ...
Drought effects on large fire activity in Canadian and Alaskan forests. 1 2007
... 中国植被的NPP在经历了20世纪八九十年代的快速增长期后陷入停滞(Piao et al., 2005; Liang et al., 2015).进入21世纪以来, 全球植被NPP因干旱在2000-2009年间呈减小趋势(Zhao & Running, 2010).研究预测21世纪全球气温仍将持续升高, 干旱化会越来越严重(Ding et al., 2007; Hansen et al., 2010; Dai, 2011; Xu et al., 2012).干旱可以导致树木死亡(Allen et al., 2010)、虫害爆发(Breshears et al., 2005; Kurz et al., 2008)、引发火灾(Xiao & Zhuang, 2007)、降低植被NPP (Zhao & Running, 2010)等等, 这些都将对生态系统的结构和功能产生重大的影响. ...
Spatio-temporal patterns of the area experiencing negative vegetation growth anomalies in China over the last three decades. 1 2012
... 中国植被的NPP在经历了20世纪八九十年代的快速增长期后陷入停滞(Piao et al., 2005; Liang et al., 2015).进入21世纪以来, 全球植被NPP因干旱在2000-2009年间呈减小趋势(Zhao & Running, 2010).研究预测21世纪全球气温仍将持续升高, 干旱化会越来越严重(Ding et al., 2007; Hansen et al., 2010; Dai, 2011; Xu et al., 2012).干旱可以导致树木死亡(Allen et al., 2010)、虫害爆发(Breshears et al., 2005; Kurz et al., 2008)、引发火灾(Xiao & Zhuang, 2007)、降低植被NPP (Zhao & Running, 2010)等等, 这些都将对生态系统的结构和功能产生重大的影响. ...
基于CASA模型的内蒙古典型草原植被净初级生产力动态模拟 1 2008
... 由于人们无法在区域尺度上直接测量植被的NPP, 早期对于植被NPP的测量都是基于站点典型植被的测量然后再推算到区域尺度, 其在大尺度范围的应用存在着一定的局限性, 随着科学技术的发展, 利用基于遥感数据驱动的计算机模型估算NPP的方法得到了广泛的应用.CASA模型(Potter et al., 1993; Field et al., 1995)是目前在国内外广泛应用并得到认可的一个NPP模型(Potter et al., 1993; Hicke et al., 2002; Fang et al., 2003; Piao et al., 2005; 高清竹等, 2007; 张峰等, 2008). ...
Shrubs proliferated within a six-year exclosure in a temperate grassland -- Spatiotemporal relationships between vegetation and soil variables. 1 2014
... 其中, y为NPP或气候因子; a为截距; x表示年; k为斜率, 表示变化的趋势; ε为残差.由于时间序列可能会存在自相关问题, 我们采用广义最小二乘法来对回归方程进行拟合, 因为广义最小二乘法可以处理时间序列中的自相关性(Zhang et al., 2014; Wang et al., 2016). ...
Improvements of the MODIS terrestrial gross and net primary production global data set. 1 2005
... 本文所用的遥感数据FPAR (8-day, 1-km, MOD15A2)数据来源于NASA数据中心(http://ladsweb.nascom.nasa.gov).首先对FPAR数据中缺失或者不可信(主要指有冰、雪覆盖以及云等大气状况所影响)的栅格利用其相应的质量控制文件进行插值处理(Zhao et al., 2005), 再用最大值合成法将8天的FPAR数据集合成月数据集. ...
Drought-induced reduction in global terrestrial net primary production from 2000 through 2009. 2 2010
... 中国植被的NPP在经历了20世纪八九十年代的快速增长期后陷入停滞(Piao et al., 2005; Liang et al., 2015).进入21世纪以来, 全球植被NPP因干旱在2000-2009年间呈减小趋势(Zhao & Running, 2010).研究预测21世纪全球气温仍将持续升高, 干旱化会越来越严重(Ding et al., 2007; Hansen et al., 2010; Dai, 2011; Xu et al., 2012).干旱可以导致树木死亡(Allen et al., 2010)、虫害爆发(Breshears et al., 2005; Kurz et al., 2008)、引发火灾(Xiao & Zhuang, 2007)、降低植被NPP (Zhao & Running, 2010)等等, 这些都将对生态系统的结构和功能产生重大的影响. ...
 , 龚容
, 龚容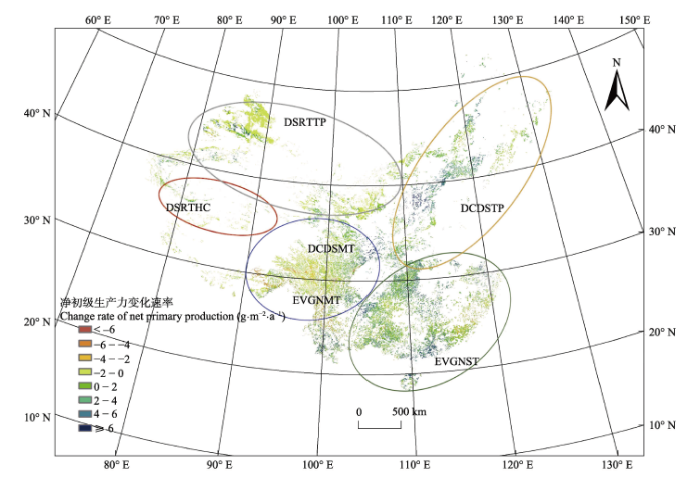 显示原图|下载原图ZIP|生成PPT
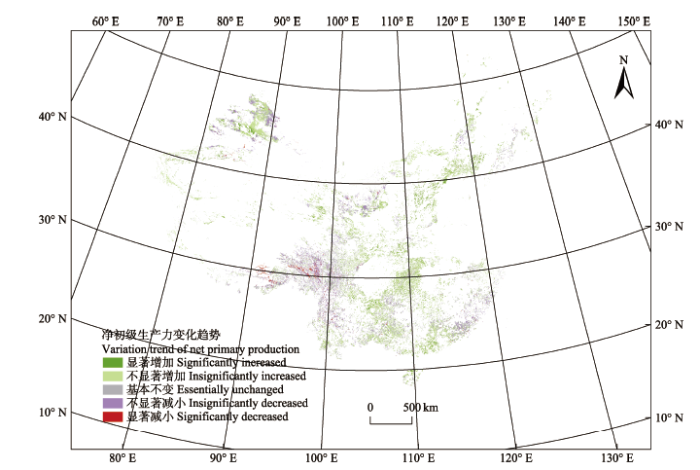 显示原图|下载原图ZIP|生成PPT
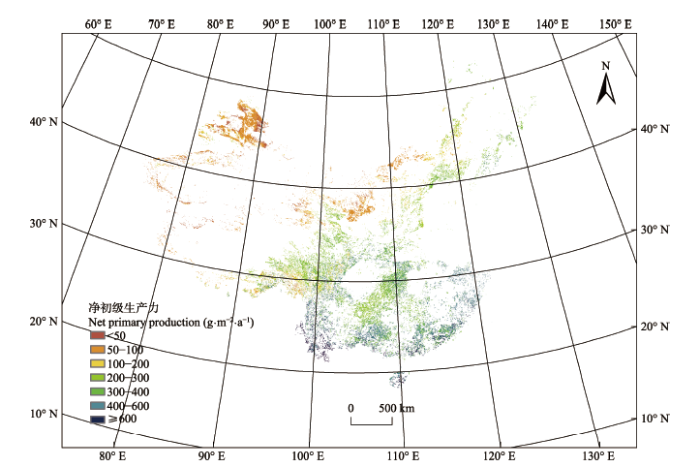 显示原图|下载原图ZIP|生成PPT
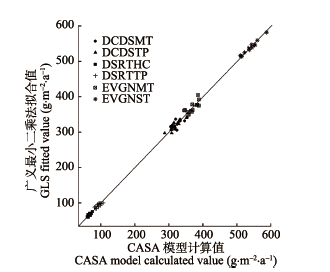 显示原图|下载原图ZIP|生成PPT
