Biomass allocation patterns of Loropetalum chinense
WANGYang1,2, XUWen-Ting1, XIONGGao-Ming1, LIJia-Xiang1,3, ZHAOChang-Ming1, LUZhi-Jun4, LIYue-Lin5, XIEZong-Qiang1,*, 1State Key Laboratory of Vegetation and Environment Change, Institute of Botany, Chinese Academy of Sciences, Beijing 100093, China2University of Chinese Academy of Sciences, Beijing 100049, China3Faculty of Forestry, Central South University of Forestry and Technology, Changsha 410004, China4Key Laboratory of Aquatic Botany and Watershed Ecology, Wuhan Botanical Garden, Chinese Academy of Sciences, Wuhan 430074, Chinaand5South China Botanical Garden, Chinese Academy of Sciences, Guangzhou 510650, China 通讯作者:* 通信作者Author for correspondence (E-mail: xie@ibcas.ac.cn) 责任编辑:WANGYangXUWen-TingXIONGGao-MingLIJia-XiangZHAOChang-MingLUZhi-JunLIYue-LinXIEZong-Qiang 收稿日期:2016-07-4 接受日期:2016-12-16 网络出版日期:2017-01-10 版权声明:2017植物生态学报编辑部本文是遵循CCAL协议的开放存取期刊,引用请务必标明出处。 基金资助:中国科学院战略性先导科技专项(XDA-05050302)
关键词:异速生长;灌丛;亚热带;生境因子;根冠比 Abstract Aims Biomass is the most fundamental quantitative character of an ecosystem. Biomass allocation patterns reflect the strategies of plants to adapt various habitat conditions and play a vital role in evolution, biodiversity conservation and global carbon cycle. Loropetalum chinense shrub is one of the most dominant shrub types in subtropical China. The objectives of this study were to quantify the allometric relationships and the biomass allocation pattern among organs, and to investigate the effects of body size, shrub regeneration origin and site factors on allometry and biomass allocation. Methods Individual samples of L. chinense were harvested from shrublands in subtropical China and were further divided into leaves, stems and roots. The allometric relationships between different organs were modeled with standard major axis (SMA) regression and the biomass allocation to different organs was quantified. The effects of body size, shrub regeneration origin and other habitat factors on allometry and allocation were examined using Pearson’s correlation analysis and multiple linear regressions. Important findings The isometric scaling relationships between shoot and root changed to allometric relationships with increasing basal diameter. The scaling relationships between leaf and stem and between leaf and root were isometric for smaller diameter classes, while for larger diameter classes they were allometric. These relationships were significantly different among shrub regeneration origin types. The scaling relationships between different organs were not affected by habitat factors; while the coverage of shrub layer and slope affected biomass allocation due to their influences on the allometric relationships between different organs at the initial stage of growth. The mean dry mass ratios of leaf, stem, root and the mean root to shoot ratio were 0.11, 0.55, 0.34 and 0.65, respectively. With the increase of basal diameter class, stem mass ratio (0.50-0.64) increased, while leaf mass ratio (0.12-0.08) and root mass ratio (0.38-0.28) decreased, and consequently root to shoot ratio (0.91-0.43) also decreased. In secondary shrublands, the leaf mass ratio was 0.12 and the root mass ratio was 0.33, while these values were 0.07 and 0.36 respectively in natural shrublands. The ratio of aboveground allocation was significantly correlated to shrub layer coverage (r = 0.44, p < 0.05). Leaf mass ratio was significantly correlated to slope (r = -0.36, p < 0.05) and root mass ratio was significantly correlated to mean annual temperature (r = 0.34, p < 0.05). Results showed that with the increase of body size, the scaling relationships between different organs of L. chinense changed from isometric to allometric, and more biomass was allocated to aboveground part, and concretely, to stems. Human disturbance affected biomass allocation by its influences on the allometric relationships between different organs, and by increasing biomass allocation to leaves and decreasing allocation to roots. Reduced light resource promoted the biomass allocation to aboveground part, and higher slope resulted in decreased biomass allocation to leaves, while higher mean annual temperature promoted biomass allocation to roots. The variation in annual precipitation had no significant influences on biomass allocation. The biomass allocation strategies of L. chinense partially support the optimal partitioning theory.
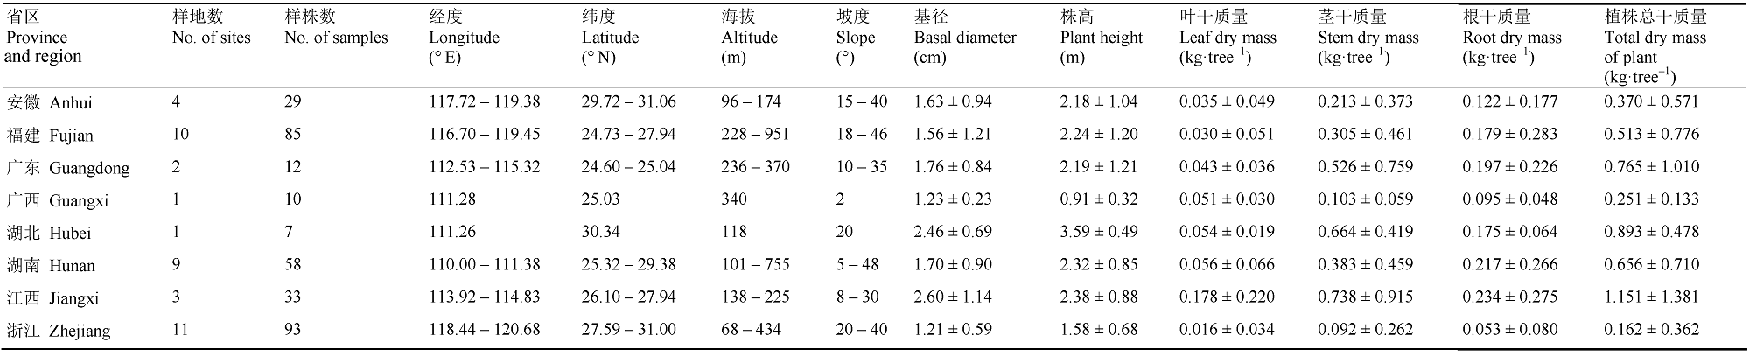
在中国亚热带地区的安徽、福建、广东、广西、湖北、湖南、江西、浙江8个省区选择调查样点, 调查样点的纬度、经度和海拔分布范围分别为: 24.6°-31.06° N、110.00°-120.68° E和68-951.26 m。调查于2011-2013年间的6-12月进行, 以檵木为建群种或共建种的灌丛调查样点共41个(表1)。 Table 1 表1 表1样地信息及檵木样柱基础数据调查统计表(平均值±标准偏差) Table 1Summary of the site information and survey statistics on basic data of Loropetalum chinense(mean±SD)
不同径级大小和不同起源的灌丛中檵木器官间的异速生长参数(尺度系数β、回归常数α)见表2、表3, 径级间和灌丛起源间檵木异速生长的比较见图2、图3。檵木地上-地下异速生长的尺度系数β和回归常数α在不同径级和灌丛起源间均无显著差异, 且符合或接近等速生长。但随着径级的增大, β的95%置信区间逐渐增大, 表明檵木地上-根间的等速生长关系可能随着径级的继续增大而发生变化。叶-茎异速生长关系中, β在不同灌丛起源和径级A、B、C之间无显著差异, 但在径级A、D和B、D之间存在显著差异。径级A、B的檵木叶-茎间为等速生长, 径级C、D的檵木叶-茎间为异速生长, 且随着径级的增大β的95%置信区间逐渐增大。次生灌丛中檵木叶-茎间为等速生长, 而原生灌丛中叶的相对生长减小, 表现为异速生长。叶-茎异速生长的α在径级A、B、C之间无显著差异, 但径级D的檵木个体α显著降低, 而且在原生灌丛中α显著较低。叶-根异速生长的β在不同灌丛起源和径级A、B、C之间无显著性差异, 为等速生长, 但在径级A、D之间存在显著差异, 径级D的檵木个体叶-根间为异速生长。叶-根间相对生长的α在不同径级间无显著差异, 但在原生灌丛中α显著较低。 Table 2 表2 表2不同径级的檵木器官间异速生长关系(双对数尺度) Table 2Allometric relationships between organs of Loropetalum chinense in four basal diameter classes (in log-log scale)
径级 Diameter class
样本数 n
回归常数 Regression constant
尺度系数 Scaling coefficient
p
R2
α
置信下限 Lower CI
置信上限 Upper CI
β
置信下限 Lower CI
置信上限 Upper CI
地上-根 MA-MR
A
96
0.125
-0.090
0.341
0.945
0.846
1.057
<0.001
0.704
B
136
0.272
0.136
0.407
0.979
0.879
1.090
<0.001
0.601
C
63
0.355
0.186
0.524
0.927
0.750
1.147
<0.001
0.300
D
32
0.429
0.311
0.546
0.975
0.724
1.313
<0.001
0.343
叶-茎 ML-MS
A
96
-0.601
-0.774
-0.429
1.029
0.943
1.124
<0.001
0.815
B
136
-0.690
-0.826
-0.554
1.089
0.970
1.221
<0.001
0.546
C
63
-0.733
-0.876
-0.589
1.268
1.031
1.559
<0.001
0.339
D
32
-1.047
-1.168
-0.926
1.681
1.311
2.157
<0.001
0.545
叶-根 ML-MR
A
96
-0.556
-0.802
-0.311
0.983
0.870
1.110
<0.001
0.644
B
136
-0.446
-0.629
-0.262
1.096
0.963
1.247
<0.001
0.422
C
63
-0.332
-0.582
-0.082
1.226
0.969
1.551
0.002
0.141
D
32
-0.429
-0.657
-0.201
1.586
1.129
2.227
0.036
0.138
α, regression constant; β, scaling coefficient. Lower CI, 2.5% confidence interval; Upper CI, 97.5% confidence interval. A, 0.1-1 cm; B, 1-2 cm; C, 2-3 cm; D, 3-6 cm. ML, MR, MS are the dry mass of leaf, root and stem respectively; MA = ML + MS. 新窗口打开 Table 3 表3 表3不同起源的灌丛中檵木器官间异速生长关系(双对数尺度) Table 3Allometric relationships between organs of Loropetalum chinense in primary and secondary shrublands (in log-log scale)
起源 Origin
样本数 n
回归常数 Regression constant
尺度系数 Scaling coefficient
p
R2
α
置信下限 Lower CI
置信上限 Upper CI
β
置信下限 Lower CI
置信上限 Upper CI
地上-根 MA-MR
次生 Secondary
209
0.376
0.296
0.455
1.032
0.977
1.090
<0.001
0.840
原生 Primary
118
0.396
0.269
0.522
1.097
1.015
1.185
<0.001
0.822
叶-茎 ML-MS
次生 Secondary
209
-0.745
-0.809
-0.681
0.949
0.898
1.002
<0.001
0.840
原生 Primary
118
-1.049
-1.129
-0.970
0.876
0.819
0.937
<0.001
0.867
叶-根 ML-MR
次生 Secondary
209
-0.449
-0.549
-0.349
1.002
0.934
1.075
<0.001
0.735
原生 Primary
118
-0.726
-0.853
-0.600
0.983
0.902
1.072
<0.001
0.779
α, regression constant; β, scaling coefficient. Lower CI, 2.5% confidence interval; Upper CI, 97.5% confidence interval. MA, ML, MR, MS see Table 2. 新窗口打开 显示原图|下载原图ZIP|生成PPT 图2不同径级的檵木器官间异速生长关系。ML、MS和MR分别为叶干质量、茎干质量和根干质量, MA = ML + MS。 -->Fig. 2Allometric relationships between different organs of Loropetalum chinense in four basal diameter classes. ML, MS and MR are the dry mass of leaf, stem and root, respectively; MA = ML + MS). -->
显示原图|下载原图ZIP|生成PPT 图3不同起源的灌丛中檵木器官间异速生长关系。MA、ML、MR、MS同图2。 -->Fig. 3Allometric relationships between different organs of Loropetalum chinense in primary and secondary shrublands. MA, ML, MR, MS see Fig. 2. -->
2.2 檵木生物量在器官间的分配
不同径级和灌丛起源的檵木生物量在器官间的分配(叶质比、茎质比、根质比、根冠比)见图4、图5。随着径级的增大, 檵木茎质比(0.50-0.64)逐渐增大, 叶质比(0.12-0.08)、根质比(0.38-0.28)和根冠比(0.91-0.43)逐渐减小, 檵木生长过程中生物量更多地分配到地上部分, 而地上生物量又更多地分配到茎中。次生灌丛中檵木的根冠比为0.59, 显著低于原生灌丛中檵木的根冠比0.76, 檵木根冠比的差异来源于叶质比和根质比的差异: 次生灌丛中檵木的叶质比、根质比分别为0.12、0.33, 原生灌丛中檵木的叶质比、根质比分别为0.07、0.36。 显示原图|下载原图ZIP|生成PPT 图4不同径级的檵木生物量在器官间的分配比例关系(平均值±标准偏差)。A, 0.1-1 cm; B, 1-2 cm; C, 2-3 cm; D, 3-6 cm。不同小写字母表示径级间差异显著(p < 0.05)。 -->Fig. 4Dry mass ratio of leaf, stem, root and the root to shoot ratio of Loropetalum chinense in four basal diameter classes (mean ± SD). A, 0.1-1 cm; B, 1-2 cm; C, 2-3 cm; D, 3-6 cm; d, basal diameter. Different small letters indicate significant difference (p < 0.05) among diameter classes. -->
显示原图|下载原图ZIP|生成PPT 图5不同起源的灌丛中檵木生物量在器官间的分配比例关系(平均值±标准偏差)。不同小写字母表示不同起源间差异显著(p < 0.05)。 -->Fig. 5Dry mass ratio of leaf, stem, root and the root to shoot ratio of Loropetalum chinense in primary and secondary shrub lands (mean ± SD). Different small letters indicate significant difference (p < 0.05) among different regeneration origins. -->
2.3 檵木异速生长和生物量分配与生境因子之间的关系
檵木器官间异速生长的尺度系数β与生境因子之间的相关性均不显著, 仅回归常数α与部分生境因子之间存在显著相关性: 地上-地下异速生长的回归常数α与灌木层盖度(r = 0.437, p < 0.05)显著正相关, 叶-茎异速生长的α与平均株高(r = -0.546, p < 0.001)和坡度(r = -0.649, p < 0.001)显著负相关, 叶-根异速生长的α与坡度(r = -0.497, p < 0.01)显著负相关。 檵木叶质比与坡度(r = -0.363, p < 0.05)和平均株高(r = -0.557, p < 0.001)显著负相关; 茎质比与平均株高(r = 0.532, p < 0.001)正相关, 且达到极显著水平; 根质比与年平均气温(r = 0.338, p < 0.05)显著正相关; 根叶比与坡度(r = 0.342, p < 0.05)和年平均气温(r = 0.369, p < 0.05)显著正相关; 根冠比与各生境因子的相关性均不显著。 逐步回归的结果表明, 灌木层盖度可解释檵木地上-地下异速生长回归常数α 19.1%的变异, 平均株高和坡度共同解释了叶-茎异速生长回归常数α 63.8%的变异, 坡度可解释叶-根异速生长回归常数α 24.7%的变异。平均株高可解释叶质比33.8%的变异、茎质比28.3%的变异, 年平均气温可解释根质比11.4%的变异, 坡度和年平均气温共同解释了根叶比28.8%的变异。
本研究分析了檵木器官间异速生长和生物量在不同器官间的分配以及与个体大小、灌丛起源和其他生境因子之间的关系, 并验证了生物量最优分配假说和异速分配假说在檵木生长中的适用性。檵木器官间(地上-地下、叶-茎、叶-根)的相对生长关系为等速生长,叶-茎和叶-根的相对生长关系符合异速分配假说关于幼龄个体异速生长的预测。个体大小、灌丛起源、灌木层盖度、坡度和年平均气温主要通过影响檵木生长初期器官间的相对生长来影响生物量在不同器官间的分配, 檵木生物量的分配策略在一定程度上支持了最优分配假说。 The authors have declared that no competing interests exist. 作者声明没有竞争性利益冲突.
BesslerH, TempertonVM, RoscherC, BuchmannN, SchmidB, SchulzeED, WeisserWW, EngelsC (2009). Aboveground overyielding in grassland mixtures is associated with reduced biomass partitioning to belowground organs .Ecology, 90, 1520-1530.
[2]
ChengDL, NiklasKJ (2007). Above- and below-ground biomass relationships across 1534 forested communities .Annals of Botany, 99, 95-102. [本文引用: 3]
[3]
CoomesDA (2006). Challenges to the generality of WBE theory .Trendsin Ecology & Evolution, 21, 593-596. [本文引用: 1]
[4]
DuncansonLI, DubayahRO, EnquistBJ (2015). Assessing the general patterns of forest structure: Quantifying tree and forest allometric scaling relationships in the United States .Global Ecology and Biogeography, 24, 1465-1475. [本文引用: 1]
[5]
EnquistBJ, KerkhoffAJ, StarkSC, SwensonNG, McCarthyMC, PriceCA (2007). A general integrative model for scaling plant growth, carbon flux, and functional trait spectra .Nature, 449, 218-222. [本文引用: 1]
EnquistBJ, NiklasKJ (2002). Global allocation rules for patterns of biomass partitioning in seed plants .Science, 295, 1517-1520. [本文引用: 1]
[8]
FanFL, ZhangFS, QuZ, LuYH (2008). Plant carbon partitioning below ground in the presence of different neighboring species .Soil Biology & Biochemistry, 40, 2266-2272.
[9]
FanJW, WangK, HarrisW, ZhongHP, HuZM, HanB, ZhangWY, WangJB (2009). Allocation of vegetation biomass across a climate-related gradient in the grasslands of Inner Mongolia .Journal of Arid Environments, 73, 521-528. [本文引用: 1]
[10]
HuHF, WangZH, LiuGH, FuBJ (2006). Vegetation carbon storage of major shrublands in China .Journal of Plant Ecology (Chinese Version), 30, 539-544. (in Chinese with English abstract)[胡会峰, 王志恒, 刘国华, 傅博杰 (2006). 中国主要灌丛植被碳储量 . 植物生态学报, 30, 539-544.] [本文引用: 1]
[11]
LukenJO (1988). Population structure and biomass allocation of the naturalized shrub Lonicera maackii(Rupr.) Maxim. in forest and open habitats . The American Midland Naturalist, 119, 258-267. [本文引用: 1]
[12]
McCarthyMC, EnquistBJ (2007). Consistency between an allometric approach and optimal partitioning theory in global patterns of plant biomass allocation .Functional Ecology, 21, 713-720. [本文引用: 5]
[13]
McConnaughayKDM, ColemanJS (1999). Biomass allocation in plants: Ontogeny or optimality? A test along three resource gradients .Ecology, 80, 2581-2593. [本文引用: 1]
[14]
NieXQ, YangYH, YangLC, ZhouGY (2016). Above- and belowground biomass allocation in shrub biomes across the northeast Tibetan Plateau .PLOS ONE, 11, e0154251. doi:10.1371/journal.pone.0154251. [本文引用: 1]
[15]
NiklasKJ (2004). Plant allometry: Is there a grand unifying theory? Biological Reviews, 79, 871-889. [本文引用: 1]
[16]
PerkinsSR, OwensMK (2003). Growth and biomass allocation of shrub and grass seedlings in response to predicted changes in precipitation seasonality .Plant Ecology, 168, 107-120. [本文引用: 1]
[17]
PoorterH, NiklasKJ, ReichPB, OleksynJ, PootP, MommerL (2012). Biomass allocation to leaves, stems and roots: Meta-analyses of interspecific variation and environmental control .New Phytologist, 193, 30-50. [本文引用: 1]
[18]
RobinsonD (2004). Scaling the depths: Below-ground allocation in plants, forests and biomes .Functional Ecology, 18, 290-295. [本文引用: 1]
[19]
RyserP, EekL (2000). Consequences of phenotypic plasticity vs. interspecific differences in leaf and root traits for acquisition of aboveground and belowground resources .American Journal of Botany, 87, 402-411. [本文引用: 1]
[20]
SackL, MaranonT, GrubbPJ (2002). Global allocation rules for patterns of biomass partitioning .Science, 296, 1923a. [本文引用: 1]
[21]
ShipleyB, MezianeD (2002). The balanced-growth hypothesis and the allometry of leaf and root biomass allocation .Functional Ecology, 16, 326-331. [本文引用: 1]
[22]
WangXP, FangJY, ZhuB (2008). Forest biomass and root- shoot allocation in northeast China .Forest Ecology and Management, 255, 4007-4020. [本文引用: 1]
WeinerJ (2004). Allocation, plasticity and allometry in plants .Perspectives in Plant Ecology, Evolution and Systematics, 6, 207-215. [本文引用: 4]
[25]
XieJY, ChenLZ (1997). The studies of some aspects of biodiversity on scrubs in the warm temperate zone in China .Acta Phytoecologica Sinica, 21, 197-207. (in Chinese with English abstract)[谢晋阳, 陈灵芝 (1997). 中国暖温带若干灌丛群落多样性问题的研究 . 植物生态学报, 21, 197-207.] [本文引用: 1]
[26]
YangHT, LiXR, LiuLC, JiaRL, WangZJ, LiXJ, LiG (2013). Biomass allocation patterns of four shrubs in desert grassland .Journal of Desert Research, 33, 1340-1348. (in Chinese with English abstract)[杨昊天, 李新荣, 刘立超, 贾荣亮, 王增加, 李小军, 李刚 (2013). 荒漠草地4种灌木生物量分配特征 . 中国沙漠, 33, 1340-1348.] [本文引用: 2]
[27]
YangYH, LuoYQ (2011). Isometric biomass partitioning pattern in forest ecosystems: Evidence from temporal observations during stand development .Journal of Ecology, 99, 431-437. [本文引用: 1]
[28]
ZhangH, WangKL, XuXL, SongTQ, XuYF, ZengFP (2015). Biogeographical patterns of biomass allocation in leaves, stems, and roots in China’s forests .Scientific Reports, 5, 15997. doi: 10.1038/srep15997. [本文引用: 2]
[29]
ZhouHK, ZhouL, ZhaoXQ, ShengZX, LiYN, ZhouXM, YanZL, LiuW (2002). Study of formation pattern of below-ground biomass in Potentilla fruticosa shrub . Acta Prataculturae Sinica, 11, 59-65. (in Chinese with English abstract)[周华坤, 周立, 赵新全, 沈振西, 李英年, 周兴民, 严作良, 刘伟 (2002). 金露梅灌丛地下生物量形成规律的研究 . 草业学报, 11, 59-65.] [本文引用: 1]
Aboveground overyielding in grassland mixtures is associated with reduced biomass partitioning to belowground organs 2009
Above- and below-ground biomass relationships across 1534 forested communities 3 2007
Consequences of phenotypic plasticity vs. interspecific differences in leaf and root traits for acquisition of aboveground and belowground resources 1 2000

 显示原图|下载原图ZIP|生成PPT
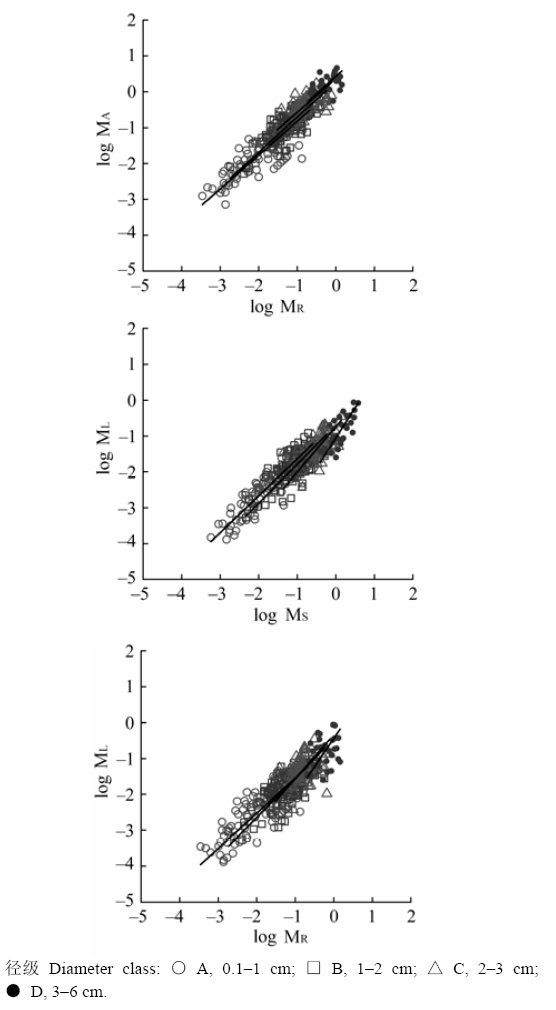 显示原图|下载原图ZIP|生成PPT
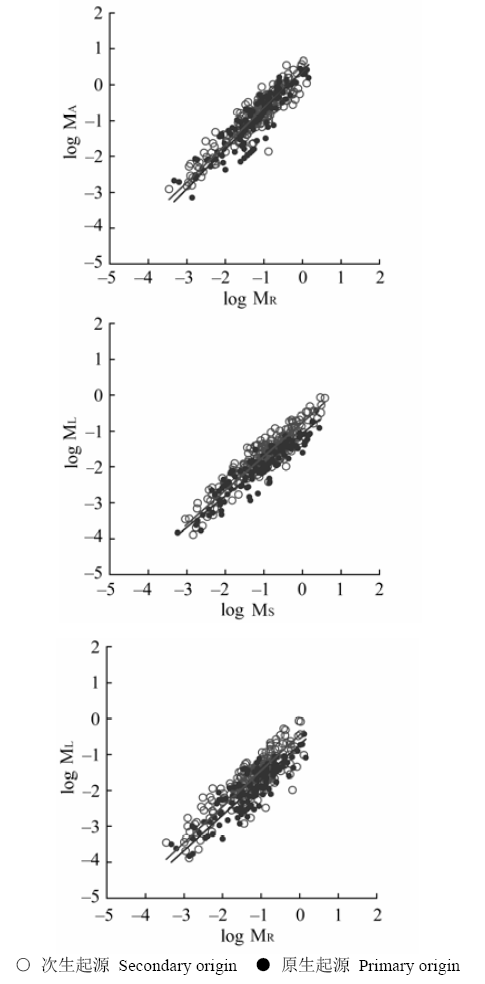 显示原图|下载原图ZIP|生成PPT
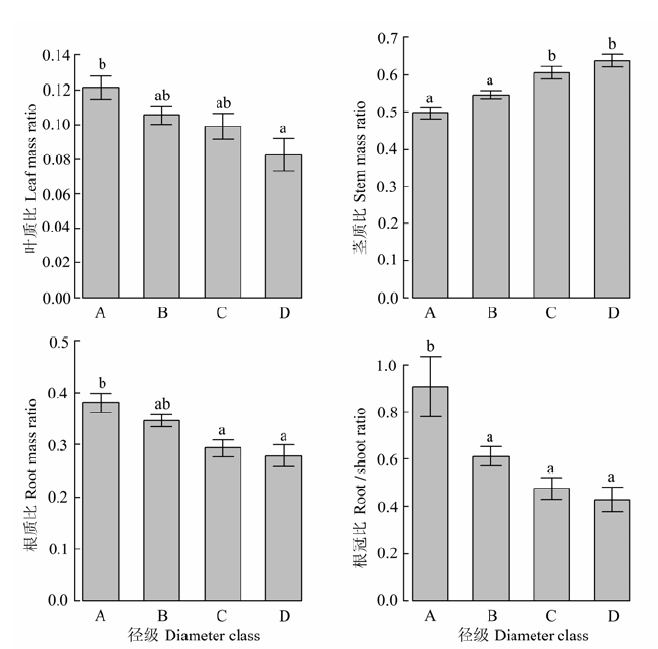 显示原图|下载原图ZIP|生成PPT
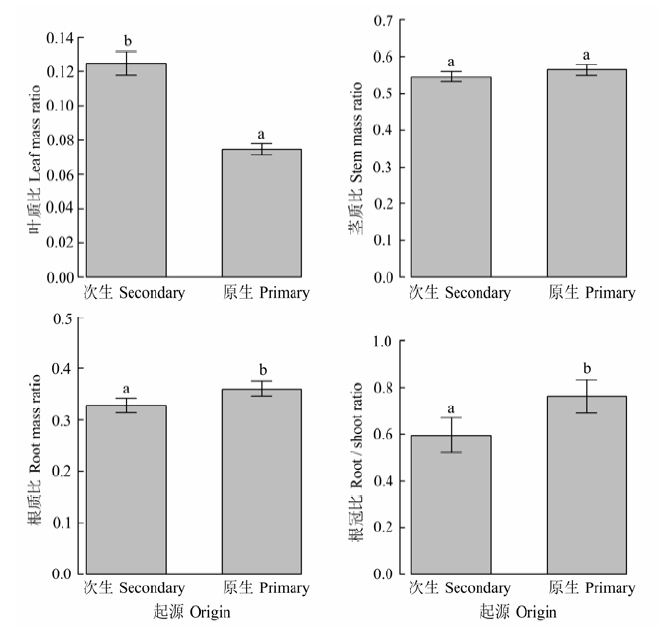 显示原图|下载原图ZIP|生成PPT
