HTML
--> --> -->The YRB, for example, has experienced 18 severe floods in the 20th century (Zong and Chen, 2000). Among the most severe of these floods are the 1998 flood with 1 320 casualties and nearly 5 million destroyed homes and the 1954 flood costing 33 169 lives and destroying about 4.3 million homes (Zong and Chen, 2000). The YRB has also been affected by floods as recently as 2016, and different areas of China outside the YRB can experience heavy precipitation and flooding in the same season as the YRB (e.g., Yuan et al., 2017; Lyu et al., 2018).
Different parts of Asia were affected by unusually heavy rainfall and flooding in the early summer of 2020. China experienced intense floods starting in June. The floods affected more than 35 million people, and left at least 278 dead or missing. The cost of the floods has been estimated at $32 billion (Kramer and Ware, 2020). The YRB was heavily affected and there were issues in the region with dams breaching their design limits and having to release floodwater (Associated Press, 2020). The Three Gorges Reservoir reached a record high flood season level of 164.18 m, the highest since the dam became operational in 2012 (Hansen, 2020). Flooding was seen in Wuhan (Yu, 2020) and in Jiangxi, Hubei, and Hunan provinces (Thomson, 2020).
As shown above, heavy rainfall and severe flooding associated with the EASM have occurred frequently over the past century. While anthropogenic climate change has been shown to lead to an overall decrease of EASM rainfall over the past 65 years, extreme heavy rainfall events have become shorter and more intense, though these historical trends may not be indicative of future changes (Burke and Stott, 2017). Indeed, EASM mean precipitation and its frequency and intensity are projected to increase over the 21st century (Chen and Sun, 2013), so rainfall and flooding can be expected to remain important hazards affecting East Asia. Therefore, it remains necessary to study extreme EASM events, such as the one observed in 2020, with state-of-the-art methods and data to aid physical understanding, model evaluation, and ultimately the development of climate services. The aim of this study is to put the 2020 season in context by: (i) quantifying the scale and magnitude of the observed hazards and comparing to the currently observed mean climate and variability, and (ii) by outlining the regional atmospheric circulation and dynamical processes at play. To this end, this study will also demonstrate a number of analysis tools recently developed or refined by the authors.
River basins are the natural units to determine the magnitude of rainfall extremes as it is on the scale of these basins that impacts are felt. We employ BASMATI [BAsin-Scale Model Assessment ToolkIt; Muetzelfeldt et al. (2021)] to quantify extreme rainfall in this study. BASMATI facilitates the aggregation of gridded data over river basins while also systematically varying the spatial scale of the basins considered. This aids in identifying the basins and scales at which, say, an extreme event is most impactful. In the context of climate model evaluation, for which BASMATI has been developed, evaluation at the basin scale is a natural choice for assessing a model’s ability to place precipitation in the correct basin, thereby testing the fidelity of simulated interactions between the atmosphere and the terrain.
The EASM is a multiscale phenomenon involving both tropical and mid-latitude processes (Webster et al., 1998; Wu et al., 2012) and there is a large body of literature focusing on different aspects of EASM dynamics. These aspects include, for example, the southerly monsoon flow at the eastern edge of the Asian continent between the monsoon low over Asia and the Western North Pacific subtropical high (WNPSH; Rodwell and Hoskins, 2001), and the mid-latitude influence exerted by the subtropical westerly jet and its position relative to and interaction with the Tibetan Plateau (e.g., Schiemann et al., 2009; Sampe and Xie, 2010; Chiang et al., 2017; Kong et al., 2017). Liu et al. (2020) showed that the North Atlantic Oscillation (NAO) influenced the 2020 mei-yu rainfall, with positive NAO causing the mei-yu front to advance further north of the Yangtze River in June, and negative NAO causing the front to be located south of the Yangtze River in July. This interaction was mediated by the subtropical westerly jet and controlled the placement of the WNPSH. A moist southwesterly low-level jet is also a key feature of the EASM (Ding et al., 2021), and this has been linked to increased mesoscale convective system activity, particularly near the Yangtze River (Zhang et al., 2018; Guan et al., 2020).
Recent studies of the EASM have focused directly on the interaction of tropical and mid-latitude air masses to describe the seasonal progression of the monsoons over both South and East Asia (Parker et al., 2016; Volonté et al., 2020, 2021). For the EASM, Volonté et al. (2021) show that this air-mass interaction is particularly pronounced during the mei-yu stage when the EASMF rapidly advances northward. We employ their framework in this study to characterize the 2020 mei-yu season by using an automated method to identify the EASMF and by calculating back trajectories of tropical and mid-latitude air masses converging in the EASMF.
The structure of this paper is as follows: Section 2 introduces the datasets and statistical and dynamical methods used. The results are presented in the following two sections; Section 3 details where, when, and how strongly heavy rains and flooding occurred, with a focus on the YRB and its sub-basins, and section 4 is a dynamical characterization of the 2020 mei-yu rainfall. The paper is concluded in section 5.
2.1. GPM IMERG precipitation
The Global Precipitation Measurement (GPM) Integrated Multi-satellitE Retrievals for GPM (IMERG) Version 6 dataset is used for observations of precipitation (Huffman et al., 2020). This is a multi-satellite product that combines data from different microwave and infrared satellites, with the GPM observatory satellite currently providing core passive microwave data used to calibrate the other microwave satellites. Infrared data is used to “morph” the estimated precipitation field where satellite microwave data are sparse. Here, we use the Final product, which is recommended for research use. It includes a monthly adjustment to monthly mean gauge data, which is the main difference between this and the Late product. The Final product has been shown to perform better over China than the Late product when comparing to gauge observations using a previous version (Version 4.4) of IMERG (Wang et al., 2017), however over the Sichuan Basin it has been shown to perform similarly to the Late product (Tang et al., 2020).2
2.2. ERA5 data
We use the ERA5 reanalysis (Hersbach et al., 2020). The data used consist of 6-hourly atmospheric fields on a 0.25°-horizontal grid and 22 vertical levels between 1000 and 200 hPa for June and July 2020. Quality-assured monthly ERA5 updates are published within 3 months of real time, making this dataset suitable for the analysis of summer 2020. Compared to its predecessor, ERA-Interim, ERA5 has a more advanced assimilation system and includes more sources of data. ERA5 has also a finer resolution, which is an advantage in resolving the smaller-scale EASMF dynamics that are crucial in the heavy precipitation events considered in this study. We also use the precipitation from ERA5 to provide a longer time series for the mean monthly precipitation than IMERG provides, although we do not use ERA5 precipitation to examine extremes because it underestimates them (Jiang et al., 2021).2
2.3. GloFAS-ERA5
The GloFAS-ERA5 reanalysis product (Harrigan et al., 2020) is used to provide an estimate of the discharge from the Yangtze River. This is a global dataset at 0.1° resolution that consists of a hydrological model driven by ERA5 reanalysis. We use river flow from the grid cell at the mouth of the Yangtze as an estimate of its discharge. Müller et al. (2021) report inhomogeneities in global GloFAS-ERA5 discharge with larger values before about 2000. The extent to which this affects the YRB is unknown, yet no obvious trends are visible for the period 1998–2020 examined herein.2
2.4. BASMATI
We average the precipitation over spatial areas defined by river basins using the BAsin- Scale Model Assessment ToolkIt (BASMATI), which is fully described in Muetzelfeldt et al. (2021). BASMATI uses the HydroBASINS catchment basin dataset (Lehner, 2014), which is derived from a high-resolution digital elevation model (Lehner and Grill, 2013). BASMATI makes it easy to select basins in a given size interval, and provides tools for averaging over different-sized basins. Return times of basin-mean precipitation are estimated as described in Schiemann et al. (2018).2
2.5. Front detection algorithm
The algorithm used to detect the EASMF in this study is presented in detail in Volonté et al. (2021), where it is applied to the ERA5 1979?2018 climatology of the EASM seasonal progression. The meridional gradient of equivalent potential temperature (θe hereafter) at 850 hPa characterizes the EASMF during its seasonal progression, as evident also in section 4 of this paper. For this reason, it is chosen as the frontal indicator in the algorithm. Daily frontal latitudes are provided by the algorithm for each longitude point between 105°E and 145°E. These values are then time-averaged over dekads (10-day periods) for the events of interest.2
2.6. Lagrangian trajectories
Lagrangian trajectories are particularly useful in the study of airmass evolution. This work takes advantage of the techniques applied in Volonté et al. (2021), based on the LAGRANTO Lagrangian analysis tool (Wernli and Davies, 1997; Sprenger and Wernli, 2015). LAGRANTO uses a three-time iterative forward Euler scheme with an iteration step equal to 1/12 of the time spacing of the input data, i.e., 30 minutes for the 6-hourly ERA5 data used here. Backward trajectories are computed by using the instantaneous three-dimensional wind field to calculate the positions of the selected air parcels. Local values of the relevant physical quantities are then interpolated onto those trajectories.2
2.7. Measures of moisture content and transport
Regions with high values of moisture transport and content are identified in this study, following Volonté et al. (2021), by using integrated vapor transport (IVT) and integrated water vapor (IWV), respectively. IVT is defined as:where g is the gravitational acceleration, q is specific humidity, V is the total horizontal wind vector and p is pressure. The vertical integration is performed using all 16 output levels between 500 and 1000 hPa available in ERA5. In the same way, IWV is defined as:

2
3.1. Asia-wide precipitation
Figure 1 shows the Asia-wide land precipitation anomaly in June and July 2020 as applied to river basins between 20 000?200 000 km2 in area using BASMATI (Section 2.4). It is clear that in both June and July the YRB experienced anomalously high rainfall compared to its climatology, and that it was the largest area which had a substantial wet anomaly for both months in Asia. The other area that showed a substantial wet anomaly in both months was south of the Himalayas in Bangladesh and West Bengal. This corresponds to reports of flooding in Bangladesh (Kaamil, 2020; Sengupta and Manik, 2020). Northeast China shows a strong wet anomaly in June that covers a large area but had less rainfall than normal in July. Note that the mean rainfall is less in this region than over the YRB, and thus the percentage change here would be bigger. South India has a slight wet anomaly in July, but was close to its climatology in June. The Tibetan Plateau has a slight wet anomaly in July; indeed, some of the affected region lies in the YRB and so would have contributed to the downstream flooding. Figure1. Basin-average Asian precipitation anomalies for June and July 2020, for basin areas in the interval 20 000–200 000 km2. Anomalies computed relative to the 2000–19 mean from IMERG. The YRB outline is shown in red.
Other regions show a strong dry anomaly. The north of India, particularly in July, shows a pronounced dry anomaly over a large area. The Indochina peninsula experienced far less rainfall than normal over both months. In coastal southeast China there was a dry anomaly in July.
Yuan et al. (2017) analyzed the China-wide precipitation for the 2016 and 1998 floods over May, June, and July (MJJ; their Figs. 2a and c). Compared with these, June?July 2020 precipitation is more similar to the MJJ precipitation in 2016, due to the dry anomaly in coastal southeast China and wet anomaly over the YRB. The year 2020 has a more consistent wet anomaly over the YRB, although this may be affected by averaging over basins and the fact that we only analyzed June and July.
 Figure2. (a) and (b) show June and July IMERG precipitation over the YRB, and (c) shows the June and July ERA5 precipitation. (a) and (c) show monthly mean total YRB precipitation and (b) shows number of days any of the 32 YRB sub-basins (shown in Fig. 4) are in the 99th percentile. In (a) and (c), the mean (solid black) and ±σ (dashed black) of June–July precipitation are also shown. (d) shows the intraseasonal variability of the YRB daily IMERG precipitation for 2020, and 5-day moving means of total YRB precipitation (dashed black), upper YRB precipitation (sub-basins west of 108°E, yellow line) and lower YRB precipitation (sub-basins east of 108°E, blue line). Also shown are the two event windows (black vertical lines).
Overall, the wet anomaly in the YRB stands out as being exceptional for the region and will be analyzed further in sections 3.2 and 3.3. The fact that it persisted over both months could have exacerbated its impacts, as the rain would have been falling on saturated ground, with reduced water storage capacity and hence greater runoff. Both the large extent and duration are likely to have added large volumes of water to the river network, which would increase the likelihoods of downstream flooding and water management issues as described in the introduction.
2
3.2. Yangtze River basin precipitation
Figure 2a shows monthly values of total YRB precipitation and Fig. 2b shows the number of days exceeding the daily precipitation 99th percentile values from 2000?20. The percentiles are calculated over each sub-basin, in the range 2000?200 000 km2 within the YRB, and so use a degree of spatial averaging which should help to lessen the effects of any small-scale biases of the underlying IMERG dataset. The 99th percentile is calculated for each basin and is defined relative to all of the previous values for that basin in the IMERG dataset (using June 2000 ? July 2020 and all months, not just June and July). From Fig. 2a, 2020 is clearly exceptional. It has the highest total precipitation of any month for both June and July, and 2020 is the only year in which both June and July are above 1 standard deviation from the mean for YRB rainfall. As discussed above, the combination of two exceptional months occurring together exacerbates the effects of the rainfall in the second month; the analysis in this section shows that this problem is particularly severe in 2020. The level of Yangtze River discharge in July and August, high when compared to previous years, supports this analysis (Fig. 3).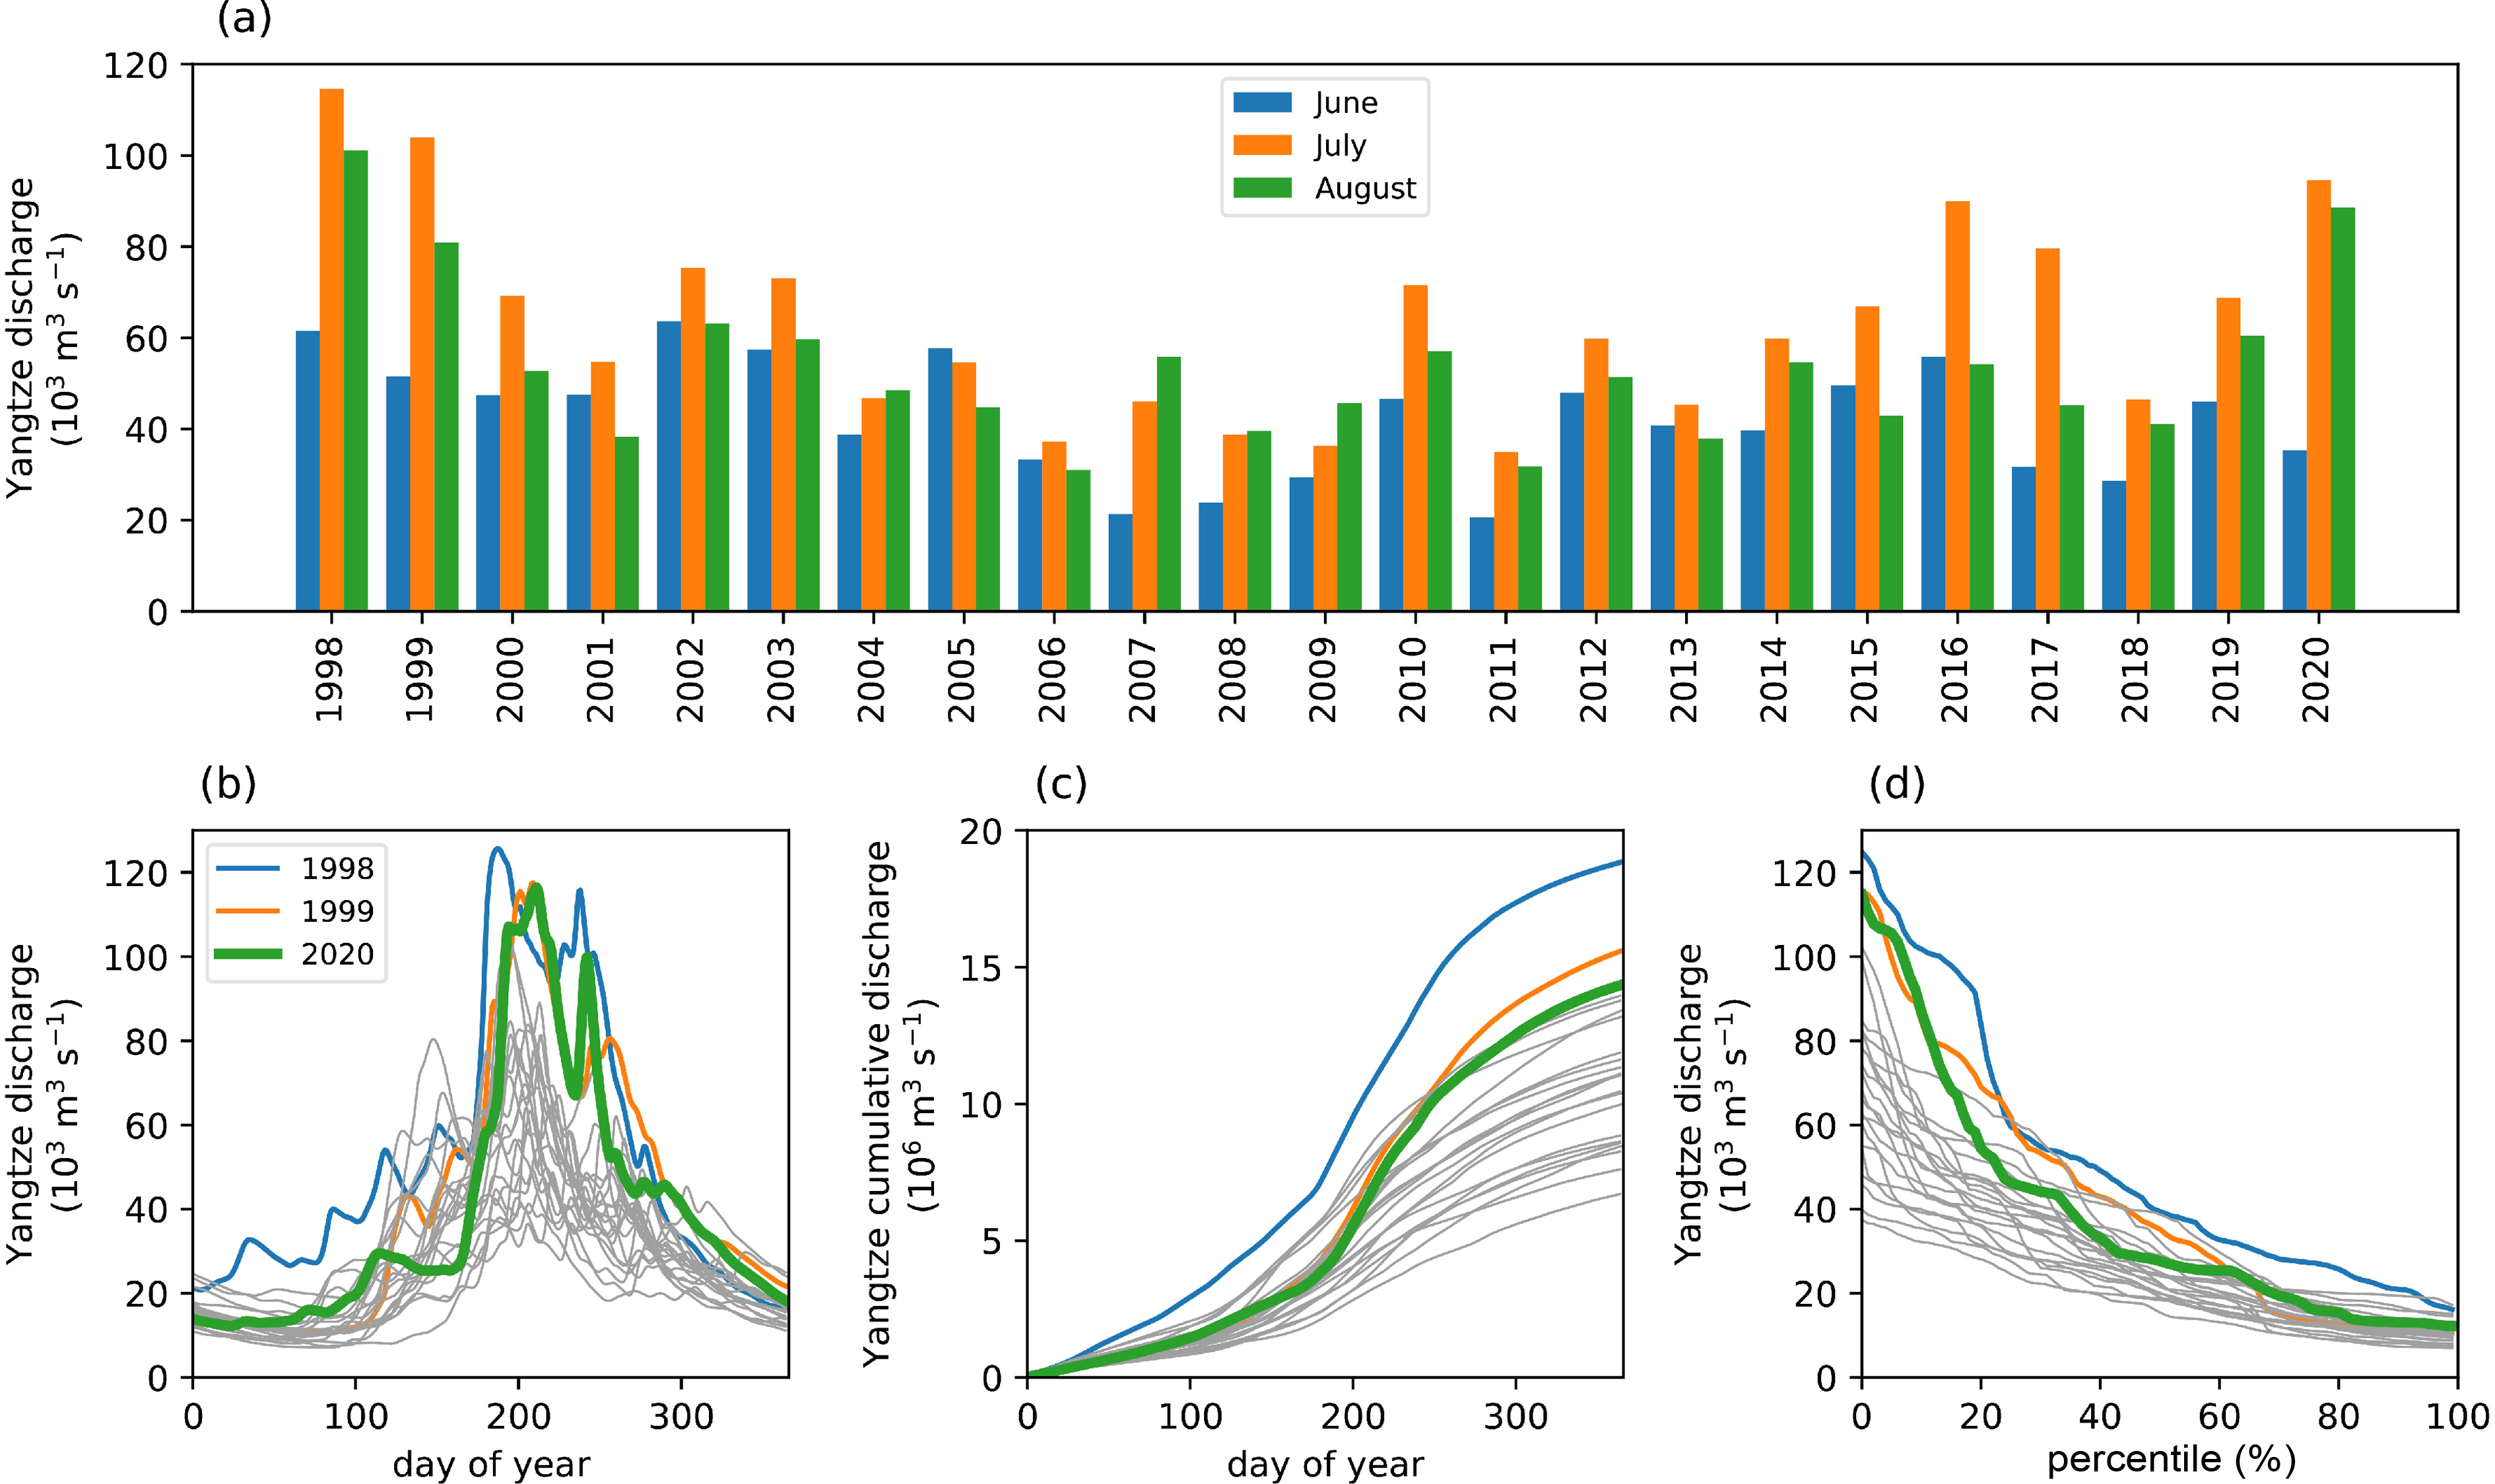 Figure3. ERA5-GloFAS (Harrigan et al., 2020) Yangtze River discharge. (a) shows the monthly mean discharge for JJA, (b) and (c) show the discharge and cumulative discharge over each year respectively, and (d) shows the flow duration curve for each year.
Some other years experienced heavy YRB rainfall in one of the two months. July 2007, July 2010, June 2015, June 2016 and June 2017 all had around 1 standard deviation of rainfall above average. Several of these years were associated with substantial flooding events in the YRB (Buckley, 2016; Gu, 2017), with several regions being particularly badly affected in July 2010. Indeed, July 2010 was a month in which there was substantial flooding (Davies, 2013); overall, 2010 was the year with the most deaths and second highest number of houses destroyed of the years 2000–2013 and had the highest economic impact in terms of GDP over the years 1990?2013 (Duan et al., 2016).
June and July 2020 also rank highest for extreme rainfall as measured by the exceedance of the 99th percentiles of sub-basin precipitation (Fig. 2b). In general, July has more exceedance days than June (true for 15 of the 21 years), whereas both months are more evenly matched in terms of monthly mean rainfall (July monthly mean precipitation is higher in 11 of the 21 years, and the values of monthly mean for June and July are closer; Fig. 2a). This is consistent with the mei-yu rainfall in June being predominantly frontal over a large region, with more convective rainfall in July, and also with the number of flash floods being higher in July than June (He et al., 2018). The other months which stand out are July 2002, 2007, 2010, 2014 and 2016. Of these, July 2014 is most interesting as it is very close to the average for total rainfall (Fig. 2a), but still has many extreme daily events. Repeating this analysis for lower percentiles (not shown) yields broadly similar results, although 2020 does not stand out so prominently, and the difference between June and July is less apparent.
To provide context going back to 1998 (another notable year for YRB flooding), we show the ERA5 precipitation in Fig. 2c. ERA5 precipitation is well correlated with IMERG (r2 = 0.85) and the magnitude of ERA5 and IMERG precipitation is similar. Although not an observational product, ERA5 precipitation can therefore be considered to be a good proxy. Three more years stand out as being substantially over 1 standard deviation from the mean: June and July 1998, June 1999, and June 2000. Of these, there was substantial flooding in 1998, with reports of more than a thousand deaths and large economic losses associated with it (Zong and Chen, 2000). It is of interest that there was heavy precipitation in both June and July 1998, as in 2020, and that the combined total in 1998 is very similar to that of 2020. Thus, the extreme summer rainfall of 2020 is on a par with one of the most extreme events of the last few decades.
Figure 2d shows the intraseasonal variability of YRB precipitation for June and July 2020. The highest single-day totals of precipitation occur on 27 June and 18 July, with over 20 mm d?1 of precipitation averaged over the YRB. From the 5-day mean of lower YRB precipitation, we identify two events which are analyzed further below. The first is from 12?16 June (associated with a peak in the 5-day mean lower YRB precipitation on 13 June) and the second from 4?8 July (associated with a peak in the 5-day mean lower YRB precipitation on 6 July). By splitting the rainfall into two regions defined by sub-basins in upper and lower YRB based on whether they are west or east of 108°E respectively, it is clear that the peaks in the total YRB rainfall are mainly caused by the peaks in the lower YRB, and that the magnitude of the rainfall in the lower YRB is greater than that in the upper YRB. Figure 3a shows that the Yangtze discharge in July and August 2020 is higher than in every other year in the previous 20, being surpassed by only 1998 and 1999. Here, we also show August since there will be some delay between the precipitation falling and its discharge into the sea. Indeed, the discharge will be determined by hydrological properties of the YRB as well as dams or barrages on the river, and thus will be a complex function of the incoming precipitation. June 2020 discharge is unexceptional, which is probably due to YRB precipitation in May 2020 being close to the median of the previous 20 years (not shown). The high precipitation rates in June and July 2020 therefore clearly cause anomalous discharge from the Yangtze River in July 2020, and it is reasonable to assume that the high discharge in August is at least partially caused by the extreme precipitation in these two months.
Figures 3b-d highlight the three years with the highest maximum discharge in the period 1998?2020. These are 1998, 1999 and 2020 in descending order. From Fig. 3b, the increase in discharge of 2020 starts on approximately day 160 (8 June), and the rate of increase of discharge is clearly on a par with those in 1998 and 1999, although both of those years had more precipitation leading up to the sharp increase. Figure 3c shows that the cumulative discharge for 2020 is behind a few other years on day 183 (1 July) although it has caught up with all but 1998 and 1999 by day 300. The flow duration curve (Fig. 3d) indicates that 2020, 1999 and 1998 were above all other years in terms of the flow above the 20th percentile, again highlighting the anomalously high discharge in these years.
In summary, 2020 was exceptional in terms of the YRB June–July rainfall, both for the monthly totals and for the daily extremes. The total precipitation in June and July was very similar to that in 1998. The high precipitation led to high Yangtze River discharge that was only surpassed by 1998 and 1999 in the period going back to 1998. The duration and extent of high total rainfalls would have stressed the river and dam network making flash floods and related disasters such as landslides more likely.
2
3.3. Yangtze River sub-basin precipitation
Figure 4 shows June–July precipitation over 32 YRB sub-basins with an area in the range of 2000–200 000 km2. In June and July, most sub-basins of the Yangtze had more than their climatological amount of rainfall (Figs. 4a, b). Dry anomalies are only seen near the bend in the Yangtze at 102°E in Yunnan and south Sichuan provinces, and the upper reaches of YRB in the Tibetan Plateau in June (where climatological rainfall is comparatively smaller). Several sub-basins show >20 year return times, and many show >5 year return times, consistent with the historical context (Section 3.2). Some sub-basins had anomalously high rainfall in both months: south of the Yangtze between 104°–112°E (in Guizhou and Hunan provinces) and over the main stem of the Yangtze between 108°–112°E (south Hubei and north Hunan—close to and upstream of Wuhan). Also, the sub-basins close to the mouth of the Yangtze had high rainfall in both months, potentially compounding the impacts of all the upstream rainfall. Figure4. June and July 2020 monthly precipitation anomalies (a and b) and return times (c and d) for 32 YRB sub-basins. The main course of the Yangtze River (thick black line) and the largest tributaries (thin black lines) are shown.
2
4.1. Anomalous lack of northward migration of the EASMF
The long-lasting nature of heavy rainfall over the YRB in June and July 2020 is illustrated in Fig. 5, which displays daily mean rainfall for each dekad (10-day period) during these two months. There is an intense frontal rainband affecting central-eastern China in most of the dekads considered. The mei-yu frontal rainband normally forms in mid-June at around 28°N and rapidly progresses northward, crossing the Yangtze River and reaching around 32°N by early July and then weakening substantially. Thus, it is mainly in the last dekad of June that central-eastern China experiences mei-yu-related heavy rainfall, as this sharp and intense frontal rainband moves over the region, with widespread climatological mean rain values exceeding 12 mm d?1 (Volonté et al., 2021). In 2020, the mei-yu rainband persisted over central-eastern China for more than a month (four dekads, from the second in June to the second in July). This behaviour is associated with an anomalous lack of northward migration of the EASM. While the climatological EASMF moves from 30°?32°N to above 36°N between the first half of June and the end of July, in 2020 the EASMF does not progress northward in this period. Being located at around 33°N at the beginning of June and end of July, the EASMF even moves temporarily south to around 31°N during the first dekad of July. Figure5. Dekadal (10-day) means of June–July 2020 IMERG daily precipitation (shading, mm). The magenta line indicates the ERA5 mean dekadal EASMF location at 850 hPa in 2020, while the yellow line refers to the 1979?2018 ERA5 dekadal EASMF climatology.
In terms of rainfall patterns, the first dekad of June is characterized by big clusters with large accumulations in southern China (widespread areas with mean daily rainfall over the dekad beyond 50 mm d?1 and absolute maxima beyond 75 mm d?1). These heavy rainfall clusters are located more than 6° south of the EASMF, a situation typical of pre-mei-yu conditions, with convective heavy rain occurring in a warm-air environment, far from the EASMF and enhanced by South Asian monsoon moisture influx. However, the overall pattern is shifted northward with respect to the pre-mei-yu climatology, as is the EASMF, and the northern edge of the heavy-rainfall area extends up to the middle and lower reaches of the Yangtze River. Thus, the YRB is affected even in these pre-mei-yu-like conditions. During the following dekad, the rainfall is associated with a nearly zonal frontal rainband, located at around 30°N, although with some meridional oscillations between dekads. This mei-yu rainband persists, with variable intensity, from the second dekad of June to the second dekad of July. During this period, the EASMF moves from north of its climatological position to south of it. In all of these dekads, much of the YRB receives mean daily rainfall values exceeding 20 mm d?1, with several localized areas exceeding 30 mm d?1. The rainfall is particularly intense in the 1st dekad of July, where a large part of the middle reach of the Yangtze River (e.g., around Hubei province) experiences amounts beyond 50 mm d?1.
These dekadal amounts indicate a succession of heavy rainfall events, associated with anomalously long-lasting mei-yu conditions, with the footprint of a frontal rainband persisting for over a month in the YRB. To further investigate this anomalous evolution of the mei-yu frontal rainband, two heavy-rainfall events are considered below, representative of the early and late stages of 2020 mei-yu season. The first event occurs at the beginning of the long mei-yu phase while the second one (the most intense of the period under consideration in the lower YRB), takes place towards its end. Therefore, the two events are characterized by the EASMF being, respectively, north and south of its climatological position and also of the Yangtze River, as pointed out in Liu et al. (2020).
2
4.2. Event 1: 12?16 June 2020
Figure 6 contains four maps illustrating the key features of Event 1 that occurred between 12 and 16 June 2020, at the beginning of the four-dekad long period with anomalously long-lasting mei-yu conditions. A clear rain band, predominantly south of the zonal EASMF, is shown in Fig. 6a, with higher amounts just north of the lower reaches of the Yangtze River, at around 115°?120°E and 32°N. Rainfall totals exceed 250 mm in several localized areas, with the absolute maximum near 400 mm (not shown). Figure6. Maps of (a) total event precipitation (shading, mm), (b) geopotential height at 500 hPa (shading, dam), wind vectors at 850 hPa (arrows, m s?1), potential vorticity at 250 hPa (blue contour, 2 PVU) and mean sea level pressure (black contour, 1015 hPa), (c) 500?1000 hPa IVT (shading, kg m?1 s?1) and IWV (brown, red and orange lines indicating 52, 58 and 64 kg m?2, respectively), wind vectors at 850 hPa (arrows, m s?1) and wind speed at 200 hPa (green contours, every 10 m s?1 from 30 m s?1), (d) anomalies at 850 hPa of θe (shading, K) and wind vectors (arrows, m s?1). The magenta line indicates the mean 5-day location of the EASMF at 850 hPa. All quantities in panels (b)?(d) are averaged over Event 1 (12?16 June 2020) and the anomalies in panel (d) are evaluated against 1979?2018 climatology for the same days. All data from ERA5, apart from precipitation (IMERG).
Figure 6b highlights that the EASMF is co-located with the boundary between tropical and mid-latitude air masses at middle and upper levels. This is indicated by the steep gradient in geopotential height at 500 hPa, enhanced by the presence of a trough north of Japan, and by the presence of the 2-PVU line just north of the front. The western North Pacific subtropical high (WNPSH), indicated by a geopotential height relative maximum extending west from the ocean to eastern China, is located just south of the front, helping to steer tropical southerlies towards it. The low-level (850 hPa) flow (Figs. 6b and 6c) shows a similar pattern of air-mass convergence at the front. Tropical air reaching the front from the south originates in the South Asian monsoon area, with southwesterlies flowing all the way from the Bay of Bengal, and anticyclonic flow from the West Pacific, on the western side of the WNPSH. Mid-latitude northwesterlies flow towards the northern side of the front as they move cyclonically around the trough already mentioned. This flow pattern, at lower and upper levels, is compatible with the strong sub-tropical westerly jet (STWJ) displayed in Fig. 6c. The southern edge of this nearly zonal jet is located directly above the EASMF, and close to the low-level wind convergence zone, with a local upper-level wind speed maximum exceeding 50 m s?1 between northern China and the Korean peninsula.
The advection of moisture from the South Asian monsoon towards the EASMF is illustrated in Fig. 6c. Moisture transport (IVT) is high over China and increases towards the EASMF in the Yangtze River region. Strong westerlies lead to substantially higher values over the ocean south of Japan. The moisture content (IWV) maximum is located over land near the Yangtze River, just south of the EASMF. Here, the IWV exceeds 58 kg m?2, a value surpassed only in the Bay of Bengal and in a small area close to the Gulf of Tonkin. This indicates that the air advected towards the EASMF by the southerlies and southwesterlies retains an amount of moisture typical of South Asian monsoon air masses.
The anomalies in low-level flow and thermodynamics are highlighted in Fig. 6d. Positive anomalies of θe exceeding 15 K are centered over the Yangtze River. The northern edge of these anomalies coincides with the EASMF, consistent with an anomalously northern EASMF location and enhancement of the warm advection associated with a stronger-than-normal STWJ (Sampe and Xie, 2010). On the northern side of the front, θe anomalies are instead weakly negative, indicating that the meridional frontal θe gradient is substantially larger than climatology, again consistent with a strong STWJ. The anomalously steep frontal gradient is associated with stronger-than-normal flow towards the front on both sides, highlighting the enhanced convergence between different air masses at the root of this heavy-rainfall event.
The vertical cross-section in Fig. 7 contains the key features of the heavy-rainfall event. The sharp front is clearly visible, particularly in the lower half of the troposphere. The strong STWJ above the slanted upper part of the front and the decrease in height of the dynamical tropopause (2-PVU line) also delineate the boundary between tropical and mid-latitude air. Focusing on the low levels, the high values of moisture flux associated with the southerly winds and the θe maximum close to the surface highlights the advection of warm and moist air of South Asian monsoon origin to the EASMF. The northwesterly intrusion of cooler mid-latitude air on the northern side of the front occurs between 700?800 hPa (see the 320-K line). The dynamics is associated with heavy frontal rain (whereas rain is absent over southern China) and deep convection, indicated by the presence of convective clouds (see 80% relative humidity line) at the frontal surface.
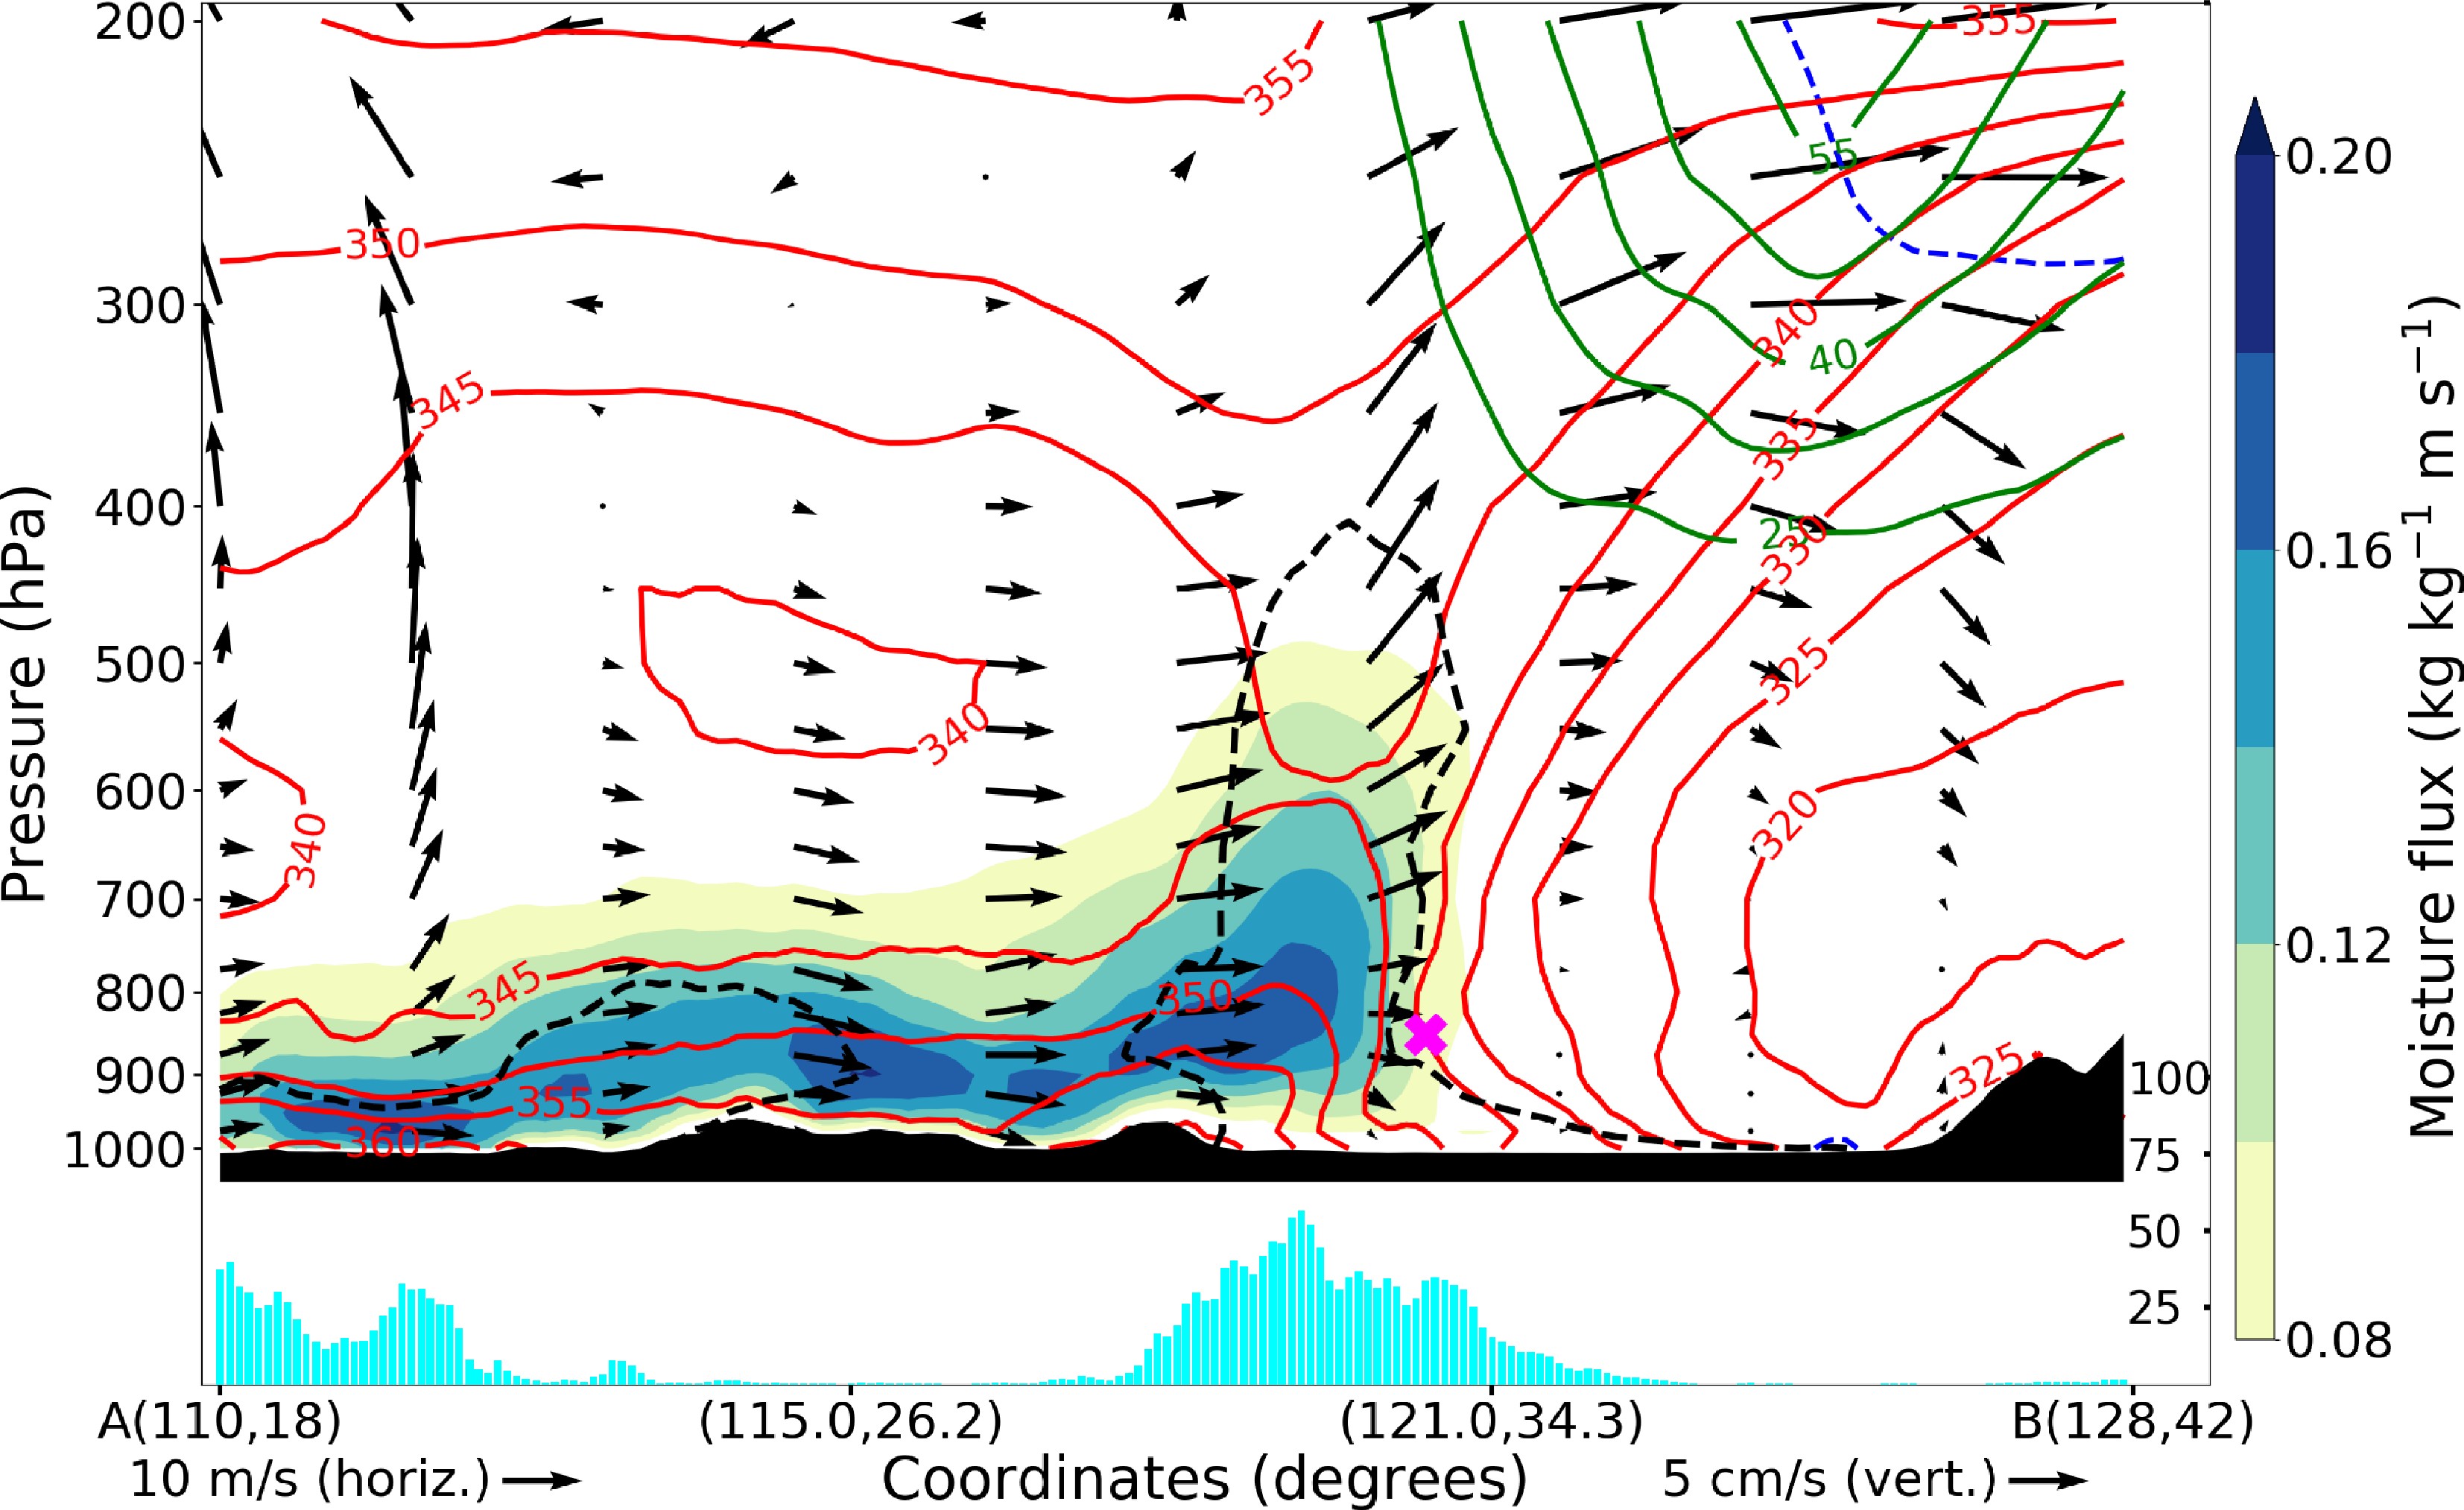 Figure7. Cross-sections, transect AB in Fig. 6, of moisture flux (shading, kg kg?1 m s?1), wind speed (green contours, every 7.5 m s?1 up from 25 m s?1), equivalent potential temperature (red contours, every 5 K), wind vectors (arrows, m s?1, computed using the horizontal wind parallel to the section as horizontal component and the vertical velocity multiplied by 200 as vertical component, consistent with the aspect ratio), relative humidity (black dashed contour, 80%), potential vorticity (blue dashed contour, 2 PVU) and daily precipitation (cyan bars, mm). The magenta “x” indicates the location of the EASMF at 850 hPa according to the detection algorithm. All quantities are averaged over Event 1 (12?16 June 2020). All data from ERA5, apart from precipitation (IMERG).
2
4.3. Event 2: 4?8 July 2020
The other heavy-rainfall event analyzed in this section occurred between 4 and 8 July 2020, 20 days after the first event and towards the end of the four-dekad long period of anomalous absence of northward migration of the EASMF, in which it persisted over central-eastern China.Figure 8 (same as Figure 6 but for Event 2) illustrates the key elements of the heavy rainfall event. The rainfall amounts in this event reach very large values (Fig. 8a), larger than in Event 1 (Fig. 6a), with most of the middle reaches of the Yangtze River receiving over 250 mm, and in large areas beyond 400 mm. This event occurs later in the season, when mid-latitude air has generally moved poleward. This can be seen by the extent of the blue contours in Fig. 8b, which is smaller than in Fig. 6b. However, a deep trough is present, centered between northern China and Japan, causing a southward displacement of the overall regional flow structure and of the associated rainfall, with maxima around 2°?3° further south than in Event 1. The tropical-extratropical airmass boundary has shifted equatorward in this region, with respect to the first event. A long and narrow high-PV filament, just north of the EASMF, indicates the southward intrusion of mid-latitude air associated with the upper-level trough. As a result, the WNPSH is displaced to the northeast, with the maxima in geopotential height and sea-level pressure located approximately 20°E of Japan. Figure 8c shows that in this case, the STWJ is less intense and far from zonal, as it displays a clear southward displacement around the Yellow Sea. This puts the southern edge of the STWJ over the EASMF located close to 30°N, approximately 2°?3° further south than during Event 1.
 Figure8. As in Fig. 6 but for Event 2 (4?8 July 2020).
In terms of moisture advection, a clear IVT maximum is present near Japan and high IVT values are visible also over China just south of the front. In this same area there is also a large IWV maximum, this time exceeding even 64 kg m?2. This indicates a moisture content approximately at the same level of the South Asian monsoon maximum (see the north edge of the Bay of Bengal). The anomalies associated with this event reflect the different circulations associated with it. The anticyclonic anomaly lies east of Japan, where the WNPSH is displaced, together with an associated θe dipole. Warm and cold anomalies are present just south and north of the EASMF, respectively, in both cases up to 6?9 K of magnitude. These θe anomalies are associated with westerly and northerly wind anomalies, respectively. This indicates a clear role of the equatorward advection of cool air and a less intrusive southerly warm-air advection in this event.
The vertical cross-section in Fig. 9 highlights the key features of Event 2 and shows some differences with respect to the equivalent cross-section for Event 1 (Fig. 7). In this case the STWJ is considerably tighter and less intense, reflecting a more advanced time in the season. However, the EASMF is located more to the south, as the intrusion of mid-latitude air (albeit with slightly higher θe values) is more extended. The dynamical tropopause shows a visible fold just north of its descent, marking the tropical/mid-latitude boundary and also indicating the presence of a PV streamer (Appenzeller and Davies, 1992). This setup, together with the low-level convergence of warm and moist monsoon air with continental mid-latitude air, is conducive to intense and long-lasting convective rain. This is indicated by the deep convective cloud co-located with the front and the upward pointing wind vectors, and in the co-located rainfall footprint that is more intense than in Event 1.
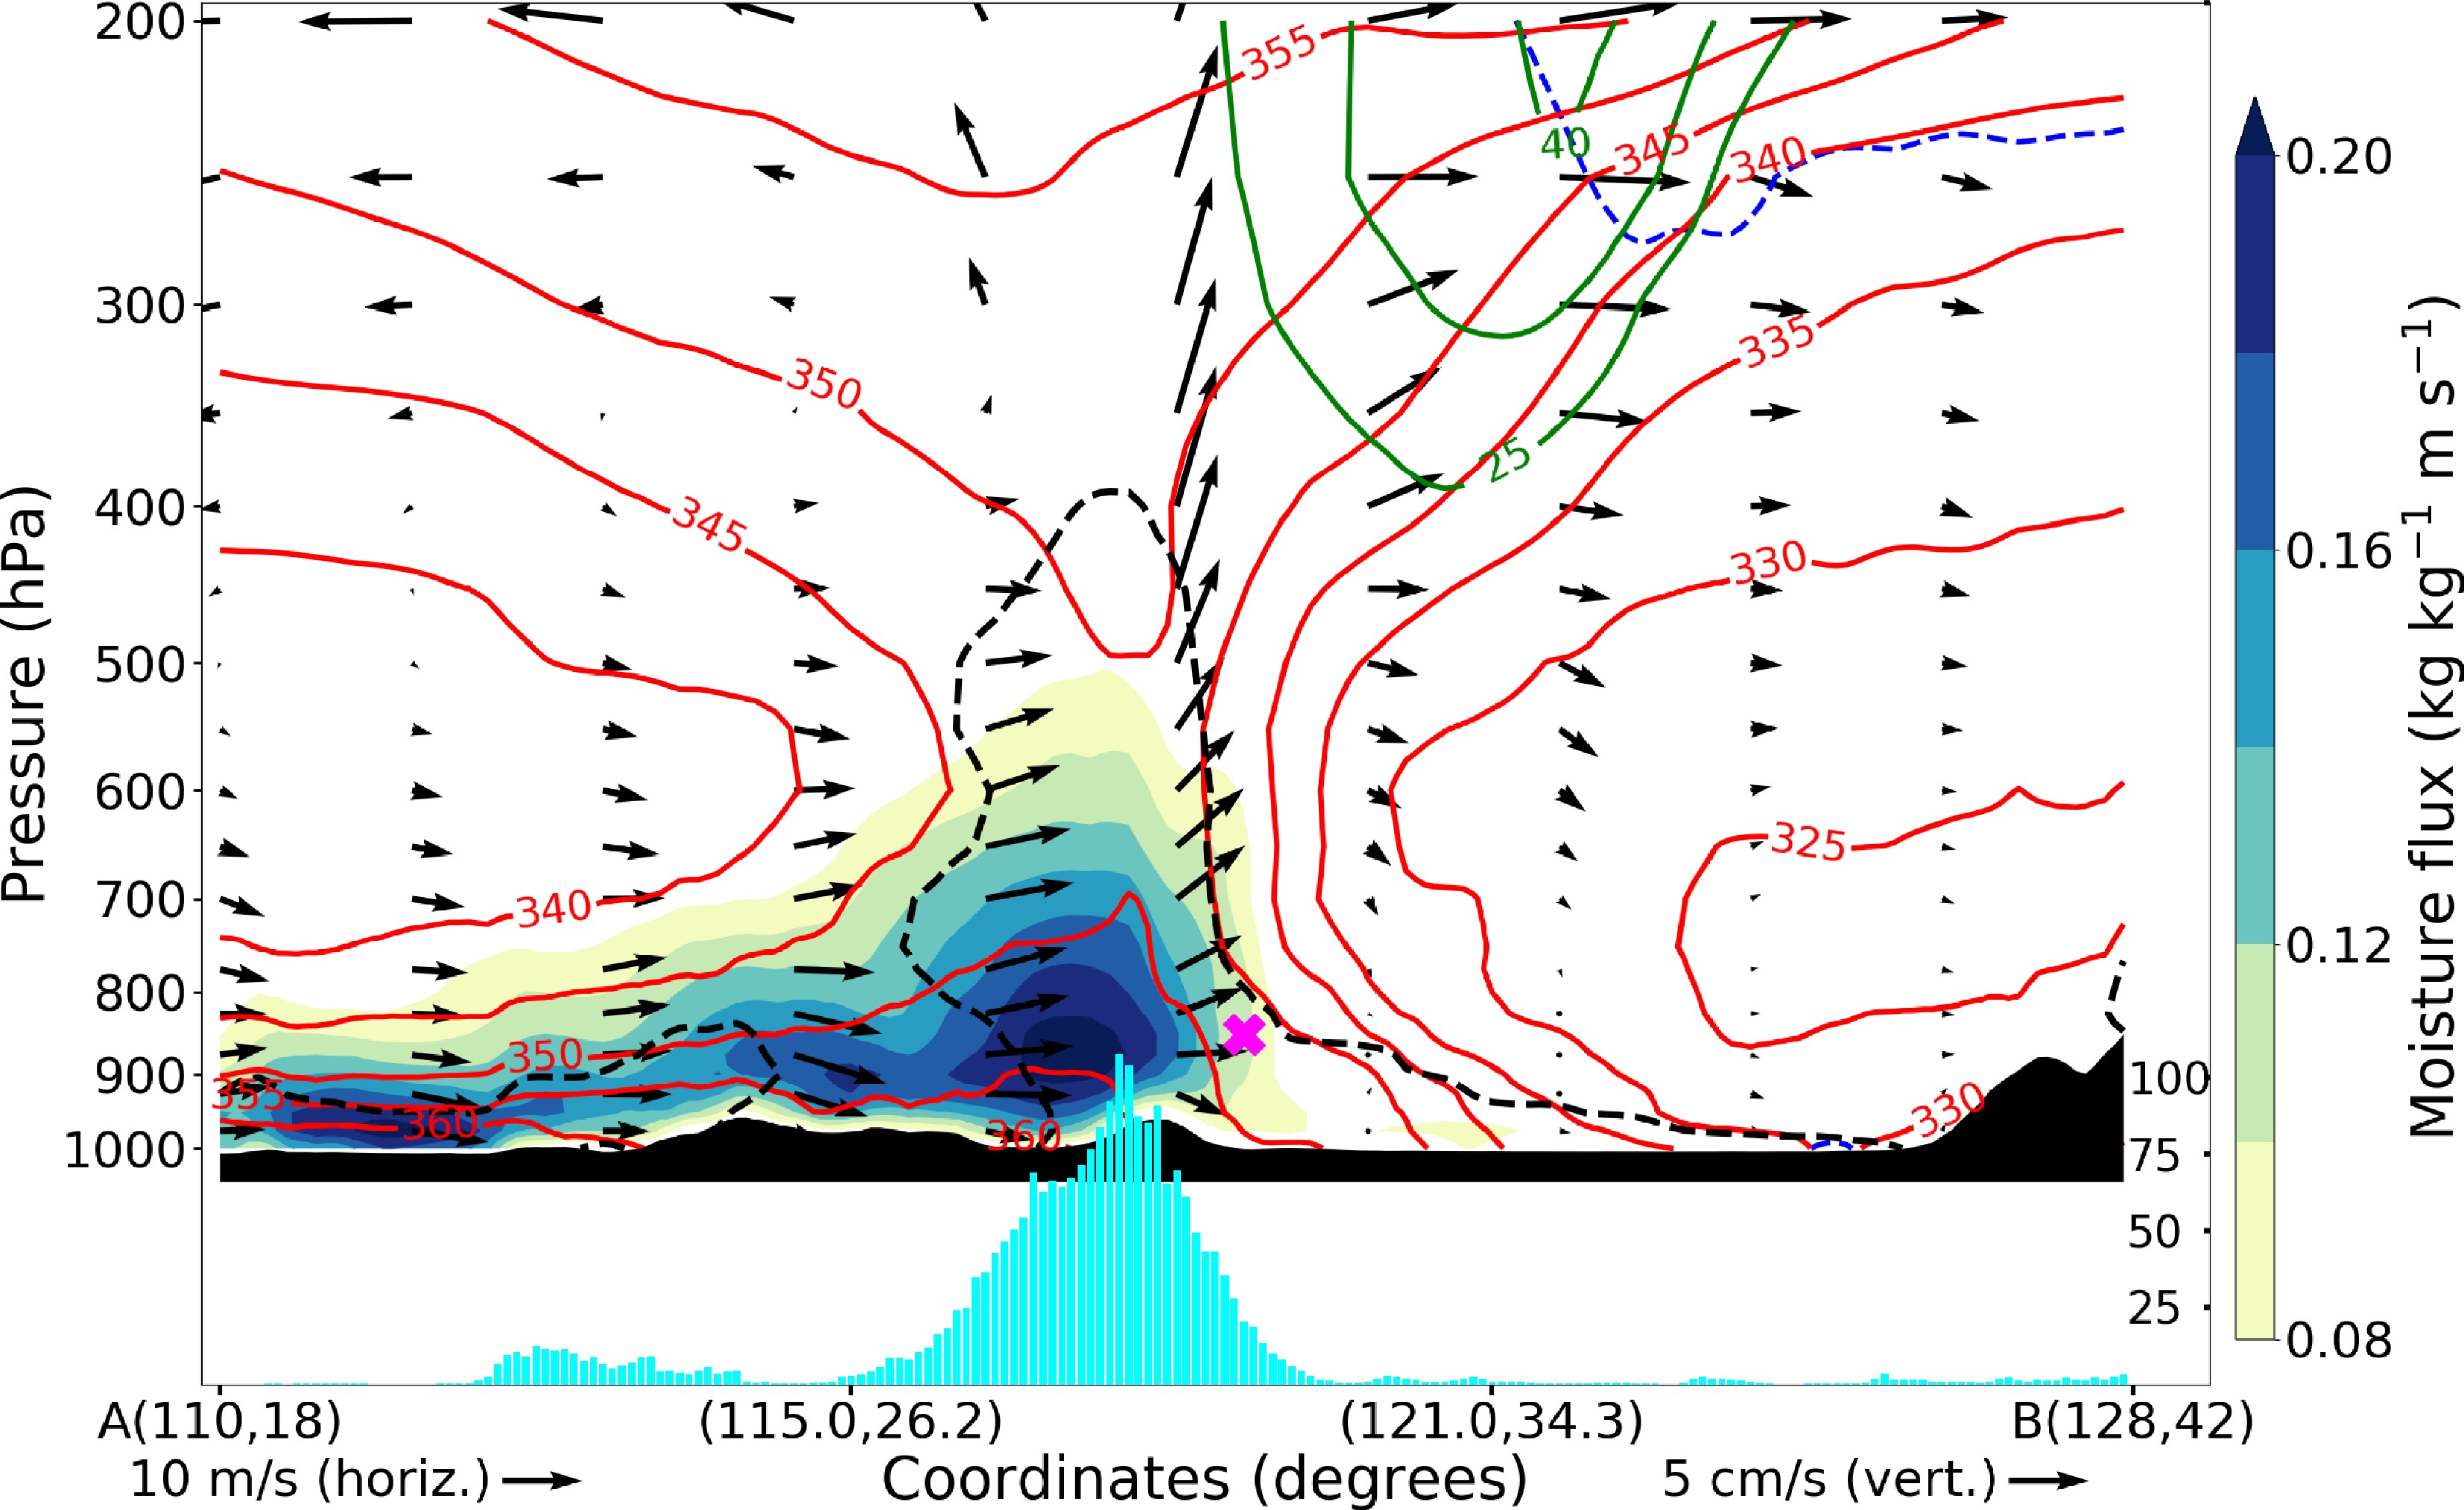 Figure9. As in Fig. 7 but for Event 2 (4?8 July 2020).
2
4.4. Trajectory analysis for both events
Backward Lagrangian trajectories (144 hours), starting from the selected box at 0000UTC on the indicated date, were calculated. The trajectories start from the 25 max and min θe points between 700 hPa and 850 hPa in a domain centered on the EASMF and over the area of daily largest rainfall. The purpose of this design is to reveal the origins and paths of the air masses, tropical and extratropical, interacting at the EASMF. Therefore, ERA5 input data is regridded to a 0.5°-horizontal grid to reduce noise and provide a clearer general picture. The paths of these backward trajectories, starting during the most intense phases of the two events, are shown in the two top panels of Fig. 10, while the bottom panels highlight the time evolution of pressure and specific humidity along the trajectories. Figure10. (a, b): Lagrangian trajectories, starting at 00 UTC on (a) 15 June 2020, (b) 7 July 2020 and computed backward for 144 hours. The trajectories’ starting points are selected by taking the 25 max and min θe points (red and blue dots, respectively) between 700?850 hPa in the selection domain (black box) at start time.The selection domain is chosen as 32°?34.5°N, 117.5°?122.5°E for Event 1 and 29.5°?32°N,115°?120°E for Event 2, consistent with EASMF location on the respective dates. Colour shading indicates the equivalent potential temperature of trajectories at each position. (c, d): Time profiles of pressure for the trajectories of (c) Event 1 and (d) Event 2, as shown in (a) and (b), respectively. Colour shading indicates specific humidity. Data from ERA5, regridded to a 0.5°-horizontal grid.
There is a clear separation between the values of equivalent potential temperature and of specific humidity of the different air masses. Tropical airstreams are characterized by high equivalent potential temperature (red trajectories) and specific humidity (green profiles), while those values are substantially lower for the extratropical airstreams (blue trajectories and yellow-brown profiles). In both events, and particularly in the second, the convergence of the two airstreams towards the EASMF is clear. Warm air travels at low levels, flowing from equatorial regions and retaining high values of specific humidity up to its arrival at the YRB, consistent with the maxima of moisture content and transport in the region, as shown in sections 4.2 and 4.3. The warm flow originates over the Maritime Continent in Event 1, while in Event 2 it travels for longer distances as it flows from the Indian Ocean. In contrast, the cooler airstream is of continental origin, as it travels from Central Asia and stays to the north of the Tibetan Plateau. In Event 1, the cool flow is formed by mid-level air traveling from WNW, gradually converging and then turning south while approaching the EASMF area. However, in Event 2 the meridional component of the cool flow is more intense, and associated with stronger descent from mid- and high-tropospheric heights. This is consistent with the presence of a sharp trough in the region and an enhanced intrusion of low-θe air, as illustrated in section 4.3, that in this wavier STWJ setting travels all the way to the EASMF, located further south than in Event 1.
We used a recently developed algorithm detecting the daily position of the EASMF to highlight the anomalous lack of northward progression of the EASMF during June and July 2020. This situation, with the front located at 33°N both at the beginning of June and at the end of July, led to prolonged mei-yu conditions, lasting more than one month, associated with the anomalously high YRB precipitation, caused by repeated heavy-rainfall events occurring in the same regions. We selected two of those events, 12?16 June (Event 1) and 4?8 July 2020 (Event 2), for the analysis of the underpinning dynamics, employing Lagrangian trajectory analysis to study the convergence of air masses at the EASMF.
Event 1 was characterized by a higher-than-normal EASMF latitude, accompanied by anomalously warm advection on its southern side. This was associated with a strong and zonal STWJ in the region, enhancing the strength of the front and the low-level convergence from both sides. Event 2, the most intense heavy-rainfall episode in the period examined, occurred later in the season. However, the EASMF, instead of progressing northward, was found at a lower latitude than in Event 1. The regional flow was characterized by the STWJ displaying a clear trough over East Asia and a northeasterly displaced WNPSH, leading to anomalously cool advection on the north side of the front. In fact, in Event 2 the midlatitude airstream was more intrusive with a more important meridional component. Thus, both events displayed heavy precipitation and the convergence of (warm and moist) monsoonal and (cool and dry) extratropical air masses, originating respectively from the Indian Ocean - Maritime Continent and over central Asia. Nonetheless, clear differences were identified in the location, strength, and waviness of the STWJ and the location of the WNPSH, which were shown to be instrumental in the relative balance between low-level airmass advection at both sides of the steep EASM front. It is thus clear that the regional upper-level flow has a primary role in the occurrence of anomalous mei-yu seasons, in terms of location, duration and associated rainfall amount. Hence, these results confirm and clarify those in Liu et al. (2020) and in Ding et al. (2021), which highlighted the influence of NAO pattern and of WNPSH placement, along with the low-level southwesterly jet, in 2020 mei-yu front evolution and associated rainfall. These findings also confirm the validity of the framework presented in Volonté et al. (2021), providing an application to extreme rainfall events.
Some ways of extending this work naturally present themselves. Here we have chosen to focus on the discharge from the entire YRB, but a more fine-grained approach would be possible. This could provide important insights into how river flows were affected by localized rainfall patterns, possibly considering dams and barrages on the river. This could potentially complement the sub-basin analysis done in section 3.3. Concerning the dynamical characterization of the events, this work could be extended by looking at both smaller and larger scales. On one hand, it would be worth assessing the effect of EASMF airmass convergence on the long-lasting deep convection seen at the front in the two episodes, expanding on studies such as Guan et al. (2020), that analyze mei-yu rainfall corridors and their links with the low-level moist southwesterly flow. On the other, we would aim to further understand the link between upper-level jet patterns conducive to extreme rainfall over East Asia and the large-scale circulation with its main modes of variability, expanding on the results from Liu et al. (2020). A comprehensive understanding of the dynamics of mei-yu heavy rainfall events and of their links to EASMF progression would then be beneficial for assessing their predictability, an issue of primary importance given the high impact associated with these events.
Acknowledgements. AV, MM, RS, AGT and NPK were supported by the COSMIC project through the Met Office Climate Science for Service Partnership (CSSP) China as part of the Newton Fund, contract number P106301. NPK was supported by a Natural Environmental Research Council (NERC) Independent Research Fellowship (NE/L010976/1) and by the ACREW programme of the National Centre for Atmospheric Science. We thank Omar V. MüLLER for help with GloFAS-ERA5.
Author contributions—RS: Abstract and Introduction; AV: Data and Methods, Section 4, and Conclusions; MM: Data and Methods, Section 3 and Conclusions; all: feedback on the manuscript. All authors contributed to the conception and design of the analysis, which was carried out by AV, MM and RS.
Open Access This article is distributed under the terms of the Creative Commons Attribution 4.0 International License (
